

Abstract
Cognitive abilities, particularly memory formation, vary substantially in the elderly, with some individuals exhibiting dramatic decline with age while others maintain function well into late life. Epigenetic modifications suggest an intriguing mechanism to account for the range of cognitive outcomes in aging as they are responsive to environmental influences and affect gene transcription in cognitively relevant brain regions. Leveraging a well-characterized rat model of neurocognitive aging that recapitulates the range of outcomes seen in humans, we previously identified gene expression profiles in the CA3 subregion of the hippocampus that distinguish between young and aged subjects as well as between impaired and preserved spatial memory function. To investigate the influence of epigenetics on these profiles, we examined genomic CpG DNA methylation in the promoter regions of three neurophysiologically relevant genes (Gabra5, Hspa5 and Syn1) whose expression levels decrease with age and correlate with spatial memory performance. Consistent with mRNA decreases, DNA methylation increased in aged rats relative to young in CpG dense regions of all target promoters examined. However, no correlation with cognition was found. Focused analysis of the Gabra5 gene found that methylation changes were limited to the CpG island and varied substantially across individual CpGs. Methylation at one CpG correlated with learning and demonstrated a significant difference between memory impaired aged rats and those with intact learning. These data provide evidence that broad age-dependent DNA methylation changes occur in CpG dense promoter regions of cognitively relevant genes but suggest that methylation at single CpGs may be more pertinent to individual cognitive differences.
Keywords: spatial memory, CA3 subfield, cognition, gene expression, hippocampus
Introduction
In older humans, deterioration of medial temporal lobe dependent memory function occurs in a large segment of the population and confers significant risk for development of Alzheimer disease. However, the presence of many elderly individuals with intact memory performance, even at quite old ages, demonstrates the existence of differential cognitive aging trajectories. Epigenetic modifications provide likely candidates to modulate cognitive aging outcomes as both genetic and non-genetic factors impact cognitive status in the elderly.1 Several epigenetic modifications such as histone acetylation and genomic DNA methylation play important roles in regulating gene expression during memory formation in multiple brain regions and show modulation by many types of environmental interventions.2 Accumulated across the lifespan, such events could have a profound impact on individual variability in aging.
Over many years, our laboratory has developed and characterized a unique rodent model of neurocognitive aging in which old rats display a range of outcomes in a medial temporal lobe dependent spatial memory task with some aged subjects performing within the range of young and others performing worse than young.3,4 Studies using this model have differentiated chronological age-dependent alterations from cognition-dependent ones, identifying several neurophysiological features of memory impairment similar to those found in non-demented aged humans.4,5 Recent gene expression studies of the hippocampus, a key component of the medial temporal lobe memory system, identified a prominent signature of age- and cognition-related expression changes in the CA3 hippocampal subfield. Such expression profiles are informative as to the underlying cellular deficits that engender neurophysiological phenotypes associated with cognitive decline. Expression profiles in the aged CA3 identified pronounced decreases in genes associated with inhibitory mechanisms, synaptic transmission and protein homeostasis in the aged cohorts. These changes are consistent with increased firing rates of CA3 place cells,6 synaptic deficits7 and the accumulation of protein damage8 identified in the hippocampus using the same rodent model.
Although alterations in mRNA levels can be accomplished through a variety of mechanisms, regulation at the transcriptional level remains the primary means of control for many genes. Epigenetic factors regulate the accessibility of genomic DNA to transcriptional activators and thus provide the first determinate for expression. Genomic DNA methylation, as a direct covalent modification of CpG dinucleotides provides a stable epigenetic mechanism for differential gene expression. Precise effects of methylation vary with context, but are typically associated with repressed transcription when found in transcriptional control regions. Conversely, unmethylated, high-density regions of CpG dinucleotides, referred to as CpG islands, are associated with active or accessible genes when located in gene promoters. Substantial differences in DNA methylation signatures have been found across different brain regions, highlighting a role for DNA methylation in establishing and maintaining region specific gene expression profiles.9,10
Aging has been shown to influence the levels of total DNA methylation as well as methylation at specific genes in a variety of tissues including brain.11-13 Despite indications that overall methylation decreases with age, CpG islands tend to accumulate methylation with age.11,14,15 Investigators using high throughput techniques have looked for associations of gene specific methylation changes with cognition or neurodegenerative disease, but sparse coverage of CpG dinucleotides as well as lack of specificity in gene targeting may obscure potentially important associations between DNA methylation and cognitive phenotype.10,12,16
Here, we investigate the possibility that epigenetic mechanisms play a role in age-related gene expression changes by examining the sequence features of genes with confirmed age-related expression changes. Based on our previous molecular profiling data sets, we focused on the CA3 subfield of the hippocampus, a region that is central to the impaired spatial memory phenotype of aged rats.6,17 CpG islands were identified within the transcriptional control regions of a number of genes with decreased expression in the CA3 data set. In preliminary analyses we examined DNA methylation in the CpG islands of three genes, Gabra5, Hspa5 and Syn1, which exemplify select neurophysiological phenotypes of cognitive aging and show robust and reproducible age-related gene expression decline as well as correlation with spatial memory performance. Further experiments focused on the Gabra5 gene because of its unique, largely hippocampal expression pattern and the important role for the GABA-A α5 receptor in maintaining excitatory-inhibitory balance, which has been shown to play a central role in age-related cognitive deficits in both rodents and humans.17,18
Results
mRNA expression is decreased with age in target genes
We investigated the promoter methylation patterns of Gabra5, Hspa5 and Syn1, each of which show reduced expression in the CA3 subregion of aged rats relative to young and which exemplify categories of gene changes corresponding to known neurophysiological features of the aged hippocampus, such as impaired excitatory-inhibitory balance (Gabra5), impaired protein quality control (Hspa5) and synaptic deficits (Syn1). All three genes were identified in a microarray analysis of the hippocampal subfields in cognitively characterized aged and young Long Evans rats.5 mRNA levels of each gene exhibited reproducible, significant decreases in mRNA expression with age (see ref. 5 and Fig. 1). We confirmed the microarray-detected expression changes in two of the chosen genes, Gabra5 and Hspa5, via in situ hybridization (Fig. 1A and B) and the third gene, Syn1, was interrogated by two independent microarray probe sets that exhibited nearly identical results (Fig. 1C). These data provide a basis for examining genomic DNA features that may contribute to the reduced mRNA levels of these genes.

Figure 1. Gene expression decreases of select genes in the CA3 subregion of the hippocampus. In situ hybridization quantification results of (A) Gabra5 and (B) Hspa5 for young (Y) and aged rats (Gabra5: n = 5Y, 11 Aged; Hspa5, n = 4Y, 11 Aged). (C) Microarray data from two independent Syn1 probe sets PS1, PS2 (n = 9Y, 14Aged). Error bars represent SEM *, p < 0.05; Student’s t-test; **, uncorrected p < 0.0001 (significance analysis in microarray) and meeting a FDR < 0.05. In situ hybridization results for Gabra5 and Hspa5 were noted in reference 5 and Syn1 data were derived from microarray experiments described in Haberman et al.5
CpG islands of target genes are unmethylated in young rats
All three genes contain a CpG island spanning the transcriptional start site. We focused attention on these islands as we would expect them to be unmethylated in young subjects yet contain many potential sites for age-related increases in methylation that may impair gene expression. Figure 2A-C (left) shows the genomic structure of Gabra5, Hspa5 and Syn1 including the location of the CpG islands relative to the transcriptional start site and the initial exons. Methylation status of the CpG islands was assessed using quantitative methyl specific PCR (MSP) of bisulfite treated genomic DNA isolated from dissected CA3 tissue. This technique distinguishes between methylated and unmethylated cytosines based on differential conversion of unmethylated, but not methylated, cytosines to thymidine with bisulfite treatment.

Figure 2. CpG islands span transcriptional start sites of all three downregulated genes. Schematic of (A) Gabra5, (B) Hspa5 and (C) Syn1 promoters and CpG islands (left). The graph to the right of each schematic shows the amplification level using methylation sensitive (meth) and unmethylated sensitive (unmeth) primers relative to Actb in young subjects (n = 8). Primers directed toward unmethylated sequences amplify far more efficiently than methylated primers confirming that, in young subjects, the CpG islands remain mostly unmethylated consistent with the moderately high expression levels of these genes. Error bars represent SEM. Tss, transcriptional start site; numbers indicate nucleotide distance from TSS. Msp indicates location of methyl-specific PCR primers.
In young rats, quantitative PCR using primer pairs directed to unmethylated CpGs of the CpG island produced a robust signal while primers directed to methylated DNA produced a very weak or absent signal for all three genes (Fig. 2A-C, right), in agreement with existing data that CpG islands within active promoters are largely unmethylated.19,20 Control genomic DNA treated with a bacterial DNA methylase to increase global methylation prior to bisulfite treatment produced a robust signal with methyl-directed primers approximately equivalent to that derived from unmethylated primers, eliminating primer design and technical concerns as a cause of reduced signal from methyl-directed primers in untreated DNA (data not shown). These results indicate that in young rats, the CpG islands of Gabra5, Hspa5 and Syn1 are largely unmethylated, consistent with relatively high levels of expression observed for these genes in the CA3 subregion.
Quantitative MSP indicates increased CpG island methylation with age
To assess the relationship between age-dependent gene expression changes and methylation we extended our analysis to CA3 genomic DNA from aged rats. All rats (young and aged) were behaviorally characterized on a standardized spatial water maze task. Performance is dependent upon the intact function of the hippocampus and is quantified using Learning Index (LI), a robust measure based on performance across multiple probe trials interpolated during training (see methods and ref. 3). On average, aged rats perform more poorly than young (as indicated by higher LI scores; Fig. 3A, p < 0.01), but show a distribution of scores in which some aged subjects perform within the range of young rats. In the initial studies we consider the aged rats as a single group; however, in additional analyses, LI is used as a continuous measure to describe behavioral performance as well as to stratify rats into two groups: aged subjects with preserved spatial memory (AU, aged unimpaired, LI < 240) and aged rats with poorer spatial memory (AI, aged impaired, LI > 240). Figure 3A depicts the behavioral data of the subjects used in these experiments and are representative of cohorts tested over a number of years.3,5,21

Figure 3. (A) Learning index distribution of individual aged (red squares, n = 14) and young (gray diamonds, n = 8) subjects used in methylation assessment. Higher numbers indicate poorer performance on water maze task. Black horizontal lines indicate average values. Aged subjects on average perform worse than young (p < 0.01) but with a range of values such that some aged rats perform on par with young. Quantitative methyl-specific PCR using unmethylated primers directed to CpG islands in (B) Gabra5, (C) Hspa5 and (D) Syn1. Decreased amplification in aged subjects relative to young indicates increased methylation. Error bars represent SEM *p = 0.052, **p < 0.05, ***p < 0.02.
Quantitative MSP for unmethylated DNA found increased methylation (as indicated by decreased amplification) in the CpG islands of aged subjects relative to young in all three genes (Fig. 3 B‒D). This difference was significant for Gabra5 and Hspa5 and showed a very strong trend in Syn1 (p = 0.052). There was no difference in methylation levels between AU and AI rats for any of the genes (p > 0.5 for all genes). Gabra5 showed the most robust change with an approximately 20% increase in methylation while both Hspa5 and Syn1 increased approximately 15% in aged rats relative to young. Since methylation is typically associated with decreased gene expression, these results are consistent with the age-associated decrease in mRNA abundance. Primers targeting the methylated sequences of each gene showed no significant change in methylation in aged subjects. Due to the density of CpGs in the islands of these genes, each methylated primer pair required at least 3 CpGs to be methylated in the same DNA molecule for amplification to occur. Thus primers targeting an unmethylated sequence are more sensitive to sporadic methylation events. As bisulfite sequencing of individual Gabra5 clones demonstrates (see below), methylation of the CpG islands appears to occur in such a pattern.
Expression changes associated with chronological age were some of the most robust found in our microarray analysis and, in many cases, also correlated with water maze performance (as measured by LI), suggesting that relatively small variations in mRNA levels may have a substantive impact on cognitive performance. For all three genes examined in this study, mRNA levels were significantly, inversely correlated with LI across all subjects with correlations marginally significant when aged rats alone were considered (Table 1). The inverse correlation reflects decreased gene expression in subjects with poorer learning (higher LI scores). Unlike gene expression levels, methylation levels were uncorrelated with learning for all subjects as well as for aged subjects alone (Table 1). To more directly test the relationship between mRNA levels and methylation, we performed qPCR for the Gabra5 gene on RNA isolated from a subset of subjects used for methylation analysis. Gabra5 mRNA expression levels inversely correlated with learning index as expected (Pearson r = -0.554; p = 0.032) but were uncorrelated with methylation (Spearman rho = 0.13; p = 0.64). These data indicate that while CpG island methylation increased with age, consistent with an age-related mRNA decrease, the detected methylation changes cannot account completely for altered mRNA levels, particularly in aged rats with preserved water maze performance.
Table 1. Learning index correlations for microarray mRNA and MSP methylation.
| Gene | mRNA (Microarray)1 |
Methylation (MSP-CpG island)2 |
||
|---|---|---|---|---|
| All | Aged | All | Aged | |
|
Gabra5 |
-0.66* |
-0.48# |
-0.34 |
-0.20 |
|
Hspa5 |
-0.66* |
-0.51# |
-0.27 |
-0.34 |
| Syn1 | -0.58* | -0.23 | -0.08 | -0.09 |
p < 0.05; #p < 0.1 Pearson correlation; data from.5 1Pearson correlation r-value between learning index and log2 expression; n = 9 young, 14 aged; 2Spearman rho between learning index and MSP unmeth; n = 8 young, 14 aged for
Gabra5 CpG island shores show no age-dependent methylation changes
Regions adjacent to CpG islands, termed CpG island shores, typically contain CpGs, but at a reduced density from CpG islands. These shores have been particularly implicated as genomic regions of methylation variability across individuals and in tumors.22 We examined the methylation status of the Gabra5 shores both upstream and downstream from the CpG island to determine if the CpG island methylation changes extended beyond the island (Fig. 4) or if these regions distinguished between impaired and preserved cognition. Upstream of the CpG island, methylation sensitive primers exhibited greater amplification than unmethylated primers in young animals (MSP2, Fig. 4B), showing increased methylation in this region relative to the CpG island. Downstream primers exhibited roughly equal amplification between methylated and unmethylated primer sets (MSP3, Fig. 4D), but also indicated greater methylation than the CpG island. When ratios of methylated to unmethylated primer amplification were examined in aged and young rats, no differences were found between any of the age groups in either the upstream or downstream shores (Fig. 4C and E) suggesting that changes in Gabra5 CpG methylation are not universally present in these genomic regions surrounding transcriptional start sites, but appear to be concentrated in CpG islands of aged subjects.
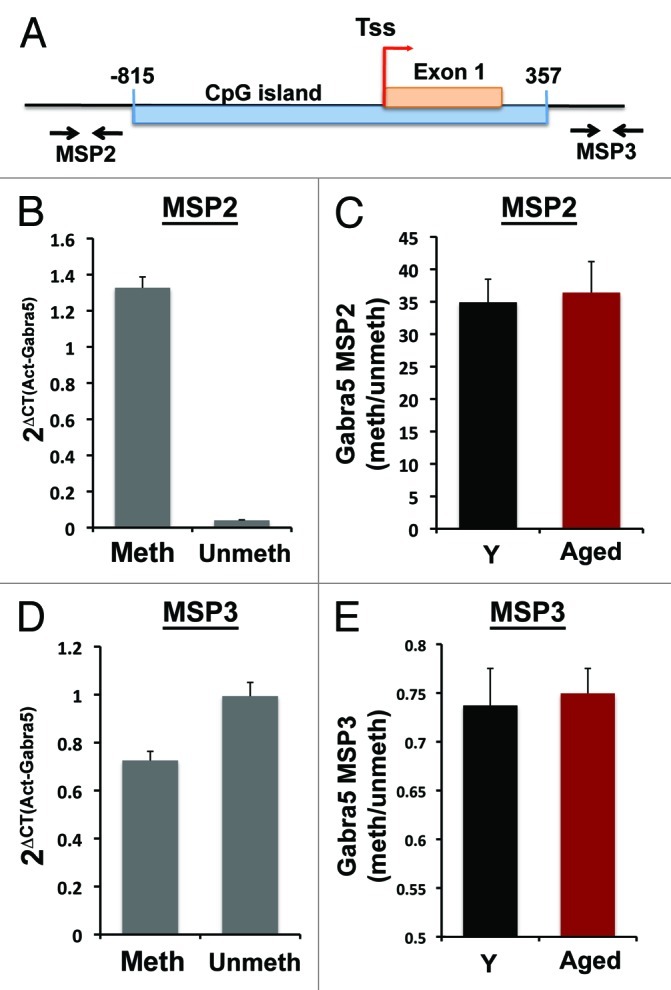
Figure 4. Methylation of Gabra5 CpG island shores. (A) Location of Gabra5 upstream CpG island shore MSP primer set (MSP2) and downstream CpG island shore MSP primer set (MSP3). (B) Amplification with methylated and unmethylated MSP2 primers normalized to Actb indicate high levels of methylation at this site. (C) The ratio of methylated to unmethylated MSP2 amplification does not differ between aged and young rats (p > 0.5) indicating no change in methylation levels with age at this site. (D) Amplification with methylated and unmethylated MSP3 primers normalized to Actb indicate moderate levels of methylation at this site as both methylated and unmethylated primer sets amplify equally. (E) The ratio of methylated to unmethylated MSP3 amplification does not differ between aged and young rats (p > 0.5) indicating no change in methylation levels with age at this site. n = 8 Y and 14 aged; error bars represent SEM.
Bisulfite pyrosequencing of Gabra5 sequences confirms quantitative MSP findings
In an effort to confirm the results obtained from quantitative MSP and to increase the resolution of our analysis, we performed bisulfite pyrosequencing on a portion of the Gabra5 CpG island (Fig. 5 A and B). We were able to obtain quality data for 11 of the 17 CpG sites in this region and found that average methylation across these sites increased significantly in aged rats relative to young (Fig. 5A, p < 0.001) consistent with the quantitative MSP results from unmethylated primers. Average methylation levels were uncorrelated with learning index (Spearman rho = 0.268; p > 0.2) and no significant difference between AU and AI rats (p > 0.15) was found. Methylation levels averaged between 3 and 4% with a 20% increase in aging relative to young. This difference is quite consistent with the level of change detected by quantitative MSP. Thus both methods found a small, but significant increase in Gabra5 CpG island methylation level that was uncorrelated with learning or mRNA levels.

Figure 5. Pyrosequencing results confirm age-related increase in Gabra5 CpG island methylation. (A) Percent methylation averaged across assessed CpGs in a subregion of the Gabra5 CpG island. Aged subjects exhibit significantly more methylation than young subjects (**p < 0.005). (B) Methylation levels at individual CpGs as determined by pyrosequencing. Numbered CpGs correspond to sequence displayed in Figure 6B. (C) Methylation levels of CpG 6 separated according to age and cognitive status illustrates that aged unimpaired (AU) subjects have significantly less methylation than aged impaired (AI) rats (*p < 0.05). n = 8 Y and 13 aged; error bars represent SEM.
Pyrosequencing of 5 CpGs in a Gabra5 shore region upstream from the CpG island likewise confirmed findings from upstream quantitative MSP2 primers. Methylation levels in this region ranged from 20 to 75%, much higher than the CpG island. Average methylation levels in this region did not show a significant difference between young and aged subjects or any difference between aged unimpaired and aged impaired (p > 0.25 for both comparisons).
Methylation analysis of individual CpGs in the Gabra5 CpG island
To better understand the methylation changes at the level of the individual molecule, the same Gabra5 CpG island region was amplified from bisulfite treated DNA and 15 individual clones from each subject were sequenced (Fig. 6). We found that in both young and aged rats methylation appeared to occur in a random, sporadic manner, with only 3 clones (of 330) exhibiting stretches of consecutive methylated CpGs (3 or more). Of the methylated clones, approximately two-thirds (64%) contained only one methylated CpG. This sparse methylation pattern supports the phenomenon of greater sensitivity of the unmethylated primers, relative to methylated primers, in the quantitative MSP analysis. Additionally, sporadic methylation argues against a processive mechanism for the age-related increase in methylation.

Figure 6. (A) Schematic of bisulfite sequencing of individual clones across 17 CpGs of the Gabra5 island for 2 young (Y), 2 aged unimpaired (AU) and 2 aged impaired (AI) rats illustrates the sporadic nature of the methylated CpGs across all subject groups. Open circles represent unmethylated CpGs and black circles represent methylated CpGs. (B) The genomic DNA sequence analyzed in A. with CpGs numbered. This is the same region that was subjected to pyrosequencing.
In examining the Gabra5 pyrosequencing data, it was evident that methylation was distributed unequally across cytosines with some cytosines methylated more often or differentially between young and aged cognitive groups (Fig. 5B). To examine the relationship between the methylation status of a single CpG to that of the others, we generated a correlation matrix for the pyrosequencing data set comparing the percent of methylation at one CpG to each of the others across all subjects (Table 2). After correction for multiple comparisons, only 2 out of 55 correlations were significant (bolded numbers). Thus these data suggest that methylation levels of individual CpGs are largely independent of surrounding CpGs, similar to findings from others.23
Table 2. Spearman rho correlations across Gabra5 CpGs within the CpG island.
| CpG 5 | CpG 6 | CpG 8 | CpG 9 | CpG10 | CpG11 | CpG12 | CpG14 | CpG15 | CpG16 | CpG17 | |
|---|---|---|---|---|---|---|---|---|---|---|---|
|
CpG 5 |
1.000 |
|
|
|
|
|
|
|
|
|
|
|
CpG 6 |
-0.073 |
1.000 |
|
|
|
|
|
|
|
|
|
|
CpG 8 |
0.431 |
0.267 |
1.000 |
|
|
|
|
|
|
|
|
|
CpG 9 |
0.262 |
0.387 |
0.702 |
1.000 |
|
|
|
|
|
|
|
|
CpG 10 |
0.391 |
0.384 |
0.605 |
0.607 |
1.000 |
|
|
|
|
|
|
|
CpG 11 |
0.376 |
-0.003 |
0.390 |
0.367 |
0.709 |
1.000 |
|
|
|
|
|
|
CpG 12 |
-0.019 |
0.309 |
0.188 |
0.174 |
0.457 |
0.540 |
1.000 |
|
|
|
|
|
CpG 14 |
0.499 |
-0.240 |
0.434 |
0.442 |
0.392 |
0.363 |
0.054 |
1.000 |
|
|
|
|
CpG 15 |
0.193 |
0.033 |
0.549 |
0.562 |
0.289 |
0.342 |
0.312 |
0.541 |
1.000 |
|
|
|
CpG 16 |
0.064 |
-0.052 |
0.000 |
0.300 |
0.115 |
0.189 |
0.060 |
0.460 |
0.310 |
1.000 |
|
| CpG 17 | 0.093 | 0.334 | 0.082 | 0.011 | -0.014 | 0.188 | 0.208 | -0.105 | -0.019 | 0.005 | 1.000 |
Bolded correlations meet significance after correction for multiple comparison.
To investigate if methylation at any one CpG was related to cognitive status, we looked for positive correlations between methylation and learning index for each of the 11 Gabra5 island CpGs in the pyrosequencing data set. Only CpG 6 showed a correlation with learning index among the aged rats (Spearman rho = 0.46; uncorrected p = 0.031), but significance did not remain after correction for multiple testing. We asked if the correlation reflected a group difference between aged unimpaired and aged impaired rats for this CpG and found methylation was significantly decreased in aged unimpaired rats relative to aged impaired (Fig. 5C, p < 0.05). We were unable to detect these differences in the bisulfite sequencing of individual clones (as in Fig. 6). However, as the number of sampled clones was far too low to adequately quantify the 3% methylation at this site, this result was not unexpected. Although these data are preliminary, they suggest that methylation at individual cytosines, rather than regional patterns, may be more relevant to conditions that affect behavioral outcomes.
Discussion
DNA methylation and other epigenetic modifications provide attractive mechanisms to explain the influence of a variety of environmental and experiential factors on differential gene expression in the aged brain. In young subjects, behavioral manipulation, low maternal care and diet have produced profound effects on DNA methylation in the hippocampus as well as other brain regions.24-27 Thus, one hypothesis for the divergence of aging transcriptomes from young profiles, as well as the behavioral and transcriptional variability found in older subjects, is the accumulation of experience-dependent epigenetic signatures, such as DNA methylation, on the genome over the lifespan.28-30 Studies in humans and rodents have demonstrated age-related changes in DNA methylation patterns in brain; however, direct support for effects on behaviorally relevant transcriptional signatures has been difficult to acquire.9,12,31
In the experiments described here, we leveraged data from a microarray study to target specific genes associated with age-dependent cognitive decline in order to provide a focused assessment of DNA methylation changes.5 An important feature of our approach is the use of a rodent model that exhibits substantial performance variability within the group of aged animals on a hippocampus dependent spatial memory task. Approximately half of the aged rats perform within the range of young demonstrating preserved cognitive function. With this model we can distinguish chronological age effects from those associated with cognitive decline. Previous work with these rats has shown gene expression profiles of the CA3 subregion of the hippocampus to be particularly useful in distinguishing chronological changes from cognitive ones. The three genes examined here were chosen because they showed robust age-associated declines in gene expression and at the same time, gene expression levels correlated with a stable measure of memory function (learning index). Furthermore, all three genes could be directly related to neurophysiological features of cognitive decline found not only in this rat model but also in humans.
All three genes examined in this work are highly and constitutively expressed in the CA3 region of the hippocampus. The Gabra5 gene was explored more thoroughly than the others because it has greatest direct relevance to CA3 dysfunction and is located in a genomic locus that is highly epigenetically regulated.32 Gabra5 encodes the α5 subunit of the GABAA receptor, a subunit that is highly expressed in the pyramidal neurons of hippocampus and which mediates tonic inhibition in adult rats.33,34 Gabra5 null mice exhibit reduced tonic inhibitory current and CA3 hyperexcitability. Work in our aged rat model has identified increased neuronal excitability in the CA3 of aged subjects with impaired cognition that correlates not only with poorer water maze performance but also with decrements in electrophysiological measures of spatial mapping.6 Importantly, aged humans with amnestic mild cognitive impairment also show hippocampal hyperactivity that has been localized to the CA3/dentate gyrus.18,35 Further, treating cognitively impaired rats with compounds to enhance inhibition improves performance on a spatial memory task17 confirming the detrimental effect of increased excitation. Thus, the age-dependent reduction of GABAA α5 receptor expression in aged rats contributes to a phenotype of impaired CA3 inhibitory function that negatively affects cognitive performance. Increased methylation at the Gabra5 CpG island found in this study suggests a mechanism for the age-dependent decrease in Gabra5 expression and potentially that of other genes associated with age dependent memory impairment.
Syn1 encodes the synaptic vesicle protein, synapsin I, a critical component of the vesicle release pathway. Loss of synapsin I appears to preferentially affect inhibitory neurons and, like Gabra5, produces a phenotype of increased excitability in knockout mice.36,37 Thus, reduced Syn1 gene expression likely contributes to reduced inhibitory drive in the hippocampus.
Hspa5, also known as BiP, is a ubiquitously expressed endoplasmic reticulum chaperone that plays a significant role in the correct folding of cell surface and secreted proteins and is a critical component of the ER stress response. An increase in oxidized protein levels in our model8 and evidence for dysfunction in the ubiquitin-proteasome system in aging and neurodegenerative disease38 supports a significant role for protein homeostasis mechanisms in maintaining functional integrity in aging neurons. Reduced expression Hspa5 limits the ability of neurons to cope with the increased demands on the ER chaperone system that occur with aging and particularly with neurodegenerative disease for which aggregated misfolded proteins are a classic pathological feature.
Using methyl-specific PCR we found an age-related increase in methylation of CpG islands spanning the transcriptional start sites of all three genes described above. Since the methyl-specific PCR primers designed for this study target between two and four CpGs per primer set, we consider this technique a general assessment of the methylation level of the region under study. Pyrosequencing of a portion of the Gabra5 CpG island slightly downstream from the MSP region confirmed the increase in methylation. As both regions of the CpG island showed methylation increases, these data suggest a large portion if not all of the CpG island exhibits increased methylation. The methylation changes seen in our aged subjects were relatively modest (15–20%) but not unexpected since aging effects are often subtle. Although DNA methylation is typically associated with dramatic reduction in gene expression as with highly methylated imprinted genes, incremental increases in DNA methylation have been shown to produce moderate reductions in gene expression in cultured neurons.39 The increase in promoter methylation for these genes is consistent with an age-dependent decrease in gene expression that has been determined by microarray and in situ hybridization in independent sets of animals. However, given the lack of correlation between methylation and either mRNA levels or learning, the effect of this increased methylation is still unclear. Nonetheless, these data provide important evidence linking an increase in DNA methylation with chronological aging in genes that are relevant to cognitive decline.
Quantitative MSP analysis of genomic regions upstream and downstream of the Gabra5 CpG island yielded no differences in methylation between young and old but did detect a higher level of methylation in these regions than in the CpG island, consistent with the results of a large scale analyses of CpG density and methylation levels.9 Pyrosequencing of the same upstream region likewise detected higher overall levels of methylation, but no group difference. These data are different from a recent analysis of Arc genomic methylation in which both promoter sequences and downstream exonic regions demonstrated differential methylation in hippocampal subregions of aged rats.31 The pattern of changes in this study was dependent upon subregion and spatial exploration condition with both increases and decreases occurring in baseline and activity conditions. The diversity of Arc methylation patterns may be a result of the more complex regulation of the Arc gene, since its expression is strongly induced by neural activity, whereas the Gabra5 gene remains primarily constitutively expressed. Additionally, the length of the region under study in the Arc promoter and the density of CpGs are less than in Gabra5 gene, not reaching the standard criteria for a CpG island. Recent data from several groups have determined that moderate density CpG sequences have methylation features distinct from high density CpG islands9,40 and thus may respond differentially to aging.
In addition to confirming the methylation increase in the Gabra5 CpG island, pyrosequencing and bisulfite sequencing of cloned amplicons were used to examine methylation patterns across individual CpGs. The sparseness of methylated CpGs in individual clones suggests that the age-related methylation increase is sporadic and apparently random. Additionally, the limited numbers of correlations between CpGs suggests that methylation at any one CpG is largely independent of the methylation status at any other CpG. Interestingly, Guo et al.23 also noted that changes in CpG methylation in response to neuronal activity were site-specific rather than spanning multiple CpGs within a region. This independence and sparse methylation argues against a processive mechanism for the age-dependent increase in methylation. In vitro studies have found that both Dnmt1 and Dnmt3a, the two DNA methyltransferases expressed in the adult hippocampus,41,42 exhibit processive methyltransferase activity, methylating long stretches of DNA at a time. The sporadic nature of the age-related methylation increases found in this study suggests these enzymes are unlikely sources of the methylation increases. An alternative would be reduced function of the DNA demethylating activity that normally maintains the unmethylated status of active CpG islands. While the nature of such an activity is still unclear, the existence of a mechanism in neurons to rapidly remove methyl groups from cytosines is evident from a number of studies.24,43,44
Methylation of CpG 6 exhibited a different pattern relative to learning index than other individual CpGs and distinguished between aged subjects with impaired behavioral performance from those with preserved performance. The importance of individual CpGs has support in the literature. Meaney and colleagues found that methylation at a single CpG within a transcription factor binding site was critical in the regulation of glucocorticoid receptor (GR) expression decreases in the hippocampus generated by low maternal care.25,26 Methylation at this site inhibited transcription factor binding leading to reduced GR gene expression. Similarly, CpG 6 is contained within an NFkB transcription factor binding site (Phylofoot consite: www.phylofoot.org). Binding of transcription factors may protect such sequences from methylation. Alternatively, binding of transcriptional activators to a priori methylated DNA episomes has been shown in replicating cells to lead to demethylation of those sequences.45,46 Since mRNA abundance can be regulated at many levels, further experiments will be needed to determine whether such mechanisms account for the changes observed in our rats.
Overall these data confirm age-related DNA methylation alterations in cognitively relevant genes that likely contribute to differences in gene expression profiles between aged and young subjects. The lack of correlation between methylation and cognition, for genes in which mRNA expression correlates strongly with cognition, suggests that average methylation levels across a promoter do not adequately predict expression in aged subjects. Rather, our data suggest a more prominent role for individual nucleotides or, possibly, significant contributions from other epigenetic factors not examined in this study. A more detailed mapping of CpG methylation across the entire gene expression regulatory regions and identification of a mechanistic relationship between methylation and mRNA levels will be necessary to confidently determine the role of DNA methylation in regulating age-related gene expression changes.
Methods
Subjects
Aged, male Long-Evans rats were obtained at 8–9 mo of age from Charles River Laboratories and housed in a vivarium at The Johns Hopkins University until 24 mo of age for the present experiments. Additional young male Long Evans rats were purchased from the same vendor (Charles River Laboratories) at 3 mo of age and housed in the same room with aged rats until the end of all experimental procedures. Young and aged rats were behaviorally tested at 4–5 mo and 24 mo respectively (see Behavioral characterization). All rats were individually housed in ventilated, transparent plastic cages. The vivarium is maintained at 25°C on a 12 h light/dark cycle. Food and water were provided ad libitum. Each behavioral testing run included both young and aged rats. All rats included in the study were determined to be healthy as confirmed by pathogen-free status throughout the experiments, screening for disability, as well as by necropsies at the time of sacrifice. All procedures were approved by the institutional animal care and use committee in accordance with the National Institutes of Health directive. Independent groups of animals were used for in situ, microarray and DNA methylation experiments.
Behavioral characterization
Behavioral assessment of memory function in a Morris water maze task was conducted as previously described.3 Briefly, the water maze consisted of a circular pool surrounded by white curtains with black patterns affixed to provide a configuration of spatial cues. Aged (24 mo) and young (4–5 mo) male Long Evans rats were trained for eight days (three trials per day) to locate a camouflaged escape platform that remained at the same location throughout training. Every sixth trial consisted of a probe trial (free swim with no escape platform) for the first 30 sec of the trial after which the platform was raised to its previous location. Probe trials served to assess the development of a spatially localized search for the escape platform. The primary measure used in the spatial learning task was proximity to the escape platform location, a sensitive method for behavioral analysis in this task.47 A learning index was generated from the proximity of the rat to the escape platform during the probe trials and was used to define impairment in the rats. Lower scores reflect better performance as they indicate a search closer to the platform location. Aged rats were categorized based on the normative range of young performance established across years of testing within this paradigm. Those performing as well as young were designated aged unimpaired (AU) whereas those performing worse than young were considered aged impaired (AI). The learning index was also used as a continuous measure for comparison to mRNA and methylation levels. Importantly learning index demonstrates substantial test-retest reliability over time and task48 supporting the notion that this measure reflects a consistent state of hippocampal function. Cue training (visible escape platform) occurred on the last day of training to test for sensorimotor and motivational factors independent of spatial learning. Tissue was collected at least 2 weeks after the last behavioral test day. Independent groups of subjects were used for microarray, in situ and methylation studies. For microarray and in situ experiments, animals were included from several different behavioral testing runs over a 3-mo span. Subjects for the methylation analyses and qPCR were derived from archived samples spanning several years. Each run included aged and young subjects. Animals were selected for inclusion in each group to represent a complete range of performance as indicated by learning index (Fig. 3A). Analysis of variance was used to determine the significance of group differences.
Gene expression analysis
In situ hybridization
In situ hybridization data was described in ref.5 Briefly, probe templates were synthesized de novo by PCR from whole hippocampal RNA and were cloned in pGem7zf+ plasmid or modified to contain SP6 and T7 RNA polymerase binding sites by PCR. HSPA5 primers: left: 5′caggatgcagacattgaagac, right: 5′atccaaggtgaacacacacc; Gabra5 primers: left: 5′gaatctgtcccagctaggac, right: 5′ctctcagaagtcttctcctc. 35S-UTP labeled riboprobes were generated using the Maxiscript kit (Ambion) according to manufacturer’s directions and stored at -80C until use. Behaviorally characterized aged and young rats were anesthetized with isoflurane and transcardially perfused with 0.1 M phosphate buffer saline at room temperature followed by ice-cold 4% paraformaldehyde in 0.1 M phosphate buffer (PB). For Gabra5 resulting Ns were 5Y, 5AU and 6AI and for Hspa5, Ns were 4Y, 6AU and 5AI. Thirty-micrometer sections were taken through the fixed hippocampi and hybridized with labeled probes. Mounted, dried sections were exposed in a phosphorimager cassette and the CA3 subregion was outlined by hand and quantified using Imagequant (GE healthcare). All sections for each gene analysis were hybridized simultaneously using a single probe preparation. Processing and analysis of the brain sections were done blind to experimental conditions matched for level along the septo-temporal axis but restricted to the dorsal hippocampus. Because of occasional variability in hybridization, outliers were removed based on the formula median ± 2(Q3-Q1). Analysis of variance was used to determine significant differences between groups. Radioactive standards exposed at the same time as the sections ensured that section intensity was within the linear range.
Microarray hybridization and analysis
The microarray experiment from which the Syn1 data has been described in detail previously.5 Briefly, CA3 was microdissected from 500 micron transverse sections of the hippocampus along its entire longitudinal extent from aged and young behaviorally characterized Long Evans rats. Total RNA samples were sent to the Johns Hopkins Microarray core facility for cRNA labeling and hybridization to Affymetrix rat 230 2.0 microarrays using standard Affymetrix recommended procedures. All quality control, normalization, differential expression, and exploratory analysis of microarray data were performed using the open-source R statistical language (www.r-project.org). The quality of microarray data was assessed on many levels, resulting in the omission of 5 of the 72 hybridizations from the analysis. Resulting Ns for the CA3 subregional data were 6AU, 8 AI and 9 Y for each region. The gcRMA package in Bioconductor (www.bioconductor.org)49 was used to normalize microarray data. Significance analysis in microarrays (SAM) d-statistics50 were combined with an empirically-derived low-intensity cut-off to assess differential expression across comparison groups of animals.
Quantitative reverse transcription PCR
RNA was extracted from archived dissected CA3 hippocampal tissue samples concurrently with the genomic DNA used in methylation analysis (Allprep kit, Qiagen). The samples were not originally designated for RNA extraction and thus were not consistently handled to maintain RNA integrity. We assessed samples for RNA quality using agarose gel electrophoresis and included only samples with a 28S/18S ratio greater than 1.4 resulting in a n = 7Y, 3AU and 5AI. RNA was reverse transcribed and subjected to qPCR using rat Gabra5 primer set #2 and normalized to TBP control primers (RealTimePrimers.com) on a Rotor-Gene 3000.
Methylation analysis
Genomic DNA samples
The CA3 subregion was dissected from archived hippocampi isolated from 8 young and 14 aged (6 AU and 8 AI) behaviorally characterized rats (see above for behavioral assessment). CA3 Genomic DNA was isolated using the Allprep kit (Qiagen) and the same gDNA preparations were used for methyl-specific PCR, bisulfite pyrosequencing and bisulfite sequencing.
CpG island identification and primer design
Genomic sequences were identified via NCBI Gene database. Reference assembly sequences (based on RGSC_v3.4) were used for analysis. 10000 bps of genomic sequence centered at the mRNA start site were assessed for CpG islands using EMBL-EBI Emboss CpG island search tool (www.ebi.ac.uk/Tools/emboss/cpgplot/index.html). The mRNA start site as designated on the RGSC_v3.4 sequence was used with no independent confirmation. Sequences that met the following criteria were considered to be CpG islands: CpG ratio observed to expected > 0.6 and GC content greater than 50% (calculated in a 100 bp window) over a minimum length of 200 bps. Any gaps within the genomic sequence were ignored for CpG island search purposes. Methyl-specific PCR primers to CpG islands as well as to genomic regions adjacent to the CpG islands (CpG island shores) were designed using Methprimer (www.urogene.org/methprimer/index1.html). CpG island primers were limited to no more than 2 CpGs per primer and targeted toward the middle of the CpG island where possible. Gabra5 bisulfite sequencing and pyrosequencing primer set was also designed by methprimer and targeted as close the Gabra5 MSP primer set as possible. Table 3 contains all primer sequences targeting bisulfite treated methylated and unmethylated versions of the genes.
Table 3. Methyl-specific PCR primers.
| Primer Set | Left Sequence (5′-3′) | Right Sequence (5′-3′) |
|---|---|---|
| Gabra5 1UM |
TGTTATTGATATTGGATTAATATGT |
ATCACAAACAATACAAAACTTTCCA |
| Gabra5 1M |
TGTTATTGATATTGGATTAATACGT |
ACAAACAATACAAAACTTTCCGAT |
| Gabra5 2UM |
TGAGGGTTGGATTATTAGAGGTATT |
ACTCACCAATACTAACACACAACACA |
| Gabra5 2M |
GAGGGTCGGATTATTAGAGGTATC |
CACCAATACTAACGCACAACG |
| Gabra5 3UM |
ATTAGAAGTAGTTTTGGTTTTGAATC |
CCACTTTTACAAAATATACAATCATC |
| Gabra5 3M |
TAGTTTGTTGGTTTTGAACGT |
CACTTTTACAAAATATACAATCGTC |
| Actin BS |
GTTTTAGGTTTGAGGTGATAAAGTG |
TCCCAAAAAAACCCTAATAAAATAC |
| Hspa5 1M |
TTTTTTTGATTTTGAGATTTTTGTC |
ATAAACTTCATCTTACCGACGCT |
| Hspa5 1UM |
TTTTTGATTTTGAGATTTTTGTTGT |
CAATAAACTTCATCTTACCAACACT |
| Synapsin 1M | TTGTAGCGGGTAGTAGAGGAGTC | AAAAAATCCAAAAAACAATAAATCG |
Methyl-specific PCR
CA3 genomic DNA was bisulfite treated using the EZ DNA Methylation Gold kit (Zymogen) according to manufacturer’s directions. Bisulfite treatment converts unmethylated, but not methylated, cytosines to thymidines. Primers directed to a particular sequence are designed to detect either the methylated or unmethylated converted DNA and thus selectively amplify the target sequence based on methylation status as in Miller et al.24 Bisulfite treated DNA was amplified using QuantiTect SYBR Green PCR Kit (Qiagen) in a Rotorgene RG3000 (Corbett Research). For each primer pair all subjects were run in triplicate simultaneously along with a control sample. Optimal cycling conditions for each primer set were found using a standard curve of varying DNA concentrations. All standard curves had an efficiency near 1. Standard curves for primers targeting methylated DNA were performed on DNA treated with M. Sss1 CpG methyltransferase (New England Biolabs) prior to bisulfite sequencing. Data was normalized to amplification with an Actb primer pair containing no CpG dinucleotides. Amplification levels of methylated and unmethylated primer pairs (as in Fig. 2) were determined by 2∆CT method relative to Actb. Samples with no amplification, which occurred frequently with methylated primers, were given a value of zero. For the Gabra5 CpG island shore primer sets (MSP2 and MSP3) both unmethylated and methylated primers amplified quite well. Thus the ratio between methylated and unmethylated primers was used to determine methylation changes, eliminating the need for normalization to the Actb primer set.
Bisulfite pyrosequencing
CA3 genomic DNA samples were bisulfite treated and a region of the Gabra5 CpG island PCR was amplified using primers containing no CG dinucleotides. This criteria was necessary so as not to bias amplification toward methylated or unmethylated sequences l primer 5′ TTGGGGTTTTTTAGAAGAGTAGTTT 3′; right Primer 5′ GAGATGGAAGTATTTGTTGTGTGTTT 3′). As a consequence the primers were targeted to the 3′ end of the CpG island at the end of the first exon, the only CpG island region with primer-length sequences without CpGs. Sequences were amplified with a biotinylated 3′ primer and sequenced on a Pyromark 24 system at the Johns Hopkins Medical Institute DNA Analysis core facility. Three different sequencing primers were used to cover the entire amplicon: Seq #1
5′ TTGGGGTTTTTTAGAAGAGTAGTTT3′; Seq #2 5′
GTTTAGGGGAGGTAAAAGGAAT 3′; Seq #3 5′ GTTTTTTAGATTYGTTAGGTTA 3′. Due to sequence characteristics, CpGs 1–4, 11 and 13 data did not pass quality control standards. Pyrosequencing of Gabra5 upstream shore spanned the left MSP2 primer. Quality data was obtained from 5 out of 6 CpGs with two sequencing primers: Seq #1
5′ TTGGGATTGTAGGAATTGTTAAT 3′; Seq #2 5′ATTGGTTTTGGTTGTTTTTGTTT3′.
Bisulfite sequencing
PCR products generated with pyrosequencing primers were cloned into pGEM T-easy vector (Promega) and transformed into DH10B cells (Invitrogen). For each subject, 15 individual clones were grown, tested for insert by EcoRI digest, and isolated plasmid sent to Eurofins MWG Operon to be sequenced with M13F43 primer. Based on the presence on non-CpG cytosines, the bisulfite conversion rate was greater than 99.5% with no significant difference between aged and young groups indicating equivalent bisulfite conversion rates across groups.
Statistics
Because methylation data are not necessarily normally distributed, we used the Mann-Whitney U test and Spearman correlations to determine significance for all methylation data. A p value < 0.05 was considered significant. A Bonferroni correction for multiple testing was used when necessary.
Acknowledgments
We would like to thank Drs Bonnie Fletcher and Peter Rapp for helpful discussions on experimental results and manuscript preparation. This work was supported by National Institute on Aging/National Institutes of Health grant P01AG09973 to MG.
Glossary
Abbreviations:
- CpG
cytosine-guanine dinucleotide
- Gabra5
GABA-A receptor, alpha 5
- Hspa5
heat shock protein 5 (78 kDa glucose-regulated protein)
- Syn1
synapsin I
- MSP
methyl specific PCR
- CA3
Ammon’s horn, field 3
- GABA
gamma-aminobutyric acid
- LI
learning index
- AU
aged unimpaired rats
- AI
aged impaired rats
- Arc
activity-regulated cytoskeleton-associated protein
- Dnmt1
DNA (cytosine-5-)-methyltransferase 1
- Dnmt3a
DNA (cytosine-5-)-methyltransferase 3a
- GR
glucocorticoid receptor
- Actb
beta-actin
Disclosure of Potential Conflicts of Interest
None of the authors have any financial conflicts to declare with regards to the work presented here and all authors have approved the final manuscript
Footnotes
Previously published online: www.landesbioscience.com/journals/epigenetics/article/21291
References
- 1.Deary IJ, Wright AF, Harris SE, Whalley LJ, Starr JM. Searching for genetic influences on normal cognitive ageing. Trends Cogn Sci. 2004;8:178–84. doi: 10.1016/j.tics.2004.02.008. [DOI] [PubMed] [Google Scholar]
- 2.Day JJ, Sweatt JD. Epigenetic mechanisms in cognition. Neuron. 2011;70:813–29. doi: 10.1016/j.neuron.2011.05.019. [DOI] [PMC free article] [PubMed] [Google Scholar]
- 3.Gallagher M, Burwell R, Burchinal M. Severity of spatial learning impairment in aging: development of a learning index for performance in the Morris water maze. Behav Neurosci. 1993;107:618–26. doi: 10.1037/0735-7044.107.4.618. [DOI] [PubMed] [Google Scholar]
- 4.Gallagher M, Colantuoni C, Eichenbaum H, Haberman RP, Rapp PR, Tanila H, et al. Individual differences in neurocognitive aging of the medial temporal lobe. AGE. Journal of the American Aging Association. 2006;28:221–3. doi: 10.1007/s11357-006-9017-5. [DOI] [PMC free article] [PubMed] [Google Scholar]
- 5.Haberman RP, Colantuoni C, Stocker AM, Schmidt AC, Pedersen JT, Gallagher M. Prominent hippocampal CA3 gene expression profile in neurocognitive aging. Neurobiol Aging. 2011;32:1678–92. doi: 10.1016/j.neurobiolaging.2009.10.005. [DOI] [PMC free article] [PubMed] [Google Scholar]
- 6.Wilson IA, Ikonen S, Gallagher M, Eichenbaum H, Tanila H. Age-associated alterations of hippocampal place cells are subregion specific. J Neurosci. 2005;25:6877–86. doi: 10.1523/JNEUROSCI.1744-05.2005. [DOI] [PMC free article] [PubMed] [Google Scholar]
- 7.Smith TD, Adams MM, Gallagher M, Morrison JH, Rapp PR. Circuit-specific alterations in hippocampal synaptophysin immunoreactivity predict spatial learning impairment in aged rats. J Neurosci. 2000;20:6587–93. doi: 10.1523/JNEUROSCI.20-17-06587.2000. [DOI] [PMC free article] [PubMed] [Google Scholar]
- 8.Nicolle MM, Gonzalez J, Sugaya K, Baskerville KA, Bryan D, Lund K, et al. Signatures of hippocampal oxidative stress in aged spatial learning-impaired rodents. Neuroscience. 2001;107:415–31. doi: 10.1016/S0306-4522(01)00374-8. [DOI] [PubMed] [Google Scholar]
- 9.Gibbs JR, van der Brug MP, Hernandez DG, Traynor BJ, Nalls MA, Lai SL, et al. Abundant quantitative trait loci exist for DNA methylation and gene expression in human brain. PLoS Genet. 2010;6:e1000952. doi: 10.1371/journal.pgen.1000952. [DOI] [PMC free article] [PubMed] [Google Scholar]
- 10.Ladd-Acosta C, Pevsner J, Sabunciyan S, Yolken RH, Webster MJ, Dinkins T, et al. DNA methylation signatures within the human brain. Am J Hum Genet. 2007;81:1304–15. doi: 10.1086/524110. [DOI] [PMC free article] [PubMed] [Google Scholar]
- 11.Hernandez DG, Nalls MA, Gibbs JR, Arepalli S, van der Brug M, Chong S, et al. Distinct DNA methylation changes highly correlated with chronological age in the human brain. Hum Mol Genet. 2011;20:1164–72. doi: 10.1093/hmg/ddq561. [DOI] [PMC free article] [PubMed] [Google Scholar]
- 12.Siegmund KD, Connor CM, Campan M, Long TI, Weisenberger DJ, Biniszkiewicz D, et al. DNA methylation in the human cerebral cortex is dynamically regulated throughout the life span and involves differentiated neurons. PLoS One. 2007;2:e895. doi: 10.1371/journal.pone.0000895. [DOI] [PMC free article] [PubMed] [Google Scholar]
- 13.Wilson VL, Smith RA, Ma S, Cutler RG. Genomic 5-methyldeoxycytidine decreases with age. J Biol Chem. 1987;262:9948–51. [PubMed] [Google Scholar]
- 14.Calvanese V, Lara E, Kahn A, Fraga MF. The role of epigenetics in aging and age-related diseases. Ageing Res Rev. 2009;8:268–76. doi: 10.1016/j.arr.2009.03.004. [DOI] [PubMed] [Google Scholar]
- 15.Numata S, Ye T, Hyde TM, Guitart-Navarro X, Tao R, Wininger M, et al. DNA methylation signatures in development and aging of the human prefrontal cortex. Am J Hum Genet. 2012;90:260–72. doi: 10.1016/j.ajhg.2011.12.020. [DOI] [PMC free article] [PubMed] [Google Scholar]
- 16.Eckhardt F, Lewin J, Cortese R, Rakyan VK, Attwood J, Burger M, et al. DNA methylation profiling of human chromosomes 6, 20 and 22. Nat Genet. 2006;38:1378–85. doi: 10.1038/ng1909. [DOI] [PMC free article] [PubMed] [Google Scholar]
- 17.Koh MT, Haberman RP, Foti S, McCown TJ, Gallagher M. Treatment strategies targeting excess hippocampal activity benefit aged rats with cognitive impairment. Neuropsychopharmacology. 2010;35:1016–25. doi: 10.1038/npp.2009.207. [DOI] [PMC free article] [PubMed] [Google Scholar]
- 18.Yassa MA, Stark SM, Bakker A, Albert MS, Gallagher M, Stark CE. High-resolution structural and functional MRI of hippocampal CA3 and dentate gyrus in patients with amnestic Mild Cognitive Impairment. Neuroimage. 2010;51:1242–52. doi: 10.1016/j.neuroimage.2010.03.040. [DOI] [PMC free article] [PubMed] [Google Scholar]
- 19.Edwards JR, O’Donnell AH, Rollins RA, Peckham HE, Lee C, Milekic MH, et al. Chromatin and sequence features that define the fine and gross structure of genomic methylation patterns. Genome Res. 2010;20:972–80. doi: 10.1101/gr.101535.109. [DOI] [PMC free article] [PubMed] [Google Scholar]
- 20.Suzuki MM, Bird A. DNA methylation landscapes: provocative insights from epigenomics. Nat Rev Genet. 2008;9:465–76. doi: 10.1038/nrg2341. [DOI] [PubMed] [Google Scholar]
- 21.Boric K, Muñoz P, Gallagher M, Kirkwood A. Potential adaptive function for altered long-term potentiation mechanisms in aging hippocampus. J Neurosci. 2008;28:8034–9. doi: 10.1523/JNEUROSCI.2036-08.2008. [DOI] [PMC free article] [PubMed] [Google Scholar]
- 22.Doi A, Park IH, Wen B, Murakami P, Aryee MJ, Irizarry R, et al. Differential methylation of tissue- and cancer-specific CpG island shores distinguishes human induced pluripotent stem cells, embryonic stem cells and fibroblasts. Nat Genet. 2009;41:1350–3. doi: 10.1038/ng.471. [DOI] [PMC free article] [PubMed] [Google Scholar]
- 23.Guo JU, Ma DK, Mo H, Ball MP, Jang MH, Bonaguidi MA, et al. Neuronal activity modifies the DNA methylation landscape in the adult brain. Nat Neurosci. 2011;14:1345–51. doi: 10.1038/nn.2900. [DOI] [PMC free article] [PubMed] [Google Scholar]
- 24.Miller CA, Sweatt JD. Covalent modification of DNA regulates memory formation. Neuron. 2007;53:857–69. doi: 10.1016/j.neuron.2007.02.022. [DOI] [PubMed] [Google Scholar]
- 25.Weaver IC, Cervoni N, Champagne FA, D’Alessio AC, Sharma S, Seckl JR, et al. Epigenetic programming by maternal behavior. Nat Neurosci. 2004;7:847–54. doi: 10.1038/nn1276. [DOI] [PubMed] [Google Scholar]
- 26.Weaver IC, D’Alessio AC, Brown SE, Hellstrom IC, Dymov S, Sharma S, et al. The transcription factor nerve growth factor-inducible protein a mediates epigenetic programming: altering epigenetic marks by immediate-early genes. J Neurosci. 2007;27:1756–68. doi: 10.1523/JNEUROSCI.4164-06.2007. [DOI] [PMC free article] [PubMed] [Google Scholar]
- 27.Mathers JC. Session 2: Personalised nutrition. Epigenomics: a basis for understanding individual differences? Proc Nutr Soc. 2008;67:390–4. doi: 10.1017/S0029665108008744. [DOI] [PubMed] [Google Scholar]
- 28.Thayer ZM, Kuzawa CW. Biological memories of past environments: epigenetic pathways to health disparities. Epigenetics. 2011;6:798–803. doi: 10.4161/epi.6.7.16222. [DOI] [PubMed] [Google Scholar]
- 29.Jirtle RL, Skinner MK. Environmental epigenomics and disease susceptibility. Nat Rev Genet. 2007;8:253–62. doi: 10.1038/nrg2045. [DOI] [PMC free article] [PubMed] [Google Scholar]
- 30.Penner MR, Roth TL, Barnes CA, Sweatt JD. An epigenetic hypothesis of aging-related cognitive dysfunction. Front Aging Neurosci. 2010;2:9. doi: 10.3389/fnagi.2010.00009. [DOI] [PMC free article] [PubMed] [Google Scholar]
- 31.Penner MR, Roth TL, Chawla MK, Hoang LT, Roth ED, Lubin FD, et al. Age-related changes in Arc transcription and DNA methylation within the hippocampus. Neurobiol Aging. 2011;32:2198–210. doi: 10.1016/j.neurobiolaging.2010.01.009. [DOI] [PMC free article] [PubMed] [Google Scholar]
- 32.Hogart A, Nagarajan RP, Patzel KA, Yasui DH, Lasalle JM. 15q11-13 GABAA receptor genes are normally biallelically expressed in brain yet are subject to epigenetic dysregulation in autism-spectrum disorders. Hum Mol Genet. 2007;16:691–703. doi: 10.1093/hmg/ddm014. [DOI] [PMC free article] [PubMed] [Google Scholar]
- 33.Caraiscos VB, Elliott EM, You-Ten KE, Cheng VY, Belelli D, Newell JG, et al. Tonic inhibition in mouse hippocampal CA1 pyramidal neurons is mediated by alpha5 subunit-containing gamma-aminobutyric acid type A receptors. Proc Natl Acad Sci U S A. 2004;101:3662–7. doi: 10.1073/pnas.0307231101. [DOI] [PMC free article] [PubMed] [Google Scholar]
- 34.Glykys J, Mann EO, Mody I. Which GABA(A) receptor subunits are necessary for tonic inhibition in the hippocampus? J Neurosci. 2008;28:1421–6. doi: 10.1523/JNEUROSCI.4751-07.2008. [DOI] [PMC free article] [PubMed] [Google Scholar]
- 35.Dickerson BC, Salat DH, Greve DN, Chua EF, Rand-Giovannetti E, Rentz DM, et al. Increased hippocampal activation in mild cognitive impairment compared to normal aging and AD. Neurology. 2005;65:404–11. doi: 10.1212/01.wnl.0000171450.97464.49. [DOI] [PMC free article] [PubMed] [Google Scholar]
- 36.Baldelli P, Fassio A, Valtorta F, Benfenati F. Lack of synapsin I reduces the readily releasable pool of synaptic vesicles at central inhibitory synapses. J Neurosci. 2007;27:13520–31. doi: 10.1523/JNEUROSCI.3151-07.2007. [DOI] [PMC free article] [PubMed] [Google Scholar]
- 37.Chiappalone M, Casagrande S, Tedesco M, Valtorta F, Baldelli P, Martinoia S, et al. Opposite changes in glutamatergic and GABAergic transmission underlie the diffuse hyperexcitability of synapsin I-deficient cortical networks. Cereb Cortex. 2009;19:1422–39. doi: 10.1093/cercor/bhn182. [DOI] [PubMed] [Google Scholar]
- 38.Hol EM, Scheper W. Protein quality control in neurodegeneration: walking the tight rope between health and disease. J Mol Neurosci. 2008;34:23–33. doi: 10.1007/s12031-007-0013-8. [DOI] [PubMed] [Google Scholar]
- 39.Noh JS, Sharma RP, Veldic M, Salvacion AA, Jia X, Chen Y, et al. DNA methyltransferase 1 regulates reelin mRNA expression in mouse primary cortical cultures. Proc Natl Acad Sci U S A. 2005;102:1749–54. doi: 10.1073/pnas.0409648102. [DOI] [PMC free article] [PubMed] [Google Scholar]
- 40.Christensen BC, Houseman EA, Marsit CJ, Zheng S, Wrensch MR, Wiemels JL, et al. Aging and environmental exposures alter tissue-specific DNA methylation dependent upon CpG island context. PLoS Genet. 2009;5:e1000602. doi: 10.1371/journal.pgen.1000602. [DOI] [PMC free article] [PubMed] [Google Scholar]
- 41.Holz-Schietinger C, Reich NO. The inherent processivity of the human de novo methyltransferase 3A (DNMT3A) is enhanced by DNMT3L. J Biol Chem. 2010;285:29091–100. doi: 10.1074/jbc.M110.142513. [DOI] [PMC free article] [PubMed] [Google Scholar]
- 42.Vilkaitis G, Suetake I, Klimasauskas S, Tajima S. Processive methylation of hemimethylated CpG sites by mouse Dnmt1 DNA methyltransferase. J Biol Chem. 2005;280:64–72. doi: 10.1074/jbc.M411126200. [DOI] [PubMed] [Google Scholar]
- 43.Ma DK, Jang MH, Guo JU, Kitabatake Y, Chang ML, Pow-Anpongkul N, et al. Neuronal activity-induced Gadd45b promotes epigenetic DNA demethylation and adult neurogenesis. Science. 2009;323:1074–7. doi: 10.1126/science.1166859. [DOI] [PMC free article] [PubMed] [Google Scholar]
- 44.Kangaspeska S, Stride B, Métivier R, Polycarpou-Schwarz M, Ibberson D, Carmouche RP, et al. Transient cyclical methylation of promoter DNA. Nature. 2008;452:112–5. doi: 10.1038/nature06640. [DOI] [PubMed] [Google Scholar]
- 45.Lin IG, Tomzynski TJ, Ou Q, Hsieh CL. Modulation of DNA binding protein affinity directly affects target site demethylation. Mol Cell Biol. 2000;20:2343–9. doi: 10.1128/MCB.20.7.2343-2349.2000. [DOI] [PMC free article] [PubMed] [Google Scholar]
- 46.Matsuo K, Silke J, Georgiev O, Marti P, Giovannini N, Rungger D. An embryonic demethylation mechanism involving binding of transcription factors to replicating DNA. EMBO J. 1998;17:1446–53. doi: 10.1093/emboj/17.5.1446. [DOI] [PMC free article] [PubMed] [Google Scholar]
- 47.Maei HR, Zaslavsky K, Teixeira CM, Frankland PW. What is the Most Sensitive Measure of Water Maze Probe Test Performance? Front Integr Neurosci. 2009;3:4. doi: 10.3389/neuro.07.004.2009. [DOI] [PMC free article] [PubMed] [Google Scholar]
- 48.Gallagher M, Burwell RD. Relationship of age-related decline across several behavioral domains. Neurobiol Aging. 1989;10:691–708. doi: 10.1016/0197-4580(89)90006-7. [DOI] [PubMed] [Google Scholar]
- 49.Irizarry RA, Hobbs B, Collin F, Beazer-Barclay YD, Antonellis KJ, Scherf U, et al. Exploration, normalization, and summaries of high density oligonucleotide array probe level data. Biostatistics. 2003;4:249–64. doi: 10.1093/biostatistics/4.2.249. [DOI] [PubMed] [Google Scholar]
- 50.Tusher VG, Tibshirani R, Chu G. Significance analysis of microarrays applied to the ionizing radiation response. Proc Natl Acad Sci U S A. 2001;98:5116–21. doi: 10.1073/pnas.091062498. [DOI] [PMC free article] [PubMed] [Google Scholar]