Abstract
Purpose
The frequency of DNA strand breaks produced by the decay of Auger electron-emitting radionuclides is inversely proportional to the distance of DNA nucleotides from the decay site; and thus is very sensitive to changes in the local conformation of the DNA. Analysis of the frequency of DNA breaks, or radioprobing, gives valuable information about the local DNA structure. More than 10 years ago, we demonstrated the feasibility of radioprobing using a DNA-repressor complex with a known structure. Herein, we used radioprobing to study the conformation of DNA in complex with the tumor suppressor protein 53 (p53). Several structures of p53-DNA complexes have been solved by X-ray crystallography. These structures, obtained with the p53 DNA binding domain, a truncated form, laid the groundwork for understanding p53-DNA interactions and their relation to p53 functions. However, whether all observed stereochemical details are relevant to the native p53-DNA complex remains unclear. A common theme of the crystallographic structures is the lack of significant bending in the central part of the DNA response element. In contrast, gel electrophoresis and electron microscopy data showed strong DNA bending and overtwisting upon binding to the native p53 tetramer.
Methods
To analyze DNA in complex with p53, we incorporated 125I-dCTP in two different positions of synthetic duplexes containing the consensus p53-binding site.
Results
The most significant changes in the break frequency distributions were detected close to the center of the binding site, which is consistent with an increase in DNA twisting in this region and local DNA bending and sliding.
Conclusions
Our data confirm the main results of the studies made in solution and lay a foundation for systematic examination of interactions between DNA and native p53 using 125I radioprobing.
Keywords: Radioprobing, iodine-125, p53, DNA structure
Introduction
The tumor suppressor protein p53 plays a central role in a cell's response to tumorigenic events (Meek, 2009). In response to DNA damage and other types of cellular stress, activated p53 binds to specific DNA response elements and functions as a transcriptional factor. p53 regulates a wide spectrum of genes: hundreds of human genes are either activated or repressed by p53 (Staib et al., 2005). Normally, p53 binds to DNA response element (RE) as a tetramer, recognizing two decamers RRRCWWGYYY (where R=A,G; Y=C,T; W=A,T) (el-Deiry et al., 1992) separated by a spacer whose length varies from 0 to ~20 bp (Riley et al., 2008). In the strongest p53 binding sites the spacer is very short (0 or 1 bp). Therefore, most of the structural studies of p53-DNA complexes used a 20-bp long RE, with no spacer. In most cases, the central tetramer CWWG was either CAAG:CTTG or CATG:CATG, the latter occurring in the strongest binding RE, such as cyclin-dependent kinase inhibitor 1 (p21) and growth arrest and DNA damage gene A (GADD45A). There are indications that the type of p53-induced regulation of gene expression, i.e. induction or repression, is encoded in the sequences and relative arrangements of the decamers (Ho and Benchimol, 2003, Riley et al., 2008, Zilfou et al., 2001). It was hypothesized that indirect readout in the p53-DNA interaction, conferred by the intrinsic conformation and flexibility of the DNA binding sites, plays a critical role in p53-induced gene regulation (Kitayner et al., 2006).
The DNA response elements are bound by the central region of the p53 protein, the so-called DNA binding domain (p53DBD), covering the conserved region of amino acids 96-308 (Bargonetti et al., 1993), whereas the C-terminal domain of the protein (amino acids 320 to 356) is responsible for tetramerization of wild-type p53 both free in solution and bound to its specific DNA binding sites. Sequence-specific DNA binding is linked to the p53 tumor suppression activity: mutations in the p53DBD have been associated with more than half of all human cancers (Hollstein et al., 1991).
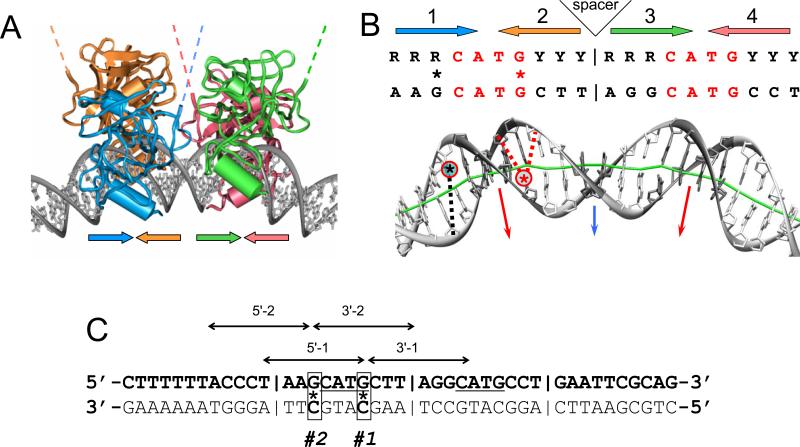
The first crystal structure of a complex containing the human p53DBD and a DNA binding site was resolved by X-ray crystallography more than 15 years ago (Cho et al., 1994). This structure elucidated the framework of p53-DNA interactions and shed light on the importance of the DNA binding domain for the biological activity of p53. However, it could not correctly describe the overall 3D organization of p53 tetramers bound to the response element. Later, “in solution” studies using gel retardation (Nagaich et al., 1999) and electron microscopy (Cherny et al., 1999) showed that both wild type (wt) p53 and p53DBD induced significant DNA bending and an increase in its twisting. Importantly, wt p53 induced substantially more distortion in the DNA RE compared to p53DBD. Specifically, by using A-tract phasing analysis it was shown that the binding of wt p53 and p53DBD resulted in bending the DNA by ~55° and ~35°, respectively; the DNA overtwisting was estimated as ~70° for wt p53 and ~35° for p53DBD (Nagaich et al., 1999). In addition, our computer modeling (Durell et al., 1998, Nagaich et al., 1999) predicted a lateral displacement of the DNA helical axis, termed Slide, of approximately 2Å in the center of RE upon p53 binding (Figures 1A, 1B).
Figure 1.
(A) Four p53 core domains bound to bent DNA according to our model (32, 97); the overall bend angle is 40°. The lateral positioning of p53 DBDs on the external side of DNA loop and the degree of DNA bending imply that in principle, the p53 tetramer can bind to nucleosomal DNA (Nagaich et al., 1999) (Sahu et al., 2010). The dashed lines indicate that the N-termini are located on the external side of the DNA loop, thus being accessible for interactions with ‘downstream’ transactivating factors. Large colored arrows indicate the orientations of the p53 subunits.
(B) Consensus p53 response element (el-Deiry et al., 1992) and the sequence used in radioprobing. Large arrows indicate orientations of the DNA pentamers. Asterisks denote the iodine-125 atoms in the C5 position of cytosines. The dotted red and black lines show the iodine-sugar distances. The DNA is bent as in (A): red arrows show the major-groove bending in the CATG tetramers (highlighted in dark gray); blue arrow is for the minor-groove bend in the center of the site.
(C) Sequence of the DNA duplex used as a substrate for p53 binding. Vertical bars separate consensus half-sites. CATG motifs in the p53 consensus binding sequence are underlined. Arrows show the range of nucleotides for which the data were obtained using the labeling schemes indicated above them; 5' and 3' denote the ends labeled with 32P, #1 and #2 denote the positions of 125I-dC.
Over the past several years, additional structures of mouse (Malecka et al., 2009) and human (Chen et al., 2010, Kitayner et al., 2010) p53DBD bound to DNA have been solved with X-ray crystallography. The conformations of the RE in the p53DBD-DNA structures obtained in these studies differ. The DNA Slide in the center of the RE varies from 1.3 Å (Kitayner et al., 2010) to 2.9 Å (Chen et al., 2010) to 4.2 Å (Malecka et al., 2009), which are generally in agreement with our earlier prediction (Durell et al., 1998). On the other hand, the conformations observed in crystals are not entirely consistent with the strong DNA bending observed in solution. One explanation of this discrepancy is that the DNA conformation could be affected by the interactions of the side chains that are present in the native p53 but were missing in the p53DBD utilized in the X-ray structures. Here we address the question of conformational changes in the DNA RE upon binding to native p53 using iodine-125 radioprobing.
Radioprobing is an approach to study DNA conformation based on analysis of the strand breaks produced by the decay of 125I incorporated into a defined place in DNA molecule (Panyutin and Neumann, 1997, Karamychev et al., 1999). Frequency of the single strand breaks in DNA produced by the Auger electrons emitted by decay of 125I, inversely correlates with the distance from the radioisotope to the sugar ring in a given nucleotide (Karamychev et al., 1999, Panyutin and Neumann, 1997) (Karamychev et al., 2000). Therefore, frequencies of the 125I-induced DNA breaks provide information on the DNA conformation. Radioprobing can be used to trace conformational changes resulting in a few angstroms alterations in the internucleotide distances in nucleic acids in solution by comparing relative frequencies of DNA strand breaks at individual nucleotides. The method was originally tested by the study of DNA complex with bacterial cAMP receptor protein with well established 3D structure (Karamychev et al., 1999). The estimation of sensitivity of method indicates that, for example, the roll angles of 20-25° would be reliably detected (Karamychev et al., 1999). This method was also applied to characterize the spatial organization of the three DNA strands in the RecA filament (Malkov et al., 2000) and the DNA and RNA strands in the transcription elongation complex (Karamychev et al., 2000) (Karamychev et al., 2003). Here we employed radioprobing to determine structural changes in DNA RE upon binding to wt p53.
Materials and methods
DNA substrates
Oligonucleotides were synthesized and purified as described (Panyutin and Neumann, 1997). For 125I-dCTP incorporation, 15 pmol of primer (the oligonucleotide that spans from the 5' end to position #1 or #2 of the bottom strand in Figure 1C), and 15 pmol of template (top strand in Figure 1C) were annealed at 75°C for 1 min in buffer containing 10 mM Tris·HCl, pH 7.5, 10 mM MgCl2, 50 mM KCl, 1 mM dithiothreitol (DTT) followed by slow (1 hr) cooling to room temperature. Primer extension reactions were carried out in the presence of 1 mM dATP, 1 mM dTTP and 70 μCi lyophilized 125I-dCTP 2200 Ci/mmol (Perkin-Elmer/NEN Life Science, Beverly, MA, USA) by 0.5 U exonuclease-free Klenow fragment of DNA polymerase I (US Biochemicals, Cleveland, OH, USA) in a total volume of 50 μl at room temperature. After 3 min the reaction was chased with a 1 mM mixture of all 4 dNTP for 2 more min and then stopped by addition of 4 μl of 100 mM ethylenediaminetetraacetic acid (EDTA); the samples were extracted with phenol:chlorophorm and the product duplexes were purified by gel electrophoresis as described (Panyutin and Neumann, 1997). The samples were labeled with [γ-32P]-ATP using T4 polynucleotide kinase (New England Biolabs, Ipswich, MA, USA) and with 3'-[α-32P]-dATP using terminal transferase (New England Biolabs). The samples were purified with MicroSpin G-50 columns (GE Lifesciences, Piscataway, NJ, USA) equilibrated with STE buffer (50 mM Tris·HCl, pH 7.5, 1 mM EDTA, 150 mM NaCl) and their final concentration was estimated to be 0.1 pmol/μL.
p53-DNA binding
Purified human p53 protein was obtained from Protein One (Rockville, MD, USA); the protein has a His tag and was expressed in baculovirus-infected insect cells. To form the p53-DNA complex, DNA duplexes (1 pmol) and p53 (10 pmol) were mixed in a buffer containing 25 mM 4-(2-hydroxyethyl)-1-piperazineethanesulfonic acid (HEPES) pH 7.4, 1 mM DTT, 50 mM KCl, 0.1% Nonidet P-40, 8 pmol poly(dI-dC), in a total volume 20 μl and incubated at 4°C for 40 min. A 4% native polyacrylamide gel electrophoresis (PAGE) was pre-run for 30 min at 4°C at 120V in a buffer containing 30 mM Tris Base, 30 mM boric acid, 0.7 mM EDTA. Then samples were quickly loaded onto the gel and the electrophoresis was continued for 2.5 h. The bands corresponding to p53-DNA complexes and DNA duplexes were cut out from the gel and stored at –80°C. After 14 days, the gel slices were crushed, the DNA was extracted and the samples were analyzed on a 20% denaturing gel. The positions of DNA breaks were determined by comparison with the fragments in the Maxam-Gilbert sequencing ladders (Maxam and Gilbert, 1980).
Analysis of DNA breaks and distances
The autoradiographs of the gels were visualized and measured with a BAS 1500 BioImaging Analyzer (FUJI Medical Systems, Stamford, CT, USA) as described (Karamychev et al., 2003). To measure the intensity of the individual bands, the profile of each lane was fitted with a series of Lorentz-type peaks corresponding to the bands. To calculate the frequency of breaks at a given nucleotide, the intensity of the corresponding band was divided by the sum of intensities of all bands in the lane. Data from at least three independent experiments were normalized such that the relative frequency of breaks at the G opposite to the 125I-dC (denoted G*) was 1. This normalization is based on the fact that the G:C pairs retain Watson-Crick geometry both in free DNA and in the protein-DNA complexes, including the p53-DNA complex in crystal ((Malecka et al., 2009), (Chen et al., 2010, Kitayner et al., 2010). Therefore, the distance between 125I incorporated in cytosine and the complementary guanine also remains the same in free DNA and in the complex. In this way, the relative changes in the intensity of breaks can be directly linked to the changes in DNA conformation, given that the frequency of breaks inversely correlates with the distance from the radioisotope to a given nucleotide – more specifically, to the iodine-sugar (I-S) distance (Karamychev et al., 1999, Panyutin and Neumann, 1997) (Karamychev et al., 2000).
To compare the radioprobing results with various DNA conformations, the I-Sdistances were measured in the following way. The 125I atom was positioned in cytosine by analogy with the methyl group in thymine; the resulting distances from the 125I to the C1' atoms of sugar rings were calculated.
Results
We designed our DNA sequence based on the strong p53 binding site used earlier in the PAGE experiments (Nagaich et al., 1999). The minor changes were introduced in DNA to avoid formation of hairpins in the relatively short DNA fragments used in Iodine-125 radioprobing. One strand of the DNA duplex (the bottom strand in Figure 1C) was synthesized by primer extension with 125I-dC either at position #1 or #2. Iodine-125-induced breaks were analyzed in the complementary strand (the top strand shown in bold in Figure 1C). To detect breaks 5' from the 125I-dC positions, the top strand was labeled with 32P at the 5'-end; to detect breaks 3' from the 125I-dC positions, the top strand was labeled at the 3'-end. The notations of the resulting duplexes are based on the site of the 32P labeling and the position of 125I-dC. For example, notation “3'-1” refers to the duplex labeled with 32P at the 3'-end and containing 125I-dC in position #1. The range of nucleotides where DNA breaks could be reliably measured is shown in Figure 1C by arrows.
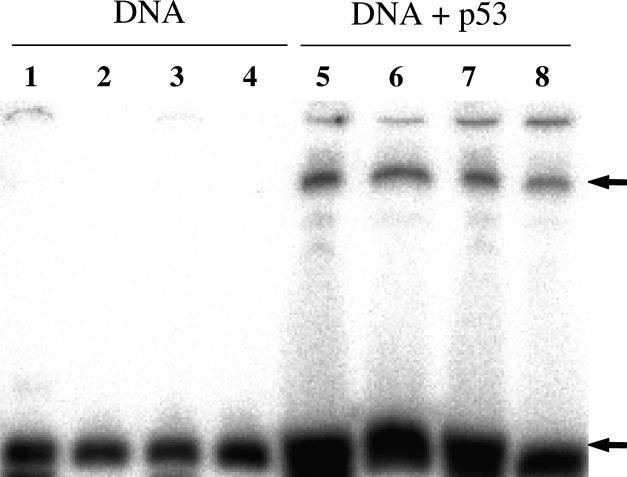
Formation of the p53-DNA complexes was detected by a gel retardation assay (Figure 2). The p53-DNA complexes (lanes 5-8) migrate more slowly than the free duplexes (lanes 1-4). The bands, corresponding to duplexes and p53-DNA complexes, were cut from the gel, frozen and kept at –80°C for accumulation of 125I decay-induced breaks.
Figure 2.
Analysis of p53 binding to the 125I and 32P labeled duplexes in 10% native PAGE. All DNA duplexes were 32P-labeled at the top strand as follows: lanes 1 and 5 – 3'-2; lanes 2 and 6 – 3' -1; lanes 3 and 7 – 5'-2; lanes 4 and 8 – 5'-1. Arrows indicate the positions of the bands corresponding to the p53-DNA complexes (upper) and free DNA duplexes (lower) that were excised for the subsequent DNA break analysis.
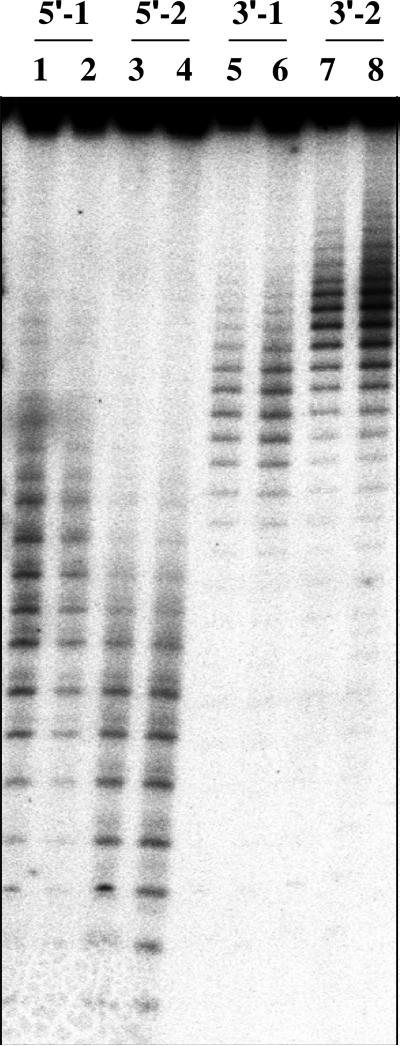
After 14 days of storage, the samples were analyzed for DNA breaks (Figure 3). The intensities of the bands were measured, and the frequencies of breaks at the individual nucleotides were calculated as described in Materials and Methods. To compare the frequencies of breaks obtained in independent experiments and different datasets, all the data were normalized such that the frequency of breaks at the G complementary to 125I-dC was equal to 1 (Figure 4).
Figure 3.
Analysis of DNA breaks in 20% denaturing PAGE. Marks on the top show the end labeled with 32P (5' or 3') and position of 125I (#1 or #2) in DNA samples. Lanes are grouped in pairs, the first is for the DNA-p53 complex, and the second is for the free DNA; for example, lanes 1 and 2 show breaks in the top strand labeled at the 5'-end with 32P and 125I at the position #1 of p53-DNA complex and free DNA, respectively.
Figure 4.
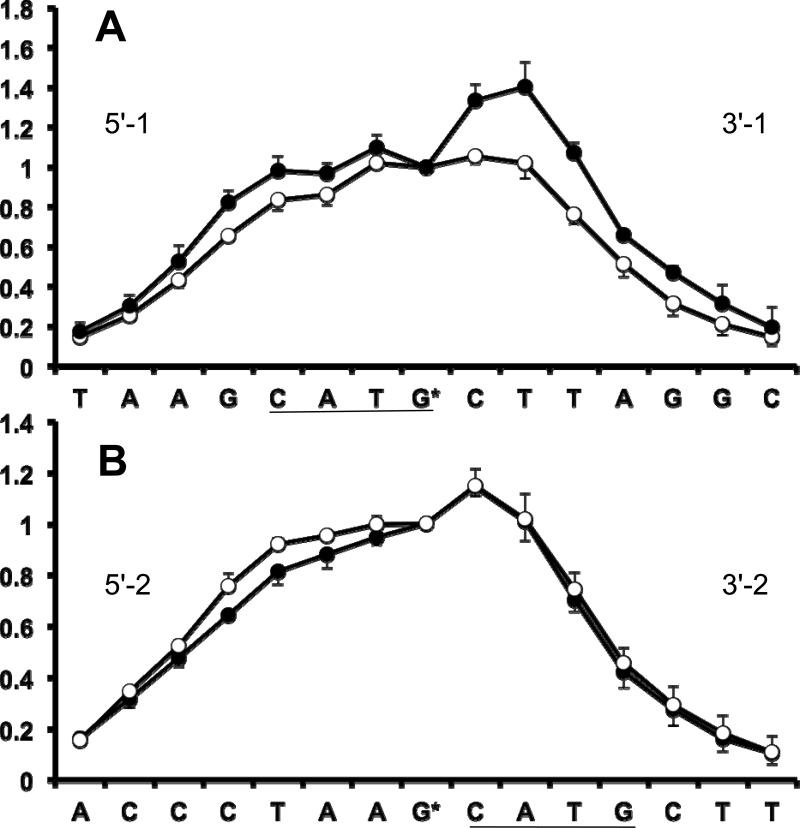
Graphs showing relative frequency of breaks at individual DNA nucleotides in the p53-DNA complexes (filled circles) and free DNA (open circles). Data were obtained by measuring the intensities of the bands in the gels like the one shown in Figure 3. Error bars indicate the standard error of the mean (SEM) for N = 3 independent experiments. G* denotes the guanine opposite to the 125I-dC. Panels A and B correspond to positions of 125I-dC #1 and #2 respectively (see Figure 1C). The cleavage profiles are normalized to make the frequency of breaks at nucleotide G* equal unity (see Methods for details).
The frequency of breaks in the top stand (Figure 1C) for the samples with 125I-dC in position #1 and #2 are shown in Panels A and B, respectively, of Figure 4. A significant increase in the frequency of DNA breaks upon p53 binding (black circles) was found in the nucleotides between the two CATG motifs in the dataset obtained from the 3'-1 duplex (Figure 4A). The binding of p53 induced a smaller, but reproducible increase in the frequency of breaks in the nucleotides 5' from the CATG* motif (5'-1 dataset, Figure 4A). The frequency of breaks in this region has a characteristic ‘zig-zag’ pattern, with fewer breaks observed at the A in the CATG* motif than at the following T (Figure 4A).
The differences in the frequency of breaks between the DNA duplex and p53-DNA complex for the samples with 125I-dC in position #2 were less significant (Figure 4B). There was a slight decrease in the frequency of breaks for the nucleotides in the 5'-2 dataset and an insignificant difference in the frequency of breaks for the nucleotides in the 3'-2 dataset (Figure 4B).
The radioprobing data clearly indicate noticeable changes in the local DNA conformation induced by p53 binding. In general, the nucleotides became closer to 125I-dC in position #1, most significantly in the CTT fragment downstream from the CATG* motif. Next we compared the results of radioprobing experiments with the iodine-sugar, or I-S, distances obtained from the published p53DBD-DNA structures. We focused our attention on the datasets with 125I-dC in position #1 because they showed the most significant changes in the frequency of breaks in the region between CATG repeats.
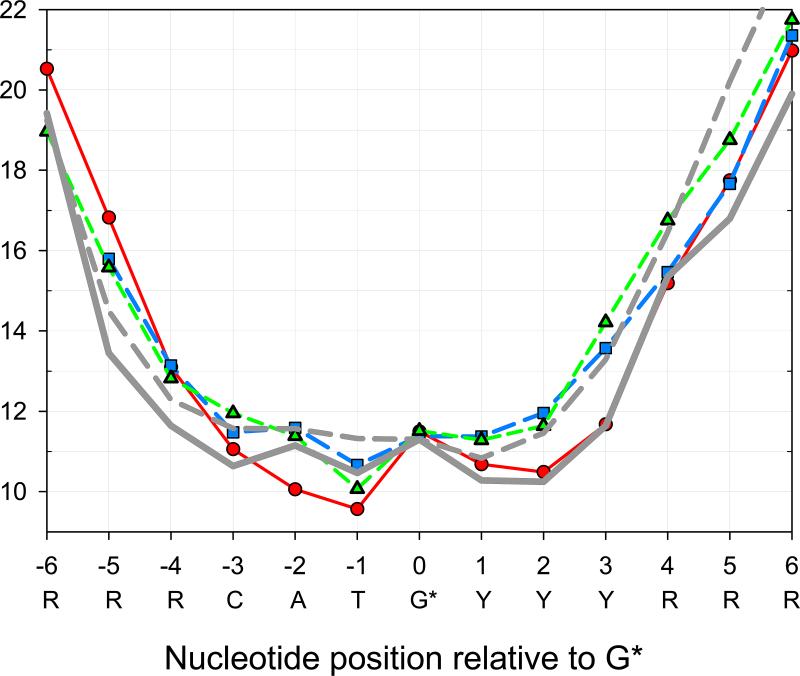
The rationale for this comparison was based on the observation that the intensity of single strand breaks in DNA inversely correlates with the I-S distance for a given nucleotide (Karamychev et al., 1999, Panyutin and Neumann, 1997). Using the empirical dependence between these two parameters (Karamychev et al., 2000), we generated two sets of I-S distances, one for free DNA (white circles in Figure 4A), and another for the p53-DNA complex (black circles in Figure 4A). The two curves presented in Figure 5 (broken and solid grey lines) provide a reasonable basis for a semi-quantitative structural interpretation of the radioprobing results. It should be noted here that DNA sequences were different in different x-ray studies and in our radioprobing experiments (for details, see Discussion).
Figure 5.
The iodine-sugar (I-S) distances calculated for several p53DBD-DNA crystallographic complexes. Green triangles: (Malecka et al., 2009), pdb access code 3exj. Blue squares: (Chen et al., 2010), pdb 3kmd. Red circles: (Kitayner et al., 2010), pdb 3kz8). The I-S distances were averaged over two half-sites, each containing CATG motif. The solid and broken grey lines represent the I-S distances for the p53-DNA complex and free DNA, respectively. The distances were calculated using the intensities of the single strand breaks in DNA (Figure 4A) and the empirical dependence between these two parameters (Karamychev et al., 2000).
As follows from Figure 5, none of the crystal structures is entirely consistent with the radioprobing data obtained in solution. For example, the I-S distances calculated for the Kitayner et al. (Kitayner et al., 2010) structure are very close to the solid black line downstream from G* (positions 1-4). However, this X-ray structure differs substantially from the 125I radioprobing data at positions –1 and –2, upstream from G*. On the other hand, the I-S distances in the structure resolved by Malecka et al. (Malecka et al., 2009) are closer to the empirical radioprobing distances upstream from G* (positions –1 and –2) but deviate significantly for positions 1 to 6 downstream from G*. The X-ray structure obtained by Chen et al. (Chen et al., 2010) is also inconsistent with the radioprobing distances at positions 1 to 3, but does reproduce the ‘zig-zag’ profile of the solid grey line upstream from G*, where the I-S distances for positions 0 and –2 are higher than for positions –1 and –3 (Figure 5).
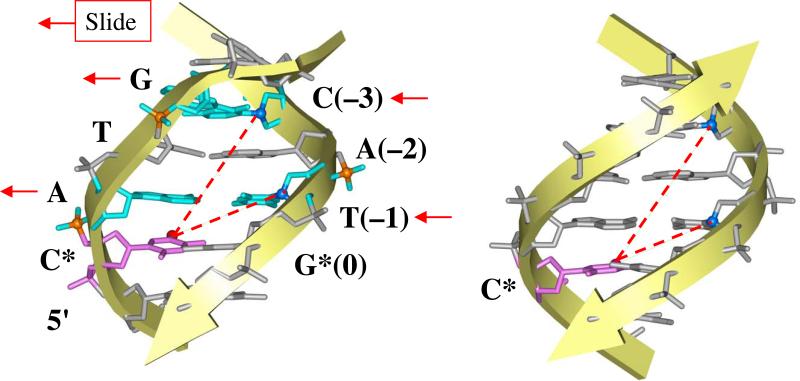
Comparing the base-pair step parameters (Olson et al., 1998) in the X-ray structures mentioned above (Chen et al., 2010, Kitayner et al., 2010, Malecka et al., 2009), we see that the positive Roll and Slide values in the CA:TG dimers (Figure 6) are responsible for the characteristic ‘zig-zag’ pattern observed for the I-S distances (Figure 5), which, in turn, are related to the intensities of the 125I decay-induced breaks in DNA (Figure 4A). Importantly, our data testify against formation of Hoogsteen A:T base pairs in the CATG tetramers, as observed by Kitayner et al. (Kitayner et al., 2010) in a crystallized p53DBD-DNA complex. Formation of such pairs would decrease the distance between the two glycosidic bonds (in A and T) by ~2 Å (compared to the Watson-Crick base pairs). Accordingly, the sugar rings in T(–1) and A(–2) would move closer to the iodine atom in C* (Figure 6). (See also Figure 5 where the I-S distance for positions –1 and –2 is shorter than for position 0 by 1.5 – 2 Å in the Kitayner et al. structure (Kitayner et al., 2010).) Such a shortening of the I-S distances would result in a noticeable increase in the intensities of the breaks for the A(–2) and T(–1) nucleotides in the context CATG* (Figure 6), which is not the case, however. As shown in Figure 4A, the observed increase in A(–2) and T(–1) break frequencies is less than that in C(–3), and much less than the increase registered at positions +1 to +3 downstream from G*.
Figure 6.
A scheme illustrating the iodine-sugar distances in the CATG motif. Left panel: The lateral displacement, Slide, of the pairs A:T(–1) and G:C(–3), indicated by arrows, leads to a decrease in the I-S distances (broken red lines). (Compare with the solid grey line in Figure 5, positions –3 to 0.) This effect is further emphasized by a positive Roll (bend into the major groove, from the viewer) in the dimeric steps C*A:TG* and TG:CA, because the 125I atom in the C5 position of C* is located in the major groove (a small red ball). Right panel: The fragment of regular B-DNA is shown for comparison.
Therefore, we conclude that our radioprobing data for wt p53 are not consistent with a significant shortening of the iodine-sugar distances originating from the anti-tosyn rearrangement of adenines and formation of the Hoogsteen A:T base pairs, as observed crystallographically for a p53DBD-DNA complex (Kitayner et al., 2010). On the other hand, our data on the Watson-Crick conformation of the CATG tetramer agree with the other two X-ray structures mentioned above, especially with that by Chen et al. (2010) – see Figure 5.
Discussion
The major advantage of radioprobing is that it is applicable to very large protein-DNA complexes. For example, this method allows direct comparison of the conformations of DNA bound to the p53 core domain and to the wild type protein, the latter still beyond the scope of conventional methods such as crystallography and nuclear magnetic resonance (NMR). Our results indicate that in a tetrameric complex with wt p53, both the CATG motifs and the central region of the 20-bp DNA fragment (YYY|RRR) undergo significant conformational changes, somewhat similar to those observed in nucleosomal DNA (Richmond and Davey, 2003, Tolstorukov et al., 2007).
Our structural interpretation of the radioprobing data is based on a comparison of the I-S distances for crystal structures containing the CATG motif. The current model is close to the CATG structures observed in the nucleosome core particles, NCP-147 (Richmond and Davey, 2003) and NCP-146 (Luger et al., 1997), and to the p53 half-sites complexed with the p53DBD dimer (Ho et al., 2006, Kitayner et al., 2006). In all these structures, the A:T pairs retain their canonical Watson-Crick geometry, and the CA:TG dimers have positive Roll (bending into the major groove). As a consequence, the p53 half-sites demonstrate an overall bend into the major groove in the CATG motif.
Notably, the recently published crystal structures of the tetrameric p53DBD complexes with DNA have strikingly different conformations of the CATG motif: one with the Hoogsteen A:T pairs (Kitayner et al., 2010) and the other with the Watson-Crick pairs (Chen et al., 2010). (Here, we exclude from the direct comparison the structure published by Malecka et al. (2009) as it was ‘artificially’ stabilized by the protein-DNA cross-linking.) The two crystallized complexes differ in the sequence of the central YYY|RRR junction (Figure 1): one has the C|G step (Kitayner et al., 2010) and the other has the T|A step (Chen et al., 2010). In this regard, it is remarkable that our p53 site also has the T|A dimeric step in the center, and we observe the Watson-Crick geometry in CATG motif similar to that in the crystal structure solved by Chen et al. (2010). Thus, it would be interesting to apply the radioprobing method to the DNA sequence used by Kitayner et al. (2010), to see if the local changes (T|A to C|G) in the center of the p53 response element would produce significant distortions in the CATG motifs observed crystallographically.
We did not speculate on structural interpretation of the minor changes in the frequency of breaks for C, T and A observed by radioprobing at the 5' side of 125IdC in position #2 (Figure 4B, dataset 5'-2). These nucleotides are partially outside the consensus p53 binding site and not visible in the crystal structures (Chen et al. 2010; Kitayner et al., 2010), and the difference in the frequency of breaks is too small for a meaningful interpretation.
The increase in intensities of the breaks in the central YYY|RRR fragment is consistent with a local B to C-like transition – that is, an increase in Twist and Slide, and a decrease in Roll (see Fig. 1 in (Zhurkin et al., 2005)). Remarkably, all three conformational changes were postulated in our early model (Durell et al., 1998, Nagaich et al., 1999). The p53-induced DNA overtwisting, initially detected by electrophoretic measurements (Nagaich et al., 1999), is consistent with the high average Twist of ~36° observed recently in crystallized tetrameric complexes (Chen et al., 2010, Kitayner et al., 2010, Malecka et al., 2009). The other predicted structural effects, namely the increase in Slide and decrease in Roll, require further experimental verification. In particular, additional radioprobing measurements, with the labeled cytosine placed close to the center of the 20-bp long p53 RE, would provide valuable information and, as we anticipate, will be performed in the near future.
Why are these conformational details so important? First of all, the fact that the p53 subunits bound to the bent DNA are located on the external side of the loop (Fig. 1) suggests that the p53 N-termini are accessible for interaction with co-activators and corepressors (Nagaich et al., 1999). Second, according to our model of the tetrameric p53-DNA complex (Durell et al., 1998, Nagaich et al., 1999), the DNA deformations are very similar to those observed in the nucleosome (Luger et al., 1997, Richmond and Davey, 2003). Furthermore, the new data suggest not only that p53-induced DNA bending obeys the same rules as sequence-dependent anisotropy of DNA bending, but also that the lateral displacement of the DNA axis occurs in the same direction as in nucleosome (Richmond and Davey, 2003, Tolstorukov et al., 2007). Thus, if our model is further substantiated, it would provide strong support to the notion that p53 effectively recognizes its response elements wrapped in nucleosome (Nagaich et al., 1999) (Sahu et al., 2010). This, in turn, is important for a better understanding of the relationship(s) between the mechanism(s) of gene regulation and the chromatin environment of the p53 binding sites operative in this regulation.
Acknowledgements
This work was supported by the Intramural Research Program of the NIH Clinical Center and NCI.
Footnotes
Declaration of interest
Authors declare no conflicts of interest.
References
- Bargonetti J, Manfredi JJ, Chen X, Marshak DR, Prives C. A proteolytic fragment from the central region of p53 has marked sequence-specific DNA-binding activity when generated from wild-type but not from oncogenic mutant p53 protein. Genes & Development. 1993;7:2565–2574. doi: 10.1101/gad.7.12b.2565. [DOI] [PubMed] [Google Scholar]
- Chen Y, Dey R, Chen L. Crystal structure of the p53 core domain bound to a full consensus site as a self-assembled tetramer. Structure. 2010;18:246–256. doi: 10.1016/j.str.2009.11.011. [DOI] [PMC free article] [PubMed] [Google Scholar]
- Cherny DI, Striker G, Subramaniam V, Jett SD, Palecek E, Jovin TM. DNA bending due to specific p53 and p53 core domain-DNA interactions visualized by electron microscopy. Journal of Molecular Biology. 1999;294:1015–1026. doi: 10.1006/jmbi.1999.3299. [DOI] [PubMed] [Google Scholar]
- Cho Y, Gorina S, Jeffrey PD, Pavletich NP. Crystal structure of a p53 tumor suppressor-DNA complex: understanding tumorigenic mutations. Science. 1994;265:346–355. doi: 10.1126/science.8023157. [DOI] [PubMed] [Google Scholar]
- Durell SR, Jernigan RL, Appella E, Nagaich AK, Harrington RE, Zhurkin VB. DNA bending induced by tetrameric binding of the p53 tumor suppressor protein: Steric constraints on conformation. In: SARMA RHAS, M. H., editors. Structure, Motion, Interaction and Expression of Biological Macromolecules. Vol. 2. Adenine Press; New York: 1998. pp. 277–296. [Google Scholar]
- El-Deiry WS, Kern SE, Pietenpol JA, Kinzler KW, Vogelstein B. Definition of a consensus binding site for p53. Nature Genetics. 1992;1:45–49. doi: 10.1038/ng0492-45. [DOI] [PubMed] [Google Scholar]
- Ho J, Benchimol S. Transcriptional repression mediated by the p53 tumour suppressor. Cell Death and Differentiation. 2003;10:404–408. doi: 10.1038/sj.cdd.4401191. [DOI] [PubMed] [Google Scholar]
- Ho WC, Fitzgerald MX, Marmorstein R. Structure of the p53 core domain dimer bound to DNA. The Journal of Biological Chemistry. 2006;281:20494–20502. doi: 10.1074/jbc.M603634200. [DOI] [PubMed] [Google Scholar]
- Hollstein M, Sidransky D, Vogelstein B, Harris CC. p53 mutations in human cancers. Science. 1991;253:49–53. doi: 10.1126/science.1905840. [DOI] [PubMed] [Google Scholar]
- Karamychev VN, Panyutin IG, Neumann RD, Zhurkin VB. DNA and RNA Folds in Transcription Complex as Evidenced by Iodine-125 Radioprobing. Journal of Biomolecular Structure & Dynamics: Conversation. 2000;11:155–167. doi: 10.1080/07391102.2000.10506616. [DOI] [PubMed] [Google Scholar]
- Karamychev VN, Tatusov A, Komissarova N, Kashlev M, Neumann RD, Zhurkin VB, Panyutin IG. Iodine-125 radioprobing of E. coli RNA polymerase transcription elongation complexes. Methods in Enzymology. 2003;371:106–120. doi: 10.1016/s0076-6879(03)71007-6. [DOI] [PubMed] [Google Scholar]
- Karamychev VN, Zhurkin VB, Garges S, Neumann RD, Panyutin IG. Detecting the DNA kinks in a DNA-CRP complex in solution with iodine-125 radioprobing. Nature Structural Biology. 1999;6:747–750. doi: 10.1038/11519. [DOI] [PubMed] [Google Scholar]
- Kitayner M, Rozenberg H, Kessler N, Rabinovich D, Shaulov L, Haran TE, Shakked Z. Structural basis of DNA recognition by p53 tetramers. Molecular Cell. 2006;22:741–753. doi: 10.1016/j.molcel.2006.05.015. [DOI] [PubMed] [Google Scholar]
- Kitayner M, Rozenberg H, Rohs R, Suad O, Rabinovich D, Honig B, Shakked Z. Diversity in DNA recognition by p53 revealed by crystal structures with Hoogsteen base pairs. Nature Structural & Molecular Biology. 2010;17:423–429. doi: 10.1038/nsmb.1800. [DOI] [PMC free article] [PubMed] [Google Scholar]
- Luger K, Mader AW, Richmond RK, Sargent DF, Richmond TJ. Crystal structure of the nucleosome core particle at 2.8 A resolution. Nature. 1997;389:251–260. doi: 10.1038/38444. [DOI] [PubMed] [Google Scholar]
- Malecka KA, Ho WC, Marmorstein R. Crystal structure of a p53 core tetramer bound to DNA. Oncogene. 2009;28:325–333. doi: 10.1038/onc.2008.400. [DOI] [PMC free article] [PubMed] [Google Scholar]
- Malkov VA, Panyutin IG, Neumann RD, Zhurkin VB, Camerini-Otero RD. Radioprobing of a RecA-three-stranded DNA complex with iodine 125: evidence for recognition of homology in the major groove of the target duplex. Journal of Molecular Biology. 2000;299:629–640. doi: 10.1006/jmbi.2000.3770. [DOI] [PubMed] [Google Scholar]
- Maxam AM, Gilbert W. Sequencing end-labeled DNA with base-specific chemical cleavages. Methods in Enzymology. 1980;65:499–560. doi: 10.1016/s0076-6879(80)65059-9. [DOI] [PubMed] [Google Scholar]
- Meek DW. Tumour suppression by p53: a role for the DNA damage response? Nature reviews. Cancer. 2009;9:714–723. doi: 10.1038/nrc2716. [DOI] [PubMed] [Google Scholar]
- Nagaich AK, Zhurkin VB, Durell SR, Jernigan RL, Appella E, Harrington RE. p53-induced DNA bending and twisting: p53 tetramer binds on the outer side of a DNA loop and increases DNA twisting. Proceedings of the National Academy of Sciences of the United States of America. 1999;96:1875–1880. doi: 10.1073/pnas.96.5.1875. [DOI] [PMC free article] [PubMed] [Google Scholar]
- Olson WK, Gorin AA, Lu XJ, Hock LM, Zhurkin VB. DNA sequence-dependent deformability deduced from protein-DNA crystal complexes. Proceedings of the National Academy of Sciences of the United States of America. 1998;95:11163–11168. doi: 10.1073/pnas.95.19.11163. [DOI] [PMC free article] [PubMed] [Google Scholar]
- Panyutin IG, Neumann RD. Radioprobing of DNA: distribution of DNA breaks produced by decay of 125I incorporated into a triplex-forming oligonucleotide correlates with geometry of the triplex. Nucleic Acids Research. 1997;25:883–887. doi: 10.1093/nar/25.4.883. [DOI] [PMC free article] [PubMed] [Google Scholar]
- Richmond TJ, Davey CA. The structure of DNA in the nucleosome core. Nature. 2003;423:145–150. doi: 10.1038/nature01595. [DOI] [PubMed] [Google Scholar]
- Riley T, Sontag E, Chen P, Levine A. Transcriptional control of human p53-regulated genes. Nature reviews. Molecular and Cellular Biology. 2008;9:402–412. doi: 10.1038/nrm2395. [DOI] [PubMed] [Google Scholar]
- Sahu G, Wang D, Chen CB, Zhurkin VB, Harrington RE, Appella E, Hager GL, Nagaich AK. p53 binding to nucleosomal DNA depends on the rotational positioning of DNA response element. The Journal of Biological Chemistry. 2010;285:1321–1332. doi: 10.1074/jbc.M109.081182. [DOI] [PMC free article] [PubMed] [Google Scholar]
- Staib F, Robles AI, Varticovski L, Wang XW, Zeeberg BR, Sirotin M, Zhurkin VB, Hofseth LJ, Hussain SP, Weinstein JN, Galle PR, Harris CC. The p53 tumor suppressor network is a key responder to microenvironmental components of chronic inflammatory stress. Cancer Research. 2005;65:10255–10264. doi: 10.1158/0008-5472.CAN-05-1714. [DOI] [PMC free article] [PubMed] [Google Scholar]
- Tolstorukov MY, Colasanti AV, Mccandlish DM, Olson WK, Zhurkin VB. A novel roll-and-slide mechanism of DNA folding in chromatin: implications for nucleosome positioning. Journal of Molecular Biology. 2007;371:725–738. doi: 10.1016/j.jmb.2007.05.048. [DOI] [PMC free article] [PubMed] [Google Scholar]
- Zhurkin VB, Tolstorukov MY, Xu F, Colasanti AV, Olson WK. An update on bending and curvature. In: Ohuyama K, editor. DNA conformation and transcription. Landes Bioscience; Georgetown, New York, NY: 2005. pp. 18–34. [Google Scholar]
- Zilfou JT, Hoffman WH, Sank M, George DL, Murphy M. The corepressor mSin3a interacts with the proline-rich domain of p53 and protects p53 from proteasome-mediated degradation. Molecular and Cellular Biology. 2001;21:3974–3985. doi: 10.1128/MCB.21.12.3974-3985.2001. [DOI] [PMC free article] [PubMed] [Google Scholar]


