

Abstract
Properties of the metal ion binding sites of Zn-transcription factor IIIA (TFIIIA) were investigated to understand the potential of this type of zinc finger to undergo reactions that remove Zn2+ from the protein. Zn–TFIIIA was purified from E. coli containing the cloned sequence for Xenopus laevis oocyte TFIIIA and its stoichiometry of bound Zn2+ was shown to depend on the details of the isolation process. The average dissociation constant of Zn2+ in Zn-TFIIIIA was 10−7. The dissociation constant for Zn-F3, the third finger from the N-terminus of TFIIIA, was 1.0 × 10⁻⁸. The reactivity of Zn–TFIIIA with a series of metal binding ligands, including 2-carboxy-2′-hydroxy-5′-sulfoformazylbenzene (zincon), 4-(2-pyridylazo)-resorcinol (PAR), and 3-ethoxy-2-oxo-butyraldehyde-bis-(N4-dimethylthiosemicarbazone) (H2KTSM2) revealed similar kinetics. The reactivity of PAR with Zn–TFIIIA declined substantially when the protein was bound to the internal control region (ICR) of the 5S ribosomal DNA. Both Cd2+ and Pb2+ disrupt TFIIIA binding to its cognate DNA sequence. The Pb2+ dissociation constant of Pb-F3 was measured as 2.5 × 10⁻⁸. According to NMR spectroscopy, F3 does not fold into a regular conformation in the presence of Pb2+.
Keywords: Transcription factor IIIA, Zinc, Cadmium, Lead, Zinc finger protein, Substitution reactions
1. Introduction
Transcription factor IIIA participates in the positive control of 5S ribosomal RNA synthesis through binding to the internal control region (ICR) of the 5S rRNA gene [1–3]. Its sequence contains nine tandem sequences of amino acids that bind to the ICR [4]. Each is characterized by the presence of two cysteine and two histidine residues that bind Zn2+ [5,6]. The repetitive grouping of such sequences gave rise to their designation as zinc fingers [6]. The three-dimensional conformation of this type of peptide motif was first predicted and then verified in numerous NMR and X-ray structural studies [7–15]. In its ββα conformation, Zn2+ stabilizes the structure through binding to the pairs of cysteine (C) thiolate groups and histidine (H) imidazole nitrogens (C2H2). In addition, several aromatic or non-polar side chains located at highly conserved positions along the sequence form a mini-hydrophobic cluster that contributes to conformational stability [16].
It was soon recognized from DNA and protein sequence analyses that the C2H2 zinc finger is a common motif among DNA binding proteins [17]. This has given impetus to the study of the properties of TFIIIA and related structures. One of the characteristics of some zinc finger proteins, including TFIIIA and the metallothionein transcription factor, MTF-1, is their relatively modest affinity for Zn2+ [18,19]. In the case of MTF-1, its low affinity for Zn2+ has supported the hypothesis that one or more of the zinc ions controls the transcriptional regulation of metallothionein synthesis [19].
The apparent, modest strength of Zn2+ association with TFIIIA, MTF-1, and some other Zn-finger proteins raise the question of the factors that control the intracellular availability of Zn2+ for these structures. This property also suggests that Zn2+ and its sulfhydryl ligands might be targets of non-physiological compounds that can compete with the Zn2+ for metal ion binding or can chemically modify the thiolate groups and destroy their affinity for Zn2+.
A number of reports indicate that foreign metal ions can replace Zn2+ in various zinc finger proteins and, in so doing, impair or alter their functions [20–27]. For example, exposure to Cd2+ inhibits the binding of transcription factors such as TFIIIA and MTF-1 to their cognate DNA sites [19,27]. In contrast, another Cd-substituted zinc finger protein, Sp1, retains its capacity to bind specifically to DNA [28]. As for Pb2+, in spite of its pervasiveness as an environmental contaminant, data about its interaction with zinc finger proteins has been lacking until recently. Hanas et al. have reported that Pb2+ inhibits the interaction of TFIIIA with the ICR [27,29]. Godwin and her coworkers have shown that Pb2+ forms complexes with other zinc finger peptides which vary in the number of cysteine and histidine ligands [30]. Still, relatively few studies have investigated the chemistry of Zn-finger structures in relation to their potential as reactive sites in the cell.
The present study surveys the chemical properties of the metal ion binding sites in Zn–TFIIIA in order to better understand the potential of physiological and xenobiotic agents to react with these sites and modulate or disrupt the DNA-binding reactions of such zinc-finger proteins. TFIIIA was chosen as the prototypical multi-finger transcription factor that displays modest affinity for Zn2+ and has the capacity to interact with other metal ions [18]. Particular attention was focused on Cd2+ and Pb2+ because they are among the most common metal pollutants and are good candidates for binding to the Zn2+ binding sites in zinc finger proteins. Considering that TFIIIA binds up to nine Zn2+ ions, it is recognized that the properties of the individual fingers may be heterogeneous and dependent on inter-finger interactions. Thus, in this and another paper, the behavior of the third finger (F3) of TFIIIA was also examined [31]. F3 is centrally involved in the binding interactions between Zn–TFIIIA and the ICR and, thus, may be thought of as a representative Zn-finger domain for comparison with the ensemble properties seen in the holoprotein [32,33].
2. Experimental procedures
2.1. Purification of TFIIIA from E. coli
The cloned sequence of Xenopus laevis oocyte TFIIIA was expressed in E. coli B strain BL21(DE3)/pTA102 (gift from Dr. David Setzer, Case-Western Reserve University). The purification method was as described with the following modifications [34]. First, we used a larger scale production to ensure sufficient amount of protein for biochemical study. Second, the salt-cut and affinity chromatography steps were not used. Zn2+ was present in all buffers at 10–100 μM [34]. By careful control of the BioRex70 chromatography step, TFIIIA was purified to 80–90% purity as judged from the densitometry of a silver-stained 12% SDS–PAGE of the protein sample. The TFIIIA protein concentration was determined by using the Bradford protein assay with BSA as standard [35]. A coefficient of 0.62 ± 0.06 was applied to correct for the differential staining behavior of BSA and TFIIIA [36]. The relative error of this measurement was typically around 20%.
2.2. Metal determination
Co, Zn, Cd, and Pb concentrations were determined using flame atomic absorption spectrophotometry. A series of standard solutions were made from 1000 ppm metal standards (EM Science) to calibrate the Instrumentation Laboratory (IL-70) atomic absorption spectrophotometer in the linear response range. The relative error was usually within 5%.
2.3. Ligand substitution reactions of metallo–TFIIIA complexes
Kinetics and equilibria
A set of metal binding ligands that form spectrally distinct complexes with Zn2+ and Cd2+ was used to probe the equilibrium binding of metal ions to TFIIIA and F3 as well as their ligand substitution properties. These included ZI (Zn2+), PAR (Zn2+, Cd2+), and H2KTSM2 (Zn2+, Cd2+). Zincon forms a 1 to 1 complex with Zn2+ that is characterized by an absorbance maximum at 620 nm (ε = 2.32 × 10⁴ M−1 cm−1) and by a Zn2+ dissociation constant of 10−4.9 at pH 7.4 and 25 °C [37]. PAR makes 2 to 1 complexes with both metal ions; their absorbance maxima are 484 nm (ε = 6.3 × 10⁴ M−1 cm−1) for Zn2+ and 485 nm (ε = 5.8 × 10⁴ M−1 cm−1) for Cd2+ [37]. The dissociation constant of Cd(PAR)2 at pH 7.4 and 25 °C is 2.5 × 10⁻¹¹ and that Zn(PAR)2, 3.0 × 10⁻¹⁴ [38]. Cd-KTSM2 has an absorbance peak at 435 nm (ε = 1.53 × 10⁴ M−1 cm−1); ZnKTSM2 has an absorbance maximum at 445 nm (ε = 1.28 × 10⁴ M−1 cm−1) [39].
In order to calculate apparent dissociation constants, measurable equilibria were established between M-TFIIIA complexes and competing ligands (L) based on the assumption that each finger in the complex could be characterized by the same average constant that was independent of the presence of neighboring fingers. The details of the measurements are described below in the section on M-F3 dissociation constants.
Each kinetic reaction was repeated at least three times under pseudo-first order conditions. The program Table Curve 2D (Jandel Scientific) was used to analyze the kinetic data and to provide the rate constants that characterized the reactions.
2.4. Ultrafiltration analysis of metal substitution reactions
Centricon 3, 10, or 30 centrifugal microconcentrators (Amicon) were used to separate free metal ions from TFIIIA. In kinetic studies, reactants were mixed, sealed with parafilm to prevent evaporation and contamination, incubated for appropriate times, and then centrifuged in the microconcentrators in a RC-5B+ Sorvall high-speed centrifuge using an SS-34 rotor rpm for 30–60 min at 4 °C. Typically, 80–90% of the solution was filtered through the membrane. Metal ion concentrations of retentate and filtrate were analyzed by atomic absorption spectrophotometry. Control filtration of Zn–TFIIIA alone showed that less than 10% of metals bound in TFIIIA entered the filtrate after centrifugation in a Centricon 30 centrifugal microconcentrator.
2.5. Electrophoretic mobility shift assay
EMSA is based on the reduced mobility of a DNA molecule through a non-denaturing gel when it is bound to a protein molecule. The probe for Zn–TFIIIA binding was a 146 bp DNA fragment that contains a 120 base pair region of 5S DNA called the Internal Control Region (ICR) to which the protein binds. The DNA was purified to homogeneity from E.coli strain JM109 (Promega) transformed with plasmid pXlo-wt (gift from Dr. Paul J. Romaniuk at the University of Victoria, Canada). It was radio-labeled using [γ-32P] dATP and T7 polynucleotide kinase. Protein, DNA, and metal ions or metal binding ligands were combined in a 20 μl reaction mixture containing 20 mM Tris/Cl (pH 7.5), 70 mM KCl, 1 mM DTT, 6% glycerol, 5 mM MgCl2 and 50 μg/ml poly(dI-dC) to minimize non-specific binding to the ICR. Excess Zn2+ (5–10 μM) was present in the DNA binding mixture and was added as one of the components of the storage buffer for TFIIIA. Without it, specific DNA binding could not be achieved even with samples of Zn–TFIIIA that approached Zn2+ saturation. After 20–60 min incubation, the samples were loaded onto a non-denaturing 8% polyacrylamide gel that had been subjected to electrophoresis at 7 °C for 30 min at 25 mA. The gel and running buffer consisted of 1X Tris-borate buffer [40]. Electrophoresis proceeded under the same conditions for about 2 h. After that, the gel was dried and exposed to X-ray film (Fuji) at −80 °C for appropriate times. Multiple exposures were made to ensure a linear response of the signal.
2.6. Synthesis of Finger 3 of TFIIIA
Finger 3 has the primary sequence- KNFTCDS DGCDLRFTTKANMKKHFNRFHNI; the amino acid sequence of a mutant finger (mF3) is altered between the two cysteine and two histidine residues-KNFTCPEGCDLRFTTKANMKKHQRTHNI. It was synthesized and purified as previously described [41]. The integrity of the peptides was confirmed by amino acid analysis, MALDI-MS, and SDS–PAGE. The apopeptide was prepared by adding 25% β-mercaptoethanol to the concentrated peptide solution under a nitrogen atmosphere. The reaction mixture was incubated anaerobically for 48 h and the apo-peptide was isolated by Sephadex G-25 gel filtration chromatography at pH 2. It was then concentrated with an Amicon stirred-cell concentrator (YM1 filter, 1000 MW cutoff) under anaerobic conditions. When samples were needed, buffer was added and the pH was adjusted, anaerobically. The concentrations of the sulphydryl groups associated with F3 and TFIIIA were monitored with DTNB [42]. A one to one ratio of Zn2+ or Cd2+ to apo-peptide was used to reconstitute the holoprotein.
2.7. Co2+, Pb2+ titrations of Finger 3
Dissociation constant of Pb-F3
The binding of Co2+ to F3 was followed by the change of the absorbance spectrum at 650 nm during the titration of apo-F3 with Co2+ in anaerobic 20 mM Tris/Cl, 100 mM NaCl, pH 7.2 [43]. The apparent dissociation constant of Co(II)-F3 was calculated directly from the spectrophotometric titration as previously described, using the expression [43]:
| (1) |
where Amax is the final absorbance at 650 nm and A represents any intermediate absorbance during the titration corresponding to free [Co2+]. Then, the apparent dissociation constant of Pb-F3 was determined by competitive displacement of Co2+ from Co-F3 with Pb2+, observing the decrease in the absorbance (A) of the 650 nm band of Co(II)-F3. The dissociation constant (Kd) at pH 7.2 was then calculated using the equilibrium expression:
| (2) |
where
| (3) |
| (4) |
2.8. Ligand competition with Zn- and Cd-F3
Metal ion dissociation constants
ZI and PAR were used as competing ligands in reactions with Zn-F3 and Cd-F3, respectively, to establish measurable equilibria from which metal ion dissociations constants could be extracted. For example,
| (5) |
| (6) |
Since [Zn–ZI] is determined spectrophotometrically at 620 nm and the [Zn-F3]i and [ZI]i are known, Keq can be calculated. In turn,
| (7) |
2.9. NMR spectroscopy of Pb-Finger 3
NMR data were acquired on a Bruker DRX500 NMR spectrometer. All samples contained 10% D2O (Sigma) and spectra were ordinarily recorded in 5 mM D11-Tris/Cl (CIL), 100 mM NaCl, pH 7.0. Samples (1 mM) were prepared in a N2 atmosphere in order to minimize the opportunity for oxidation of the peptide.
3. Results
3.1. Zinc stoichiometry of TFIIIA
Variable Zn-stoichiometries of TFIIIA have been reported in previous studies (Table 1). Therefore, the determination of the stoichiometry of Zn2+ bound to TFIIIA is important for any model of the protein in its reactions with DNA and with competing metal ions and ligands. In the present work, the stoichiometry varied between less than 1 and 9 under different conditions. When Zn2+ was included in the purification and storage buffers, stoichiometries routinely approached that of the fully saturated, Zn9–TFIIIA protein Presumably, excess Zn2+ in the buffer saturates the protein with Zn2+ by a mass action effect on metal ion dissociation equilibria of the Zn-fingers. It was initially hypothesized that the binding of Zn2+ to the sulfhydryl groups in the finger domains might inhibit their oxidization. However, a full complement of sulfhydryl groups was observed for extended periods in the presence of substoichiometic amounts of bound Zn2+. In the present study, the properties of Zn–TFIIIA preparations were compared that were either approximately saturated with Zn2+ (n = 7 ± 2) and able to bind specifically to the ICR DNA or deficient in Zn2+ (n < 7 ± 2) and incapable of forming a specific protein–ICR complex.
Table 1.
Zn stoichiometries of TFIIIA and 7S particle
| Protein/particle | Zn/protein or particle | Protein purity (%) | Added free Zn2+ | Potential chelator, DTT | References |
|---|---|---|---|---|---|
| 7S | 3.1 | 0 | 0.5–1.0 mM | [5] | |
| TFIIIA | 2.1 | 0 | 0.5–1.0 mM | [5] | |
| 7S | >5 | 30–50 | 0 | [6] | |
| 7S | 7.0 | 90–95 | 0 | [6] | |
| 7S | 11–12 | 90–95 | 10 μM | [6] | |
| 7S | 9 | Excess | [44] | ||
| 7S | 2.2 | 0 | 0.5–1.0 mM | [45] | |
| TFIIIA | 2.0 | 0 | 0.5–1.0 mM | [45] | |
| TFIIIA | 8.7 | 10 μM | 1.0 mM | [46] | |
| TFIIIA | 10.4 | 10 μM | 1.0 mM | [18] | |
| TFIIIA | 1–4 | 80–95 | 0 | 1.0 mM | a |
| TFIIIA | 7–11 | 80–95 | 50 μM | 1.0 mM | a |
This work.
3.2. Ligand substitution reactivity and thermodynamic stability of Zn2+ bound to TFIIIA and F3
Active TFIIIA requires Zn2+ to stabilize the specific peptide conformation that binds to DNA. Thus, an understanding of reactions that can modulate Zn2+ binding to the protein are central to discerning the potential range of intracellular behavior of TFIIIA and related structures. Ligand substitution reactions were carried out to assess the reactivity and stability of the Zn-fingers in TFIIIA and Zn-F3. PAR, a ligand employed in a previous study of TFIIIA, ZI, and H2KTSM2 were used in these experiments [46]; the reaction with EDTA is described in a companion study [47].
The reaction of a pseudo-first order excess of PAR with Znn–TFIIIA (n = 7 ± 2) displayed biphasic kinetics and went to completion. The pseudo-first order rate constants for the two steps were 2.7 ± 0.5 × 10⁻³ s−1 and 2.5 ± 0.3 × 10⁻⁴ s−1 (Table 2). All of the bound Zn reacted as verified by the inability of the mercurial, PMPS, to increase the absorbance due to Zn(PAR)2. This result disagrees with the report of Hanas et al., which indicated that four of the nine fingers of Zn9–TFIIIA are unreactive with PAR [46]. The reason for this discrepant behavior is unclear.
Table 2.
Ligand substitution reactions of Zn–TFIIIAa
| Ligand | k1 (×10−3 s−1) | Fraction | k2 (×10−4 s−1) | Fraction |
|---|---|---|---|---|
| PARb | 2.7±0.5 | 0.32±0.03 | 2.5±0.3 | 0.68±0.03 |
| Zinconb | 5±3 | 0.6±0.3 | 9±1 | 0.4±0.1 |
| H2KTSM2c | 3±2 | 0.3 | 3±2 | 0.7 |
| EDTAd | 160 M−1 s−1 | |||
| apoMTd | 40±10 M−1 s−1 |
Pseudo-first order rate constants for reaction with PAR, ZI, and H2KTSM2.
0.36 μM Zn7–TFIIIA, 680 μMPAR or 10 μMZI in 20 mMHEPES and 250 mM NaCl, pH 7.4 at 25 °C. k1 for the reaction of zincon with Zn-F3, 3× 10⁻³ s−1.
3.0 μM Zn3–TFIIIA, 400 μM H2KTSM2 in 20 mM HEPES, pH 7.4 at 25 °C.
Zn7–TFIIIA was also reacted with ZI under the same conditions as used in the PAR reaction. Again, stoichiometric ligand substitution occurred in a biphasic manner (Table 2). The two rate constants are similar to those obtained with PAR as the competing ligand but the fraction of reaction in each of the steps was different. The two-step kinetics were not significantly changed when Zn3–TFIIIA or Zn5–TFIIIA were substituted for the Zn7-protein. Indeed, when a third ligand, H2KTSM2, was utilized, essentially the same pair of pseudo-first order rate constants characterized this reaction as well (Table 2). Thus, it appears that these reactions are ligand independent and are probably limited by common Zn-finger dissociative processes.
The reaction of Zn7–TFIIIA with ZI was also carried out at lower ligand concentration (50 μM) such that an equilibrium was established. Under this condition, only 30% of the Zn2+ was transferred to ZI. Using a binding constant of K = 104.9 at pH 7.4 and 25 °C for Zn–ZI and assuming that each Zn-finger domain acted independently and identically in the reaction, the overall set of equilibria could be reduced to the following reaction:
| (8) |
On this basis, an average dissociation constant of 10−7 was calculated for the fingers of Zn7–TFIIIA (Table 3).
Table 3.
Metal ion dissociation constants of Zn–TFIIIA and metallo-finger 3
ZI as the competing ligand, 20 mM HEPES, pH 7.4 and 25 °C.
PAR as the competing ligand, 20 mM HEPES, pH 7.4 and 25 °C.
ZI as the competing ligand, 20 mM Tris/Cl, 250 mM NaCl, pH 7.4 and 25 °C.
PAR as the competing ligand, 20 mM Tris/Cl, 250 mM NaCl, pH 7.4 and 25 °C.
Metal ion competition as described in Section 2, 20 mM Tris/Cl, 250 mM NaCl, pH 7.4 and 25 °C.
When Znn–TFIIIA (1.7 μM protein, n = 3 ± 1) was reacted with 9.2 μM PAR under the same conditions, an equilibrium was established in which 33% of the total Zn2+ was in Zn(PAR)2. Addition of 9.2 μM PAR to the equilibrium mixture doubled the extent of reaction to 66%. Finally, when more PAR was added to reach a final concentration of 510 μM, a further reaction proceeded to completion with two rate constants of 3 × 10⁻³ and 3 × 10⁻⁴ s−1 (Table 2). This last result suggests that the residual bound Zn2+ (1Zn2+/TFIIIA) was distributed among the two different classes of sites. Treating the first two reactions as simple equilibria,
| (9) |
an average dissociation constant of 10−7 for Zn2+ in TFIIIA was obtained for the removal of 1/3 and 2/3 of the Zn2+ from Zn3–TFIIIA (Table 3). Thus, using protein with different degrees of metal saturation and employing two competing ligands that removed different fractions of bound Zn2+, an average dissociation constant for Zn2+ to TFIIIA was determined.
Zincon was also employed as a competing ligand for Zn-F3. With the single finger, the reaction proceeded with similar kinetics to those seen with Zn–TFIIIA (Table 2). The calculated equilibrium constant was about an order of magnitude smaller at 1.0 × 10⁻⁸ (Table 3). Although the dissociation constants for Zn–TFIIIA and Zn-F3 were both of intermediate magnitude, the somewhat larger value for Zn-F3 suggests that the TFIIIA protein structure imposes constraints on the properties of its component zinc-fingers.
3.3. Preparation and properties of Cd–TFIIIA
Several methods were used to prepare Cd–TFIIIA. The Cd-protein was highly susceptible to aggregation and generally yielded little protein for study. Overnight dialysis of Zn7–TFIIIA against Cd2+-containing buffer (20 mM HEPES, pH 7.4, 0.25 M NaCl, 25 mM β-mercaptoethanol, and 400 μM CdCl2) produced a sample with a Cd2+ to protein stoichiometry of 5 ± 3. Isolation and purification of TFIIIA in the presence of Cd2+ instead of added Zn2+ generated a sample with a Cd/TFIIIA stoichiometry of 3 ± 1. A possible reason for the low ratio of metal ion to protein is that Cd2+, which has a stronger preference than Zn2+ for sulfhydryl groups, might coordinate more than two thiolates in a non-canonical conformation. Reactivity of all 23 SH groups with DTNB was similar to that of Zn4–TFIIIA. Storage at 4 °C for seven days did not alter total SH analysis. Protein sulfhydryl groups were stable for three months at −80 °C. Thus, unexpectedly, the free thiol groups were relatively stable to oxidation.
Cd3–TFIIIA reacts with H2KTSM2 with kinetics that mirror those for Zn3–TFIIIA (Table 2). Moreover, the Cd-F3 dissociation constant of 1.98 × 10⁻⁸ is similar to that of Zn-F3 (Table 3) [31]. Thus, it appears that the properties of Cd- and Zn-fingers parallel one-another, arguing against substantial differences in the conformations of the Cd-fingers established with TFIIIA and F3. Additional studies described elsewhere have been carried out on the interaction of Cd2+ with finger 3 of the protein as a model for the behavior of Cd–TFIIIA [31].
3.4. Pb2+–Zn2+ exchange reaction with Zn–TFIIIA
In order to study the substitution of Pb2+ for Zn2+ bound to TFIIIA, Pb2+ was added to Zn4–TFIIIA to attain final concentrations of 1×, 2×, 4× and 8× the concentration of Zn2+ in the TFIIIA sample. After incubation for 0 min and 2.5 h, the mixtures were separated by ultrafiltration using Centricon centrifugal concentrators (≤15 min to achieve 80–90% complete separation). Atomic absorption spectrophotometric analysis of the filtrates showed that Pb2+ binding to and Zn2+ release from TFIIIA occurred within 15 min of reaction. The extent of the replacement was concentration dependent (Fig. 1). At a Pb2+/Zn2+ ratio of 8, TFIIIA was saturated with 8 Pb2+ and about 2 Zn2+ ions, consistent with the saturation of vacant metal ion binding sites with Pb2+ and the displacement of 50% of the Zn2+ from TFIIIA. These data demonstrate directly that Pb2+ can bind to TFIIIA and can at least partially compete with Zn2+ for binding sites. In contrast, the competitive reaction of Zn7–TFIIIA with Pb2+, as with Cd2+, repeatedly generated precipitated protein.
Fig. 1.
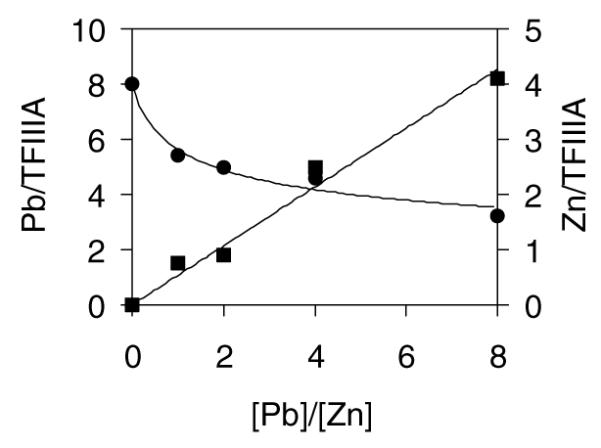
Pb2+ metal ion exchange reaction with Zn–TFIIIA: Zn4TFIIIA + Pb2+, monitored by ultrafiltration. Final concentrations were 0.8 μM TFIIIA and 3–25 μM Pb2+ in 20 mM HEPES (pH 7.4) buffer. Reaction time was 2.5 h. [Zn2+] (●) or [Pb2+] (∎) was plotted vs. the ratio of [Pb2+] added to [Zn2+] initially bound to TFIIIA.
3.5. Equilibrium and structural properties of Pb-F3
In order to refine the investigation of the interactions of a Zn-finger with Pb2+, its interaction with F3 was examined. Apo-F3 binds in one to one fashion with Co2+ according to spectrophotometric titration information (Fig. 2). A 1:1 ratio of the Co2+ to the peptide resulted in the fully reconstituted peptide, which indicates that one metal binds to the peptide in the metal center of the zinc finger. The Scatchard analysis of the data points indicated that the Co2+ binds to apo-F3 with the dissociation constant of 2.26 ± 0.51 × 10⁻⁵. Secondarily, in the titration of Co(II)-F3 with Pb2+ measurable equilibria were established at intermediate points. Keq was determined by plotting the Ain/(A – 1) vs. free metal in solution, where Ain is the initial absorbance at 650 nm and A is the absorbance associated with a particular titration point (Fig. 3). The slope is then equal to Keq/[Co2+]. Free metal in solution was calculated by the subtraction of the concentration of the Pb-F3 from the concentration of metal added. The equilibrium constant thus calculated equals 660 ± 43. The dissociation constant for Pb-F3 calculated using the equation KdPb-F3 KdCo-F3/Keq equals to 3.4 ± 0.8 × 10⁻⁸ M.
Fig. 2.
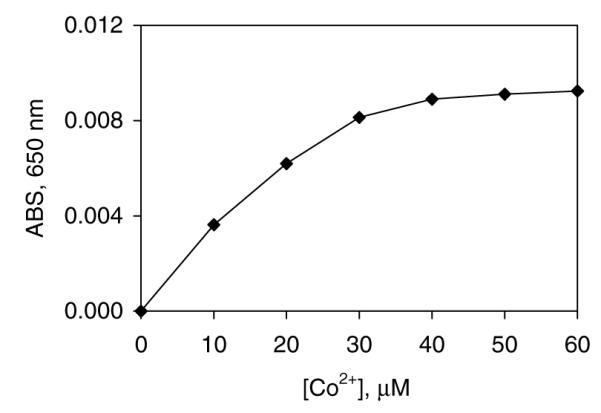
Spectrophotometric titration of apo-F3 with Co2+. Binding of Co2+ to 30 μM apo-F3 in 20 mM Tris/Cl, 100 mM NaCl, pH 7.2 at 25 °C.
Fig. 3.
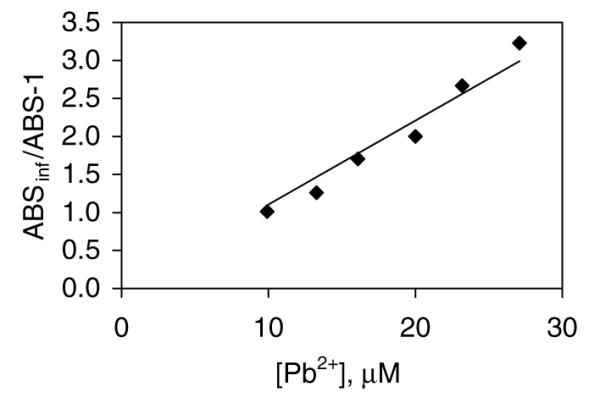
Secondary analysis of competitive displacement of Co2+ from Co-F3 by Pb2+. Conditions: 30 μM Co-F3, 6 mM Co2+ and 20 mM Tris/Cl, 100 mM NaCl, pH 7.2 at 25 °C. Plot of Abs∞ (650 nm)/[Abs(650 nm) −1] vs. free [Pb2+] in solution.
Using a ligand competition method, the metal ion dissociation constants of Zn-, and Cd-F3 were also determined (Table 3). The similarity among the dissociation constants for Zn-, Cd-, and Pb-F3 indicate that Cd2+ and Pb2+ should readily compete for binding to F3, and by inference, TFIIIA. According to data not shown, both Cd2+ and Pb2+ establish equilibria with Zn-F3 within the time of mixing.
Since Pb2+ also displaces Zn2+ from Zn–TFIIIA and destabilizes the specific Zn–TFIIIA–ICR adduct as described below, it was important to examine how Pb2+ binding to the finger sequences perturbs their structure such that they fail to interact selectively with their cognate DNA sites. NMR spectroscopy was used to examine the structure of Pb-F3. A comparison of the 1H 1D NMR spectra of apo-F3 and of Pb2+ + apo-F3 gave no indication of metal ion binding or of folding of the peptide (data not shown). In contrast, both Zn- and Cd-F3 form NMR detectable complexes [31]. However, their spectra are broad, suggesting the presence of an ensemble of structures, which can not be resolved by NMR techniques. Changing the number and type of interligand residues results in a modified peptide, mF3, which folds in the presence of Zn2+ or Cd2+ into canonical Zn-finger conformations that can be determined by NMR spectroscopy [31]. Fig. 4 compares the 1H 1D NMR spectra of apo-mF3 and Zn-, Cd-, and Pb-mF3 in the amide proton and aromatic proton region. The Zn- and Cd-mF3 spectra display the dispersion and complexity of proton resonances characteristic of discrete, folded conformations. The Pb-F3 spectrum shows indications of metal-ion binding in the broadening of the spectrum and the presence of some shifted resonances. However, the phenylalanine 12 ζ-H resonance located at 6.3 and 6.1 ppm, respectively, in the Zn- and Cd-mF3, is not observed in the Pb-mF3 spectrum (Fig. 4). Since the shift of this resonance from its position in apo-mF3 is characteristic of the formation of the mini-hydrophobic domain in the Zn-finger, it appears that Pb2+ does not induce proper folding of the finger.
Fig. 4.

500 MHz 1H NMR spectra of apo-mF3 and several metal complexes. (a) Zn-mF3, (b) Cd-mF3, (c) Pb-mF3, and (d) apo-mF3. Conditions: 5 mM D11-Tris/HCl, 100 mM NaCl, pH 7.0 with 10% D2O at 278 K except (d) at 298 K.
3.6. Inhibition of Zn–TFIIIA binding to the ICR by competing ligands and thiol reagents
An electrophoretic mobility shift assay (EMSA) was established to study the DNA binding activity of Zn–TFIIIA. The interaction between Zn–TFIIIA and the 146 base pair ICR probe was shown to be specific and to reach its equilibrium point within 20 min of incubation. Partial DNA binding activity (up to 20% in this study) was observed for TFIIIA as reported by other laboratories [34,48]. Only samples with Zn2+ to TFIIIA stoichiometries of at least 7 were able to bind to the ICR.
Several competing ligands and reagents that interact with thiols were examined for their capacity to react with Zn2+ coordination sites after the Zn7–TFIIIA–ICR adduct had formed. It was important to investigate this state of the protein in order to understand whether the Zn-fingers were equally reactive in the absence and presence of DNA, because the latter may substantially alter the steric accessibility and charge environment of the Zn2+ binding sites. Fig. 5 provides a comparison of the reactivity of Zn7–TFIIIA–ICR with ZI, PAR, DTNB, which oxidizes thiolate groups, and PMPS, a strong thiol binding agent that reacts rapidly with Zn7–TFIIIA, resulting in the expulsion of Zn2+ [46]. Competing reagents were incubated with the adduct either for 0 or 30 min before loading the mixture onto the gel and subsequent electrophoresis. ZI largely abolished the appearance of the shifted band under either condition (Fig. 5(a)). In contrast, PAR exerted little influence on the mobility of the Zn–TFIIIA–ICR adduct under either incubation condition. DTNB reduced the intensity of the protein-DNA band over time but, unlike ZI, was unable to completely dissociate the protein-DNA adduct under these conditions. PMPS was highly effective during both times of reaction. The concentration dependence of inhibitory effects of these compounds is portrayed in Fig. 5(b), where their differences in reactivity are evident. Clearly, among this set of reagents, there was a range of reactivity with both the free and DNA bound protein that gave rise to quite different EMSA results.
Fig. 5.

Effect of PAR, DTNB, PMPS and ZI on the DNA binding activity of Zn7–TFIIIA. (a) Lane 1: free 5S DNA (0.9 nM); Lane 2: band shift by 0.8 μM Zn7–TFIIIA; Lanes 3–10: inhibitory effect of DTNB (lanes 3–4, final concentration: 0.5 mM), PAR (lanes 5–6, final concentration: 0.4 mM), PMPS (lanes 7–8, final concentration: 0.5 mM) and ZI (lanes 9–10, final concentration: 0.5 mM). Zn7–TFIIIA and the ICR were incubated for 20 min. Then the competitor was added and (right) reacted with Zn7–TFIIIA–ICR for 30 min before electrophoresis or (left) the reaction mixture immediately electrophoresed. (b) Concentration dependence of DNA binding inhibition by ligands. Reaction conditions were the same as in (a), with a 30 min incubation between ligands and TFIIIA–ICR complex. Ligands were PMPS (∎), ZI (▴), PAR (O, ◇ = 1000 μM point) and DTNB (◆).
3.7. Inhibition of ICR DNA binding of Zn–TFIIIA by Cd 2+ and Pb2+
Incubation of Zn7–TFIIIA + ICR or the Zn7-TFIIIA–ICR complex with Pb2+ or Cd2+ inhibited the formation and/or caused the dissociation of the protein-DNA adduct (Fig. 6). These findings demonstrated that binding to ICR has no detectable influence on the reactivity of TFIIIA with Cd2+ or Pb2+ under the conditions employed. The extent of inhibition depended on both the concentration of the protein and the competing metal ion (Fig. 7). The minimum amount of Cd2+ or Pb2+ that produced significant inhibition was 2–10 times the total concentration of Zn2+ that was bound to TFIIIA and free in the reaction mixture under the conditions employed. All reaction mixtures that were incubated with the exogenous metal ion for 0, 10, or 30 min prior to electrophoresis yielded similar results indicating that the inhibition reactions were fast.
Fig. 6.
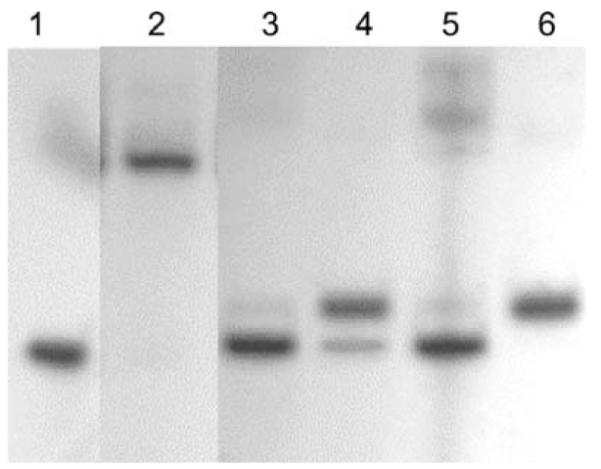
Effects of Cd2+ and Pb2+ on the electrophoretic mobility of Zn7–TFIIIA–ICR adduct. Zn7–TFIIIA and the ICR binding site was reacted for 20 min then Cd2+ or Pb2+ was added and the reaction proceeded for an additional 10 min prior to EMSA. Lane 1: free 5S DNA (1.9 nM); Lane 2: band shift by 0.8 μM TFIIIA; Lanes 3–4: 54 or 135 μM of Cd2+ added; Lanes 5–6: 48 or 121 μM of Pb2+ added. Buffer Zn2+ concentration: 5 μM.
Fig. 7.

Effects of Cd2+ and Pb2+ on DNA binding activity of Zn7–TFIIIA based on EMSA results. TFIIIA (1 μM) and the ICR binding site (2 nM) were incubated for 10 min then the metal was added and incubated another 10 min before the EMSA was run.
A band that migrated slightly slower than the free 5S DNA was sometimes observed at concentrations larger than those which totally dissociated the Zn–TFIIIA–ICR adduct; its intensity usually increased when the competing concentration became larger (Fig. 6). One possible explanation is that non-specific metal ion binding to DNA changed its charge, conformation, or even partially denatured it, and, thus altered its electrophoresis mobility.
4. Discussion
Zinc finger domains with modest Zn2+ binding affinity are likely to be able to exchange Zn2+ with their cellular environment. Because of this property, they also present attractive targets for xenobiotic agents that either compete with the Zn2+ ion to bind to the peptide or that modify the sulfhydryl ligands and destabilize the coordination of Zn2+. This report provides a range of new information about the bioinorganic properties of Zn–TFIIIA in the absence and presence of its cognate DNA binding site, the ICR, and uses these results as a basis for inquiring about the impact of Cd2+ and Pb2+ on the TFIIIA structure.
The average dissociation constant of Zn–TFIIIA finger peptides was found to be 10−7 (Table 3). As this number was derived from samples of Znn–TFIIIA that varied from n = 3–7, it is hypothesized that most, if not all, of the fingers display a similar affinity for Zn2+. A previous equilibrium dialysis experiment indicated that most of the zinc in TFIIIA had an equilibrium constant on the order of 10−5, much larger than the value determined in this work [18]. Recently, the dissociation constant of Zn2+ bound to finger 3 of TFIIIA (Zn-F3) was measured as 1.0 × 10⁻⁸ [31]. The similarity in the constants for the isolated Zn-finger and the holoprotein indicate that the contribution of inter-finger interactions to the stability of Zn2+ is modest at best.
It is clear why Zn2+ is commonly added to buffers used in the isolation of Zn–TFIIIA, its storage, and its reactions. Because of the large Zn2+ dissociation constant, it would not be surprising if different means of isolation would yield protein with differing Zn2+ to protein stoichiometry. Most researchers assume that the Zn2+ binding stoichiometry is 9, but data on the isolated protein is limited and ambiguous. The most cited information refers to the 7S complex of Zn–TFIIIA and 5S ribosomal RNA not to the free protein (Table 1). Since the 5S RNA protects Zn2+ in TFIIIA from chelation by EDTA, it is possible that the Zn2+ to TFIIIA stoichiometry of the RNA adduct and free Zn–TFIIIA may differ under comparable physiological conditions [49]. According to Table 1, we as well as other researchers have reported a range of Zn2+ to TFIIIA ratios, depending on the means of preparation of the protein. Inclusion of Zn2+ in the buffers generally enhances the extent of metal binding to TFIIIA. Our results also showed that Zn2+ stoichiometry of TFIIIA was sensitive to the presence of a potential Zn2+-chelating reagent (DTT) in the buffer and that it was difficult to achieve reproducibly the same stoichiometry under a given set of conditions. A recent study of the Zn2+ stoichiometry of another zinc finger protein that binds Zn2+ with modest affinity, MTF-1, reported variable Zn2+ to MTF-1 stoichiometries that resemble the experience with TFIIIA [50].
The possible physiological significance of such variation in Zn2+ stoichiometry is not yet clear. Although groups of Zn-fingers from TFIIIA, e.g. 1–3 through 1–6, have similar binding constants for their cognate DNA, on the order of 109, we were unable to demonstrate binding of Znn–TFIIIA to the ICR with less than n = 7 ± 2 [51]. Zn–TFIIIA with different Zn2+ stoichiometries displayed no significant differences in its kinetic lability or thermodynamic stability in the various reactions carried out to characterize the metal binding sites (Tables 2 and 3). Since the various fingers seem to have similar affinity for Zn2+, this finding may suggest that the metal ion distributes itself among the various fingers at each stoichiometry and, thereby, presents statistically the same set of Zn-fingers to each competing reagent as does Zn9–TFIIIA.
The modest stability and variable stoichiometry of TFIIIA, MTF-1, and other Zn-finger proteins for Zn2+ immediately raises the question: how do such structures retain Zn2+ in a cellular environment that includes a host of non-specific binding sites for metal ions by virtue of the ubiquitous presence of proteins and nucleic acids and small molecules such as glutathione? Alternatively, how do they maintain their complement of Zn2+ in surroundings that are estimated to contain as low as 10−12 M free Zn2+ when their dissociation constants may be several orders of magnitude larger [52]? The significance of this question may be gauged by the finding that 1 mM glutathione, a concentration several times less than that commonly found in cells, rapidly removes 90% of the Zn2+ bound to 30 μM Zn–F3 based on gel filtration chromatographic analysis (data not shown).
Ligand substitution reactions involving a range of ligands, including ZI, PAR, and H2KTSM2 in this work, and apo-metallothionein and EDTA in a companion paper, show that Zn2+ in TFIIIA is kinetically as well as thermodynamically accessible to competing ligands over short time periods when the free protein participates in the reactions (Table 2) [47]. In contrast, whereas ZI reacted with free and ICR-bound protein nearly equally well, PAR was much less effective in its reaction with the protein-DNA adduct (Figs. 5(a) and (b)). Similarly, whereas apo-metallothionein reacts with either form, EDTA is singularly unreactive with the adduct [47]. Thus, the binding of the protein to a bulky DNA partner can foreclose avenues of reaction that exist in free Zn–TFIIIA. Certainly, the sheer size of the DNA may sterically block access to the metal ion center. Similarly, unfavorable charge interactions may depress the rates of reaction as, perhaps, in the reaction of negatively charged EDTA with Zn–TFIIIA when it is associated with negatively charged DNA. That free and DNA-bound zinc fingers can react differently with competing ligands was also confirmed in a study that showed that GSH does not react with Zn-F3 when it is bound to its cognate DNA within the ICR even though it readily competes of Zn2+ in the Zn-F3 complex as described above [53].
The differential reactivity of Zn–TFIIIA and Zn–TFIIIA–ICR extends to their interactions with DTNB (Fig. 5). A previous study indicated that 0.5 mM DTNB reacts with Zn–TFIIIA in a triphasic reaction with 80% of the sulfhydryl groups being converted to disulfides with rate constants ranging between 0.9 and 5 × 10⁻² s−1 [46]. As with the competing ligand, PAR, 0.5 mM DTNB was considerably less reactive with the protein-DNA adduct. Thus, it seems that DNA binding can substantially alter the reactivity of zinc finger sites such that structures, which may not be thermodynamically stable in the cellular milieu as isolated structures, can achieve kinetic stability when bound to DNA. Such results provide a rationale for the kinetic stabilization of Zn–TFIIIA when it is active in gene transcription but leave unresolved the question of how it acquires Zn2+ in the first place. These findings also complement the earlier observation that the complex of Zn–TFIIIA with the 5S ribosomal RNA is less reactive with EDTA than the free protein [49].
Several studies have shown that Cd2+ or Pb2+ rapidly abolishes the DNA binding activity of some zinc-finger proteins, thus establishing zinc finger structures as potential targets for Cd2+ and Pb2+ toxicity. For example, we and others have reported that Cd2+ inhibits the DNA binding of Zn–TFIIIA [27]. Cd-Tramtrak displays at least a 10-fold lower affinity for its DNA binding site than the native zinc finger structure [23]. Similarly, incubation of cell extracts with Cd2+ inhibits MTF-1 binding to its cognate metal response elements according to an EMSA [19]. Hanas et al. have also demonstrated that preincubation of Zn–TFIIIA with Pb2+ prevents specific protein binding to the ICR [27,29]. Nevertheless, Cd2+-substituted Sp1 has been shown to be active in DNA binding [28]. The reason for the differences in response of various finger structures to the substitution of Cd2+ for Zn2+ remains to be discovered.
The current results significantly extend these observations. It has been demonstrated that Cd2+ and Pb2+ ions are also effective in reacting with and causing the dissociation of preformed Zn–TFIIIA–ICR (Fig. 6). They do so rapidly and at a concentration that is comparable to the total Zn2+ in the protein and medium. Thus, binding to DNA does not protect the Zn2+-binding sites from metal ion substitution. Cd2+ and Pb2+ were hypothesized to exert their effects by disturbing the conformation and, thus, the DNA binding stability of the zinc fingers. Whereas Zn2+ and Cd2+ share a number of metal coordination properties and may bind to C2H2 sites with similar geometries, Pb2+ with its expanded possibilities for ligand coordination might interact much differently. Nevertheless, because both metal ions disrupt the function of TFIIIA, it was important to understand the structural basis for these effects.
Finger 3, which is intimately involved in the binding of the ICR by Zn–TFIIIA, has been synthesized as a simple zinc-finger peptide that can be used as a model for examining structure–reactivity relationships in the holoprotein. Another paper in this series describes the findings that Zn-F3 binds specifically to the C-block, its cognate sequence within the ICR, and that Cd-F3 binds with only modestly lower stability [31]. Since neither Zn- nor Cd-F3 formed slow exchange complexes on the NMR time scale, an NMR structural analysis was carried out on Zn- and Cd-complexes of a closely related peptide to F3 that are more conformationally stable. Both metal ions induced the formation of the recognizable ββα conformation, showing that Cd2+ binding did not induce a major perturbation in structure as was suggested in the analysis of Cd-tramtrak [23]. Whether subtle differences in the conformational lability of the two structures may account for the negative effect of Cd2+ on the affinity of TFIIIA for the ICR or it results from the formation inter-finger structures conformations that can only form in the holoprotein cannot be discerned.
Pb2+ does not form a canonical zinc finger conformation with F3 or mF3 (Fig. 4). So, it seems likely that when Pb2+ competes with Zn2+ for binding to TFIIIA, it grossly alters the protein’s conformation, thereby preventing its specific interaction with the ICR. Another study of the conformation of Pb2+ bound to a C2HC finger as found in the HIV nucleocapsid protein also failed to find any regular conformation for the Pb-finger structure [30].
A recent NMR study of the interaction of an Sp1 Zn-finger peptide (C2 H2) withZn2+, Cd2+, Pb2+, and Hg2+ suggested that these metal ions were located near the cysteine and histidine ligands but did not demonstrate that any of the metallo-peptides adopted the characteristic ββα fs conformation [54]. Indeed, the peculiar lack of chemical shift dispersion of the amide proton resonances that was noted for the Zn-reconstituted Sp1 finger brings into question the meaning of the data, because they seem inconsistent with the expected behavior as is observed in Fig. 4, for example. A second paper offered spectrophotometric data to support metal-thiolate complexation had occurred and displayed gels of electrophoretic mobility shift assays that were interpreted as demonstrating the various metallo-fingers bind to an Sp1 cognate DNA oligomer [55]. Neither is convincing: In particular, the electrophoresis experiments did not reveal the typical retardation in mobility of the metallo–peptide–DNA adduct that is characteristic of specific protein-DNA binding (Figs. 5–7). That the Hg-finger was thought to bind specifically to the oligomer is especially puzzling. Hg2+ is expected to bind exclusively to sulfhydryl groups in a two-coordinate fashion that does not permit the tetrahedral ligand binding of the sulfhydryl and imidazole groups of the finger that is required for proper folding and binding to DNA.
Acknowledgements
The authors gratefully acknowledge the gift of clones from Dr. David Setzer and Dr. Paul J. Romaniuk and their helpful discussions. The work of Mr. Shin Moteki on this project is appreciated. We thank Dr. Michael Reddy for discussions and Ms. Barbra Wimpee for technical support. This research was supported by NIH grants ES-04026 and ES-04184.
5. Abbreviations
- AAS
atomic absorption spectroscopy
- DTNB
5,5′-dithiobis-2-nitrobenzoic acid
- DTT
dithiotheitol
- EDTA
ethylenediaminetetraacetate
- EMSA
electrophoretic mobility shift assay
- HEPES
4-(2-hydroxylethyl) piperazine-1-sulfonic acid
- H2KTSM2
3-ethoxy-2-oxo-butyraldehyde-bis-(N4-dimethylthiosemicarbazone)
- ICR
internal control region DNA of the 5S ribosomal RNA gene
- Kd
metal ion dissociation constant
- MALDI-TOF-MS
matrix assisted laser desorption ionization time-of-flight mass spectrometry
- 2-ME
2-mercaptoethanol
- MTF-1
metallothionein transcriptional activator
- PAR
4-(2-pyridylazo)-resorcinol
- PMPS
ρ-mercuriphenylsulfonate
- TFIIIA
transcription factor IIIA
- ZI
zincon or 2-carboxy-2′-hydroxy-5′-sulfoformazylbenzene
- Zn–TFIIIA
TFIIIA with Zn2+ bound, a subscript, n, indicates specific number of Zn2+ associated with TFIIIA
References
- [1].Sakonju S, Bogenhagen DF, Brown DD. Cell. 1980;19:13–25. doi: 10.1016/0092-8674(80)90384-0. [DOI] [PubMed] [Google Scholar]
- [2].Bogenhagen DF, Sakonju S, Brown DD. Cell. 1980;19:27–35. doi: 10.1016/0092-8674(80)90385-2. [DOI] [PubMed] [Google Scholar]
- [3].Bieker JJ, Roeder RG. J. Biol. Chem. 1984;259:6158–6164. [PubMed] [Google Scholar]
- [4].Brown RS, Ser C, Argos P. FEBS Lett. 1985;186:271–274. doi: 10.1016/0014-5793(85)80723-7. [DOI] [PubMed] [Google Scholar]
- [5].Hanas JS, Hazuda DJ, Bogenhagen DF, Wu FY, Wu CW. J. Biol. Chem. 1983;258:14120–14125. [PubMed] [Google Scholar]
- [6].Miller J, McLachlan AD, Klug A. EMBO J. 1985;4:1609–1614. doi: 10.1002/j.1460-2075.1985.tb03825.x. [DOI] [PMC free article] [PubMed] [Google Scholar]
- [7].Berg JM. Proc. Natl. Acad. Sci. USA. 1988;85:99–102. doi: 10.1073/pnas.85.1.99. [DOI] [PMC free article] [PubMed] [Google Scholar]
- [8].Parraga G, Horvath S, Hood L, Young ET, Klevit RE. Science. 1988;241:1489–1492. doi: 10.1126/science.3047872. [DOI] [PubMed] [Google Scholar]
- [9].Lee M, Gippert GP, Soman KV, Case PA, Wright P. Science. 1989;245:635–637. doi: 10.1126/science.2503871. [DOI] [PubMed] [Google Scholar]
- [10].Omichinski JG, Clore GM, Appella E, Sakaguchi K, Gronenborn AM. Biochemistry. 1990;29:9324–9334. doi: 10.1021/bi00492a004. [DOI] [PubMed] [Google Scholar]
- [11].Pavletich NP, Pabo CO. Science. 1991;252:809–817. doi: 10.1126/science.2028256. [DOI] [PubMed] [Google Scholar]
- [12].Fairall L, Schwabe JWR, Chapman L, Finch JT, Rhodes D. Nature. 1993;366:483–487. doi: 10.1038/366483a0. [DOI] [PubMed] [Google Scholar]
- [13].Erickson M. Elrod, Rould MA, Neklukova L, Pabo CO. Structure. 1996;4:1171–1180. doi: 10.1016/s0969-2126(96)00125-6. [DOI] [PubMed] [Google Scholar]
- [14].Foster MP, Wuttke DS, Radhakrishnan I, Case DA, Gottesfeld JM, Wright PE. Nature Struct. Biol. 1997;4:605–608. doi: 10.1038/nsb0897-605. [DOI] [PubMed] [Google Scholar]
- [15].Narayan VA, Kriwacki RW, Caradonna JP. J. Biol. Chem. 1997;272:7801–7809. doi: 10.1074/jbc.272.12.7801. [DOI] [PubMed] [Google Scholar]
- [16].Kochoyan M, Keutmann HT, Weiss MA. Proc. Natl. Acad. Sci USA. 1991;88:8455–8459. doi: 10.1073/pnas.88.19.8455. [DOI] [PMC free article] [PubMed] [Google Scholar]
- [17].Berg JM. Ann. Rev. Biophys. Biophys. Chem. 1990;19:405–421. doi: 10.1146/annurev.bb.19.060190.002201. [DOI] [PubMed] [Google Scholar]
- [18].Makowski GS, Sunderman FW., Jr. J. Inorg. Biochem. 1992;48:107–119. doi: 10.1016/0162-0134(92)80020-v. [DOI] [PubMed] [Google Scholar]
- [19].Bittel D, Dalton T, Samson SL-A, Gedamu L, Andrews GK. J. Biol. Chem. 1998;273:7127–7133. doi: 10.1074/jbc.273.12.7127. [DOI] [PubMed] [Google Scholar]
- [20].Sunderman FW, Jr., Barber AM. Ann. Clin. Lab. Sci. 1988;18:267–288. [PubMed] [Google Scholar]
- [21].Predki PF, Sarkar B. J. Biol. Chem. 1992;267:5842–5846. [PubMed] [Google Scholar]
- [22].Posewitz MC, Wilcox DE. Chem. Res. Toxicol. 1995;8:1020–1028. doi: 10.1021/tx00050a005. [DOI] [PubMed] [Google Scholar]
- [23].Roesijadi G, Bogumil R, Vašák M, Kägi JHR. J. Biol. Chem. 1998;273:17425–17432. doi: 10.1074/jbc.273.28.17425. [DOI] [PubMed] [Google Scholar]
- [24].Petering DH, Huang M, Moteki S, Shaw CF., III Mar. Environ. Res. 2000;50:89–92. doi: 10.1016/s0141-1136(00)00099-4. [DOI] [PMC free article] [PubMed] [Google Scholar]
- [25].Razmiafshari M, Kao J, d’Avignon A, Zawia NH. Toxicol. Appl. Pharmacol. 2001;172:1–10. doi: 10.1006/taap.2001.9132. [DOI] [PubMed] [Google Scholar]
- [26].Hartwig A, Schwerdtle T. Toxicol. Lett. 2002;127:47–54. doi: 10.1016/s0378-4274(01)00482-9. [DOI] [PubMed] [Google Scholar]
- [27].Hanas JS, Gunn CG. Nucl. Acids Res. 1996;24:924–930. doi: 10.1093/nar/24.5.924. [DOI] [PMC free article] [PubMed] [Google Scholar]
- [28].Kuwahara J, Coleman JE. Biochemistry. 1990;29:8531–8627. doi: 10.1021/bi00489a019. [DOI] [PubMed] [Google Scholar]
- [29].Hanas JS, Rodgers JS, Bantle JA, Cheng YG. Mol. Pharmacol. 1999;56:982–988. doi: 10.1124/mol.56.5.982. [DOI] [PubMed] [Google Scholar]
- [30].Payne JC, ter Horst MA, Godwin HA. J. Am. Chem. Soc. 1999;121:5685–6850. [Google Scholar]
- [31].Krepkiy D, Försterling H, Petering DH. submitted for publication.
- [32].Wuttke DS, Foster MP, Case DA, Gottesfeld JM, Wright PE. J. Mol. Biol. 1997;273:183–206. doi: 10.1006/jmbi.1997.1291. [DOI] [PubMed] [Google Scholar]
- [33].Nolte RT, Conlin RM, Harrison SC, Brown RS. Proc. Natl. Acad. Sci. USA. 1998;95:2938–2943. doi: 10.1073/pnas.95.6.2938. [DOI] [PMC free article] [PubMed] [Google Scholar]
- [34].Del Rio S, Setzer DR. Nucl. Acids Res. 1991;19:6197–6203. doi: 10.1093/nar/19.22.6197. [DOI] [PMC free article] [PubMed] [Google Scholar]
- [35].Bradford MM. Anal. Biochem. 1976;72:248–254. doi: 10.1016/0003-2697(76)90527-3. [DOI] [PubMed] [Google Scholar]
- [36].Zweib C, Brown RS. Nucl. Acid Res. 1990;18:583–587. doi: 10.1093/nar/18.3.583. [DOI] [PMC free article] [PubMed] [Google Scholar]
- [37].Laib JE, Shaw CF, III, Petering DH, Eidsness MK, Elder RC, Garvey JS. Biochemistry. 1985;24:1977–1986. doi: 10.1021/bi00329a027. [DOI] [PubMed] [Google Scholar]
- [38].Shaw CF, III, Laib JE, Savas MM, Petering DH. Inorg. Chem. 1990;29:403–408. [Google Scholar]
- [39].Solaiman D, Saryan LA, Petering DH. J. Inorg. Biochem. 1979;20:135–146. doi: 10.1016/s0162-0134(00)81013-2. [DOI] [PubMed] [Google Scholar]
- [40].Sambrook J, Fritsch EF, Maniatis T, editors. Molecular Cloning, A Laboratory Manual. second ed Cold Spring Harbor Laboratory Press; New York: 1989. [Google Scholar]
- [41].Munoz A, Laib F, Petering DH, Shaw CF., III J. Biol. Inorg. Chem. 1999;4:495–507. doi: 10.1007/s007750050335. [DOI] [PubMed] [Google Scholar]
- [42].Ellman GL. Arch. Biochem. Biophys. 1958;764:443–450. doi: 10.1016/0003-9861(58)90014-6. [DOI] [PubMed] [Google Scholar]
- [43].Michael SF, Kilfoil VJ, Schmidt MH, Amann BT, Berg JM. Proc. Natl. Acad. Sci. USA. 1992;89:4796–4800. doi: 10.1073/pnas.89.11.4796. [DOI] [PMC free article] [PubMed] [Google Scholar]
- [44].Diakun GP, Fairall L. A. Klug, Nature. 1986;324:698–699. doi: 10.1038/324698a0. [DOI] [PubMed] [Google Scholar]
- [45].Shang Z, Liao YD, Wu FY, Wu CW. Biochemistry. 1989;28:9790–9795. doi: 10.1021/bi00451a037. [DOI] [PubMed] [Google Scholar]
- [46].Han MK, Cyran FP, Fisher MT, Kim SH, Ginsberg A. J. Biol. Chem. 1990;265:13792–13799. [PubMed] [Google Scholar]
- [47].Huang M, Shaw CF, III, Petering DH. J. Inorg. Biochem. 2004;98 doi: 10.1016/j.jinorgbio.2004.02.004. <doi:10.1016/j.jinorgbio.2004.02.004>. [DOI] [PMC free article] [PubMed] [Google Scholar]
- [48].Liao X, Clemens KR, Tennant L, Wright PE, Gottesfeld JM. J. Mol. Biol. 1992;223:857–871. doi: 10.1016/0022-2836(92)90248-i. [DOI] [PubMed] [Google Scholar]
- [49].Hanas JS, Duke AL, Gaskins CJ. Biochemistry. 1989;28:4083–4088. doi: 10.1021/bi00435a068. [DOI] [PubMed] [Google Scholar]
- [50].Chen X, Agarwal A, Gierdroc DP. Biochemistry. 1998;37:11152–11161. doi: 10.1021/bi980843r. [DOI] [PubMed] [Google Scholar]
- [51].Clemens KR, Liao X, Wolf V, Wright PE, Gottesfeld JM. J. Mol. Bol. 1992;244:23–35. doi: 10.1006/jmbi.1994.1701. [DOI] [PubMed] [Google Scholar]
- [52].Outten CE, O’Halloran TV. Science. 2001;292:2488–2492. doi: 10.1126/science.1060331. [DOI] [PubMed] [Google Scholar]
- [53].Krepkiy D, Antholine WE, Myers C, Petering DH. Mol. Cell. Biochem. 2001;222:213–219. [PubMed] [Google Scholar]
- [54].Razmiafshari M, Kao j., d’Avignon A, Zawia NH. Toxicol. Appl. Pharmacol. 2001;172:1–10. doi: 10.1006/taap.2001.9132. [DOI] [PubMed] [Google Scholar]
- [55].Razmiafshari M, Zawia NH. Toxicol. Appl. Pharmacol. 2000;166:1–12. doi: 10.1006/taap.2000.8950. [DOI] [PubMed] [Google Scholar]