Since the decoding of the human genome, the need to obtain more and more molecular information from smaller and smaller samples is intensifying. Biosystem-analysis, disease diagnosis, and biomedical studies all require the tracking of spatio-temporal information from multiple targets, involving proteins, genes, lipids and glycans for target pattern recognition and system definition. Multiplexed assays are therefore required in order to complement advances in genomics and proteomics, and to allow a large number of nucleic acids and proteins to be rapidly screened.[1–4]
Optical encoding technologies achieved by multiplexing colors and fluorescence intensities of fluorophores have become an attractive strategy because a large number of high-brightness probes can be readily produced. Both fluorescent dye[5–10] and quantum dot[11–21] embedded multiplexed microspheres offer advantages such as flexibility in target selection, fast binding kinetics, and well controlled binding conditions. Unfortunately, because of the large size (typically 1–15 μm in diameter), quenching and relatively broad wavelength spectral response, these multicolor microspheres have limitations for applications such as gene, protein, and cell system labeling. Toward the development of uniform nanobarcode materials in the nanometer regime, a few successful attempts have been made. The most common reaction schemes include encapsulation of fluorescent dyes and quantum dots in silica nanobeads,[5,7,22] hydrogels,[23] and surfactant micelles.[24]
For dye-doped nanobarcodes,[5,7] measurements of intensities and their ratios are inherently difficult, which limits the number of levels at which a dye can be incorporated to give distinguishable beads. If the dyes have different excitation wavelengths then multiple excitation lasers are required, which increases the cost of the decoding instrument, and when the emission spectra overlap radiative and/or nonradiative energy transfer may complicate the code.[1] Quantum dot-doped nanobarcodes offer significant advantages over conventional fluorescent dye-doped ones because they are more photostable and have narrower emission linewidths.[24] However, most of the quantum dots are made of toxic materials (e.g., CdS, CdSe, CdTe), “blink”, and the difficulties in distinguishing between codes based on different amounts of the same quantum dots are similar to those for organic dyes.[1–3] Furthermore, for multiplexed detection a reporter dye is required and the region of the spectrum that is occupied by its emission profile is not available for encoding, so that the optical interference of organic reporter tags that have excitations in the visible or UV is still a major problem. Finding a more appropriate luminescent encoding species remains a challenging task and is crucial for the development of modern gene technology, biosystem spatio-temporaal analysis and medical sciences.
An attractive alternative approach to this problem makes use of the upconversion generation of rare earth emission lines. With upconversion, the rare earth ions can be excited in the tissue transparent infrared region instead of at UV and visible frequencies to give emission in the visible or infrared domains.[25–40] Triply ionized RE ions in hosts typically have emission line widths of ~10–20 nm (full width at half maximum, FWHM) in the visible portion of the spectrum, which is about half that observed for quantum dots (25–40 nm) and much narrower than that observed for organic dyes (30–50 nm).[26,27] This feature allows more resolvable bands to be packed into the same spectral bandwidth, enabling a larger number of distinct combinations. The creation of optical barcodes from ratiometric upconverting rare earth emission was first reported in 2004[4] where it was noted that the relative fluorescent intensity ratios of the well-separated, narrow rare earth emission lines could be measured much more accurately than emission from organic dyes or quantum dots. Furthermore, compared to the measurements of absolute intensity values, the ratiometric measurements eliminate effects such as particle size and shape, optical geometry or laser power providing increased accuracy and precision and thereby increasing the number of usable optical codes. In addition to the upconverting materials reported here, even larger numbers of optical codes can be created from multicolor rare earth downconverting materials[27] where the generation of >1010 optical codes was statistically demonstrated in a 6-color emitter system.
The upconversion nanobarcodes (UPNBs) described in this work are uniform sub-100 nm Y2O3:Yb,Ho,Tm@Y2O3@SiO2(COO−) core/shell nanoparticles (NPs). These UPNBs show a high chemical stability, high quantum yields, and low toxicity, and their optical properties can be tuned by variation of lanthanide dopants and the host matrix.[25] All of the lanthanide cations are embedded in a well-defined unit that can be well-characterized; and retain their structural and optical properties over time. In particular, it is extremely important to note that there is no optical cross talk between the upconversion optical code and any reporter dyes. The midrange IR radiation used to excite the upconversion materials does not excite dyes that absorb in the visible and UV region and, conversely, the upconversion materials are not excited by the visible lasers used to excite the organic dyes. All these favorable properties suggest a high impact potential of UPNBs in multiplexed detection.
This is one example of a composition optimized for efficient upconversion and multicolor encoding. UPNBs were synthesized in two steps.[32,33] During the first step, Y2O3:Yb,Ho,Tm@Y2O3 core/shell NPs were formed by the homogeneous precipitation and calcination processes. The Y2O3 shell, with a lattice constant similar to that of the mixed RE composition Y2O3:Yb,Ho,Tm core structure, protects the luminescent lanthanide ions in the core (especially those near the surface) from non-radiative decay caused by surface defects as well as from vibrational deactivation from solvents or surface-bound ligands in the case of colloidal dispersions. In the next post-coating procedure carboxylated SiO2 is formed around the Y2O3:Yb,Ho,Tm@Y2O3 NPs.[7, 22] The carboxyl groups present on the UPNB surface are particularly suitable for coupling reactions with polypeptides or biological molecules. SEM images of Y2O3:Yb,Ho,Tm@Y2O3 NPs show uniform solid spheres with smooth surfaces and sub- 100 nm diameters of ~80±5 nm (Figure 1a). XRD results reveal that the UPNBs are cubic phase Y2O3 (space group Ia3 (206)) with lattice constant a = 10.50 Å. The broadening of the diffraction peaks confirms that mono-dispersed nanospheres are composed of the primary small particles (3–20 nm) (Figure S1). TEM images show that each solid nanosphere is composed of many small nanocrystals, with a size distribution of about 5–15 nm (Figure 1a inset). HRTEM results based on the crystal fringes reveal that the distances between the adjacent crystal fringes have the same value, 0.306 nm, which can be assigned to the {222} crystal plane of the Y2O3 bcc phase (Figure 1b). The specific surface areas have been confirmed to be 25.6 m2 g−1 by BET measurement. This result also supports the secondary structure of the Y2O3 nanosphere and explains why the measured specific surface areas are much higher than that calculated for an isotropci single crystal of identical volume (7.3 m2 g−1).[33] SEM and TEM images of the Y2O3:Yb,Ho,Tm@Y2O3@SiO2(COO−) show a uniform SiO2 shell with a thickness of about 15 nm (Figure 1c, d).
Figure 1.
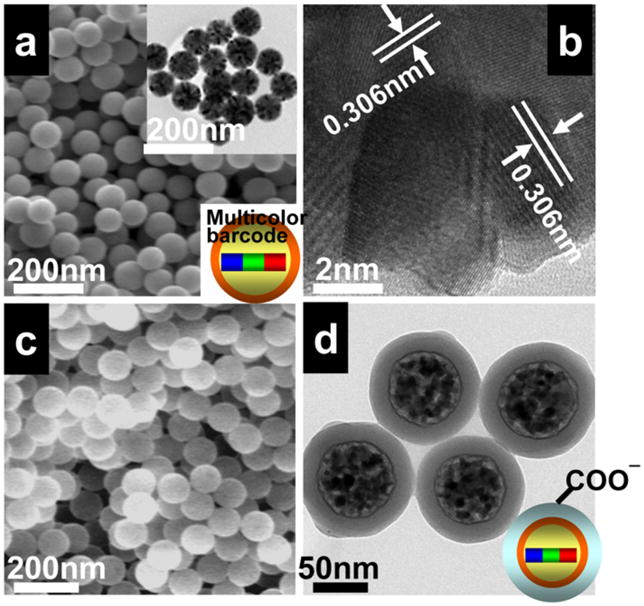
(a) SEM image of Y2O3:Yb,Ho,Tm@Y2O3 UPNBs nanospheres; inset: TEM image of Y2O3:Yb,Ho,Tm@Y2O3 nanospheres; (b) HRTEM images of the Y2O3:Yb,Ho,Tm@Y2O3 nanocrystal composed in the nanospheres, showing the primary small nanocrystals is composed in the nanosphere. SEM (c) and TEM (d) images of Y2O3:Yb,Ho,Tm@Y2O3@SiO2(COO−) UPNB nanospheres.
Figure 2 shows the fluorescence spectra of UPNBs obtained after 980-nm optical excitation. By varying the rare earth composition and the doping amount, UPNBs with unique spectral signatures can be created. Since the multiple narrow band rare earth emitters display far less spectral overlap than quantum dots or organic dyes, it is possible to measure their relative fluorescent intensity very accurately. This allows the resolution of a very large number of ratiometric optical codes or optical signatures. We demonstrated that code fine-tuning can be alternatively achieved via the three-component dopant UPNB system (Y2O3:Yb/Ho/Tm) (Figure S1) in a multi-photon emission process (Figure 2). The co-doped Y2O3:25 %Yb/0.2 %Tm system exhibits a blue color emission, resulting from 1D2 → 3F4 and 1G4 → 3H6 transitions.[28] By adding a second emitter (Ho3+) with different concentrations to the system, the relative intensity ratio of the dual emissions can be precisely controlled. For example, variations in the Ho3+ concentration (0.2–2.0 %) lead to prominent changes in the green ((2H11/2, 4S3/2) → 4I15/2) and red (4F9/2 →4I15/2) spectral region (Figure 2a–d). [28] Furthermore, variations in the Yb3+ concentration for Y2O3: 15 – 20 %Yb/0.2 %Tm/0.2 %Ho3+ also lead to changes in the green ((2H11/2, 4S3/2) → 4I15/2) and red (4F9/2 → 4I15/2) spectral regions (Figure 2d–f). Consequently, the adjustable balance of emission intensities allows the tri-doped particle system to display tunable color output from blue to green (Figure 2). The fluorescence intensities of the various emissions within a bead relative to one emission acting as an internal standard gives n optical codes for n colors. The number of codes increases exponentially when multiple wavelengths and multiple intensities are used at the same time. For example, a 3-color/10-intensity scheme yields 999 codes. In general, n intensity levels with m colors generate (nm – 1) unique codes.
Figure 2.
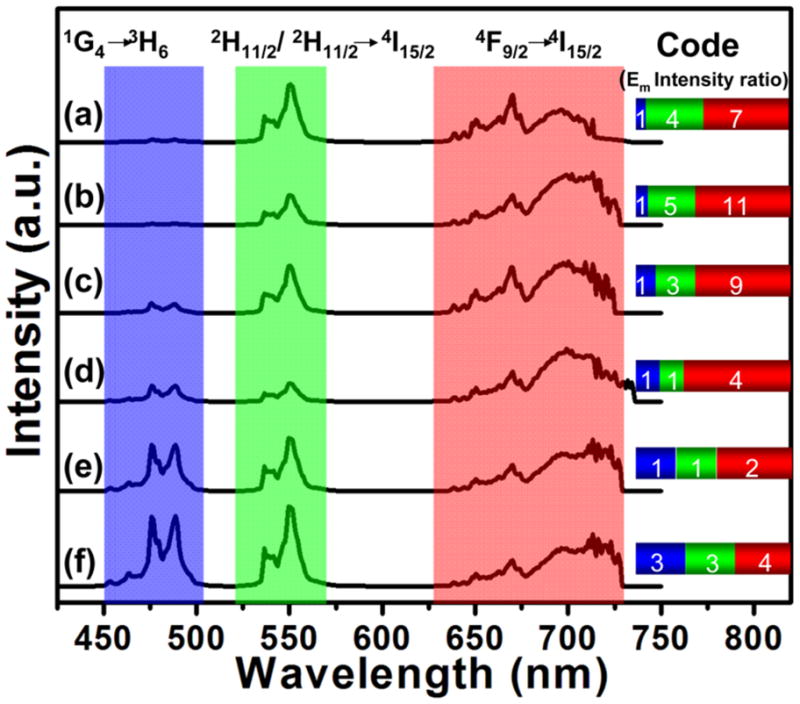
Fluorescence signals obtained from Y2O3:Yb,Ho,Tm@Y2O3@SiO2(COO−) UPNBs (Yb/Tm/Ho = 25/0.2/0.2 (a), 25/0.2/0.5 (b), 25/0.2/1.0 (c), 25/0.2/2.0 (d), 20/0.2/2.0 (e) and 20/0.2/2.0 mol % (f)). Both absolute intensities and relative intensity ratios at different wavelengths are used for coding purposes; for example (147), (139) and (334) are distinguishable codes.
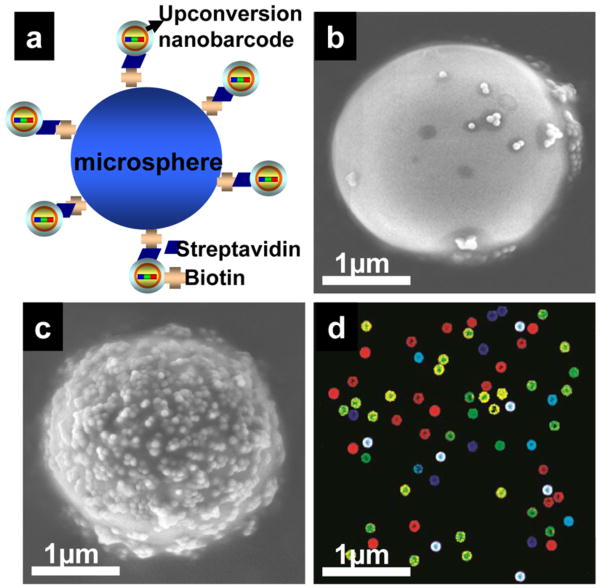
To demonstrate the biobarcoding capabilities of multicolor UPNBs, a streptavidin-biotin binding assay was employed (Figure 3a). Carboxyl-functionalized UPNBs were reacted to attach streptavidin. Amine-functionalized microspheres were reacted with the NHS-PEG5000-biotin to couple biotin molecules to the microspheres. Biotin-coated microspheres and streptavidin-functionalized UPNBs were then mixed at a 1:40000 ratio to ensure sufficient saturation of the microsphere surface. SEM (Figure 3b, c) and confocal images (Figure 3d) of the microsphere-UPNB complexes showed that biotin-coated microspheres were densely covered with streptavidin-labeled UPNBs and revealed the coding colors of the attached UPNBs.
Figure 3.
SEM images of biotinylated microspheres with (a) streptavidin-coated UPNBs and (c) bare UPNBs. (b) Scheme for the conjugation of biotinylated microspheres with streptavidin-coated UPNBs. (d) Confocal fluorescence image of a mixture of five types of microsphere-UPNB complexes under 980-nm laser excitation.
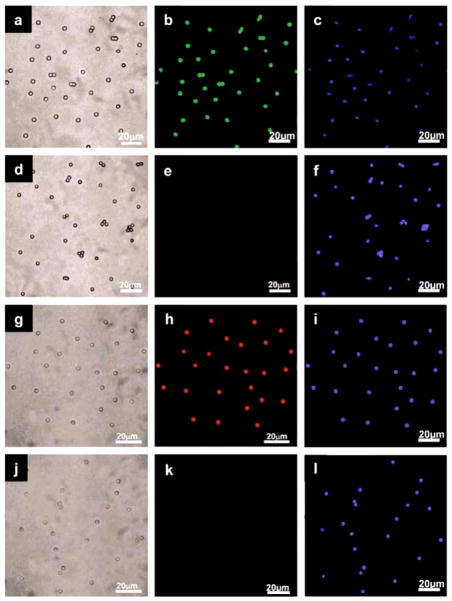
In order to demonstrate the use of UPNBs for biological multiplexed assays, a model multiplexed immunoassay system was designed using antibody-conjugated UPNBs and secondary antibody-coated microspheres (Figure 4).[7,24,41] Mouse lgG and rabbit lgG were conjugated to different UPNBs using a carbodiimide-based approach. Cascade blue-labeled goat anti-mouse lgG and cascade blue-labeled goat anti-rabbit lgG were immobilized onto microsphere in a similar method. The UPNB/microsphere interaction simulates the recognition process between conjugated UPNBs and potential receptors/antigens on the surface of a cell or bacterium. Two sets of antibody-modified UPNBs with different upconversion coding signal and two sets of secondary antibody-coated microspheres were cross-reacted. The optimized molar ratio of UPNBs to microspheres was determined to be 600:1. Specific binding between anti-mouse lgG-microspheres with mouse lgG-UPNBs (Figure 5a, b) and specific binding between anti-rabbit lgG-microspheres with rabbit lgG-UPNBs (Figure 5g, h) were observed from the confocal images under 980 nm laser excitation. In contrast, nonspecific binding between anti-mouse lgG-microspheres with rabbit lgG-UPNBs (Figure 5d, e) and nonspecific binding between anti-rabbit lgG-microspheres with mouse lgG-UPNBs (Figure 5j, k) cannot be observed from the confocal images under 980 nm laser excitation. The cascade blue label could also be observed from the confocal images under 400 nm laser excitation (Figure 5c, f, i, l). These results further demonstrate the upconversion coding signals arose from the specific binding between the UPNBs and microspheres, not the aggregates of the UPNBs. In particular, it is extremely important to note that there is no optical cross talk between the upconversion optical code and the cascade blue label. The midrange IR radiation used to excite the upconversion materials does not excite dyes that absorb in the visible region (Figure 5e, k) and, conversely, the upconversion materials are not excited by the visible lasers used to excite the organic dyes (Figure 5c, f, i, l). Furthermore, the cascade blue label could be replaced by other organic dyes in a wide excitation and emission range.
Figure 4.
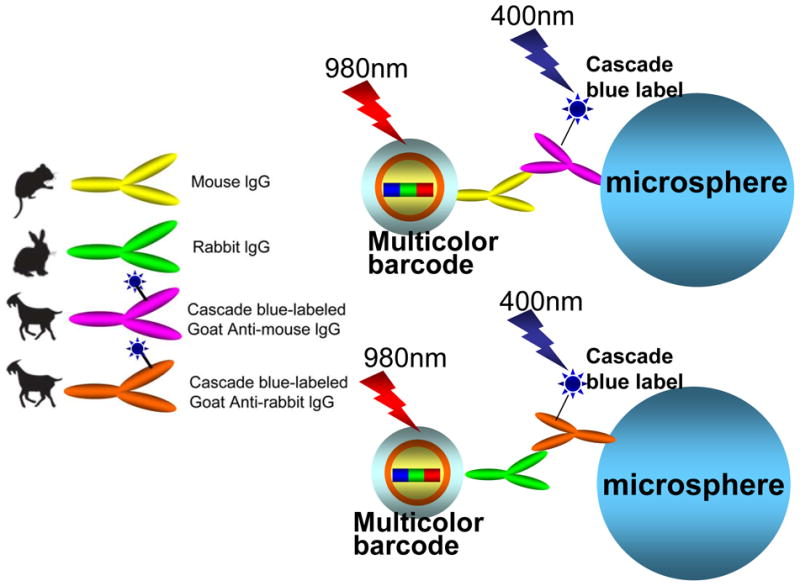
Scheme for the conjugation of antibody-UPNBs with secondary-antibody microspheres.
Figure 5.
Confocal luminescence images of microsphere-UPNBs complexes under 400 nm (c, f, i, l) (for cascade blue dye) and 980 nm (b, e, h, k) (for UPNBs with different codes) laser excitatioin: specific (a–c) and nonspecific (d–e) binding between cascade blue labeled goat anti-mouse lgG with mouse lgG conjugated UPNBs (code number: 147); specific (g–i) and nonspecific (j–l) binding between cascade blue labeled goat anti-rabbit lgG with rabbit lgG conjugated UPNBs (code number: 114).
In conclusion, we have successfully developed RE ions doped upconversion nanobarcodes (≤ 90 nm) for multiplexed signaling and bioanalysis. These NPs can be easily labeled with biomolecules and possess optical encoding capability. In comparison to the downconversion target materials (organic dye or quantum dots), the upconversion encoded materials provide important advantages. Because there is no optical cross talk between the upconversion optical code and any reporter dyes under different excitation condition, the target labels can be selected over a wide emission range. In addition, the number of codes can be substantially increased because the code emission range has been widened greatly. This kind of novel nanobarcode material can be used for rapid and sensitive analysis of antigens and nucleic acids, and have many potential applications in clinical, food, and environment detection.
Supplementary Material
Footnotes
This work was supported by the Fudan Startup Foundation for Advanced Talents under award no. EYH1615071 and National Science Foundation under award no. DMR 08-05148. The effort at Parallel Synthesis Technologies was supported by Grant Numbers 2R44HG003911 and 2R44HG003479 from the National Human Genome Research Institute (NHGRI) at NIH. The content is solely the responsibility of the authors and does not necessarily represent the official views of NHGRI or NIH.
Supporting Information is available on the WWW under http://www.small-journal.com or from the author.
Contributor Information
Prof. Fan Zhang, Email: zhang_fan@fudan.edu.cn, Department of Chemistry, and Laboratory of Advanced Materials, Fudan University, Shanghai 200433, P. R. China
Dr. Robert C. Haushalter, Parallel Synthesis Technologies, Santa Clara CA 95051
Dr. Robert W. Haushalter, Parallel Synthesis Technologies, Santa Clara CA 95051
Dr. Yifeng Shi, Department of Chemistry and Biochemistry, University of California Santa Barbara, CA 93106-9510
Mr. Yichi Zhang, Department of Chemistry and Biochemistry, University of California Santa Barbara, CA 93106-9510
Dr. Kunlun Ding, Department of Chemistry and Biochemistry, University of California Santa Barbara, CA 93106-9510
Prof. Dongyuan Zhao, Department of Chemistry, and Laboratory of Advanced Materials, Fudan University, Shanghai 200433, P. R. China
Prof. Galen D. Stucky, Email: stucky@chem.ucsb.edu, Department of Chemistry and Biochemistry, University of California Santa Barbara, CA 93106-9510
References
- 1.Wilson R, Cossins AR, Spiller DG. Angew Chem Int Ed. 2006;45:6104. doi: 10.1002/anie.200600288. [DOI] [PubMed] [Google Scholar]
- 2.Finkel NH, Lou XH, Wang CY, He L. Anal Chem. 2004;46:353A. doi: 10.1021/ac0416463. [DOI] [PubMed] [Google Scholar]
- 3.Rao RS, Visuri SR, McBride MT, Albala JS, Mathews DL, Coleman MA. J Lab Med. 2003;27:182. [Google Scholar]
- 4.Haushalter RC. 20050136486 A1 US Patent Application.
- 5.Kellar KL, Douglass JP. J Immunol Methods. 2003;279:277. doi: 10.1016/s0022-1759(03)00248-5. [DOI] [PubMed] [Google Scholar]
- 6.Morgan E, Varro R, Sepulveda H, Ember JA, Apgar J, Wilson J, Lowe L, Chen R, Shivraj L, Agadir A, Campos R, Ernst D, Gaur A. Clin Immunol. 2004;110:252. doi: 10.1016/j.clim.2003.11.017. [DOI] [PubMed] [Google Scholar]
- 7.Wang L, Tan WH. Nano Lett. 2006;6:84. doi: 10.1021/nl052105b. [DOI] [PMC free article] [PubMed] [Google Scholar]
- 8.Dasso J, Lee J, Bach H, Mage RG. J Immunol Med. 2002;263:23. doi: 10.1016/s0022-1759(02)00028-5. [DOI] [PubMed] [Google Scholar]
- 9.Luo Y. Curr Opin Mol Ther. 2005;7:251. [PubMed] [Google Scholar]
- 10.Krutzik PO, Nolan GP. Nat Med. 2006;3:361. doi: 10.1038/nmeth872. [DOI] [PubMed] [Google Scholar]
- 11.Han MY, Gao XH, Su JZ, Nie S. Nat Biotechnol. 2001;19:631. doi: 10.1038/90228. [DOI] [PubMed] [Google Scholar]
- 12.Gao XH, Su JZ, Nie S. Anal Chem. 2004;76:2406. doi: 10.1021/ac0354600. [DOI] [PubMed] [Google Scholar]
- 13.O’Brien P, Cummins SS, Darcy D, Dearden A, Masala O, Pickett NL, Ryley S, Sutherland AJ. Chem Commun. 2003:2532. doi: 10.1039/b307500a. [DOI] [PubMed] [Google Scholar]
- 14.Li Y, Liu ECY, Pickett N, Skabara PJ, Cummins SS, Ryley S, Sutherland AJ, O’Brien P. J Mater Chem. 2005:15,1238. [Google Scholar]
- 15.Xu HX, Sha MY, Wong EY, Uphoff J, Xu YH, Treadway JA, Truong A, O’Brien E, Asquith S, Stubbins M, Spurr NK, Lai EH, Mahoney W. Nucleic Acids Res. 2003;31:e43. doi: 10.1093/nar/gng043. [DOI] [PMC free article] [PubMed] [Google Scholar]
- 16.Wu CL, Zheng JS, Huang CB, Lai JP, Li SY, Chen C, Zhao YB. Angew Chem Int Ed. 2007;46:5393. doi: 10.1002/anie.200700847. [DOI] [PubMed] [Google Scholar]
- 17.Lee JJA, Mardyani S, Hung A, Rhee A, Klostranec J, Mu Y, Li D, Chan WCW. Adv Mater. 2007;19:3113. [Google Scholar]
- 18.Rauf S, Glidle A, Cooper JM. Adv Mater. 2009;21:4020. [Google Scholar]
- 19.Yang J, Dave SR, Gao XH. J Am Soc Chem. 2008;130:5286. doi: 10.1021/ja710934v. [DOI] [PMC free article] [PubMed] [Google Scholar]
- 20.Chan WCW, Maxwell DJ, Gao XH, Bailey RE, Han MY, Nie SM. Curr Opin Biotechnol. 2002;13:40. doi: 10.1016/s0958-1669(02)00282-3. [DOI] [PubMed] [Google Scholar]
- 21.Egner BJ, Rana S, Smith H, Bouloc N, Frey JG, Brocklesby WS, Bradley M. Chem Commun. 1997:735. [Google Scholar]
- 22.Yan JL, Estevez MC, Smith JE, Wang K, He XX, Wang L, Tan WH. Nanotoday. 2007;2:735. [Google Scholar]
- 23.Kuang M, Wang DY, Bao HB, Gao MY, Mohwald H, Jiang M. Adv Mater. 2005;17:267. [Google Scholar]
- 24.Yang J, Dave SR, Gao XH. J Am Chem Soc. 2008;130:5682. doi: 10.1021/ja710934v. [DOI] [PMC free article] [PubMed] [Google Scholar]
- 25.Wang F, Liu XG. Chem Soc Rev. 2009;38:976. doi: 10.1039/b809132n. [DOI] [PubMed] [Google Scholar]
- 26.Dejneka MJ, Streltsov A, Pal S, Frutos AG, Yost K, Yuen PK, Muller U, Lahiri J. Proc Natl Acad Sci USA. 2003;100:389. doi: 10.1073/pnas.0236044100. [DOI] [PMC free article] [PubMed] [Google Scholar]
- 27.Haushalter RW, Haushalter RC. 20090159510 A1 US Patent Application. ; Haushalter RC. 20090218805 A1 US Patent Application.
- 28.Auzel F. Chem Rev. 2004;104:139. doi: 10.1021/cr020357g. [DOI] [PubMed] [Google Scholar]
- 29.Downing E, Hesselink L, Ralston J, Macfarlane R. Science. 1996;273:1185. [Google Scholar]
- 30.Van D, Rijke F, Zijlmans H, Li S, Vail T, Raap AK. Nature Biotechnol. 2001;19:273. doi: 10.1038/85734. [DOI] [PubMed] [Google Scholar]
- 31.Zhang F, Wan Y, Ying T, Zhang FQ, Shi YF, Xie SH, Li YG, Xu L, Tu B, Zhao DY. Angew Chem Int Ed. 2007;46:7976–7979. doi: 10.1002/anie.200702519. [DOI] [PubMed] [Google Scholar]
- 32.Zhang F, Shi YF, Braun GB, Zhang YC, Sun XH, Reich NO, Zhao DY, Stucky GD. J Am Chem Soc. 2010;132:2850. doi: 10.1021/ja909108x. [DOI] [PubMed] [Google Scholar]
- 33.Zhang F, Shi YF, Song XH, Zhao DY, Stucky GD. Chem Mater. 2009;21:5237. [Google Scholar]
- 34.Wang L, Yan RX, Hao ZY, Wang L, Li YD. Angew Chem Int Ed. 2006;44:6054. [Google Scholar]
- 35.Heer S, Kompe K, Gudel HU, Haase M. Adv Mater. 2004;16:2102. [Google Scholar]
- 36.Mai HX, Zhang YW, Si R, Yan ZG, Yan CH. J Am Chem Soc. 2006;128:6426. doi: 10.1021/ja060212h. [DOI] [PubMed] [Google Scholar]
- 37.Boyer JC, Cuccia V, Cuccia LA, Capobianco JA. J Am Chem Soc. 2006;128:7444. doi: 10.1021/ja061848b. [DOI] [PubMed] [Google Scholar]
- 38.Yi GS, Lu HC, Zhao SY, Yue G, Yang WJ. Nano Lett. 2004;4:2191–2196. [Google Scholar]
- 39.Li ZQ, Zhang Y, Jiang S. Adv Mater. 2009;21:4768. [Google Scholar]
- 40.Zhou J, Yu MX, Sun Y, Zhang XZ, Zhu XJ, Wu ZH, Wu DM, Li FY. Biomaterials. 2011;32:1148–1156. doi: 10.1016/j.biomaterials.2010.09.071. [DOI] [PubMed] [Google Scholar]
- 41.Sukhanova A, Nabiev I. Crit Rev Oncol Hemat. 2008;68:39. doi: 10.1016/j.critrevonc.2008.05.006. [DOI] [PubMed] [Google Scholar]
Associated Data
This section collects any data citations, data availability statements, or supplementary materials included in this article.


