

Abstract
Nanomaterials possess distinctive physicochemical properties (e.g., small sizes, high surface area-to-volume ratios) and promise a wide variety of applications, ranging from design of high quality consumer products to effective disease diagnosis and therapy. These properties can lead to toxic effects, potentially hindering advance in nanotechnology. In this study, we have synthesized and characterized purified and stable (non-aggregation) silver nanoparticles (Ag NPs, 41.6±9.1 nm in average diameters), and utilized early-developing (cleavage-stage) zebrafish embryos (critical aquatic and eco- species) as in vivo model organisms to probe diffusion and toxicity of Ag NPs. We found that single Ag NPs (30–72 nm diameters) passively diffused into the embryos through chorionic pores via random Brownian motion and stayed inside the embryos throughout their entire development (120 hours-post-fertilization, hpf). Dose and size dependent toxic effects of the NPs on embryonic development were observed, showing the possibility of tuning biocompatibility and toxicity of the NPs. At lower concentrations of the NPs (≤ 0.02 nM), 75–91% of embryos developed to normal zebrafish. At the higher concentrations of NPs (≥ 0.20 nM), 100% of embryos became dead. At the concentrations in between (0.02–0.2 nM), embryos developed to various deformed zebrafish. Number and sizes of individual Ag NPs embedded in tissues of normal and deformed zebrafish at 120 hpf were quantitatively analyzed, showing deformed zebrafish with higher number of larger NPs than normal zebrafish, and size-dependent nanotoxicity. By comparing with our previous studies of smaller Ag NPs (11.6±3.5 nm), the results further demonstrate striking size-dependent nanotoxicity that, at the same molar concentration, the larger Ag NPs (41.6±9.1 nm) are more toxic than the smaller Ag NPs (11.6±3.5 nm).
Keywords: In vivo optical imaging, single nanoparticle imaging and plasmonic spectroscopy, nanotoxicity, zebrafish embryos
Introduction
Nanomaterials exhibit distinctive physicochemical properties, which lead to their unique functions and wide varieties of potential applications.1–5 For example, their tiny sizes enable them to penetrate into living organisms. Their large surface areas permit effective surface modification with desired molecules for sensing and carrying huge payload of therapeutic agents for effective treatments. However, their large surface areas lead to unusually high reactivity, which potentially enables them to interact with vital biomolecules (e.g., proteins and nuclei acids) and affect their functions, and causes adverse effects on living organisms. Such concerns have inspired a wide variety of studies on nanotoxicity. 6–10
Unlike any conventional chemicals, nanomaterials are highly heterogeneous, and none of individual NPs has the identical physicochemical properties (e.g., size, shapes, surface areas, optical properties). Furthermore, nanomaterials are highly dynamic systems. They can alter over time and behavior extraordinarily different upon their surrounding environments (e.g., medium). Thus, each NP is virtually distinctive, and its physicochemical properties and its effects on living organisms can alter over time. These unique properties make conventional ensemble measurements and assays that have been widely used in toxicology studies unsuited for characterization of nanotoxicity.
Unfortunately, conventional ensemble toxicology methods and assays are currently widely used in nanotoxicity studies.10–17 They are unable to characterize doses and physicochemical properties of nanomaterials in vivo in situ in real time at single NP resolution with meaningful spatial and temporal resolutions. Majority of studies treated nanomaterials as conventional chemicals and used unpurified, unstable or functionalized nanomaterials, and did not consider their distinctive dynamic physicochemical properties, and potential effects of residual chemicals involved in nanomaterial preparation,11–15 leading to inconclusive and controversial results. Typically, nanomaterials were injected into living organisms, which are highly invasive and their transport pathways into living organisms cannot be determined.18–19 Therefore, despite extensive studies, their potential effects on living organisms remain essentially unknown.
Ag NPs exhibit a wide variety of potential applications and have served as therapeutic agents, ultrasensitive optical imaging probes, and catalysis. 20–22 Ag NPs have also been increasingly used in consumer products (e.g., socks, home appliances, water treatment, and disinfection).23–24 Potential release of nanomaterials into aquatic environments would lead to a direct impact on human health, due in part to human consumption of fish and their ability to bioconcentrate trace contaminants from environment, and our inability of effectively removing nanomaterials from drinking water. Thus, it is crucial to study their potential nanotoxicity and environment impacts.
Zebrafish (Danio rerio) embryos can serve as an important aquatic model organism to monitor ecosystems (e.g., rivers, ocean). They have distinctive advantageous over other in vivo model organisms (e.g., mouse, rat, human).25–27 For instance, their early embryonic development is completed rapidly (within 120 h) with well-defined developmental stages. The embryos are transparent, which enables real-time study of transport and effects of NPs on embryonic development, and direct imaging of pathological and mal-development phenotypes in vivo. 9,28–29 Notably, zebrafish possesses similar genetic phenotypes and drug binding sites to those in human, and has been used as in vivo model organisms for screening of efficacies of therapeutic agents and toxicities of conventional chemicals. 30–31 Furthermore, massive amount of zebrafish embryos can be generated rapidly at very low cost, permitting them to serve as an inexpensive in vivo assay to screen biocompatibility, pharmacological efficacy, and toxicity of nanomaterials.9,28–29 However, zebrafish embryos have not yet been widely used as standard in vivo assays (model organisms) for screening of biocompatibility and toxicity of nanomaterials, even though several recent reports describe the study of nanotoxicity in zebrafish embryos.9–10,16–17,28
Unlike our previous studies,9,28 other studies used ensemble measurements, used unpurified Ag NPs, and did not characterize physicochemical properties of individual NPs in vivo in situ in real time.10,16–17 As described above, physicochemical properties of individual Ag NPs are not identical and they can alter over course of their incubation with living organisms (e.g., zebrafish embryos). Thus, it is insufficient for one to characterize physicochemical properties of NPs at the initial point of the experiment. It is essential to use new detection means to monitor and characterize sizes of individual NPs in vivo in situ in real time, in order to meaningfully characterize dose and size dependent nanotoxicity.
Noble metal nanoparticles (e.g., Ag NPs) exhibit distinctive plasmonic optical properties, which depend upon their sizes, shapes, dielectric constants, and surrounding environments.32–36 Thus, localized surface plasmonic (LSPR) spectra of single Ag NPs can be used to determine sizes, shapes, surface properties, and surrounding environments of single Ag NPs. High quantum yields (QYs) of Rayleigh scattering of individual Ag NPs enable them to be imaged using dark-field optical microscopy and spectroscopy (DFOMS) with a halogen lamp,9,21,29,36–41 which effectively avoids auto-fluorescence of living organisms and enables detection of single Ag NPs and single molecules in single living organisms.9,21,37 Unlike fluorescence molecules or quantum dots (QDs), single Ag NPs resist photobleaching and photoblinking. Thus, they can be imaged and characterized in single live cells and embryos for any desired period of time.9,21,37–38,40 These distinctive optical properties enable us to use LSPR spectra of single Ag NPs as a powerful analytical tool to detect and characterize their sizes, shapes and surface properties at nanometer (nm) scale in situ in real time. We have developed DFOMS and demonstrated that we can image, monitor and characterize sizes, shapes, surface properties, and stability (non-aggregation) of single Ag NPs in solutions, single live cells, and single zebrafish embryos in real time.9,21,29,36,40–41
Unlike any other imaging tools, such as transmission electronic microscopy (TEM) or scanning probe microscopy (e.g., atomic force microscopy, AFM), DFOMS is an optical imaging means, which offers high temporal resolution and throughput to trace, quantify and locate multiple individual NPs in vivo in real time simultaneously. In contrast, TEM must be operated under vacuum. Thus, TEM is unsuited to image living organisms in real time. AFM cannot image single NPs inside living organisms, cannot provide sufficient speed to track the transport of single NPs, and cannot offer sufficient throughput to quantitatively characterize multiple single NPs simultaneously. Thus, AFM cannot determine the doses of individual NPs with meaningful spatial and temporal resolutions in vivo for better understanding of nanotoxicity
In our previous studies, we have characterized transport and effects of smaller Ag NPs (11.6±3.5 nm) and Au NPs (11.6±0.9 nm) on embryonic development and determined dependence of nanotoxicity upon chemical compositions of the NPs at single NP resolution in real time. 9,28–29
In this study, we used the exactly same approaches to investigate the transport and effects of stable (non-aggregated) and purified medium-sized Ag NPs (41.6±9.1 nm) on embryonic development, aiming to compare and better understand size-dependent transport and toxicity of Ag NPs. We have prepared the purified and stable (non-aggregated) Ag NPs that maintain their physicochemical properties over the duration of their incubation with zebrafish embryos (120 h). We further developed our imaging tools to quantitatively characterize single Ag NPs embedded in tissues of zebrafish, which was not achieved previously. Our DFMOS equipped with multi-spectral imaging system (MSIS) can characterize sizes and surface properties of multiple single Ag NPs simultaneously over their incubation with zebrafish embryos (120 h). With these distinguished approaches, this study offers new insights into effects of the medium-sized Ag NPs (41.6±9.1 nm) on embryonic development. For instance: (i) how the individual Ag NPs are transported into embryos; (ii) whether the Ag NPs stays inside the embryos throughout their entire development (120 h), and whether they remain stable; (iii) dependence of their nanotoxicity on number and sizes of single NPs embedded in the tissues of normal and deformed developed zebrafish.
It is worth noting that, different sizes of Ag NPs are not identical physicochemically. For instance, Ag NPs with diameters of (41.6±9.1 nm) differ from the Ag NPs with diameters of (11.6±0.9 nm). Thus, one cannot extrapolate the results from our previous study of transport and nanotoxicity of the small Ag NPs (11.6±0.9 nm) for the large Ag NPs (41.6±9.1 nm). In order to effectively determine and compare size-dependent biocompatibility and toxicity of Ag NPs, it is essential to study different sizes of the Ag NPs using the exactly same approaches and conditions. Otherwise, one would never know whether nanotoxicity is size-dependent. Study of nanotoxicity is still in its infancy. Thus, reliable and validated measurements are absolutely essential in order to gather sufficient and high quality data for better understanding of potential nanotoxicity and their related underlying mechanisms.
Materials and Methods
Synthesis and Characterization of Stable and Purified Ag NPs (41.6±9.1 nm in diameters)
The Ag NPs (41.6±9.1 nm in diameter) were synthesized as we descried previously.36,42 Briefly, sodium citrate (10 mL, 34 mM) was quickly added into a refluxing (100°C) AgNO3 aqueous solution (500 mL, 1.1 mM) under stirring. The mixture was refluxed and stirred for 45 min, as the solution color turned from colorless to straw yellow, then opaque and finally muddy yellow. The heating was stopped and the solution was cooled gradually to room temperature under stirring. The NP solution was filtered using 0.22-μm filters. All chemicals, except those indicated, were purchased from Sigma and used as received.
The NPs were immediately washed three times with nanopure deionized (DI) water (18 MΩ, Barnstead) using centrifugation (Beckman, JA-14) to remove any residual chemicals involved in NP synthesis (e.g., sodium citrate, silver nitrate, and related by-products). The washed NPs were resuspended in DI water and then egg water (1.0 mM NaCl), and characterized in real time for 120 h (duration of experiments needed for embryos to develop to full larvae) using UV-vis spectroscopy, dynamic light scattering (DLS) and DFOMS (Figure 1). The purified and stable NPs were used for probing of their diffusion into embryos over hours and for study of their effects on embryonic development for 120 hpf.
Figure 1.

Characterization of stability and physicochemical properties of the Ag NPs suspended in egg water. (A) HRTEM image show spherical shape of single NPs. (B) Histogram of size distribution of single NPs determined by HRTEM shows average diameters of 41.6±9.1 nm. (C) Dark-field optical image of single NPs shows that majority of NPs are plasmonic green with some being blue and red. (D) LSPR spectra of representative single NPs show λmax (FWHM) at: (a) 482 (77); (b) 500 (70); (c) 550 (84); (d) 594 (90) nm. (E) Number of the single NPs (0.7 nM NPs in egg water at 28 °C) measured over time using DFOMS shows 131± 2, 131 ± 2, 134 ± 3, 134 ± 4, 139 ± 5, 133 ± 3 and 131 ± 4 NPs per image at 0, 12, 24, 48, 72, 96, and 120 h, respectively. The result indicates that the number of NPs remains unchanged and NPs are very stable (non-aggregated) in egg water over 120 h. (F) UV-Vis absorption spectra of the NPs in (E): (a) 0 and (b) 120 h show their peak absorbance of 0.87 at λmax (FWHM), 422 (100) nm, remain unchanged over time, showing high stability of the NPs in egg water. Scale bars in (A) and (C) are 50 nm and 2 μm, respectively. The scale bar in (C) shows the distances among individual NPs, but not their sizes due to optical diffraction limit.
Sizes of Ag NPs were characterized using high-resolution TEM (FEI Tecnai G2 F30 FEG) and DLS (Nicomp 380ZLS particle sizing system). LSPR spectra and images of single Ag NPs in egg water, zebrafish embryos and tissues were acquired using DFOMS. We had fully described our DFOMS previously.9,21,28,39–41,43 In this study, the dark-field microscope is equipped with a dark-field condenser (oil, 1.43-1.20), a microscope illuminator (Halogen lamp, 100 W), a 100x objective (Plan fluor 100x, N.A. 0.5–1.3, iris, oil), and CCD camera (Micromax) coupled with a SpectraPro-150 (Roper Scientific) or MSIS (N-MSI-VIS-FLEX, CRi, Hopkiton, MA). The MSIS is an integrated system of a CCD camera (SonyICX 285) and liquid-crystal-tunable-filter (LCTF)44–47 for acquiring dark-field optical images and LSPR spectra of massive amount of single Ag NPs with spectral resolution of 1 nm simultaneously to enable high-throughput analysis of single NPs.45–47 Conventional spectrograph can only acquire LSPR spectrum of single NPs one at a time. In contrast, the DFOMS-MSIS (DFOMS equipped with MSIS) can acquire LSPR spectrum and image of every NP in a NP population (or array) as large as the pixel array (512×512) of CCD camera simultaneously at millisecond temporal and nm spatial resolutions to achieve high-throughput analysis of single NPs.45–47
We characterized the potential release of Ag+ from the NPs by measuring Ag+ concentrations in the supernatant of the NPs using atomic absorption spectroscopy (AAS, Hitachi, Z-1800) as the NPs were incubated with embryos in egg water for 120 h. The supernatants were collected from the NP solution via centrifugation. We also determined the potential degradation of Ag NPs in egg water and embryos for 120 h by measuring LSPR spectra of single Ag NPs in egg water, embryos and fully developed zebrafish using DFOMS-MSIS.
Breeding of Zebrafish Embryos
Wild-type adult zebrafish (Aquatic Ecosystems) were housed in a stand-alone system (Aquatic Habitats), and they were maintained and bred, as we described previously.9,28–29 Briefly, two pairs of mature zebrafish were placed into a clean 10-gallon breeding tank. A light (14 h)–dark (10 h) cycle was used to trigger the breed and fertilization of embryos. The cleavage-stage embryos were collected and transferred into a Petri dish containing egg water. They were well rinsed with egg water to remove any possible debris prior to imaging and characterization.
Real-time Tracking of Diffusion of Single Ag NPs into/in Embryos
The cleavage-stage embryos with egg water were then incubated with the purified NPs (0.2 nM) in a self-made microchannel, as we described previously. 9,28–29,48 Diffusion of single NPs into and inside the embryos was imaged in real time using DFOMS (Figures 2–4). Distinctive plasmonic optical properties (colors) of single NPs enable them to be distinguished from embryonic debris and zebrafish tissues, which appear white under dark-field illumination. LSPR spectra of single NPs were acquired by DFOMS-MSIS to determine their sizes using optical nano rulers (Figure 3), as we described previously. 36,42
Figure 2.

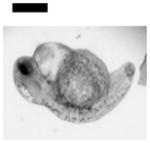
Real-time imaging of diffusion of single Ag NPs (41.6±9.1 nm) into single cleavage-stage zebrafish embryos using DFOMS. (A) Optical image of the cleavage-stage embryo in egg water. Chorionic layer (CL), interface of chorionic space (CS) and inner mass of embryo (IME), and IME are squared as (B–D), respectively. (B–D) Sequential dark-field optical images of zoom-in squared areas in (A), show the diffusion of the single NPs (as circled) from egg water (outside chorion, OC) into CL, in CS into IME, and within the IME with direct visualization of single embryonic cells. The time intervals (temporal resolution) between sequential images in (B–D) are 1.1 s. Their real-time videos S1–3 in SI offer 5-ms temporal resolution and direct view of diffusion trajectories of single NPs. Scale bars are 500 μm in (A) and 20 μm in (B–D).
Figure 4.

Determination of diffusion modes of single Ag NPs in cleavage-stage embryos. (a) Diffusion trajectories and (b) Real-time square displacements (RTSD) as a function of time of single plasmonic green Ag NPs diffuse: (A) from egg water into CS through CL; (B) from CS to IME; and (C) inside the IME, as shown in Figure 2, indicate constrained motion (steps) and simple Brownian motion (linear portions) with diffusion coefficients of (5.0±1.0)×10−11, (4.9±3.0)×10−9, and (5.1±8.5)×10−10 cm2s−1, respectively. Scale bars in (A–C) are 0.1, 3 and 2 μm, respectively.
Figure 3.

Characterization of plasmonic optical properties of single Ag NPs diffused into/in cleavage-stage embryos using DFOMS-MSIS. (A) Color images of snap-shots of those sequential images in Figure 2B–D show that individual plamonic Ag NPs are diffusing through CL, in CS, in CS into IME, and in IME. (B) Zoom-in images of Fig. 2B and 3A-a show the single Ag NPs trapped in chorionic pores, and some of them aggregated in the pores: (a) monochrome mode; (b) color mode, respectively. (C) LSPR spectra of the single Ag NPs as those circled in (A) show λmax (FWHM) at 489 (63), 545 (74), and 680 (102) nm. Scale bars in (A–B) are 20 and 2 μm, respectively.
Study of Dose-Dependent Biocompatibility and Toxicity of Ag NPs and Control Experiments
The cleavage-stage embryos in egg water were incubated with a dilution series of Ag NPs (0, 0.02, 0.05, 0.1, 0.2, 0.3, 0.4, 0.5, and 0.7 nM) or (0, 5, 12, 24, 48, 95, 119, and 166 μg/mL), and the supernatants collected from the third wash of the NPs in the wells of 24-well plates for 120 h. Note that molar concentrations of the NPs are used in this study and their weight/volume (w/v) concentrations are provided to enable the comparison with those reported studies using w/v as NP concentrations.
Four embryos with a given concentration of the NPs or each supernatant were present in each well. Three replicates (e.g., two additional sets of four embryos in each given concentration in each well) were performed simultaneously. Thus, the 12 embryos in three wells for each concentration and control were studied for each run of the experiment. Embryos in egg water alone and in supernatant were placed in two rows of the 24-well plates, which served as blank control experiments. The microwell plates were incubated in water bath at 28.6°C under dark for 120 h. The developing embryos in the plates were imaged at 0, 10, 24, 48, 72, 96, and 120 hpf using an inverted microscope (Zeiss Axiovert) equipped with a CCD camera (CoolSnap, Roper Scientific). Note that each experiment was carried out at least three times and a total number of 36 embryos (9 replicates of 4 embryos for each concentration) were studied for each NP concentration and each control experiment to gain representative statistics (Figures 5–6).
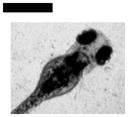
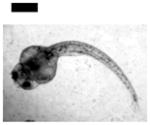
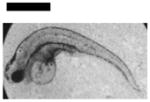
Figure 5.

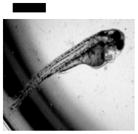
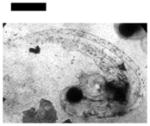
Study of dose-dependent nanotoxicity of the Ag NPs (41.6±9.1 nm) using zebrafish embryos as ultrasensitive in vivo assays. (A) Optical images of normally developing embryos at (a) cleavage stage (0.75–2.25 hpf); (b) late gastrula stage (10 hpf); (c) late segmentation stage (24 hpf); (d) hatching stage (48 hpf); (e) fully developed larvae (120 hpf). (B) Dead embryo. (C) Histograms of distributions of embryos that developed to normal and deformed zebrafish or became dead versus NP concentration. (D) Control experiments: histograms of the distributions of embryos that developed to normal zebrafish or became dead either in egg water alone or versus supernatant concentration, which was collected from washing NPs with DI water. A total of 36 embryos were studied for each NP concentration and control in (C–D). The percentage of embryos that developed to normal and deformed zebrafish or became dead was calculated by dividing its number with the total number of embryos used at each concentration. The means and standard deviations (error bars) of each given percentage at each given concentration from each of 3 replicates are presented. Scale bar is 500 μm for all images in (A).
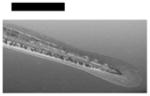
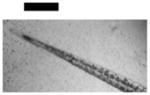
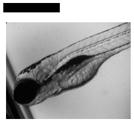
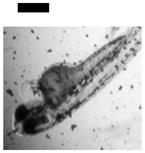
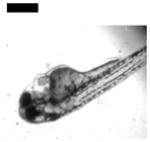
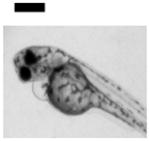
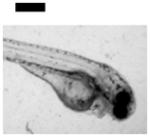
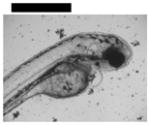
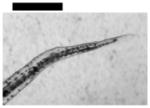
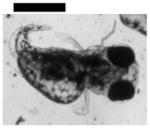
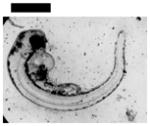
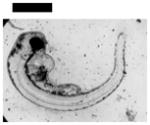
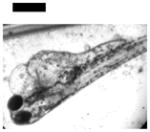
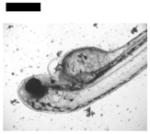
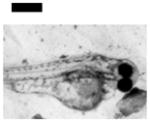
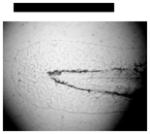
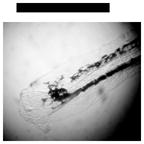
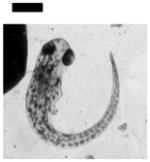
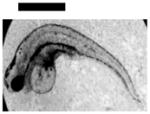
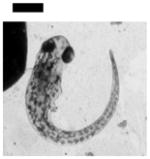
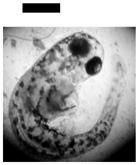
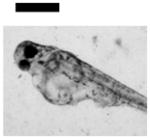
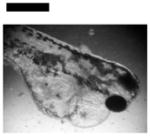
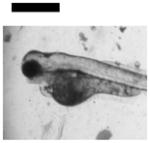
Figure 6.

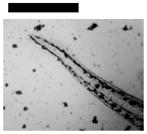
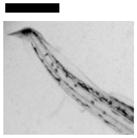
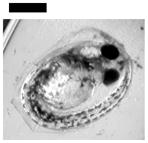
Dependence of types of deformed zebrafish on the Ag NP concentration. (A) Optical images of deformed zebrafish show: (a–b) finfold abnormalities; (c–d) tail/spinal cord flexure; (e) cardiac malformation and yolk sac edema; and (f–g) eye abnormality. (B) Histograms of distributions of embryos that developed to deformed zebrafish with five distinctive types of deformities at NP concentration of 0.02, 0.05 and 0.10 nM. A total of 36 embryos were studied for each NP concentration and control. The percentage of embryos that developed to any given type of deformed zebrafish at any given concentration was calculated by dividing its number with the total number of deformed zebrafish observed in all concentrations. The means and standard deviations (error bars) of each given percentage at each given concentration from each of 3 replicates are presented. Scale bar is 500 μm for all images in (A).
The supernatant from the third wash of NPs with DI water was collected and analyzed using AAS (Hitachi, Z-8100) to determine the trace amount of Ag+. The supernatant was incubated with the embryos for 120 h to determine the potential effects of residual chemicals involved in NP synthesis. The experiment serves as control to determine that the observed dose-dependent nanotoxicity is attributed to the NPs, but not other chemicals. The washed NPs were suspended in egg water and embryos for at least 120 h. The supernatant was then collected using centrifugation and analyzed using the AAS to determine the trace amount of Ag+ due to potential releasing of Ag+ from the NPs or their degradation.
Quantitative Characterization of Single Ag NPs Embedded in Individual Zebrafish
We characterized individual Ag NPs embedded in the tissues of zebrafish as described in the following. The cleavage-stage embryos were chronically (continuously) incubated with given concentrations of the NPs for 120 hpf and became normal and deformed zebrafish. The zebrafish were thoroughly rinsed with DI water to remove any possible external NPs and then fixed using Microm STP-120 Spin Tissue Processor (Thermo Fisher Scientific), as we described previously.28 Their ultrathin-layer microsections (1–2 μm thickness) were carefully prepared using microtome (HM360 rotary microtome, Thermo Fisher Scientific). Individual NPs embedded in the tissues of interest were directly characterized using DFOMS-MSIS (Figures 7–9). A minimum of three slices of the tissues from each given organ (e.g., eye, brain, cardic, and tail) of each normal and deformed zebrafish was analyzed for each measurement. A minimum of 15 representative normal and deformed zebrafish were characterized.
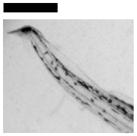
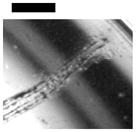
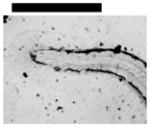
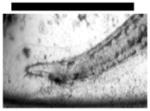
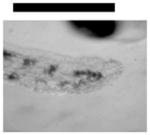
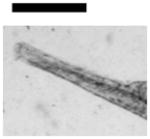
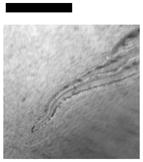
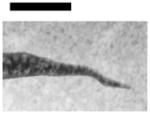
Figure 7.

Quantitative characterization of individual Ag NPs embedded in deformed zebrafish using DFOMS-MSIS. (A) Optical image of ultrathin longitudinal section of fixed zebrafish with five types of deformities. The rectangles highlight its (a) retina (eye), (b) brain, (c) cardiac, and (d) tail. (B) Zoom-in optical images of the tissue sections highlighted in (A) show single NPs embedded in the tissues. (C) LSPR spectra of the individual NPs circled in (B) show λmax (FWHM) at: (a) 682 (87), (b) 552 (111), (c) 534 (94), and (d) 660 (106) nm. Scale bars are 500 μm in (A) and 50 μm in (B).
Figure 9.

Quantitative analysis of number and sizes of the individual Ag NPs embedded in the tissues of the deformed and normal zebrafish. Histograms of the number and sizes (colors) of single NPs embedded in: (A) eye (retina) and (B) brain tissues of (a) normally developed and (b) deformed zebrafish. Tissues of 15 normal and deformed zebrafish each were analyzed. The minimum of 3 slices of each type of the tissues of each zebrafish were characterized for each analysis. Each slice severs as an effective detection volume for each analysis. The means and standard deviations (error bars) of each given type (plasmonic blue, green and red) of the Ag NPs embedded in each type of the tissues from each 3 replicates are presented.
Data Analysis and Statistics
A minimum of 100 of single Ag NPs was imaged and characterized for each measurement of their sizes and stability in egg water using HRTEM and DFOMS. A minimum of 300 NPs in total was studied for each sample via three replicate measurements. For real-time imaging of diffusion of single NPs into and in embryos over time, a minimum of 15 embryos was studied for each given concentration with 5 embryos for each measurement. For study of dose-dependent effects of NPs on embryonic development, a total number of 36 embryos from 9 independent replicates with a minimum of four embryos per measurement were studied for each NP concentration and each control experiment.
Percentages of embryos that developed to normal and deformed zebrafish or became dead versus molar concentration of the NPs and supernatants (control), from each three replicate measurements are averaged and presented with standard deviations (error bars) of each measurement (12–20 embryos each) (Figures 5, 6). We used conventional statistical methods (both t-test and ANOVA) to analyze these data, and found significant differences of dose-dependent nanotoxicity (number of embryos developed to normal and deformed zebrafish or became dead, as they were treated by 0–0.2 nM Ag NPs for 120 h) with a confidence level of 90% (or P = 0.10) for t-test and 95% (or P = 0.05) for ANOVA. All embryos became dead after their exposure to higher concentration (≥ 0.2 nM) of the NPs.
Notably, study of embryos at single embryo level and characterization of nanotoxicity at single NP resolution enable us to depict the rare event of interest, which otherwise would be buried under ensemble measurements. Thus, conventional statistical analysis is irrelevant in this study. Representative and distinctive observations, especially rare deformed zebrafish, were summarized in Table 1.
Table I.
Summary of Dependence of Number of Normal and Deformed Zebrafish upon Molar Concentration of Ag NPs
| NP C (nM) | Images of Zebrafish | Number of Zebrafish with Severity Scale* | |||||||
|---|---|---|---|---|---|---|---|---|---|
| 0 | 1 | 2 | 3 | 4 | |||||
| 0 | Control: Normal Development | 41 | |||||||
|
|
|
|
||||||
| 0.02 | Finfold Abnormality♣ | 30 | 1 | 1 | 2 | 1 | |||
|
|
|
|
||||||
| Tail/Spinal Cord Flexure and Truncation♣ | 30 | 3 | |||||||
|
|
|
|
||||||
| Cardiac Malformation≠, Yolk Sac Edema≠ and Eye Abnormality≠ | 30 | ||||||||
|
|
|
|
||||||
| 0.05 | Finfold Abnormality♣ | 20 | 2 | 6 | |||||
|
|
|
|
||||||
| Tail/Spinal Cord Flexure and Truncation♣ | 20 | 2 | 1 | 4 | |||||
|
|
|
|
||||||
| Cardiac Malformation♣≠ and Eye Abnormality♣≠ | 20 | ||||||||
|
|||||||||
| Cardiac Malformation♣≠, Eye Abnormality♣≠, Yolk Sac Edema♣≠ | 20 | ||||||||
|
|
|
|
||||||
| 0.10 | Finfold Abnormality | 9 | 3 | 4 | 6 | 2 | |||
|
|
|
|
||||||
| Tail/Spinal Cord Flexure and Truncation♣ | 9 | 3 | 2 | 4 | 3 | ||||
|
|
|
|
||||||
| Cardiac Malformation♣≠ and Eye Abnormality♣≠ | |||||||||
|
|
|
|
||||||
| Cardiac Malformation♣≠, Eye Abnormality♣≠, Yolk Sac Edema♣≠ | 9 | ||||||||
|
|
|
|
||||||
Total number of zebrafish with scales of 0–4 or 0–3 for normal to the severest finfold or tail deformity, respectively.
Multiple types of deformities observed in same zebrafish, which are repeatedly listed in respective category.
Rare type of deformities and their deformation severities are unable to be rated.
Scale bars = 250 μm
Results and Discussion
Synthesis and Characterization of Stable and Purified Ag NPs (41.6±9.1 nm)
We produced highly purified Ag NPs by thoroughly washing Ag NPs with DI water to remove potential residual chemicals involved in NP synthesis via centrifugation, as described in Methods.36,42 The NPs were then suspended in egg water (1.0 mM NaCl, embryonic medium) and characterized over 120 h to study their stability and their effects on embryonic development, as presented below.
HRTEM images of single Ag NPs and histogram of their size distribution (Figure 1A and B) show nearly spherical shaped NPs with average diameters of 41.6±9.1 nm. Sum of percentages of all sized NPs is 100% with diameters of 30–52 nm at 97% and three rare larger NPs of 66, 69 and 72 nm at 1% each. Notably, we did not observe any Ag NPs with diameters between 53–65 nm. The average diameters of Ag NPs (41.6±9.1 nm) are presented as the mean of diameters of at least 300 NPs with standard deviations. The mean is equal to the sum of the product of the percent of a given size of NPs and its diameter.
Dark-field optical images of single Ag NPs suspended in egg water (Figure 1C) show that majority of NPs display plasmonic green with some being blue and very few red. LSPR spectra of representative single NPs (Figure 1D) show their peak wavelengths (λmax) with full-width-of-half-maximum (FWHM), λmax (FWHM), at 458 (83), 471 (75), 543 (84), and 594 (90) nm. Using the approaches as we reported previously,36 we can determine the sizes of single Ag NPs using their LSPR spectra, by correlating the distribution (%) of their LSPR spectra measured by DFOMS with their diameters determined by HRTEM. The results in Figure 1D agree well with those reported in our previous calibration studies,36 which shows that Ag NPs with diameters of 40–55 nm exhibit λmax of LSPR spectra of 480–550 nm (plasmonic green), while NPs smaller than 40 nm and larger than 66 nm display λmax of LSPR spectra shorter than 480 nm (plasmonic blue) and longer than 550 nm (yellow or red), respectively.
Note that LSPR spectra of single NPs highly depend upon their sizes, shapes and surrounding environments (e.g., medium). 32–34,36,49 Thus, correlation of their sizes with their LSPR spectra must be calibrated for each NP solution. In other words, correlation of their sizes with their LSPR spectra can change when their shapers and/or surrounding environments alter. For instance, none of the NPs has exactly identical shapes. The same sized NPs with slightly different morphologies (shapes) at the atomic scale exhibit distinctive LSPR spectra. Furthermore, the same NPs show distinguished LSPR spectra as they are present in different medium (e.g., DI water, egg water, cell culture medium, living organisms, or various parts of living organisms). Thus, similar sized NPs display different plasmonic colors (LSPR spectra) in different solutions and environments.9,20–21,28–29,36,40–41
The stability (non-aggregation) of the purified NPs in egg water was characterized over the duration of the entire embryonic development (120 hpf) both at single-NP resolution using DFOMS, and ensemble measurements using UV-vis absorption spectroscopy and DLS. The number of NPs dispersed in egg water (Figure 1E) as measured by DFOMS remains essentially unchanged at ~(133 ± 3) NPs per image over 120 h, indicating that NPs are stable (non-aggregated) in egg water. If the Ag NPs were aggregated, we would have observed the number of NPs decreased over time, and the red-shift of their LSPR spectra. If the NPs were degraded (broken apart or dissolved), we would have observed the blue-shift of their LSPR spectra due to the decrease of their sizes.46 We can detect the altercation of single molecules on the surface of single Ag NPs using the shift of their LSPR spectra, as we demonstrated previously.37–38,46–47
Absorbance of UV-vis spectra of the NPs in egg water (Figure 1F) shows that their peak absorbance of 0.87 at the wavelength of 422 nm (FWHM of 100 nm) remains unchanged for 120 h. Note that the highest concentration of the NPs (0.7 nM) used to treat embryos were incubated with egg water over 120 h. The UV-vis spectra of the NPs (diluted 10x to 0.07 nM to avoid saturation of the spectrometer and enable the absorbance measurement below 1.0) were measured over time. If the NPs were aggregated in egg water, their sizes would increase, which would have caused the red-shift of the spectra and decrease of the absorbance.
Size distributions of the NPs measured by DLS show that their average diameters remain essentially unchanged at 45.5±9.8 nm for 120 h. Note that the NPs in egg water are solvated (associated with water), which leads to larger diameters than those measured in dry by HRTEM (Figure 1A, B). Taken together, these results (Figure 1) demonstrate that the NPs are stable (non-aggregated) in egg water over the entire duration of embryonic development (120 h).
It is worth noting that one must use purified and stable NPs in order to study their size and dose dependent effects on living organisms. The unpurified Ag NPs contain trace amounts of chemicals (e.g., AgNO3, sodium citrate, etc) involved in NP synthesis. These chemicals, instead of the NPs, can potentially cause toxicity. Furthermore, unstable Ag NPs in the medium (e.g., egg water) alter their sizes and concentrations over time, due to aggregation, making the study of size and dose dependent nanotoxicity unreliable. Thus, we take great care to first prepare the purified and stable Ag NPs, and then characterize their size and dose dependent nanotoxicity.
Analysis and Characterization of Molar Concentrations of the Ag NPs in Solutions
We used molar concentrations of the NPs to describe transport and dose-dependent nanotoxicity in this study and all our previous studies.9,28–29 Molar concentrations of single Ag NPs (but not atoms or ions) were calculated by dividing moles of Ag NPs with total solution volume, and characterized as we described previously.9,28,43 Based upon the reaction stoichiometry, we used excess amount of reducing agent (sodium citrate) to completely reduce Ag+ cation to Ag. The analysis of the supernatant of reaction solution by AAS shows that less than 0.04 ppm of Ag+ was present in the solution, indicating nearly complete reduction of 1.1 mM Ag+. Thus, the weight of Ag (WAg) generated by the complete reduction of AgNO3 was calculated by multiplying the moles of added AgNO3 (weight of added AgNO3 divided by molecular weight of AgNO3) with the atomic weight of Ag (107.87 g/mol). The volume of generated Ag (VAg) was calculated by dividing WAg with the density of Ag (d = 10.5 g/cm3), as VAg = WAg/d. The number of the Ag NPs, diameter (Dia) = 41.6±9.1 nm, was computed by dividing the volume of generated Ag (VAg) with the volume of one NP (πDia3/6). The moles of Ag NPs were then determined by dividing the number of Ag NPs with Avogadro’s constant (6.02×10²³). Finally, the molar concentrations of Ag NPs were calculated by dividing the moles of Ag NPs with the solution volume. The molar concentration for the unwashed NPs in 510 mL is 0.48 nM.
We measured UV-vis absorption spectra of a series of unwashed Ag NP solutions, determined the baseline-subtracted peak absorbance, and plotted the subtracted absorbance (0, 0.0845, 0.157, 0.301, 0.524, and 0.957) versus molar concentrations of colloid Ag NPs (0, 0.05, 0.011, 0.019, 0.034, and 0.069 nM). The plot showed a linear calibration curve with a linear regression of 1.0 and slope of (1.43± 0.07) ×1010 M−1. Using Beer-Lambert law (A = εbC), we found that molar absorptivity (extinction coefficient) of unwashed Ag NPs at the λmax of 422 nm is (1.43± 0.07) ×1010 M−1 cm−1.
The NPs were spun down using centrifugation to remove the by-products of the reaction and any excess of chemicals in solution, as described above. The NPs in the pellets were well resuspended in nanopure DI water, to produce the first-time washed NP solution. We measured UV-vis absorption spectrum of the first-time washed NP solution, showing that the λmax of spectrum remained unchanged at 422 nm. The result indicated that the size of Ag NPs remained unchanged during the centrifugation, which was confirmed by HRTEM and DLS. Thus, we used extinction coefficient of unwashed Ag NPs to calculate the concentration of the washed NPs. We further measured the UV-vis absorption spectra of a series of the first-time washed Ag NP solutions, and used the same approaches described above to determine molar absorptivity of the first-washed Ag NP solution. Using the same approach, we prepared and characterized the second and third washed Ag NPs. The results showed that λmax of spectrum at 422 nm remained unchanged with the molar absorptivity of the third-washed NP solution of (1.37±0.05)×1010 M−1 cm−1. The result indicated their sizes remained unchanged, as characterized by TEM and DLS
We imaged and determined trace amount of individual Ag NPs in the supernatants collected from the third wash of Ag NPs using DFOMS. If we found any Ag NPs in the supernatant, we would further remove them from the supernatant using ultra-centrifugation (L90, Beckman). The supernatants with any potential residual byproducts and chemicals except Ag NPs were collected and used to treat embryos, which serves as a blank control experiment for the study of effects of the NPs on embryonic development, because any potential residual chemicals present in the supernatant should also be present in the NPs.
In all our studies,9,29 the supernatants collected from twice or thrice washed NPs provide clean and successful control experiments (no effects on embryonic development as those observed in egg water). In other words, the thrice-washed NPs are sufficiently pure to be used to study their effects on embryonic development. This approach ensures that we study the effects of Ag NPs on embryonic development, but not ions or other chemicals potentially presented in the NPs.
As described above, individual Ag NPs (like different molecules) are independent entities and have its own NP (molecular) weights and its own physicochemical properties (e.g., sizes, morphologies, surface areas, reactivity, and optical properties). Thus, weight of different sizes of the Ag NPs cannot be described by the same atomic weight of Ag. The w/v of Ag atom cannot be used to accurately describe NP concentration. Furthermore, unlike conventional chemicals, the w/v of NPs is not proportional to the surface properties and numbers (doses) of NPs. For example, the same w/v of different-sized NPs contains different number of the NPs, and thus different surface areas and charges of NPs. Thereby, the w/v concentration does not represent number (doses) of NPs, and cannot accurately reflect dependence of nanotoxicity on number and surface properties of the NPs.
In contrast, molar concentration of the NPs is the most appropriate unit to characterize and describe dose-dependent nanotoxicity because it enables the comparison of effects of number of NPs with different sizes. Furthermore, weight and surface area of the NPs are directly proportional to the number (mole) of NPs. Thus, molar concentration of NPs accurately represents size, number (mole), and surface properties of the NPs. Thereby, the dose-dependent effects of NPs on embryonic development in molar concentrations represent dependence of nanotoxicity on sizes, number and surface properties of NPs, and hence accurately reflect dose-dependent nanotoxicity.
Real-Time Imaging of Transport of Single Ag NPs into/in Embryos
We studied diffusion and transport of single Ag NPs (41.6±9.1 nm) in cleavage-stage embryos by incubating the NPs with the embryos and tracking their diffusion into and in embryos in real time using DFOMS. We first focus on probing of entry of the single NPs into the embryos from egg water (outside chorion, OC) and then inside the embryos. Optical images of the embryos (Figure 2) illustrate the interface of egg water with chorionic space (CS) (chorionic layer, CL), the interface of CS with inner mass of embryos (IME), IME, and transport of the individual NPs through these interfaces into IME. We found arrays of chorionic pore canals (CPCs) with diameters of 0.5–0.7 μm and distances among neighboring pores at 1.5–2.5 μm on the CL of the embryos (Figure 2B), which agree excellently with those determined previously by DFOMS,9,28–29 and by scanning electron microscopy (SEM).50 Note that the embryos (embryonic tissues, cells or vesicles) appear white under dark-field illumination, while Ag NPs exhibit distinctive plasmonic colors, enabling them to be distinguished from the embryonic cells and tissues, and imaged in vivo in real time.
We used the shortest exposure time (the highest speed) and monochrome (black/white) mode, instead of multichrome mode (color) of the CCD camera, to track diffusion of the single NPs in real time (Figure 2B-D, Videos S1–3 in Supplementary Information, SI). We characterized LSPR spectra of the single NPs to determine their sizes using color-mode of CCD camera (Figure 3) at the time points of interest between each set of sequential optical images acquired by its monochrome mode (Figure 2).
The monochrome mode of the CCD camera collects the photons generated by the scattering of single NPs directly (photos do not need to pass through the LCTF). Thus, the monochrome mode is much more sensitive and can acquire sequential images and real-time videos more rapidly than its color mode, offering the sufficient temporal resolution to track the diffusion of single NPs in real time. In contrast, the color mode requires the scattering light to pass through the LCTF filters, which significantly reduces the sensitivity. Thus, the color mode requires longer exposure time to acquire each image and offers insufficient temporal resolution for tracking the diffusion of single NPs in real time. However, the color-mode enables us to acquire LSPR spectra of the single Ag NPs and distinguish them from embryonic cells, tissues and debris (Figure 3). Size-dependent plasmonic properties of the single NPs enable us to characterize their sizes in real time using DFOMS-MSIS via optical nano rulers as we described previously.
We found that majority of the Ag NPs with diameters of 30–72 nm diffused through CPCs into CS, and through CS and into IME (Figure 2B-D; Videos S1–3 in SI). A few of single plasmonic green NPs were trapped inside the chorionic pores for a longer period of time (minutes), which aggregated with the plasmonic green NPs that diffused through the same pores and generated larger plasmonic red NPs (Figure 3). The aggregation led to the red-shift and broader LSPR spectra of single Ag NPs with higher scattering intensity and the clog of the chorionic pores and their transportation, which might have caused adverse effects of the Ag NPs on embryonic development. Real-time continuous imaging of diffusion of single NPs enables us to directly observe the aggregation of single plasmonic green NPs to the larger plasmonic red NPs in the pores in situ in vivo in real time.
The diffusion modes of individual Ag NPs were characterized as the NPs were diffusing into/in embryos by tracking diffusion trajectories of single Ag NPs and plotting real-time squared displacement (RTSD) versus diffusion time (Figure 4). Embryonic environments are highly heterogeneous and dynamics. They change over time, as embryos develop. Thus, we use RTSD (diffusion distance at each time interval) rather than mean-squared displacement (MSD) (average distance over time) to determine diffusion modes of the single NPs.
Plots of RTSD versus time for single NPs that are diffusing through CPCs into CS, in CS into IME, and IME (Figure 4b) show stepwise linearity and highly heterogeneous embryonic environments. As described by diffusion theories,51–54 the linear plots indicate simple random Brownian motion and steps show restricted diffusion, indicating that passive diffusion of single NPs (but not active cellular signaling) enables them to enter the embryos. Individual Ag NPs are trapped from time to time as they diffuse from egg water into CS and from CS to IME. Single Ag NPs are trapped more often in IME, which indicates that the IME is more viscous than the CS.
Diffusion coefficients (D) of single NPs are determined by dividing the slopes of linear portions of the plots (Figure 4b) with four using two-dimensional (2D) Random walk theory (RTSD = 4DΔt).53 They are (5.0±1.0)×10−−11, (4.9±3.0)×10−9, and (5.1±8.5)×10−10 cm2s−1 for the single plasmonic green NPs going through CPCs from egg water into CS, in CS into IME, and in IME. Diffusion coefficients of the single plasmonic green NPs in egg water measured using the same approaches are (5.2±1.8)×10−8 cm2s−1. Diffusion coefficients of single NPs are inversely proportional to viscosities of medium based upon Stokes-Einstein equation, D = kT/(6πηa), where k is Boltzmann constant; T is temperature; a is radii of single NPs; and η is viscosity of medium where NPs diffuse in.53 Thus, the results show that embryonic environments are orders of magnitude more viscous than egg water.
In our previous studies, we observed high viscosity gradients of embryonic environments in CS.9,29 In this study, the large standard deviations of diffusion coefficients of single Ag NPs in embryos, especially in IME, show high heterogeneities (viscosity gradients) of embryonic environments. The results further demonstrate that the single Ag NPs can serve as effective optical probes to study embryonic nanoenvironments. The high heterogeneities of embryonic environments make the comparison of diffusion coefficients of various sizes of Ag NPs very difficult. In this study, we have made great effort to measure the diffusion of the similar sizes (colors) of the Ag NPs at the same or different environments (locations) in the same embryos simultaneously in order to effectively probe viscosity gradients of the embryos in vivo in real time.
Early-Development Embryos as High-throughput Ultrasensitive In Vivo Assays
Optical images in Figure 5A show normal developmental zebrafish embryos at cleavage (0.75–2.25 hours-post-fertilization, hpf), gastrula (10 hpf), segmentation (24 hpf), and hatching stages (48 hpf), and a fully developed larvae (120 hpf). Zebrafish embryos are transparent, and their developmental stages are well defined, which enable them to be characterized simultaneously. Notably, massive amount (thousands) of the embryos can be generated rapidly at very low cost, and simultaneously characterized within minutes. Zebrafish embryos complete their development in 120 h. For other in vivo model organisms (e.g., mouse, rat), their embryos develop in the wombs, and take months to fully develop. Thus, it would have taken months and years to characterize thousands of such embryos. Thereby, in comparison with other in vivo model organisms, zebrafish embryos can sever as high-throughput in vivo assay for screening of biocompatibility and toxicity of nanomaterials.
We hypothesize that the earlier developmental stage, such as cleavage stage, is likely more prone and sensitive to the effects of external substances (e.g., drugs, NPs) than later stages, because the earlier developmental stages lay down foundation for later developmental stages. Furthermore, the cleavage-stage embryos undergo drastic changes, which set forth the development of different organs. Their related developmental mechanisms remain not yet fully understood.25–27 Thus, we select cleavage-stage embryos to study transport, biocompatibility and toxicity of the Ag NPs, aiming to develop ultrasensitive in vivo assays to effectively screen biocompatible and toxicity of Ag NPs.
Study of Dose and Size-Dependent Biocompatibility and Toxicity of Ag NPs
We studied dose-dependent toxic effects of the Ag NPs (41.6±9.1 nm) on embryonic development by incubating cleavage-stage embryos with various concentrations (0–0.70 nM or 0–166 μg/mL) of the NPs suspended in egg waters for 120 h. Molar concentration (0–0.70 nM) of the Ag NPs (but not Ag atom) is used to describe the dose and size dependent biocompatibility and toxicity in this study, because w/v (0–166 μg/mL) cannot accurately represent dose-dependent nanotoxicity upon unique physicochemical properties (e.g., number, size and surface area) of the NPs, as described above.
Representative embryonic developmental stages were imaged and assayed over time (for 120 h) until the embryos became fully developed at 120 hpf. Number of embryos that developed to normal zebrafish (Figure 5A), became dead (Figure 5B) and deformed zebrafish (Figure 6A) were recorded and characterized. The results in Figure 5C show high dependence of embryonic development upon the NP concentrations (doses). As the NP concentration increases from 0 to 0.2 nM, the number of embryos that developed to normal zebrafish decreases, while the number of embryos that developed to deformed zebrafish or became dead increases. Notably, all embryos became dead after their exposure to the higher concentration of the NPs (≥ 0.2 nM).
Severe deformities (e.g., cardiac abnormalities, yolk sac edema, and eye/head abnormalities) were observed at NP concentration as low as 0.02 nM, and up to 0.2 nM, as summarized in Figure 6A and Table 1. For example (Figure 6), we observed finfold deformities with disorganized and abnormally arranged finfolds (a-b); abnormal tail and spinal cord flexure with nearly 180° bent (c-d); cardiac malformations (edema of the pericardial sac region and cardiac arrhythmia) and Yolk sac edema with swollen and enlarged yolk sac (e); and head edema and severe eye abnormalities with micropthalmia (small eyes) and dissymmetric eyes (f-g). These eye abnormalities were uncommon deformations and rarely observed in our previous studies of smaller Ag and Au NPs.9,28
We scored finfold and tail abnormalities only, because these two deformities are the most common ones observed in the large populations of deformed zebrafish, which enables us to compare the degree of deformities among deformed zebrafish. We did not attempt to score other types of deformities, because they are typically accompanied with finfold and tail abnormalities, and they are not widely observed in all deformed zebrafish.
A wide variety of inconsistent scoring systems had been used to describe severities of given deformities of zebrafish in previous studies.55–59 Thus, we have developed and used our own scoring system, based upon the severe deviations from the normal development. We semi-quantitatively scale deformity from 0 (normal) to 4 or 3 (the severest) to rank the severities of finfold and tail abnormality from the normal development, respectively. The details are described in the following.
For instance (Table 1), normal developed finfold (clear thin membrane around the entire trunk region with unsegmented fin rays) is scored as 0. The finfold tissues with: (i) the small portion of tissues showing low degree of disorganization are scored as 1; (ii) the primary portion of tissues near the base of the tail (but not extend to the outer finfold region) displaying abnormality and disorganized structures are scored as 2; (iii) abnormal organization of tissues extending from the base of the tail to the outer finfold region with non-uniform structures and shrunk sizes are scored as 3; (iv) abnormal and disorganized tissues throughout the entire finfold with drastic shrunk sizes are scored as 4.
The normal developed tail (straight from the notochord and spinal cord to the posterior-most tip of the tail) is scored as 0. The tails with a few degree of flexure in the posterior-most tip are scored as 1. The tails with the kink in the posterior-most tip are scored as 2. The entire tails that were completely flexed (e.g., nearly 90°) and truncated are scored as 3.
Two control experiments were conducted simultaneously by incubating the embryos with egg water alone (blank control) and with the highest concentration of supernatants for 120 h. The supernatants were collected from both the third washed NPs and the NPs incubated with egg water for 120 h. The control experiments were used to determine potential toxic effects of trace chemicals (e.g., Ag+) resulted from the synthesis or degradation of the NPs over time. They validate that the observed nanotoxicity (Figure 5C) is attributed to the NPs, but not other chemicals. The results from the control experiments in Figure 5D show that over 95% embryos develop to normal zebrafish, and none of embryos develop to deformed zebrafish. Note that, if the Ag NPs had released any sufficient amount of Ag+ that caused significant effects on embryonic developed, we would have observed them in the control experiment. Thus, the deformed zebrafish and high percent of dead embryos observed in Figure 5C are attributed to the Ag NPs, but not any potential contaminated chemicals or possible releasing of Ag+. Furthermore, we analyzed the supernatant of the NPs that had been incubated with egg water for 120 h using AAS and found that the trace amount of Ag+ (< 0.04 ppm) remained essentially unchanged over their 120-h incubation.
Quantitative Characterization of Single Ag NPs Embedded in Tissues of Zebrafish
To address why some embryos developed normally while others became deformed or dead, we characterized single Ag NPs embedded in various tissues of zebrafish, which had been incubated with the NPs (< 0.2 nM) chronically (continuously) for 120 h, since they were cleavage-stage embryos. Longitudinal ultrathin sections (1–2 μm thickness) of representative deformed zebrafish with all types of the deformities show the NPs embedded in its eye (retina), brain, heart, and tail (Figure 7), as characterized by distinctive LSPR spectra of individual Ag NPs. Interestingly, transverse ultrathin sections of normally developed zebrafish (Figure 8) also show Ag NPs embedded in the tissues similar to those of deformed zebrafish. The results suggest that the Ag NPs diffused into embryos and stayed inside the embryos throughout their entire development stages (120 hpf).
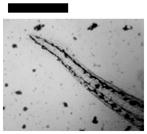
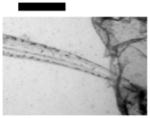
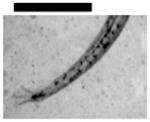
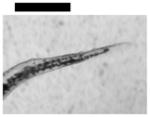
Figure 8.

Quantitative characterization of individual Ag NPs embedded in normally developed zebrafish using DFOMS-MSIS. (A) Optical image of ultrathin transverse section of fixed zebrafish. The rectangles outline its (a) retina, (b) lens, (c) forebrain, and (d) hindbrain tissues. (B) Zoom-in optical images of the tissue sections highlighted in (A) show individual NPs embedded in the tissues. (C) LSPR spectra of representative single NPs circled in (B) show its λmax (FWHM) at (a) 553 (113), (b) 559 (134), (c) 660 (70), and (d) 552 (106) nm. Scale bars in (A–B) are 250 and 50 μm, respectively.
The red shift of LSPR spectra of individual Ag NPs embedded in the tissues with much larger FWHM could be attributed to the changes of their surrounding environments and surface properties (e.g., dielectric constant of embedded medium) which differ from egg water, and/or the increase of their sizes. The single red plasmonic Ag NPs embedded in the tissues of deformed zebrafish show significantly higher (~1.8 times) scattering intensity than the individual blue and green NPs embedded in the same tissues (Figure 7), indicating that their sizes are ~1.8 times larger than those of blue and green Ag NPs.36 The larger red Ag NPs could potentially be attributed to aggregation of smaller Ag NPs as they diffused and trapped in more viscous areas (e.g., pores) of the embryos for a long period of time, which increased their probability of aggregation with other Ag NPs that diffused and trapped in the same locations (Figure 3B).9 The larger Ag NPs have the longer dephasing time T2 (decay or damping time) of the LSPR than smaller Ag NPs, which leads to the larger FWHM (broader) of LSPR spectra. 60 In contrast, the single red Ag NPs embedded in the tissues of normally developed zebrafish show nearly the same scattering intensity as those of the individual blue and green Ag NPs (Figure 8), indicating that their sizes are nearly identical. The red-shift of their LSPR spectra could be primarily attributed to their various surface properties (e.g., surrounding tissues, surface adsorbates), instead of their size increase.
Again, we did not observe the blue-shift of the LSPR spectra of single Ag NPs embedded in the tissues of zebrafish. The results demonstrate that the Ag NPs were not degraded (broken apart or dissolved) during their 120 h incubation with the embryos. If the Ag NPs were degraded, dissolved or broken apart, we would have observed the blue-shift of their LSPR spectra due to the decrease of their sizes.46 Notably, our DFOMS-MSIS is sufficiently sensitive to detect the change of single molecules on the surface of single NPs.38,46–47
The number of individual Ag NPs embedded in eye (retina) and brain tissues of normal and deformed zebrafish (Figure 9) shows more plasmonic blue and green (smaller) Ag NPs in normal zebrafish than deformed ones, while more plasmonic red (larger) Ag NPs in deformed zebrafish than normal ones. The size-dependent plasmonic optical properties of single Ag NPs enable us to determine their sizes in situ in real time using the approaches of single NP optical rulers, as we described previously.36 The results show the blue NPs are 30–45 nm in diameters; the green NPs of 46–62 nm, and the red NPs of 86–98 nm. The data in Figure 9 shows that the larger Ag NPs are more toxic than smaller NPs, further demonstrating size-dependent nano biocompatibility and toxicity of Ag NPs. This study also shows that early-developmental stage embryos can serve as ultrasensitive in vivo assays to effectively study size and dose (number) dependent biocompatibility and toxicity of the Ag NPs.
Distinct Findings of this Study in Comparison with Our Previous Studies
All findings presented in this study are distinctive, and cannot be extrapolated from any previous studies. In our previous studies,9,28 we have synthesized, purified and characterized the smaller Ag NPs (11.6±3.5 nm) and Au NPs (11.6±0.9 nm), and found that they could be stable in egg water over the entire embryonic development period (120 h). We found that these smaller NPs could passively diffuse into developing embryos via chorion pores, and the Ag NPs could generate toxic effects on embryonic development in a dose-dependent manner. In contrast, the Au NPs are much more biocompatible with embryonic development. These previous two studies effectively show the chemical-dependent nanotoxicity, owing to that we kept the sizes and shapes of both types of the NPs identical and used the same in vivo model organisms, experimental approaches and conditions for both studies. These previous results neither predict nor conclude the effects of larger Ag NPs (41.6±9.1 nm) on embryonic development. In fact, it still remains an open question about whether biocompatibility and toxicity of nanomaterials (e.g., Ag NPs) are size-dependent. If they do, are the larger NPs more toxic than smaller NPs, or vice versa?
Though several other studies have reported size-dependent nanotoxicity of Ag NPs,16–17 these studies did not use purified and stable Ag NPs and hence could not conclude whether those observations were due to the sizes of Ag NPs or residual chemicals in the NPs. They characterized properties of NPs using conventional ensemble measurements (e.g., UV-vis spectroscopy or DLS), which could neither determine the size distribution of NPs nor their doses and sizes in real time at single NP resolution. Ag NPs are not conventional chemicals, and their sizes and doses could alter over time due to their high reactivity and instability (aggregation). Thus, Ag NPs must be characterized in situ in real time in order to determine their dose, size and shape dependent nanotoxicity. Unfortunately, the in situ doses and sizes of Ag NPs used in these reported studies are entirely unknown, which makes their findings unreliable.16–17
To address the crucial questions of potential size-dependent nanotoxicity, we must keep all related experimental parameters (except the sizes of Ag NPs) in constant, and use the exactly identical approaches (e.g., same experimental conditions and embryos) as those we reported previously.9,28 Otherwise, we cannot compare the results from this study with those from our previous studies, which would hinder our understanding of size-dependent nanotoxicity.
In this study, we have synthesized and purified larger Ag NPs (41.6±9.1 nm) with the same shape (nearly spherical) as those smaller Ag NPs used in our previous studies.9 We found these larger Ag NPs stable (non-aggregated) in egg water over the duration of entire embryonic development (120 hpf). We further developed our single-NP imaging microscopy and spectroscopy to enable high-throughput quantitative analysis of number and sizes of single Ag NPs in vivo in situ in real time and in the tissues of interest. With these distinct capabilities, we found that such larger Ag NPs still could passively diffuse into the embryos (IME) via their chorionic pores, and the NPs stayed inside the embryos throughout the embryonic development (120 hpf).
In comparison with our previous study of the smaller Ag NPs (11.6 ± 3.5 nm) (0–0.71 nM), we found more various types of abnormalities with much severe deformities in this study (Fig. 6 and Table 1). Our previous study of the smaller Ag NPs shows: (i) as embryos were exposed to the lower concentrations of the smaller NPs (≤ 0.02 nM) for 120 hpf, none of embryos become deformed and majority of embryos (the same amount of embryos as those in egg water) developed to normal zebrafish; (ii) as embryos were exposed to the higher concentrations of the smaller NPs (0.2 nM) for 120 hpf, 45% of embryos still survived and developed to deformed zebrafish.9
At the same molar concentrations (doses), the large Ag NPs (41.6±9.1 nm) used in this study exhibit much higher toxicity than the small Ag NPs (11.6 ± 3.5 nm) that we used in our previous study.9 For example, the embryos developed to severe zebrafish as they were exposed to 0.02 nM of the large Ag NPs for 120 hpf. All embryos became dead when they were exposed to 0.2 nM of the large Ag NPs for 120 hpf.
Taken together, these important findings provide reliable new evidences and insights into the size-dependent nanotoxicity of Ag NPs at single-NP level, which has not yet been reported previously. Unlike ensemble measurements, in this study, our DFOMS-MSIS can determine the size of individual NPs and their surface properties, before, during and after the embryos are exposed to the NPs. Thus, single NP analysis depicts the effects of a population of single NPs on embryonic development in real time, and offers size and dose dependent nanotoxicity at single NP resolution. We found higher number of large Ag NPs (86–98 nm) and lower number of small Ag NPs (30–52 nm) in deformed zebrafish than normal zebrafish, showing the size dependent nanotoxicity and the large Ag NPs are more toxic toward the embryonic development than the small Ag NPs.
In comparison with our previous studies,9 at the same molar concentration, the larger Ag NPs (41.6 ± 9.1 nm) are more toxic than the smaller Ag NPs (11.6 ± 3.5 nm). Interestingly, for both types of the Ag NPs, one severe deformation (e.g., cardiac, eye or head) observed in any given deformed zebrafish was typically accompanied with several other types of deformations (e.g., finfold, tail and yolk sac edema) (Table 1). The results suggest that embryonic developmental pathways may be highly regulated and one pathway may highly depend upon others. Further studies are under way to characterize underlying molecular mechanisms of effects of the NPs on embryonic development. This study also introduces, for the first time, high-throughput quantitative analysis of the individual NPs embedded in tissues, which has not yet been reported previously. These new findings and tools are essential and highly significant for the future study of nanotoxicity.
Summary
In summary, we have designed, synthesized and characterized stable (non-aggregated) and purified Ag NPs with average diameters of 41.6±9.1 nm, and developed DFOMS-MSIS to characterize transport and toxicity of the Ag NPs in vivo in real time at the single NP resolution. We found that the Ag NPs (30–72 nm) passively diffused into embryos through chorionic pores of embryos, and stayed inside the embryos throughout the embryonic development (120 hpf). Majority of the NPs successfully diffused from egg water through chorionic pore, into CS and into IME. A few Ag NPs that trapped inside chorionic pores aggregated with other Ag NPs that diffused through the same paths and trapped in the same pores, generating larger Ag NPs and clogging the pores. Dose-dependent toxic effects of the NPs on the embryonic development were observed, showing that they were more biocompatible at lower doses and became highly toxic at the higher doses. As the Ag NP concentrations increase up to 0.2 nM, the number of embryos that developed to normal zebrafish decreases, while the number of embryos that became dead increases. As the NP concentrations increase beyond 0.2 nM, all embryos became dead. DFOMS-MSIS can quantitatively characterize individual Ag NPs embedded in the tissues of deformed and normal zebrafish, which had been incubated with the NPs for 120 hpf since they were at cleave-stage. The results show higher number of large Ag NPs (86–98 nm) and lower number of small Ag NPs (30–52 nm) in deformed zebrafish than normal zebrafish, demonstrating the size dependent nanotoxicity and the large Ag NPs are more toxic toward the embryonic development than the small Ag NPs. In comparison with our previous studies of effects of the smaller Ag NPs (11.6±3.5 nm) on embryonic development, we found striking size-dependent toxic effects of the Ag NPs on embryonic development. At the same molar concentration, the larger Ag NPs (41.6±9.1 nm) generate higher toxic effects and severer deformed zebrafish than the smaller NPs (11.6±3.5 nm). This study offers new evidences and new insights into size-dependent nanotoxicity of Ag NPs at single-NP resolution. This study also demonstrates the importance of study of nanotoxicity using stable and purified Ag NPs, and presenting their dose and size dependent nanotoxicity using molar concentrations of Ag NPs.
Supplementary Material
Acknowledgments
Funding Support
This work is supported in part by NSF (NIRT: CBET 0507036) and NIH (R01 GM0764401). Lee, Browning and Nallathamby are grateful for the support of NSF-GRAS (CBET 1042533), NIH-GRAS (R01 3GM0764401-S), and Dominion Scholar Fellowship, respectively.
Abbreviations
- Ag
silver
- AAS
atomic absorption spectroscopy
- AFM
atomic force microscopy
- CCD
charge-coupled device
- CL
chorionic layer
- CPC
chorionic pore canals
- CS
chorionic space
- DFOMS
dark-field optical microscopy and spectroscopy
- DI
deionized
- DLS
dynamic light scattering
- hpf
hours-post-fertilization
- FWHM
full-width-of-half-maximum
- HRTEM
high-resolution transmission electron microscope
- IME
inner mass of embryo
- LCTF
liquid-crystal-tunable-filter
- LSPR
localized surface plasmon resonance
- MSD
mean squared displacement
- MSIS
multi-spectral imaging system
- nm
nanometer
- NP
nanoparticles
- OC
outside chorion
- RTSD
real-time squared displacement
- SEM
scanning electron microscopy
- w/v
weight/volume
- λmax
peak wavelength
Footnotes
The On-Line Supporting Information (SI) Includes:
Three Real-Time Videos:
Videos S1–3: Real-time tracking of diffusion of individual Ag NPs into/in zebrafish embryos: (A) near or in chorion pore channels (CPCs) of chorionic layers (CL), (B) in the chorionic space (CS), and (C) in inner mass of the embryo (IME), respectively. See Fig. 2 in main text.
References
- 1.Chaloupka K, Malam Y, Seifalian AM. Nanosilver as a new generation of nanoproduct in biomedical applications. Trends Biotechnol. 2010;28:580–588. doi: 10.1016/j.tibtech.2010.07.006. [DOI] [PubMed] [Google Scholar]
- 2.Misra R, Acharya S, Sahoo SK. Cancer nanotechnology: application of nanotechnology in cancer therapy. Drug Discov Today. 2010;15:842–850. doi: 10.1016/j.drudis.2010.08.006. [DOI] [PubMed] [Google Scholar]
- 3.Teli MK, Mutalik S, Rajanikant GK. Nanotechnology and nanomedicine: going small means aiming big. Curr Pharm Des. 2010;16:1882–1892. doi: 10.2174/138161210791208992. [DOI] [PubMed] [Google Scholar]
- 4.Xu X-HN, Patel RP. In: Handbook of Nanostructured Biomaterials and Their Applications in Nanobiotechnology. Nalwa HS, editor. Vol. 1. American Scientific Publishers; Los Angeles, CA: 2005. pp. 435–456. [Google Scholar]
- 5.Coto-Garcia AM, Sotelo-Gonzalez E, Fernandez-Arguelles MT, Pereiro R, Costa-Fernandez JM, Sanz-Medel A. Nanoparticles as fluorescent labels for optical imaging and sensing in genomics and proteomics. Anal Bioanal Chem. 2011;399:29–42. doi: 10.1007/s00216-010-4330-3. [DOI] [PubMed] [Google Scholar]
- 6.Fabrega J, Fawcett SR, Renshaw JC, Lead JR. Silver nanoparticle impact on bacterial growth: effect of ph, concentration, and organic matter. Environ Sci Technol. 2009;43:7285–7290. doi: 10.1021/es803259g. [DOI] [PubMed] [Google Scholar]
- 7.Hillegass JM, Shukla A, Lathrop SA, MacPherson MB, Fukagawa NK, Mossman BT. Assessing nanotoxicity in cells in vitro. Wiley Interdiscip Rev Nanomed Nanobiotechnol. 2010;2:219–231. doi: 10.1002/wnan.54. [DOI] [PMC free article] [PubMed] [Google Scholar]
- 8.Sayers TJ. Targeting the extrinsic apoptosis signaling pathway for cancer therapy. Cancer Immunol Immunother. 2011;60:1173–1180. doi: 10.1007/s00262-011-1008-4. [DOI] [PMC free article] [PubMed] [Google Scholar]
- 9.Lee KJ, Nallathamby PD, Browning LM, Osgood CJ, Xu XHN. In vivo imaging of transport and biocompatibility of single silver nanoparticles in early development of zebrafish embryos. ACS Nano. 2007;1:133–143. doi: 10.1021/nn700048y. [DOI] [PMC free article] [PubMed] [Google Scholar]
- 10.Shaw BJ, Handy RD. Physiological effects of nanoparticles on fish: a comparison of nanometals versus metal ions. Environ Int. 2011;37:1083–1097. doi: 10.1016/j.envint.2011.03.009. [DOI] [PubMed] [Google Scholar]
- 11.Buzea C, Pacheco I, Robbie K. Nanomaterials and nanoparticles: sources and toxicity. Biointerphases. 2007;2:MR17–71. doi: 10.1116/1.2815690. [DOI] [PubMed] [Google Scholar]
- 12.George S, Xia T, Rallo R, Zhao Y, Ji Z, Lin S, Wang X, Zhang H, France B, Schoenfeld D, Damoiseaux R, Liu R, Lin S, Bradley KA, Cohen Y, Nel AE. Use of a high-throughput screening approach coupled with in vivo zebrafish embryo screening to develop hazard ranking for engineered nanomaterials. ACS Nano. 2011;5:1805–1817. doi: 10.1021/nn102734s. [DOI] [PMC free article] [PubMed] [Google Scholar]
- 13.Pfaller T, Colognato R, Nelissen I, Favilli F, Casals E, Ooms D, Leppens H, Ponti J, Stritzinger R, Puntes V, Boraschi D, Duschl A, Oostingh GJ. The suitability of different cellular in vitro immunotoxicity and genotoxicity methods for the analysis of nanoparticle-induced events. Nanotoxicology. 2010;4:52–72. doi: 10.3109/17435390903374001. [DOI] [PubMed] [Google Scholar]
- 14.Powers CM, Yen J, Linney EA, Seidler FJ, Slotkin TA. Silver exposure in developing zebrafish (Danio rerio): Persistent effects on larval behavior and survival. Neurotoxicology and Teratology. 2010;32:391–397. doi: 10.1016/j.ntt.2010.01.009. [DOI] [PMC free article] [PubMed] [Google Scholar]
- 15.Rabolli V, Thomassen LC, Princen C, Napierska D, Gonzalez L, Kirsch-Volders M, Hoet PH, Huaux F, Kirschhock CE, Martens JA, Lison D. Influence of size, surface area and microporosity on the in vitro cytotoxic activity of amorphous silica nanoparticles in different cell types. Nanotoxicology. 2010;4:307–318. doi: 10.3109/17435390.2010.482749. [DOI] [PubMed] [Google Scholar]
- 16.AshaRani PV, Mun GL, Hande MP, Valiyaveettil S. Cytotoxicity and genotoxicity of silver nanoparticles in human cells. ACS Nano. 2009;3:279–290. doi: 10.1021/nn800596w. [DOI] [PubMed] [Google Scholar]
- 17.Bar-Ilan O, Albrecht RM, Fako VE, Furgeson DY. Toxicity assessments of multisized gold and silver nanoparticles in zebrafish embryos. Small. 2009;5:1897–1910. doi: 10.1002/smll.200801716. [DOI] [PubMed] [Google Scholar]
- 18.Bai Y, Zhang Y, Zhang J, Mu Q, Zhang W, Butch ER, Snyder SE, Yan B. Repeated administrations of carbon nanotubes in male mice cause reversible testis damage without affecting fertility. Nature Nanotech. 2010;5:683–689. doi: 10.1038/nnano.2010.153. [DOI] [PMC free article] [PubMed] [Google Scholar]
- 19.Yamashita K, Yoshioka Y, Higashisaka K, Mimura K, Morishita Y, Nozaki M, Yoshida T, Ogura T, Nabeshi H, Nagano K, Abe Y, Kamada H, Monobe Y, Imazawa T, Aoshima H, Shishido K, Kawai Y, Mayumi T, Shin-ichi Tsunoda SI, Itoh N, Yoshikawa T, Yanagihara I, Saito S, Tsutsumi Y. Silica and titanium dioxide nanoparticles cause pregnancy complications in mice. Nature Nanotech. 2011;6:321–328. doi: 10.1038/nnano.2011.41. [DOI] [PubMed] [Google Scholar]
- 20.Nallathamby PD, Xu XHN. Study of cytotoxic and therapeutic effects of stable and purified silver nanoparticles on tumor cells. Nanoscale. 2010;2:942–952. doi: 10.1039/c0nr00080a. [DOI] [PMC free article] [PubMed] [Google Scholar]
- 21.Xu XHN, Chen J, Jeffers RB, Kyriacou SV. Direct measurement of sizes and dynamics of single living membrane transporters using nano-optics. Nano Lett. 2002;2:175–182. [Google Scholar]
- 22.Qi J, Dang X, Hammond PT, Belcher AM. Highly efficient plasmon-enhanced dye-sensitized solar cells through metal@oxide core-shell nanostructure. ACS Nano. 2011;5:7108–7116. doi: 10.1021/nn201808g. [DOI] [PubMed] [Google Scholar]
- 23.Ahamed M, Alsalhi MS, Siddiqui MK. Silver nanoparticle applications and human health. Clin Chim Acta. 2010;411:1841–1848. doi: 10.1016/j.cca.2010.08.016. [DOI] [PubMed] [Google Scholar]
- 24.Kyriacou SV. Thesis. Old Dominion University; Norfolk, VA: 2003. Real-time study of multidrug resistance mechanism in Pseudomonas aeruginosa using nanoparticle optics and single live cell imaging. [Google Scholar]
- 25.den Hertog J. Chemical Genetics: Drug Screens In Zebrafish. Biosci Rep. 2005;25:289–297. doi: 10.1007/s10540-005-2891-8. [DOI] [PubMed] [Google Scholar]
- 26.Hill AJ, Teraoka H, Heideman W, Peterson RE. Zebrafish as a model vertebrate for investigating chemical toxicity. Toxicol Sci. 2005;86:6–19. doi: 10.1093/toxsci/kfi110. [DOI] [PubMed] [Google Scholar]
- 27.Kahn P. Zebrafish hit the big time. Science. 1994;264:904–905. doi: 10.1126/science.8178149. [DOI] [PubMed] [Google Scholar]
- 28.Browning LM, Lee KJ, Huang T, Nallathamby PD, Lowman J, Xu XHN. Random walk of single gold nanoparticles in zebrafish embryos leading to stochastic toxic effects on embryonic developments. Nanoscale. 2009;1:138–152. doi: 10.1039/b9nr00053d. [DOI] [PMC free article] [PubMed] [Google Scholar]
- 29.Nallathamby PD, Lee KJ, Xu XHN. Design of stable and uniform single nanoparticle photonics for in vivo dynamics imaging of nanoenvironments of zebrafish embryonic fluids. ACS Nano. 2008;2:1371–1380. doi: 10.1021/nn800048x. [DOI] [PMC free article] [PubMed] [Google Scholar]
- 30.Teraoka H, Dong W, Hiraga T. Zebrafish as a novel experimental model for developmental toxicology. Congenit Anom (Kyoto) 2003;43:123–132. doi: 10.1111/j.1741-4520.2003.tb01036.x. [DOI] [PubMed] [Google Scholar]
- 31.Zon LI, Peterson RT. In vivo drug discovery in the zebrafish. Nat Rev Drug Discovery. 2005;4:35–44. doi: 10.1038/nrd1606. [DOI] [PubMed] [Google Scholar]
- 32.Bohren CF, Huffman DR. Absorption and Scattering of Light by Small Particles. Wiley; New York: 1983. pp. 287–380. [Google Scholar]
- 33.Kelly KL, Coronado E, Zhao LL, Schatz GC. The optical properties of metal nanoparticles: the influence of size, shape, and dielectric environment. J Phys Chem B. 2003;107:668–677. [Google Scholar]
- 34.Kreibig U, Vollmer M. Optical Properties of Metal Clusters. Springer; Berlin: 1995. pp. 14–123. [Google Scholar]
- 35.Mie G. Beiträg zur optik trüber medien, speziell kolloidaler metrallösungen. Annu Phys. 1908;25:377–445. [Google Scholar]
- 36.Nallathamby PD, Huang T, Xu XHN. Design and characterization of optical nano rulers of single nanoparticles using optical microscopy and spectroscopy. Nanoscale. 2010;2:1715–1722. doi: 10.1039/c0nr00303d. [DOI] [PMC free article] [PubMed] [Google Scholar]
- 37.Huang T, Nallathamby PD, Gillet D, Xu XHN. Design and synthesis of single nanoparticle optical biosensors for imaging and characterization of single receptor molecules on single living cells. Anal Chem. 2007;79:7708–7718. doi: 10.1021/ac0709706. [DOI] [PMC free article] [PubMed] [Google Scholar]
- 38.Huang T, Nallathamby PD, Xu XHN. Photostable single-molecule nanoparticle optical biosensors for real-time sensing of single cytokine molecules and their binding reactions. J Am Chem Soc. 2008;130:17095–17105. doi: 10.1021/ja8068853. [DOI] [PMC free article] [PubMed] [Google Scholar]
- 39.Lee KJ, Browning LM, Huang T, Ding F, Nallathamby PD, Xu XHN. Probing of multidrug ABC membrane transporters of single living cells using single plasmonic nanoparticle optical probes. Anal Bioanal Chem. 2010;397:3317–3328. doi: 10.1007/s00216-010-3864-8. [DOI] [PMC free article] [PubMed] [Google Scholar]
- 40.Nallathamby PD, Lee KJ, Desai T, Xu XHN. Study of multidrug membrane transporters of single living pseudomonas aeruginosa cells using size-dependent plasmonic nanoparticle optical probes. Biochemistry. 2010;49:5942–5953. doi: 10.1021/bi100268k. [DOI] [PMC free article] [PubMed] [Google Scholar]
- 41.Xu XHN, Brownlow WJ, Kyriacou SV, Wan Q, Viola JJ. Real-time probing of membrane transport in living microbial cells using single nanoparticle optics and living cell imaging. Biochemistry. 2004;43:10400–10413. doi: 10.1021/bi036231a. [DOI] [PubMed] [Google Scholar]
- 42.Huang T, Xu XHN. Synthesis and characterization of tunable rainbow colored silver nanoparticle solutions using single-nanoparticle plasmonic microscopy and spectroscopy. J Mater Chem. 2010;20:9867–9876. doi: 10.1039/C0JM01990A. [DOI] [PMC free article] [PubMed] [Google Scholar]
- 43.Xu XHN, Huang S, Brownlow W, Salatia K, Jeffers R. Size and temperature dependence of surface plasmon absorption of gold nanoparticles induced by tris(2,2′-bipyridine)ruthenium(ii) J Phys Chem B. 2004;108:15543–15551. [Google Scholar]
- 44.Gebhart SC, Thompson RC, Mahadevan-Jansen A. Liquid-crystal tunable filter spectral imaging for brain tumor demarcation. Appl Opt. 2007;46:1896–1910. doi: 10.1364/ao.46.001896. [DOI] [PubMed] [Google Scholar]
- 45.Huang T, Browning LM, Xu X-HN. Far-field photostable optical nanoscopy (PHOTON) for real-time super-resolution single-molecular imaging of signaling pathways of single live cells. Nanoscale. doi: 10.1039/C1032NR11739H. [DOI] [PubMed] [Google Scholar]
- 46.Huang T, Cai W, Elsayed-Ali HE, Xu XHN. High-throughput ultrasensitive characterization of chemical, structural and plasmonic properties of EBL-fabricated single silver nanoparticles. Nanoscale. 2012;4:380–385. doi: 10.1039/c1nr11368b. [DOI] [PubMed] [Google Scholar]
- 47.Huang T, Xu XHN. Multicolored nanometer-resolution mapping of single protein-ligand binding complex using far-field photostable optical nanoscopy (PHOTON) Nanoscale. 2011;3:3567–3572. doi: 10.1039/c1nr10182j. [DOI] [PubMed] [Google Scholar]
- 48.Xu XHN, Brownlow WJ, Huang S, Chen J. Real-time measurements of single membrane pump efficiency of single living pseudomonas aeruginosa cells using fluorescence microscopy and spectroscopy. Biochem Biophys Res Commun. 2003;305:79–86. [Google Scholar]
- 49.Mulvaney P. Surface plasmon spectroscopy of nanosized metal particles. Langmuir. 1996;12:788–800. [Google Scholar]
- 50.Rawson DM, Zhang T, Kalicharan D, Jongebloed WL. Field emission scanning electron microscopy and transmission electron microscopy studies of the chorion, plasma membrane and syncytial layers of the gastrula stage embryo of the zebrafish brachydanio rerio: a consideration of the structural and functional relationships with respect to cryoprotectant penetration. Aquaculture Research. 2000;31:325–336. [Google Scholar]
- 51.Kusumi A, Sako Y. Compartmental structure of the plasma membrane for receptor movements as revealed by a nanometer-level motion analysis. J Cell Biology. 1994;125:1251–1264. doi: 10.1083/jcb.125.6.1251. [DOI] [PMC free article] [PubMed] [Google Scholar]
- 52.Kusumi A, Sako Y, Yamamoto M. Confined lateral diffusion of membrane receptors as studied by single particle tracking (nanovid microscopy). effects of calcium-induced differentiation in cultured epithelial cells. Biophys J. 1993;65:2021–2040. doi: 10.1016/S0006-3495(93)81253-0. [DOI] [PMC free article] [PubMed] [Google Scholar]
- 53.Tinoco I, Sauer K, Wang J, Puglisi JD. Physical Chemistry-Principles and Applications in Biological Sciences. Prentice Hall; New Jersey: 2002. pp. 274–290. [Google Scholar]
- 54.Qian H, Sheetz MP, Elson EL. Single particle tracking. Analysis of diffusion and flow in two-dimensional systems. Biophys J. 1991;60:910–921. doi: 10.1016/S0006-3495(91)82125-7. [DOI] [PMC free article] [PubMed] [Google Scholar]
- 55.Heiden TC, Dengler E, Kao WJ, Heideman W, Peterson RE. Developmental toxicity of low generation PAMAM dendrimers in zebrafish. Toxicol Appl Pharmacol. 2007;225:70–79. doi: 10.1016/j.taap.2007.07.009. [DOI] [PMC free article] [PubMed] [Google Scholar]
- 56.Henry TR, Spitsbergen JM, Hornung MW, Abnet CC, Peterson RE. Early life stage toxicity of 2,3,7,8-tetrachlorodibenzo-p-dioxin in zebrafish (Danio rerio) Toxicol Appl Pharmacol. 1997;142:56–68. doi: 10.1006/taap.1996.8024. [DOI] [PubMed] [Google Scholar]
- 57.Sisman T. Early life stage and genetic toxicity of stannous chloride on zebrafish embryos and adults: toxic effects of tin on zebrafish. Environ Toxicol. 2011;26:240–249. doi: 10.1002/tox.20550. [DOI] [PubMed] [Google Scholar]
- 58.Samson JC, Shenker J. The teratogenic effects of methylmercury on early development of the zebrafish, Danio rerio. Aquat Toxicol. 2000;48:343–354. doi: 10.1016/s0166-445x(99)00044-2. [DOI] [PubMed] [Google Scholar]
- 59.Brannen KC, Panzica-Kelly JM, Danberry TL, Augustine-Rauch KA. Development of a zebrafish embryo teratogenicity assay and quantitative prediction model. Birth Defects Res B Dev Reprod Toxicol. 2010;89:66–77. doi: 10.1002/bdrb.20223. [DOI] [PubMed] [Google Scholar]
- 60.Hubenthal F. Ultrafast dephasing time of localized surface plasmon polariton resonance and the involved damping mechanisms in colloidal gold nanoparticles. Prog Surf Sci. 2007;82:378–387. [Google Scholar]
Associated Data
This section collects any data citations, data availability statements, or supplementary materials included in this article.