Abstract
Motivation: Owing to the size and complexity of large multi-component biological assemblies, the most tractable approach to determining their atomic structure is often to fit high-resolution radiographic or nuclear magnetic resonance structures of isolated components into lower resolution electron density maps of the larger assembly obtained using cryo-electron microscopy (cryo-EM). This hybrid approach to structure determination requires that an atomic resolution structure of each component, or a suitable homolog, is available. If neither is available, then the amount of structural information regarding that component is limited by the resolution of the cryo-EM map. However, even if a suitable homolog cannot be identified using sequence analysis, a search for structural homologs should still be performed because structural homology often persists throughout evolution even when sequence homology is undetectable, As macromolecules can often be described as a collection of independently folded domains, one way of searching for structural homologs would be to systematically fit representative domain structures from a protein domain database into the medium/low resolution cryo-EM map and return the best fits. Taken together, the best fitting non-overlapping structures would constitute a ‘mosaic’ backbone model of the assembly that could aid map interpretation and illuminate biological function.
Result: Using the computational principles of the Scale-Invariant Feature Transform (SIFT), we have developed FOLD-EM—a computational tool that can identify folded macromolecular domains in medium to low resolution (4–15 Å) electron density maps and return a model of the constituent polypeptides in a fully automated fashion. As a by-product, FOLD-EM can also do flexible multi-domain fitting that may provide insight into conformational changes that occur in macromolecular assemblies.
Availability and implementation: FOLD-EM is available at: http://cs.stanford.edu/~mitul/foldEM/, as a free open source software to the structural biology scientific community.
Contact: mitul@cs.stanford.edu or mcmorais@utmb.edu
Supplementary information: Supplementary data are available at Bioinformatics online.
1 INTRODUCTION
Recent technological advances have resulted in exponential growth of the amount of data available at each level of the sequence–structure–function relationship. Along with this expansion of available data comes the need for systematic and objective methods for its analysis and interpretation. For example, the amount of information that can be extracted from the structure of an isolated macromolecule is limited; to fully understand how a macromolecule functions in a cell requires knowledge of not only its interaction partners, but also how mutually induced conformational changes that occur upon complex formation give rise to integrated biological function. Toward this end, structural biology continues to tackle larger and larger targets, ranging from radiographic structures of binary protein complexes to cryo-EM image reconstructions of large macromolecular complexes and cryo-electron tomograms of entire cells. Unfortunately, cryo-elecron microscopy/tomography (cryo-EM/ET) maps typically have low signal-to-noise ratios, making their analysis and interpretation challenging and somewhat subjective, depending on the skill of specialized investigators. Hence, there is a need for computational methods to systematically and quantitatively analyze maps of macromolecular assemblies, organelles and whole cells. In particular, tools capable of (i) identifying individual proteins within larger complexes and (ii) characterizing conformational rearrangements relevant to macromolecular function, would provide non-structural specialists access to structural data, thus allowing for enhanced biological perspectives.
We recently reported the development of a new computational tool, MOTIF-EM, that solves a critical structural comparison problem, P, in a fully automated fashion (Saha et al., 2010). P is defined as follows: compare a non-atomic resolution structure (e.g. a cryo-EM map) with another structure (either another map or an atomic resolution structure) and identify conserved structural domains/motifs or structurally equivalent sub-volumes between the input pair. MOTIF-EM solves P (Supplementary Fig. S5), and thus detects conserved sub-structures in a pair of structures, by using a novel algorithm inspired by a recent breakthrough in 2D object recognition, the ‘scale-invariant feature transform’ or SIFT (Lowe, 2004; details in Section 2). Because of its unmatched effectiveness in carrying out feature detection, adaptations of SIFT are being used in a wide range of scientific applications including tracking of robots, 3D scene/object modeling/recognition/tracking, human action recognition and human brain analysis in 3D Magnetic Resonance images and so forth (Lowe, 2004).
Based on the feature-recognition principles used in MOTIF-EM, we have now created a new software tool, FOLD-EM, to automatically identify macromolecular folds in electron density maps and to characterize conformational changes that accompany different biological states of macromolecules. FOLD-EM systematically searches an input electron density map of a macromolecular assembly for sub-volumes that are structurally homologous to one or more protein domains present in the SCOP protein database. By recursively repeating this procedure, a modular structure incorporating all the fitted domains is returned, thus providing a preliminary Cα-backbone model of the macromolecular assembly under investigation. Similarly, using our approach, it is possible to automatically determine if different transformations are necessary for fitting different regions when comparing a multi-domain structure to an input electron density map of a macromolecule that can adopt different conformations. As a result, SIFT-based feature detection is inherently capable of performing flexible multi-domain fitting and characterizing conformational differences between the structures being compared. Our program assumes no a priori knowledge of the type or relative orientation of macromolecular folds present in the input electron density map, and thus provides a fully automated means of analyzing electron density maps of macromolecules and their assemblies. Although the program was developed for the analysis of medium to low resolution electron density maps obtained via cryo-EM, it should work equally well, if not better, with higher resolution electron density maps such as those obtained by X-ray crystallography. Here, we (i) discuss the computational challenges that needed to be overcome to develop FOLD-EM; (ii) demonstrate the effectiveness of FOLD-EM in carrying out flexible multi-domain and large-scale fittings using synthetic and real data; and (iii) consider some advantages of FOLD-EM compared with existing softwares that fit atomic resolution structures into medium to low resolution electron density maps.
2 METHODS
The SIFT-based feature-recognition module used by FOLD-EM is based on a similar module first developed for our software MOTIF-EM (Saha et al., 2010), which is summarized in Supplementary Text S1. Although MOTIF-EM and FOLD-EM use a similar feature-detection algorithm (Supplementary Fig. S1), the capabilities of the two programs are different. MOTIF-EM is limited to pairwise structural comparisons between two cryo-EM maps, whereas FOLD-EM is capable of a fully automated large-scale structural comparison wherein an input electron density map is systematically compared with representative domains present in a protein domain databank. By recursively identifying and fitting independently folded domains in the input map, the program returns a modular domain structure of the macromolecular assembly under investigation. FOLD-EM can also be used for pairwise comparisons between two maps or for fitting high-resolution structures into lower resolution electron density maps. However, unlike MOTIF-EM and many other fitting programs, FOLD-EM will automatically determine if different transformations are necessary for fitting different regions when comparing a multi-domain structure with an input electron density map of a macromolecule that can adopt different conformations. As a result, FOLD-EM is inherently capable of performing flexible fitting and characterizing conformational differences between the structures being compared. In addition to writing new modules to carry out recursive large-scale and flexible fitting, FOLD-EM development also required partial redesigning of MOTIF-EM's SIFT-based feature detection module (Supplementary Fig. S1) to run ∼10× faster. Without this speed increase, carrying out fold recognition by searching thousands of domains in the SCOP database would have been slow and inefficient. The speed-up was obtained by recognizing that during the clustering phase (step 5 in Supplementary Fig. S1), only about 10% of the clustering data, i.e. from the dense most regions of the clustering space, was sufficient to obtain accurate clustering results.
FOLD-EM carries out large-scale fold recognition and fitting as follows. In the first step, FOLD-EM selects ∼4000 representative protein domains from SCOP. Usually the first member of a SCOP domain family is chosen, but additional domains are picked from the same domain family if they are structurally at least 5 Å RMSD apart from at least one of the selected domains. Within FOLD-EM, this SCOP subset represents all superfamilies of the five classes of SCOP protein domains: all-alpha, all-beta, alpha/beta (mainly parallel beta sheets), alpha+beta (mainly antiparallel beta sheets), and small proteins. FOLD-EM then converts each domain structure into electron density by applying a Gaussian fall-off at each atomic position to simulate atomic form factors; these maps can then be furthered blurred to match the resolution of the input map. Next, FOLD-EM scores each domain against the input low-resolution structure in the following way. The feature-recognition module in FOLD-EM returns a graph clique as the end result of comparing two structures. The size of the clique (i.e. the number of nodes in the graph) is returned as the final score. The size of the clique is essentially the size s of the common sub-structure (number of map grid points that make up the sub-structure) between the input structure pair. For domain fitting, s translates as the number of residues that makes up the portion of the input domain that fits into the input map, and is the final score (SFE) returned by FOLD-EM for the fit of a SCOP domain into the input structure. The scoring function in Chimera's (Pettersen et al., 2004) fitting tool, known as ‘average map value’, SAV, is used by FOLD-EM for secondary evaluation. That is, after some domains with highest SFE’s are chosen, they are finally sorted using their respective SAVs to return the final list of candidate domains. If there is more than one domain in the input map, a subsequent domain is similarly chosen, except that the regions in the input map corresponding to the already chosen domains are excluded from the evaluation.
Similarly, FOLD-EM carries out flexible multi-domain fitting by iteratively fitting each domain present in a multi-domain structure. For example, in the case of the three-domain protein, the entire three-domain structure can be input to FOLD-EM along with the input map. FOLD-EM will identify the largest domain and fit this domain into its corresponding sub-volume in the input cryo-EM map. The remaining unfitted remnant structure will consist of the input map minus the largest fitted domain/s. In the next iteration, FOLD-EM will take the remnant structure and search the remaining map for the best fit. In this way, FOLD-EM recursively docks each domain to its corresponding sub-volume in the electron density map.
FOLD-EM is highly parallelizable. The fold-recognition test cases using the SCOP database took 72–90 h to execute on a 100 processor computing cluster at University of Texas Medical Branch, Galveston (UTMB). However, the same job should only take few hours using a national computing cluster with thousands of processors. The one-time docking/fitting test cases took ∼2 minutes, to execute on the 100 processor UTMB cluster.
FOLD-EM is available as an open-source software for the structural biology scientific community at http://cs.stanford.edu/∼mitul/foldEM.
Simulated cryo-EM maps were generated from atomic resolution structures using EMAN (Ludtke et al., 1999).
3 RESULTS
3.1 Evaluating the fitting/docking module in FOLD-EM
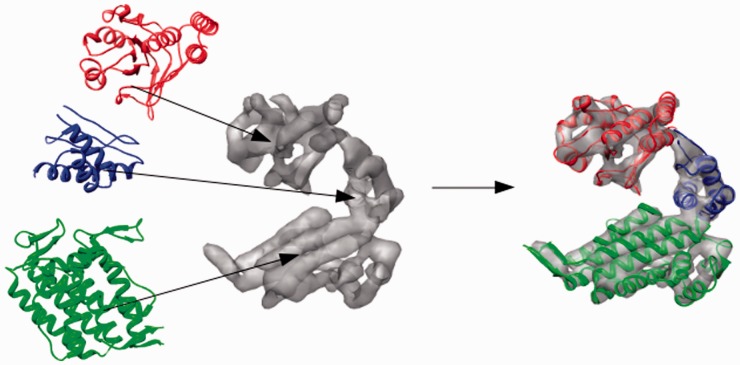
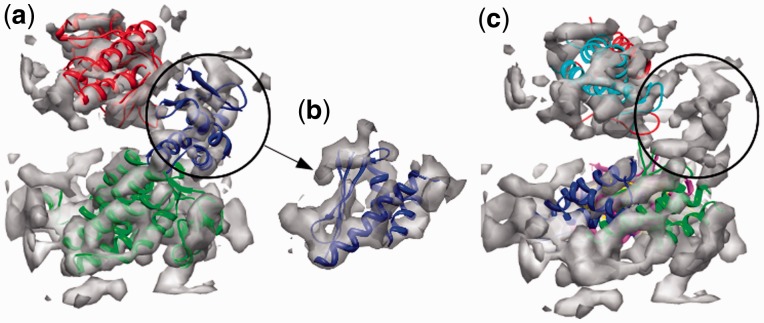
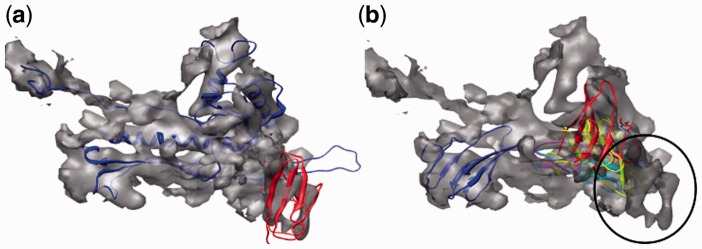
To verify that FOLD-EM is capable of recognizing and fitting conserved structural domains into low-resolution electron density maps, we tested the algorithm using simulated and real data. First, electron density maps, comparable to those obtained via cryo-EM, were calculated for a GroEL monomer in the 5–20 Å resolution range. To assess the effect of search model size on fitting, we split the GroEL monomer into three separate domains: (i) the equatorial domain (249 residues); (ii) the apical domain (182 residues); and (iii) the intermediate domain (90 residues) (Fig. 1). Supplementary Table S1a reports the results from fitting each domain. The reported error values for fitting each domain into maps of different resolutions are low, demonstrating the effectiveness of FOLD-EM in accurately fitting domains/motifs of varying sizes into relatively low-resolution maps. We have also tested the ability of FOLD-EM to fit atomic resolution structures into experimentally determined cryo-EM maps. Figure 2 shows the result of using FOLD-EM to fit the known atomic resolution domain structures of GroEL into a 6 Å experimentally determined cryo-EM map. For comparison, we also tried fitting the groEL domains using other popular fitting software including SITUS (Wriggers and Birmanns, 2001), FOLDHUNTER (Jiang et al., 2001), Chimera fitting (Pettersen et al., 2004), MODELLER (Topf et al., 2005), COAN (Volkmann and Hanein, 2003), MOLREP (Vagin and Teplyakov, 1997). In our hands, only FOLD-EM was able to successfully fit the GroEL intermediate domain. Similarly, Figure 3 shows the results of fitting the two-domain capsid protein from bacteriophage ф29 into an experimentally determined cryo-EM map of an isometric ф29 particle. FOLD-EM successfully positioned both the HK97 and the bacterial immunoglobulin (BIG2) domains of the capsid protein (Morais et al., 2005) into their corresponding densities without any user intervention. The resulting fits agree well with previously reported results [(Morais et al., 2005); Supplementary Table S5] obtained using semi-automated means. In contrast, other popular fitting software (SITUS, FOLDHUNTER, Chimera fitting, MODELLER, COAN, MOLREP) were able to successfully fit the larger HK97 domain, but not the BIG2 domain. We suspect that other fitting softwares failed in these cases because the BIG2 and the GroEL intermediate domains are very small compared with the target density. However, it should be noted that other softwares were run using default settings, and it is likely that an experienced user would obtain better results.
Fig. 1.
We test the ability of FOLD-EM, to fit different sized domains (the equatorial, apical and intermediate domains of GroEL; ribbon models shown on left) into cryo-EM maps simulated from the GroEL monomer (PDB ID: 1OEL, density maps shown in gray), in the resolution range of 5–20 Å. The rightmost panel shows the result of fitting the three domains using FOLD-EM
Fig. 2.
(a) Fit of the atomic resolution GroEL domains (red, blue and green ribbon models) into a 6 Å cryo-EM map (grey) of GroEL (from Ludtke et al., 2004) using FOLD-EM. The fittings are consistent (Supplementary Table S5 gives fitting RMSD errors) with previously published results in Ludtke et al. (2004). (b) Fit of the atomic-resolution GroEL intermediate domain (blue ribbon model) into the 6 Å GroEL cryo-EM map, as determined by FOLD-EM [as in (b) above] enlarged, with only the map region of the intermediate domain shown for clarity). (c) Incorrect fits of the same intermediate domain (ribbon models) into regions other than the intermediate domain region (circled), of the map obtained using popular fitting software—SITUS (magenta), FOLDHUNTER (cyan), the Chimera fitting tool (yellow), MODELLER (red), MOLREP (blue) and COAN (green); the apical and equatorial domains of GroEL were successfully fit by other popular software. We suspect that other programs were not able to fit the intermediate domain because it is very small compared with the target map
Fig. 3.
(a) Successful fit of the HK97 (blue ribbon) and BIG2 domains (red ribbon) into cryo-EM density of the phi29 isometric particle obtained using FOLD-EM (Morais et al., 2005; Supplementary Table S5). (b) Incorrect fit of the BIG2 domain, into regions other than the BIG2 domain region (circled), obtained using the popular fitting software described above—SITUS (magenta), FOLDHUNTER (cyan), Chimera fitting tool (yellow), MODELLER (red), MOLREP (blue) and COAN (green). Again, we suspect that these failures occurred because the BIG2 domain is too small compared with the target map
To further evaluate the effectiveness of FOLD-EM as a docker, we ran FOLD-EM on 30 additional test cases, the successful outcome of which is reported in Supplementary Table S1b. Ten extra experimentally determined maps, used here, were obtained from Electron Microscopy Data Bank (EMDB). Each map was accompanied by atomic resolution domains, which were supposed to fit the corresponding map. Each map was further filtered to additional lower resolutions (10 Å and 15 Å, respectively), which resulted in 20 additional maps. As seen in the Table, in all these additional 30 test cases, FOLD-EM successfully fitted the associated domains (PDB ID in column #1), with reasonably low RMSD errors, further confirming the reliability of FOLD-EM as an effective docker.
3.2 Fitting models with non-precise boundaries
A strength of the feature-recognition algorithm used by FOLD-EM is its ability to carry out partial matching. That is, FOLD-EM can match and align two objects precisely even if there is only partial structural homology. As a result, the user does not need to precisely define the boundary of the domain to be fitted into a target map, i.e. the input domain might have some extraneous region/residues or may have some part of it missing. Figure 4a and b schematically illustrate the problems associated with partial matching/fitting. As seen in the figures, while trying to fit a structural homolog (black wire) into its corresponding region in a map (blue region), presence of extraneous regions (red wire; which does not have any corresponding ‘density’ in the target map) can introduce fitting errors. Here, we show that FOLD-EM is able to ignore any extraneous regions and preserve fitting accuracy using both simulated and real/experimental data.
Fig. 4.
(a and b) Cartoon illustrating problems associated with fitting partial structures. The high-resolution structure (wire model in red and black) has extraneous region (red), which does not have corresponding density in the target map (pale blue region). This extraneous region can act as noise and reduce the accuracy of the fit and the associated score [as seen in (b)]. As FOLD-EM can separate conserved regions from non-conserved ones, it will ignore the red extraneous region, yielding an accurate fit (a) and associated score
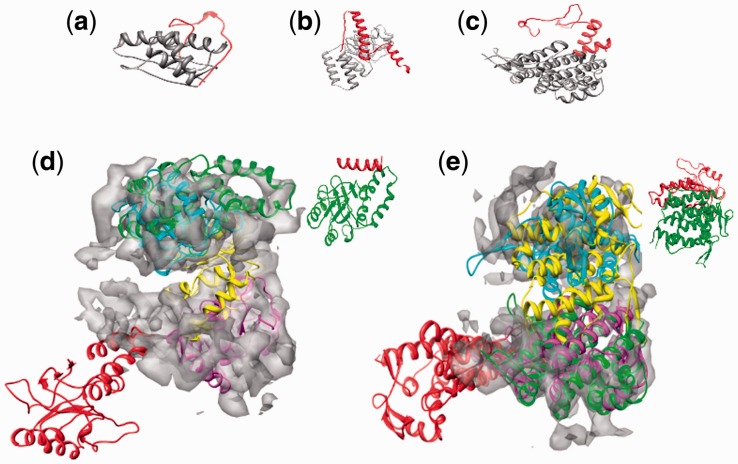
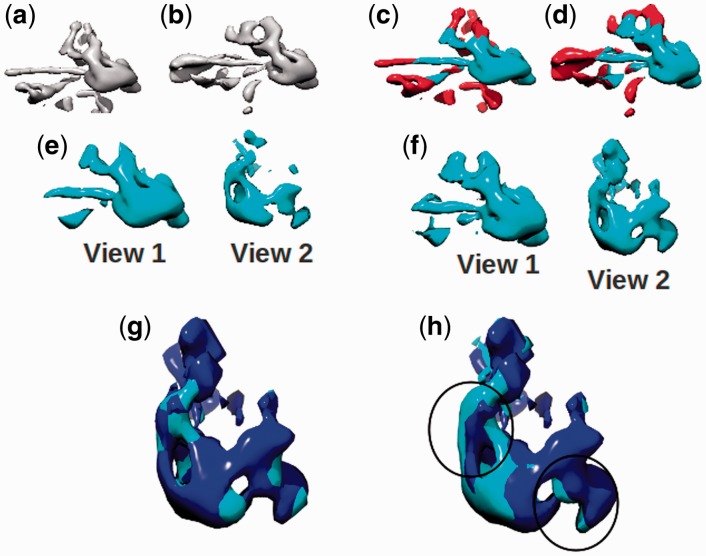
In simulated data, as earlier, we used FOLD-EM to fit the three domains of GroEL into simulated cryo-EM maps of GroEL. However, we have now added extraneous structural features/residues to each domain of the search model (Fig. 5a–c) that are not present in the simulated maps. Supplementary Table S2a–c show the results obtained by using FOLD-EM to fit these altered atomic resolution domain structures, each with differing amounts of extraneous structures/residues introduced, into simulated cryo-EM maps of GroEL. The low RMSD errors demonstrate the effectiveness of FOLD-EM in fitting structures in the presence of extraneous non-homologous structural features. We also tested the partial matching capabilities of FOLD-EM by correctly fitting our structurally altered GroEL domains into an experimentally determined 6 Å cryo-EM map of GroEL (Ludtke et al., 2004). Figure 5d and e show successful fits obtained using FOLD-EM in the presence of extraneous non-homologous structural features. The figures also show how some popular fitting programs (SITUS, FOLDHUNTER, Chimera fitting, MODELLER) failed to obtain correct fits, most likely due to the presence of extraneous non-homologous features. We also tested whether or not FOLD-EM could successfully perform partial fitting using search structures obtained from other low-resolution structural methods such as low resolution X-ray crystallography, small angle X-ray scattering and cryo-EM. As a test case, we fitted (Fig. 6a–h) the mature conformation of the bacteriophage P22 capsid protein, obtained via cryo-EM, into density corresponding to the immature conformation of the capsid, also obtained using cryo-EM (Jiang et al., 2003). Unexpectedly, FOLD-EM was also able to improve the alignment of the two subunits reported earlier (Jiang et al., 2003), as seen in Figure 6g and h (see Supplementary Text S2 for the evaluation of this result). This test case confirmed the ability of FOLD-EM to obtain meaningful fits in spite of inaccurate domain boundary specifications for both the search model and the target map.
Fig. 5.
(a–c) show examples of independently folded domains with extrananeous non-homologous features that were successfully fitted using FOLD-EM. The red regions show the noise/extraneous residues that were incorporated to test the robustness of FOLD-EM. (d) The fitted green ribbon structure shows the correct fit (consistent with Ludtke et al., 2004); Supplementary Table S5 gives the fitting RMSD error) of the apical domain with ∼20 added extraneous residues (shown on right), obtained using FOLD-EM. The rest of the ribbon structures show the incorrect fittings obtained using the popular fitting software—SITUS (magenta), FOLDHUNTER (cyan), Chimera fitting tool (yellow) and MODELLER (red). As seen, the incorrect fits occur outside the upper apical domain region, except in the case of FOLDHUNTER, where the fit is still off by at least 25 Å RMSD. (e) The fitted green ribbon structure shows the correct fit (consistent with Ludtke et al., 2004); Supplementary Table S5 gives fitting RMSD error) of the equatorial domain with ∼150 added extraneous residues added (shown on right), obtained using FOLD-EM. The rest of the ribbon structures show the incorrect fits obtained using the popular fitting software—SITUS (magenta), FOLDHUNTER (cyan), Chimera fitting tool (yellow) and MODELLER (red). As seen, the incorrect fits occur outside the bottom equatorial domain region, except in the case SITUS, where the fit is still off by at least 6.2 Å RMSD
Fig. 6.
(a and b) Cryo-EM density of capsid monomers from pre- and post-capsid maturation states of phage P22, respectively (10). (c and d) The conserved region between the monomers [shown in (a and b)] is shown in blue, as determined by FOLD-EM. The rest of the region is shown as red. (e and f) Here, only the conserved region [colored as blue in (c and d), respectively] is shown, from two different views. (g and h) [enlarged with respect to (a and b)]: alignment of the extracted conserved pairs [shown in view #2 of (e and f)] using FOLD-EM and data from Jiang et al. (2003), respectively. Circled regions in (h) highlight areas of poor local alignment, determined by visual inspection
To further demonstrate the effectiveness of FOLD-EM to do partial matching-based fitting, we ran FOLD-EM on an additional 45 test cases, involving three different experimentally determined cryo-EM maps (GroEL, Rice Dwarf Virus, 20S Proteasome), the predominantly successful outcomes of which are reported in Supplementary Table S2d. The three maps were filtered to lower resolutions (10 Å or 15 Å), to generate additional maps. Here also, 10%, 20%, 30%, respectively, extra residues were added to respective atomic resolution domains (column #1) that were fitted to these maps using FOLD-EM. As seen in the Table, in all these cases, FOLD-EM was able to fit domains with reasonably low RMSD errors, further affirming the effectiveness of FOLD-EM to do fitting incorporating the issue of partial matching seen in Figure 4.
3.3 Fitting that incorporates conformation changes arising from domain movements
Another unique aspect of FOLD-EM is its ability to automatically carry out simultaneous multi-domain fitting that accounts for conformational changes resulting from domain movements that may have occurred in the target low-resolution map relative to the search model. Similar to the situation described above where only part of a search model occurs in a cryo-EM structure, conformational differences between structures being compared can lead to inaccurate fitting results; in general, it is challenging to simultaneously align multiple domains if each domain requires a different geometric transformation to fit it into its corresponding electron density. Here, we show that FOLD-EM can automatically determine the extent of discreet structurally homologous domains/regions shared by two structures, and then separately fit each structural unit/domain. As a result, FOLD-EM is inherently capable of performing unbiased fully automated flexible fitting that makes no assumptions regarding domain boundaries or motions.
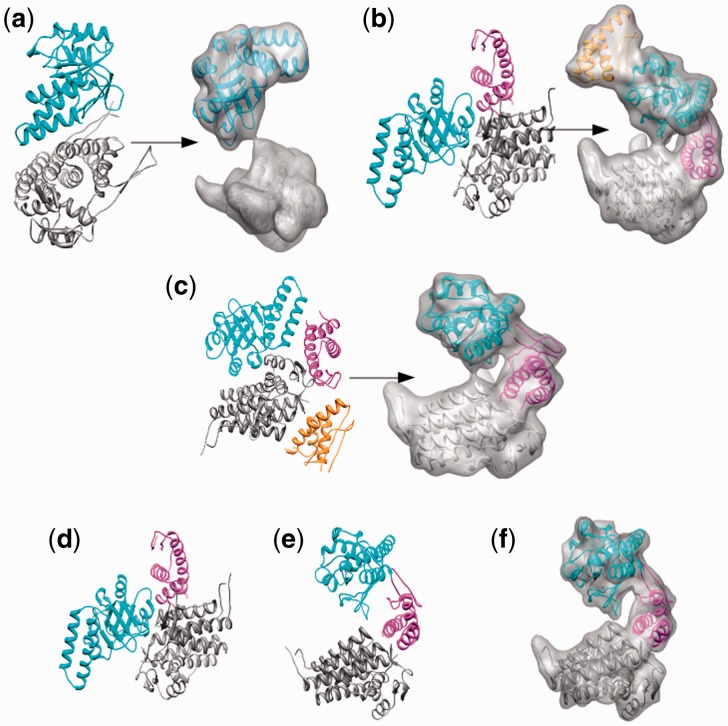
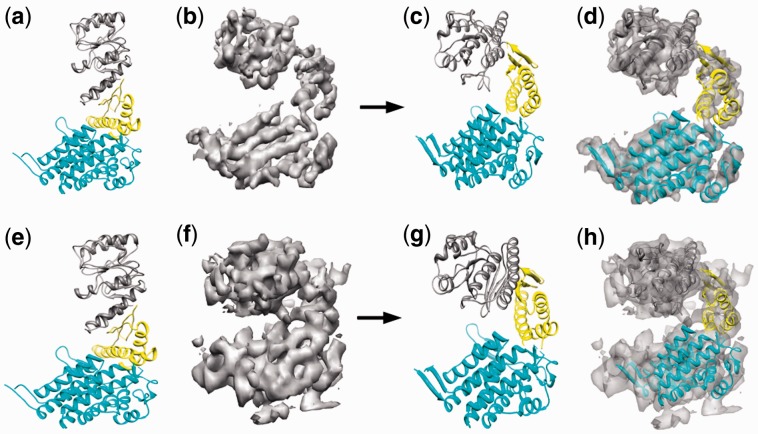
As a test case, three domains of GroEL, were arbitrarily rearranged to create three different GroEL conformations that consist of two, three and four domains, respectively (left images in Fig. 7a–c). We then calculated cryo-EM maps in the range of 5–20 Å from the radiographic structure of GroEL, which assumes a conformation that is different than any of generated conformers. FOLD-EM was then used to carry out flexible fitting of each GroEL confomer into the simulated maps (Supplementary Table S3a–c, Fig. 7a–f), resulting in good overall fits. The low RMSD errors listed in Supplementary Table S3a–c show that FOLD-EM is capable of unbiased fully automated flexible fitting. To confirm that the flexible fitting routine works with real data, we used FOLD-EM to fit the high resolution structure of one conformation of GroEL into 4 Å and 6 Å cryo-EM maps of GroEL in a different conformation (Fig. 8a–h).
Fig. 7.
(a–c, left) We created three fictitious atomic-resolution structures based on GroEL, one with two domains (a, left), one with three domains (b, left) and one with four domains (c, left). Next, we attempted to fit each synthetic structure into a low-resolution density map of the structure in a different conformation. For example, the three-domain structure (b, left) is docked into a map (simulated from the three-domain GroEL structure PDB ID: 1OEL) in a different conformation shown in (b, right). Embedded ribbon structures shown in the figures are the ones used to simulate the respective maps. (d–f) Fitting of conformation #2 [d or (b, left)] using FOLD-EM results in reorganization of the domains into a new structure (e) that fits the simulated GroEL 10 Å cryo-EM map well
Fig. 8.
(a–d) Fitting of an atomic-resolution GroEL conformation (a, PDB ID: 1AON), using FOLD-EM, into a lower resolution (4 Å) GroEL map (b, Ludtke et al., 2008) in a different conformation. This needed spatial reorganization of the domains in the atomic structure, resulting in a new structure (c) which fits the target map well, as seen in (d). (e–h) The same application and outcome as (a–d), except that here the target map is the (6 Å) GroEL map from Ludtke et al. (2004)
Supplementary Table S5 gives the RMSD errors associated with the fits described above.
To further demonstrate the effectiveness of FOLD-EM to carry out flexible fitting, we performed additional testing using simulated and experimentally determined cryo-EM maps, the successful outcomes of which are reported in Supplementary Table S3d. The experimental maps used are of GroEL, Rice Dwarf Virus and 20S Proteasome. The synthetic map was generated from four atomic resolution domains, as seen in Supplementary Figure S6. This figure (first column) also shows the initial starting conformations that were flexed by FOLD-EM to fit into the corresponding maps. The FOLD-EM fits can be seen in the third column. The final fitting errors of the individual domains are reasonably low as seen in Supplementary Table S3d, further attesting to the effectiveness of FOLD-EM in doing rigid body flexible fitting.
It is possible to obtain similar results using existing flexible fitting software such as, NORMA (Suhre et al. 2006), DIREX (Schroder et al. 2007), MDFF (Trabuco et al. 2008), FLEX-EM (Topf et al. 2008) and the one published in Gorba et al. (2008). However, these other programs are all based on local search approaches, and hence, by design, the final flexed conformation can only be locally best (with respect to the initial starting conformation), and thus may not represent the best global fit. It is well known that local search approaches are dependent on starting positions, and a different starting conformation may yield a different final flexed conformation. This is the classical ‘local minima’ issue. On the other hand, FOLD-EM is based on a global search and hence the final flexed conformation will be independent of initial starting conformations. Hence, FOLD-EM is free of ‘local minima’ issues by design. However, in practice, we believe FOLD-EM and local search-based methods should be used together in a complementary fashion. For example, FOLD-EM could be first used to produce starting flexed conformations, and then a local search-based method can be used to generate pathways connecting initial and final conformations.
3.4 Fully automated fold detection and large-scale structural comparisons using FOLD-EM
The fold-recognition/fitting scenarios described above assume the users know the fold they are searching for in an electron density map. The users choose either the identical molecule or a suitable homolog as a search model for fold recognition/fitting. Although homologous search models can often be identified via sequence comparisons, it is not always possible to identify a suitable homolog based on sequence homology. However, lack of sequence homology does not preclude structural homology, as it is well known that structural similarities often persist over large evolutionary distances where sequence vanishes. Hence, it would be useful to have a tool that systematically compares structural features of an electron density map with a large structural database and returns the best fitting homolog/s. Rather than fitting entire structures, the goal here is simply to fit individual domains. More complex structures can then be inferred from the relative arrangement of individual domains. There are several advantages to this approach. First, domain databases are designed to include only representative folds, thus avoiding the redundancy present in the PDB. Second, the combinations and relative arrangements of individual domains can vary greatly in multi-domain proteins; by fitting domains separately, the search is not necessarily confined to the different domain arrangements present in known structures. Hence, our modular approach to locating independent structural units is more akin to the modular design of proteins in nature, and is thus capable of a comprehensive search in spite of including only a limited number of structural units.
In this application, approximately 4000 representative protein domains from the SCOP database have been chosen as a structural database of search models. The first member of a domain family is picked as the representative structure, and additional structures from the same domain family are included if they structurally differ by >5 Å RMSD from each other. These structures represent all superfamilies of the five SCOP-domain classes: all-alpha, all-beta, alpha+beta, alpha and beta, and small proteins. Next, each domain is scored against the input electron density map using a modified scoring version of the module from FOLD-EM that has been optimized for speed, as described in Section 2. The domains with the best score are then returned as potential fits for the input electron density map. Below, we describe the use of FOLD-EM to search the SCOP database and return a Cα backbone model in a fully automated fashion, thus removing subjectivity from map analysis and relieving the user of the burden of identifying appropriate homologs as inputs.
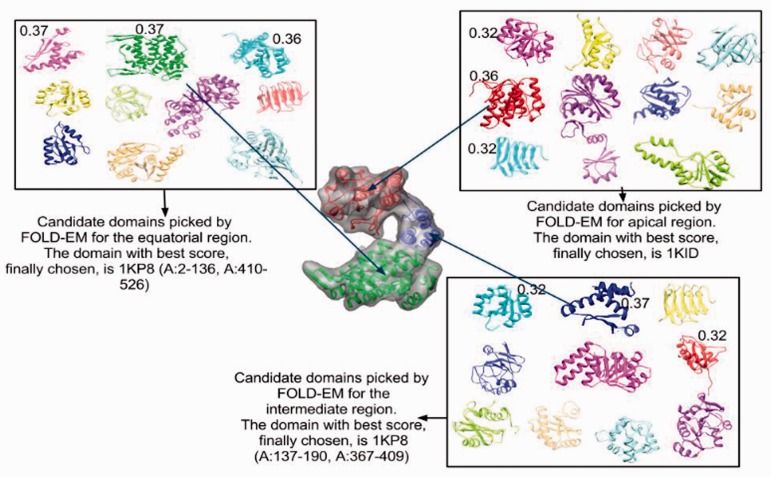
As before, we have used the well-known structure of GroEL as a test case. Synthetic cryo-EM maps were calculated in the resolution range of 5–20 Å. FOLD-EM was then used to systematically search the SCOP database, identify the constituent domains in each map and return the fitted structures as Cα backbone models for each of the simulated maps (Fig. 9). Supplementary Table S4a lists candidate domains selected by FOLD-EM along with their associated scores for the simulated 10 Å GroEL map. The first row of the table reports that the chosen 90 residue intermediate domain was docked into its corresponding region in the map with an RMSD error of 0.49 Å (with respect to the domain used to simulate that map region; Supplementary Table S4b). Similar results were obtained for simulated maps calculated at 5, 15 and 20 Å resolutions (fitted structures not shown); all reported error values are low (Supplementary Table S4b), demonstrating the ability of FOLD-EM to correctly identify and fit the constituent domains in noise-free simulated electron density maps of GroEL.
Fig. 9.
The construction of a Cα backbone model for a simulated GroEL map from the best-scored candidate domains (first row in Supplementary Table S4a)
To verify that FOLD-EM is capable of correctly identifying independent structural domains present in actual cryo-EM data with representative noise levels, we selected as test cases several moderate-resolution cryo-EM maps where the domain structures of their constituent macromolecules is known. These structures include: (i) a 6 Å map of GroEL (Ludtke et al., 2004); (ii) a 7.9 Å map of the bacteriophage ф29 capsid protein (Morais et al., 2005); (iii) a 6.8 Å map of the Rice Dwarf Virus capsid protein (Zhou et al., 2001); (iv) the 6.8 Å map of the 20S proteasome (Rabl et al., 2008); and (v) a 12.5 Å map of the 70S ribosomal subunit (Valle et al., 2003; Supplementary Text S3). Table 1 and Supplementary Table S4c–e list candidate domains for different regions of each protein along with associated scores that were automatically determined by FOLD-EM. The domains with the highest scores were selected as constituent domains of the output Cα models (Fig. 10a–e). Supplementary Table S5 evaluates the fitting of the selected domains. In every case except for one, the highest-scoring domains corresponded to the known domain structures for each input map. The one instance where FOLD-EM reported a better score for a SCOP domain different than previously reported was for the bacterial immunoglobulin domain of the capsid protein of bacteriophage ф29, where the correct fold had the fourth highest score.
Table 1.
List of candidate domains along their associated scores (SAV: Chimera score, SFE: FOLD-EM score; see Section 2 and Supplementary Text S1 for score definitions), for domains that were automatically picked by FOLD-EM for building the Cα backbone of the GroEL map
| Top candidates for domain #1 | Score (SAV, SFE) | Top candidates for domain #2 | Score (SAV, SFE) | Top candidates for domain #3 | Score (SAV, SFE) |
|---|---|---|---|---|---|
| 1KP8 (A:2–136,A:410–526) | 0.57, 100 | 1KID (A) | 0.45, 52 | 1KP8 (A:137–190, A:367–409) | 0.45, 36 |
| 1KID (A) | 0.45, 55 | 1LS1 (A:1–88) | 0.44, 55 | 2B5E (A:142–239) | 0.40, 45 |
| 1LS1 (A:1–88) | 0.44, 54 | 2GOY (A:7–138) | 0.34, 59 | 1ABV (A) | 0.40, 42 |
| 2GOY (A:7–138) | 0.34, 59 | 1H5P (A) | 0.33, 56 | 1YSJ (A:178–292) | 0.40, 52 |
| 1H5P (A) | 0.33, 56 | 1M9L (A) | 0.30, 59 | 2RLT (A:1–99) | 0.40, 38 |
Three domains were picked: the equatorial domain (columns 1 and 2; column 2 lists the associated scores), the apical (columns 3 and 4) and the intermediate domain (columns 5 and 6). The first row lists the three domains with the best scores and which are ultimately chosen by FOLD-EM to build the Cα model of the map.
Fig. 10.
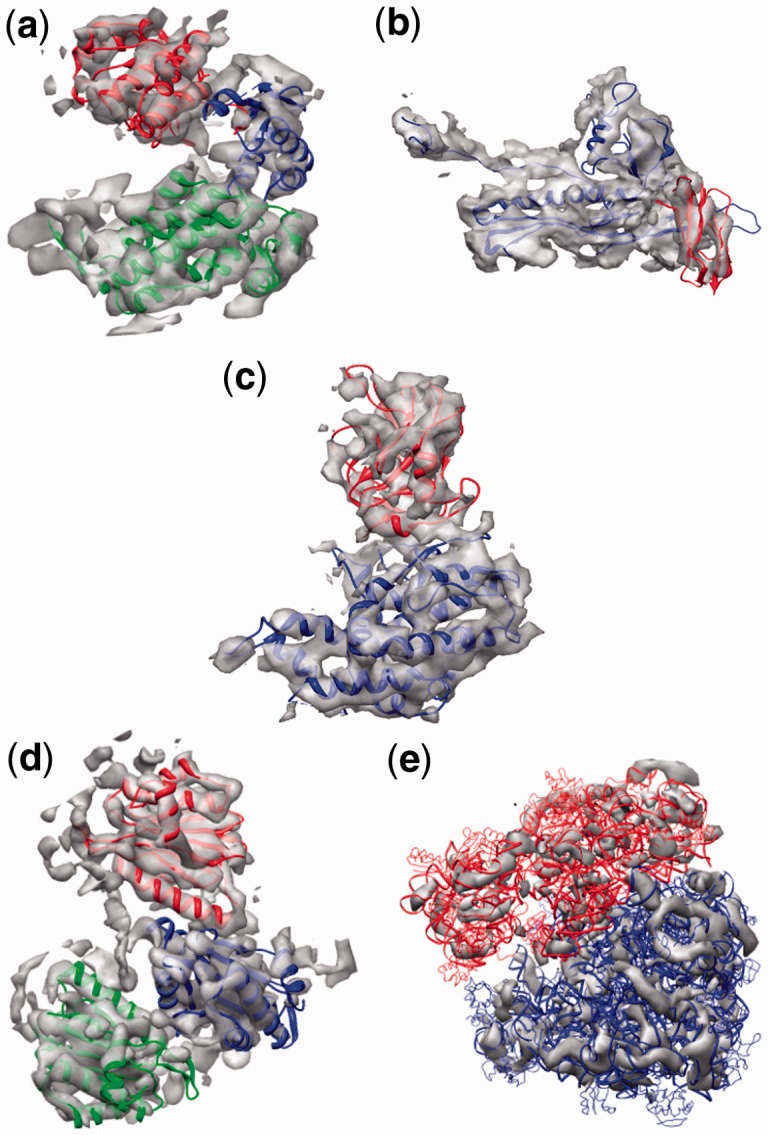
(a) The fit of GroEL domains as determined by FOLD-EM is consistent with Ludtke et al. (2004); Supplementary Table S5 gives the RMSD errors associated with fitting the three chosen domains into the 6 Å cryo-EM map of GroEL. (b) The fit of HK97 and BIG2 domains as determined by FOLD-EM is consistent with Morais et al. (2005); Supplementary Table S5 gives the RMSD errors associated with fitting the two chosen domains into the 7.9 Å cryo-EM map of ф29 (Morais et al., 2005). (c) The fit of independent domains of the Rice Dwarf Virus capisd protein as determined by FOLD-EM is consistent with Zhou et al. (2001), and Nakagawa et al. (2003); Supplementary Table S5 gives RMSD errors associated with fitting each of the two chosen domains into the 6.8 Å cryo-EM map of Rice Dwarf Virus (Zhou et al., 2001). (d) The fit of three domains from the 20S proteasome as determined by FOLD-EM is consistent with Rabl et al. (2008); Supplementary Table S5 gives the RMSD errors associated with fitting the chosen trimer domain into the 6.8 Å cryo-EM map of 20 S proteasome (Rabl et al., 2008). (e) The fit of 30S and 50S domains from the 70S ribosome into the 12.5 Å cryo-EM map of the 70S ribosome (Valle et al., 2003); Supplementary Table S5 gives the errors associated with fitting the chosen domains into the 12.5 Å map of the 70S ribosome
Supplementary Table S4f–i report additional tests on simulated cryo-EM maps. The simulated maps, in the range 5–15 Å, were generated from aribitratry spatial arrangement of four atomic resolution domains as seen in Supplementary Figure S7. Here also, for a given map, the corresponding Table lists the domains with best scores, which are finally chosen by FOLD-EM to build the Cα model of the map. For a given domain, top five choices with associated scores are listed. Finally, Supplementary Table S4i reports the respective fitting RMSD scores of the chosen domains, which are reasonably low, affirming the correctness of the chosen domains, in turn re-affirming the ability of FOLD-EM to do effective Cα model building.
Existing programs capable of carrying out automated fold recognition include EMATCH (Lasker et al., 2005; Lasker et al., 2007), SPI-EM (Valazquez-Muriel et al., 2005), and FREDS (Khayat et al., 2010). EMATCH is not independent software in that it requires an input map is first converted into a collection of helices that have been identified in the input map, a process that typically requires manual specification of appropriate density thresholds for helix identification (Jiang et al., 2003)); non-helical information is not used. Hence this approach is not suitable for those input cryo-EM maps that are predominantly defined by non-helical structural elements or hardly detectable helices (e.g. maps with short helices, maps coarser than 10 Å resolution). FOLD-EM, on the other hand, is fully automated and does not require any reduction of input maps. Furthermore, FOLD-EM is not limited to analyzing maps of structures that are predominantly helical. SPI-EM assigns an input map to a specific CATH superfamily, whereas FOLD-EM, E-MATCH and FREDS focus on identifying specific domain folds within a map. Unlike FOLD-EM, both SPI-EM and FREDS are dependent on the results obtained using third-party fitting software—SITUS and MOLREP, respectively. Here, we have shown how some existing popular fitting software, including SITUS and MOLREP, failed in certain test cases (e.g. fitting of the GroEL intermediate and the BIG2 domains into the maps of GroEL and ф29, respectively) where FOLD-EM succeeded. Hence, the choice of a robust fitting module is critical and is an important feature that sets FOLD-EM apart from FREDS and SPI-EM. Furthermore, we note that in the FREDS publication (Khayat et al., 2010), potentially subjective manual segmentation of individual domains in the input GroEL map were required for successful implementation of the program. The results presented above (Section 3.1) suggest that manual segmentation is necessary because MOLREP, the fitter used by FREDS, fails to fit the small intermediate domain in the unsegmented GroEL monomer (Fig. 2c). FOLD-EM does not require any manual processing of input maps, and hence achieves higher level of automation and a lower degree of subjectivity in building Cα backbone models. Finally EMATCH, FREDS and SPI-EM can be used only as long as the third-party methods (helix detectors or domain fitters), which they depend on, remain available to the users. FOLD-EM does not have such dependency issue, as its basic modules (fitters, etc.) are all inbuilt.
3.5 Summary of Comparisons
Finally, in Table 2, we summarize the properties that distinguish FOLD-EM methods from existing competing methods.
Table 2.
Properties that distinguish FOLD-EM methods from existing competing methods
| Method in the FOLD-EM package | Property | FOLD-EM method | Existing competing methods |
|---|---|---|---|
| Rigid body docker/fitter (Section 3.1) | Partial matching (Fig. 4) | Yes | SITUS, FOLDHUNTER, Chimera, MODELLER, MOLREP, COAN, etc.: No |
| Flexible fitter (Section 3.3) | Level of automation | Independent of starting conformation, as it is based on global search. (details: Section 3.3, last paragraph) | NORMA, DIREX, MDFF, FLEX-EM, etc.: Require users to provide appropriate starting conformations, as they are based on local search. |
| Backbone modeller (Section 3.4) | Level of automation | FOLD-EM is fully automated. | EMATCH, FREDS: Not fully automated. For instance, FREDS required approximate domain region segmentation. (details: Section 3.4, last paragraph) |
| Backbone modeller (Section 3.4) | Dependency | None | EMATCH, FREDS: Depend on availability of third-party modules, such as helix detectors, fitters, etc. (details: Section 3.4, last paragraph) |
A given row (#X) refers to a method in FOLD-EM. (Row #X, Column #1) lists the name of the method, (Row #X, Column #2) lists one of it's critical distinguishing property, (Row #X, Column #3) elaborates that property for that FOLD-EM method, and (Row #X, Column 4) elaborates that property for existing competing methods. For instance, Row #2 refers to the method ‘Rigid Body Docker’ (Row #2, Column #1) in FOLD-EM. (Row #2, Column #2) lists the particular property (partial matching of Fig. 4) in question. (Row #2, Column #3) states the existence of that property in the FOLD-EM docker. (Row #2, Column #3) states the non-existence of that property in any other existing docker that we are aware of.
4 CONCLUSION
Inspired by SIFT’s broad applicability and driven by the current need in structural biology to effectively and efficiently interpret structures from electron microscopy, we have developed a new software tool, FOLD-EM, to automatically and systematically identify protein folds and fit atomic resolution macromolecular structures into cryo-EM electron density maps without any prior knowledge. FOLD-EM is based on MOTIF-EM—our previous adaptation of the SIFT algorithm for interpretation of cryo-EM maps. We have adapted and extended the MOTIF-EM algorithm to automatically identify folds and characterize conformational changes in cryo-electron density maps of large macromolecular assemblies. The underlying algorithm in MOTIF-EM and FOLD-EM works by constructing rotationally invariant low-dimensional representations of local regions in the input atomic resolution structures and cryo-EM maps. Correspondences are established between the reduced representations by comparing them using a simple metric. These correspondences are then clustered using hash tables and graph theory to identify structurally equivalent domains or motifs. The motivation to develop FOLD-EM from MOTIF-EM came from the recognition that the SIFT-based comparison module builds correspondences by matching smaller structural units, and hence the algorithm should work even if only portions of the structures being compared are homologous. Thus, the method is well suited for building backbone models of large complex macromolecular assemblies by systematically fitting smaller independent domain structures into a cryo-EM map of the larger assembly. FOLD-EM accomplishes this task by recursively fitting representative domain structures from the SCOP structural database into the input cryo-EM map and returning the best-fitting non-overlapping structures. FOLD-EM succeeds at least partially because it is inherently capable of carrying out partial matching; unlike other fitting software, the FOLD-EM fitting module is not affected by extraneous structure in either the target map or the search structure. Similarly, FOLD-EM will also automatically determine if different transformations are necessary for fitting different regions of the input search model; as a result, FOLD-EM is inherently able to characterize conformational differences (due to inter-domain motions, partial resemblances) between the structures being compared. Using FOLD-EM, we have demonstrated its effectiveness in (i) partial matching, i.e. successful docking/fitting in the presence of extraneous protein residues; (ii) fitting multi-domain structures into cryo-EM maps in a single step while taking into account flexibility due to inter-domain motions; and (iii) performing fully automated large-scale fold recognition and fitting using a protein domain database. The ability to automatically and objectively carry out these challenging tasks allows non-specialists to perform sophisticated structural analysis and sets FOLD-EM apart from other existing docking packages.
Supplementary Material
ACKNOWLEDGEMENTS
This work has benefited from discussions with Werner Braun, Wah Chiu, Michael Levitt, Steve Ludtke, Matthew Baker and Yao Cong. We thank Dr Faisal Abu-Khzam for providing us with his clique finding software.
Funding: NIH award 1R01GM095516-01A1 to M.C.M. (in part) and the Methodist Hospital Research Institute supported by the Grant DOD/TATRC Alliance for NanoHealth W81XWH-10-2-0125 from the US Department of the Army, to M.C.M.
Conflict of Interest: none declared.
REFERENCES
- Gorba C., et al. Normal-mode flexible fitting of high-resolution structure of biological molecules toward one-dimensional low-resolution data. Biophys. J. 2008;94:1589–1599. doi: 10.1529/biophysj.107.122218. [DOI] [PMC free article] [PubMed] [Google Scholar]
- Jiang W., et al. Bridging the information gap: computational tools for intermediate resolution structure interpretation. J. Mol. Biol. 2001;208:1033–1044. doi: 10.1006/jmbi.2001.4633. [DOI] [PubMed] [Google Scholar]
- Jiang W., et al. Coat protein fold and maturation transition of bacteriophage P22 seen at subnanometer resolutions. Nat. Struct. Biol. 2003;10:131–135. doi: 10.1038/nsb891. [DOI] [PubMed] [Google Scholar]
- Khayat R., et al. An automated procedure for detecting protein folds from sub-nanometer resolution electron density. J. Struct. Biol. 2010;170:513–521. doi: 10.1016/j.jsb.2009.12.014. [DOI] [PMC free article] [PubMed] [Google Scholar]
- Lasker K., et al. Discovery of protein substructures in EM maps. Algorithms in Bioinformatics. 2005;3692:423–434. [Google Scholar]
- Lasker K., et al. EMatch: discovery of high resolution structural homologues of protein domains in intermediate resolution cryo-EM maps. IEEE Trans. Comp. Biol. Bioinform. 2007;4:28–39. doi: 10.1109/TCBB.2007.1003. [DOI] [PubMed] [Google Scholar]
- Lowe D.G. Distinctive image features from scale-invariant keypoints. Int. J. Comput. Vis. 2004;60:91–110. [Google Scholar]
- Ludtke S.J., et al. EMAN: semi-automated software for high-resolution single-particle reconstructions. J. Struct. Biol. 1999;128:82–97. doi: 10.1006/jsbi.1999.4174. [DOI] [PubMed] [Google Scholar]
- Ludtke S., et al. Seeing GroEL at 6 Å resolution by single particle electron cryomicroscopy. Structure. 2004;12:1129–1136. doi: 10.1016/j.str.2004.05.006. [DOI] [PubMed] [Google Scholar]
- Ludtke S.J., et al. De novo backbone trace of GroEL from single particle electron cryomicroscopy. Structure. 2008;16:441–448. doi: 10.1016/j.str.2008.02.007. [DOI] [PubMed] [Google Scholar]
- Morais M.C., et al. Conservation of the capsid structure in tailed dsDNA bacteriophages: the psuedoatomic structure of ф29. Mol. Cell. 2005;18:149–159. doi: 10.1016/j.molcel.2005.03.013. [DOI] [PubMed] [Google Scholar]
- Nakagawa A., et al. The atomic structure of RDV reveals the self-assembly mechanism of component proteins. Structure. 2003;11:1227–1238. doi: 10.1016/j.str.2003.08.012. [DOI] [PubMed] [Google Scholar]
- Pell L.G., et al. The solution structure of the C-terminal Ig-like domain of the bacteriophage λ tail tube protein. J. Mol. Biol. 2010;403:468–479. doi: 10.1016/j.jmb.2010.08.044. [DOI] [PubMed] [Google Scholar]
- Pettersen E.F., et al. UCSF chimera—a visualization system for exploratory research and analysis. J. Comp. Chem. 2004;25:1605–1612. doi: 10.1002/jcc.20084. [DOI] [PubMed] [Google Scholar]
- Rabl J., et al. Mechanism of gate opening in the 20S proteasome by the proteasomal ATPases. Mol. Cell. 2008;30:360–368. doi: 10.1016/j.molcel.2008.03.004. [DOI] [PMC free article] [PubMed] [Google Scholar]
- Rohl C.A., et al. Protein structure prediction using Rosetta. Enzymology. 2004;383:66–93. doi: 10.1016/S0076-6879(04)83004-0. [DOI] [PubMed] [Google Scholar]
- Saha M., et al. MOTIF-EM: an automated computational tool for identifying conserved regions in cryoEM structures. Bioinformatics. 2010;26:301–309. doi: 10.1093/bioinformatics/btq195. [DOI] [PMC free article] [PubMed] [Google Scholar]
- Schröder G.F., et al. Combining efficient conformational sampling with a deformable elastic network model facilitates structure refinement at low resolution. Structure. 2007;15:1630–1641. doi: 10.1016/j.str.2007.09.021. [DOI] [PMC free article] [PubMed] [Google Scholar]
- Suhre K., et al. NORMA: a tool for flexible fitting of high-resolution protein structures into low-resolution electron-microscopy-derived density maps. Acta Crystallogr. D Biol. Crystallogr. 2006;62:1098–1100. doi: 10.1107/S090744490602244X. [DOI] [PubMed] [Google Scholar]
- Topf M., et al. Structural characterization of components of protein assemblies by comparative modeling and electron cryo-microscopy. J. Struct. Biol. 2005;149:191–203. doi: 10.1016/j.jsb.2004.11.004. [DOI] [PubMed] [Google Scholar]
- Topf M., et al. Protein structure fitting and refinement guided by cryo-EM density. Structure. 2008;16:295–307. doi: 10.1016/j.str.2007.11.016. [DOI] [PMC free article] [PubMed] [Google Scholar]
- Trabuco L.G., et al. Flexible fitting of atomic structures into electron microscopy maps using molecular dynamics. Structure. 2008;16:673–683. doi: 10.1016/j.str.2008.03.005. [DOI] [PMC free article] [PubMed] [Google Scholar]
- Vagin A., Teplyakov A. MOLREP: an automated program for molecular replacement. J. Appl. Cryst. 1997;30:1022–1025. [Google Scholar]
- Valle M., et al. Locking and unlocking of ribosomal motions. Cell. 2003;114:123–134. doi: 10.1016/s0092-8674(03)00476-8. [DOI] [PubMed] [Google Scholar]
- Velázquez-Muriel J.A., et al. SPI-EM: towards a tool for predicting CATH superfamilies in 3D-EM maps. J. Mol. Biol. 2005;345:759–771. doi: 10.1016/j.jmb.2004.11.005. [DOI] [PubMed] [Google Scholar]
- Volkmann N., Hanein D. Docking of atomic models into reconstructions from electron microscopy. Methods Enzymol. 2003;374:204–225. doi: 10.1016/S0076-6879(03)74010-5. [DOI] [PubMed] [Google Scholar]
- Wriggers W., Birmanns S. Using situs for flexible and rigid-body fitting of multiresolution single-molecule data. J. Struct. Biol. 2001;133:193–202. doi: 10.1006/jsbi.2000.4350. [DOI] [PubMed] [Google Scholar]
- Zhou Z.H., et al. Electron cryomicroscopy and bioinformatics suggest protein fold models for rice dwarf virus. Nat. Struct. Biol. 2001;8:868–873. doi: 10.1038/nsb1001-868. [DOI] [PubMed] [Google Scholar]
Associated Data
This section collects any data citations, data availability statements, or supplementary materials included in this article.


