Abstract
An ultrafast frequency domain optical coherence tomography system was developed at A-scan rates between 2.5 and 10 MHz, a B-scan rate of 4 or 8 kHz, and volume-rates between 12 and 41 volumes/second. In the case of the worst duty ratio of 10%, the averaged A-scan rate was 1 MHz. Two optical demultiplexers at a center wavelength of 1310 nm were used for linear-k spectral dispersion and simultaneous differential signal detection at 320 wavelengths. The depth-range, sensitivity, sensitivity roll-off by 6 dB, and axial resolution were 4 mm, 97 dB, 6 mm, and 23 μm, respectively. Using FPGAs for FFT and a GPU for volume rendering, a real-time 4D display was demonstrated at a rate up to 41 volumes/second for an image size of 256 (axial) × 128 × 128 (lateral) voxels.
OCIS codes: (100.6890) Three-dimensional image processing, (110.4500) Optical coherence tomography, (170.4500) Optical coherence tomography
1. Introduction
Optical coherence tomography (OCT) is a prominent biomedical cross-sectional tissue imaging technique that enables noninvasive, micrometer-resolution measurements [1]. High speed is required for many OCT applications, such as the scanning of larger tissue surfaces, e.g., the esophagus [2], colon [3], or coronary vessel [4], within a limited inspection time. If one can observe the real-time 3D display as a video of OCT images (i.e. video-rate real-time 4D OCT) at the same time with conventional endoscopic imaging in some of these applications, real-time biopsy with accurate locational registration may become possible. Another application, where real-time 4D OCT is required, is observing the time-variation of a 3D tissue structure, such as studying the developing embryonic hearts of small animals [5–8]. For applications, such as image-guided biopsy [9], surgery [10,11], or localization of a probe in tissue [12], it is essential to obtain feedback in real time with high-speed 4D OCT imaging, preferably at a video rate. These examples show that video-rate real-time 4D OCT is required in many currently developing applications. It may also be applied to other new OCT applications, such as high-speed industrial inspection, once it becomes available.
For real-time video-rate 4D OCT to display 3D volumetric images faster than 24 frames/second (fps), and each image to be rendered from a 3D volume composed of preferably more than 100 × 100 lateral A-scans, an OCT system faster than about a 240 kHz A-scan rate and 2.4 kHz B-scan frame rate is required. OCT systems with such high speeds have already been developed. With the ultrafast swept source (SS) OCT method, Huber et al. developed a buffered Fourier domain mode locking (FDML) swept source at a 370 kHz A-scan rate [13]. Oh et al. developed a swept laser using a high-finesse polygon-based wavelength-scanning filter and a short-length unidirectional ring resonator. They demonstrated a >400 kHz A-scan rate [14]. Postsaid et al. demonstrated imaging at 100–400 kHz A-san rates by buffering a commercially available swept laser operated at a 100 kHz scan rate [15]. Wieser et al. demonstrated a 5.2 MHz A-scan rate FDML-type swept sources [16]. Klein et al. demonstrated an FDML-type swept laser at a 1.37 MHz A-scan rate [17]. Bonin et al. used a swept laser as the source of a full-field OCT system using an area CMOS camera for frame detection. 3D volume data of 512(axial) × 640 × 24(lateral) voxels were acquired at a rate of 100 volumes/second, corresponding to an effective A-scan rate of 1.5 MHz [18].
Ultrafast spectral domain OCT (SD-OCT) systems have also been developed. Potsaid et al. developed an SD-OCT at an A-scan rate of 313 kHz using an ultrahigh speed CMOS line camera [19]. An et al. used two high speed line scan CMOS cameras, each running at 250 kHz, and demonstrated a 500 kHz A-line rate in their SD-OCT system [20]. Wang et al. developed a megahertz streak-mode Fourier domain OCT (FD-OCT) system. They imaged the whole spectrum on an area-scan CMOS camera as a line, which corresponded to an A-scan, and scanned the linear A-scan image with a 1 kHz resonant scanner synchronously to the probe beam scanner, which conducted B-scan [21]. As a result, an effective 1 MHz A-scan rate was demonstrated. Choi et al. developed an SD-OCT system at a 60 MHz A-scan rate using optical demultiplexers for spectral dispersion for simultaneous parallel detection of an A-scan spectrum [22].
The above-mentioned OCT systems are fast enough to achieve video-rate real-time 4D OCT. However, no installation of a real-time 4D OCT display was reported in these ultrafast OCT systems. Additional ultrafast data processing is required to meet such an ultrafast A-scan rate. There have been efforts to increase the processing speed of FD-OCT by installing additional processors to the conventional configuration based only on a personal computer (PC), such as a multi-core PC, a digital signal processor (DSP), field programmable gate array (FPGA), and/or graphics processing unit (GPU).
The A-scan processing rate was accelerated with a multi-core PC, DSP, and FPGA. Liu et al. analyzed the real-time processing power with a quad-core PC and showed that it could provide real-time OCT data processing ability at an A-scan rate of more than 80 kHz. The actual SS-limited A-scan rate was 20 kHz [23]. Su et al. used a pair of digitizers and a DSP. Estimated performance supported an A-scan rate of 90 kHz, although the SS-limited A-scan rate was 20 kHz [24]. By using an FPGA, Ustun et al. achieved a real-time B-scan frame rate of 27 fps, which was CCD-camera-limited [25]. Their real-time process included background subtraction (BGS), spectrum interpolation for re-scaling in k-space (RSK), high pass filtering, dispersion compensation (DSC), and fast Fourier transform (FFT). Desjardins et al. used two FPGAs at an A-scan rate of 54 kHz and achieved a real-time B-scan frame rate of 5 fps [26]. Processing included BGS, demodulation with low–pass filtering, DSC with a spline algorithm, and FFT.
2D B-scan frame rate at a video rate was demonstrated using a GPU. Watanabe and Itagaki installed a GPU with a linear-k spectrometer, which eliminated RSK processing. They demonstrated a camera-limited B-scan frame rate of 27.9 fps [27]. The GPU processed numeric data type conversion (a 16-bit integer to a 32-bit float) and logarithmic scaling (LOG), as well as BGS and FFT. Later, Watanabe et al. extended the depth range by introducing a complex conjugate removal process and achieved a real-time B-scan frame rate of 27.23 fps [28]. Jeught et al. used a GPU and achieved a real-time B-scan frame rate of 25 fps, which was limited by a camera rate of 25.6 kHz [29]. Their calculation included processing of BGS, RSK, and FFT. The frame rate was achieved with all four different RSK methods; nearest neighbor, linear, linear spline, and cubic spline interpolations. Zhang and Kang implemented fast Gaussian gridding-based non-uniform fast Fourier transform (NUFFT) on the GPU architecture and demonstrated a real-time B-scan frame rate of 29.8 fps [30]. They showed that NUFFT improves sensitivity roll-off, higher local signal-to-noise ratio, and immunity to side-lobe artifacts caused by RSK. Li et al. compared fractional processing times of BGS, RSK, DSC, FFT, LOG, and the memory (data) transfer (host (PC)-to-device (GPU) and device-to-host) to find that the memory transfer required approximately 60% of their processing time [31]. DSC and FFT required 24 and 8%, respectively. Their system’s effective A-scan rate was ~110 kHz.
Nearly real-time visualization of 3D volume at a rate of 7.2 rendered volumes/second (512(axial) × 80 × 380(lateral) voxels) was demonstrated by Probst et al. with a linear-k spectrometer coupled to a surgical microscope [32]. In their system, a PC performed processing (BGS, apodization (APD), FFT, etc.) to generate the OCT data, which were then transferred from host to device within 11 ms. The 3D rendering calculation by GPU took only 5 ms. Sylwestrzak et al. conducted both data processing (BGS, RSK, DSC, APD, FFT, and LOG) and 3D rendering by using a GPU [33]. They displayed 3D volume images (1024(axial) × 100 × 100(lateral) voxels) at a rate of 9 volumes/second in real time. Zhang and Kang attained a real-time 3D display at a volume rate of 10 volumes/second (1024(axial) × 125 × 100(lateral) voxels) in their GPU-based system, which eliminated DSC processing [34]. Later, they extended their work to a dual GPU architecture [35]. One GPU was dedicated to data processing while the second one was used for volume rendering and display. They displayed 5 volumes/second real-time full-range 3D OCT images (1024(axial) × 256 × 100(lateral) voxels) and micro-manipulation of a phantom model.
These accumulated studies with both SS-OCT and SD-OCT systems suggest the capability of a real-time video-rate 4D OCT imaging by installing GPU-processing in an ultrafast FD-OCT system.
For this research, we developed an ultrafast SD-OCT system at multi-MHz A-scan rates and installed an ultrafast data processing system using FPGAs and a GPU to demonstrate a video-rate real-time 4D-OCT system. Arrayed-waveguide grating (AWG)-type optical demultiplexers (ODs) for linear-k spectral dispersion in the 1310 nm wavelength region enabled simultaneous detection of all interference signals at 320 wavelengths with a 14-bit resolution multi-channel data acquisition (DAQ) system at a speed of 50 MHz, which determined the fastest possible A-scan rate. However, the real-time processing is not possible at this sampling rate due to the limitation of the processing system. At least five 50 MHz A-scans were added to match the actual maximum A-scan rate to the 10 MHz response time of photoreceivers. The specifications of AWGs are described in detail in section 2.2 in this paper. The system configuration of the ultrafast data processing system, which is comprised of a multi-channel DAQ system with multi-FPGAs and a PC with a GPU board, is explained in detail in section 2.3. To attain ultrafast processing, FPGAs performed preprocessing (BGS, APD, and FFT) to generate volumetric OCT data and the GPU performed 3D rendering. The software design for real-time image manipulations, such as zooming, rotating, and cutting at a surface, is explained in section 2.3. Results of real-time 4D display performance are discussed as well as the capability of 4D-video recording for a long duration in section 2.4. To overcome the weak reference signal at individual photoreceivers and intensity loss by AWGs, a semiconductor optical amplifier (SOA) was introduced to enhance effective sensitivity. The performance evaluation of our SD-OCT system by the point spread function (PSF) to determine image dynamic range, sensitivity, and sensitivity roll-off is discussed in section 3.2 and 3.3. A few examples of both real-time and recorded 4D images are given in section 3.4.
2. Experimental setup
2.1. System configuration
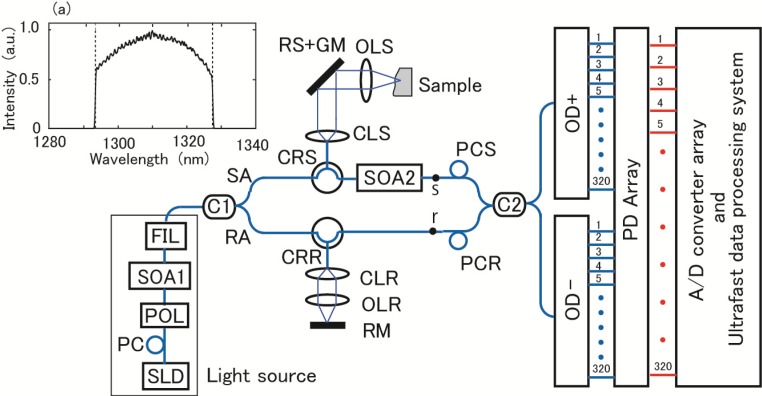
The experimental configuration of our system is shown in Fig. 1 . We designed our SD-OCT system to be capable of an ultrafast A-scan rate up to 10 MHz and display real-time 4D OCT video at a video rate. We also intended to record 4D OCT images for a long duration at a volume rate even faster than the standard video rate. The strategy to achieve ultrahigh speed was to acquire an A-scan signal at all the k-values simultaneously with parallel photoreceivers and an analog-to-digital (A/D) converter array. Then, the A-scan rate is fundamentally determined by the speed of the A/D converter array. The use of two ODs (OD+ and OD−) enables such a parallel detection. The concept of an ultrafast SD-OCT configuration was already reported in our previous work in the wavelength region of 1550 nm [22]. In this work, we designed a system in the 1300 nm wavelength region, which is more suitable for most biological tissue imaging, and added the capability of real-time 4D display. We designed our ultrafast data processing system using FPGAs and a GPU board to attain real-time 4D display and long-time 4D image recording.
Fig. 1.
Experimental configuration of our system. In inset (a), spectral shape of light at output of FIL is shown.
The light source of the system is a combination of a superluminescent diode (SLD) (Covega, Jessup, USA), a semiconductor optical amplifier (SOA1) (Thorlabs Quantum Electronics, Jessup, USA), and an optical filter (FIL) (a custom product of Alnair Labs, Tokyo, Japan), as shown in Fig. 1. A polarization controller PC (Thorlabs Japan, Tokyo, Japan) and a polarizer (POL) (Optoquest, Ageo, Japan) were used to adjust the wavelength of the maximum output power to be near the center wavelength of the ODs. The purpose of the FIL was to eliminate light with wavelengths outside the principal free spectrum range (FSR) of the ODs, as explained below. The output spectral shape from the source assembly, measured at the output of the FIL, is shown in inset (a) in Fig. 1. The total output power was 27.5 mW. The vertical broken lines indicate the boundary of the principal FSR of the ODs. A few channels near both sides of the FSR were affected by the roll-off characteristic of the FIL.
The OCT interferometer has a Mach-Zehnder configuration. The light out of the FIL was divided using a coupler (C1) (Opneti Communications, Shenzhen, China) into a sample arm (SA) and reference arm (RA). The splitting ratio of C1 was chosen between 50:50 and 90:10 depending on the experiment. The light in the SA was directed to either one of two sample probes, which differed in the B-scan rate, using a circulator (CRS) (Opneti Communications, Shenzhen, China). One probe was for a 4 kHz B-scan rate and comprised of a collimator (CLS) (FH10-IR-APC, Newport Corporation, Irvine, USA), a 4 kHz resonant scanner (RS) (General Scanning, Billerica, USA), a Galvano mirror (GM) (6220H, Cambridge Technology, Lexington, USA), and an achromatic-doublet objective lens (OLS) with a focal length of 70 mm. The other probe was for an 8 kHz B-scan rate and comprised of a CLS (F280APC-C, Thorlabs), an 8 kHz RS (General Scanning), GM (6215H, Cambridge Technology), and an OLS with a focal length of 30 mm. For the 4 kHz probe, the beam diameter at the output of the CLS was about 8 mm, the transverse resolution at the focal point was 15 μm, the confocal parameter was 260 μm, and the beam diameter at the position apart from the focal point by 2 mm, (half the depth range), was 230 μm. For the 8 kHz probe, the respective values were 3.3 mm, 15 μm, 270 μm, and 220 μm.
The back-scattered or back-reflected light from the sample was collected by the illuminating optics and directed from the CRS to an SOA (SOA2) (Thorlabs Quantum Electronics, Jessup, USA). SOA2 had a center wavelength of an amplified spontaneous emission (ASE) at 1305.8 nm, optical 3 dB bandwidth of 86 nm, small signal gain of 34.6 dB, and saturation output power of 17.8 dBm. Usually, strong ASE light is emitted out of an SOA. In fact the SOA2 emitted an intensity of 70 mW out of the input port. However, the CRS effectively works as an isolator and it was attenuated to 820 nW and 6.6 nW at the output/input port and input port of the CRS, respectively. They made negligible effect to system performance. The output of SOA2 was directed to a coupler (C2) (Opneti Communications, Shenzhen, China) of a 50:50 splitting ratio. We did not use an additional optical filter to eliminate ASE light outside the principal FSR of ODs. The noise due to ASE light made negligible contribution compared with the beat noise which determined the noise floor of the present experiment as explained in section 3.2. A polarization controller (PCS) (Thorlabs Japan, Tokyo, Japan) was used to adjust the signal polarization. In the RA, a circulator (CRR) (Opneti Communications, Shenzhen, China), collimator (CLR) (FH10-IR-APC, Newport Corporation, Irvine, USA), achromatic-doublet objective lens (OLR) and a reference mirror (RM) were used to balance the optical path length difference between the SA and RA. The output of the CRR was directed to C2. An adjustable aperture was placed between the CLR and OLR to regulate the power directed to C2. A polarization controller (PCR) (Thorlabs Japan, Tokyo, Japan) was used to adjust the polarization of the reference light.
The two outputs of C2 were directed to OD+ and OD−, respectively. Detailed specifications of the ODs are explained below. They output data at 320 channels of different optical frequencies with an equal adjacent interval. An array of 320 balanced photoreceivers (PDs) (2117, New Focus, San Jose, USA) detected the outputs from the ODs. Optical signals output from the same channel number of ODs were differentially detected by each photoreceiver. The PD array output 320 electric signals, which were detected and processed using our ultrafast data processing system, the function of which is explained below.
2.2. Optical demultiplexer
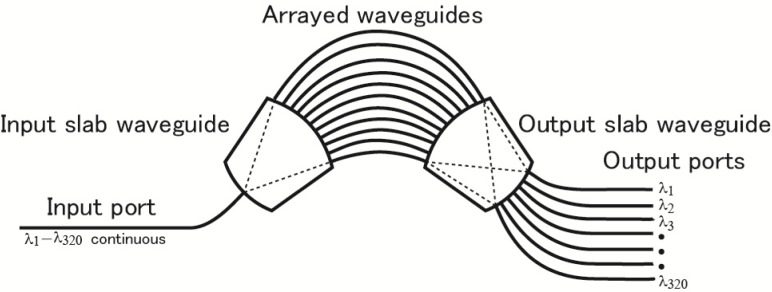
Three main advantages of using ODs in an SD-OCT system are an ultrafast A-scan rate, reduced sensitivity roll-off, and linear-k spectral detection. The disadvantages are a limited spectral coverage, high-cost, and stronger attenuation of light compared with a diffraction grating. Because usage of ODs in SD-OCT is not yet common, we describe the characteristics of our ODs a little more in detail. AWGs were used for this experiment as ODs. A schematic of an AWG is given in Fig. 2 . Each output from C2 in Fig. 1 is directed to the input port of an AWG. The input slab guide directs input light to a set of arrayed waveguides. The arrayed waveguides consist of optical paths that mutually differ in path length. In the output slab, light output from the set of the arrayed waveguides is collected. Due to interference of light passing through optical paths of different lengths, light is dispersed into different wavelengths at the output surface of the output slab. A wavelength range of light is directed to an optical fiber. By suitably designing the wave guides, frequency (wave number) intervals between adjacent fiber outputs can be made equal, i.e., a linear-k interferometer is fabricated. The multi-output by optical fibers enables simultaneous detection of the set of outputs leading to an ultrafast A-scan rate. The spectral width of a nearly Gaussian band-pass characteristic at each output is narrower than the frequency interval between the adjacent channels and allows an effectively long coherence length of the SD-OCT system. We can find explanation of the fundamental technology of AWG in the book by Okamoto [36].
Fig. 2.
Schematic of arrayed waveguide grating (AWG)-type optical demultiplexer.
In our former work, we used AWGs in the 1560 nm wavelength region [22], which is a standard in telecommunication technology. In OCT, the 1300 nm region is more suitable for most of tissues. We asked NTT Electronics (NEL, Yokohama, Japan) to design and manufacture custom planar lightwave circuit (PLC)-type AWGs to operate at this wavelength region and to achieve a depth range of 4 mm in OCT application. NEL gave us results of test measurements, some of which are shown below. Application of an AWG for OCT in the 1300 nm wavelength region was reported by Nguyen et al., where they imaged the output at the surface of the output slab of an AWG onto a line-scan camera using a lens [37]. In their setup, the A-scan rate was limited by the 46 kHz speed of the line-scan camera, and a 6 dB roll-off of the point spread function was observed at about 0.7 mm, while the depth range was only 1 mm. Although they used the advantage of linear-k detection in their system, ultrafast detection and reduced roll-off capability were not attained. Recently, Akca et al. improved the depth-range to 4.6 mm and 6 dB roll-off to about 3.2 mm using a polarization-independent AWG in their reflectometry [38].
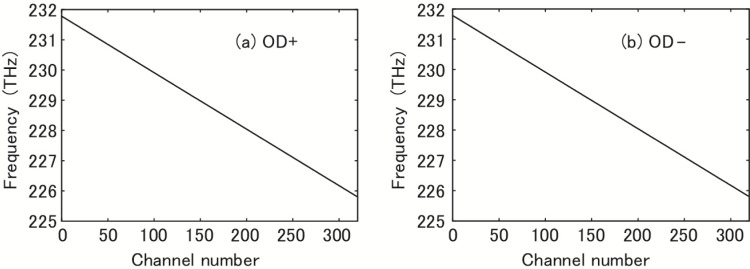
An AWG has an FSR, and the best performance is expected in the principal FSR. The principal FSR of our AWG was from 1293.42 nm (231.782 THz) to 1327.58 nm (225.818 THz) and was divided into 320 channels. The spectral coverage of 34 nm (6.0 THz) determined the axial resolution limit of 22 μm for a rectangular apodization [39]. Dependencies of the optical frequency on the channel number i, provided by NEL, are shown in Fig. 3 . We used two AWGs. The outputs of these OD+ and OD− were respectively connected to + and − inputs of the photoreceivers, as shown in Fig. 1. The agreement in the characteristics of the two ODs affects the quality of the SD-OCT system. Linear least squares fit gave νi = 231.8005 – 0.01869i (THz) with a coefficient of determination of R2 = 0.99999998 for both OD+ and OD−. Therefore, the two AWGs are practically identical in the frequency characteristic, and the frequency (and therefore the wave number k) depends linearly on the channel number, which eliminated RSK in our data processing. NEL’s AWGs are thermally tunable. To tune to a practically identical characteristic, the temperatures of OD+ and OD− must be controlled to 27.9°C and 44.4°C, respectively. The average frequency interval of 18.7 GHz between the adjacent channels determined the depth range of 4.0 mm.
Fig. 3.
Dependence of optical frequency on channel number. (a) Optical demultiplexer (AWG) OD+, (b) Optical demultiplexer (AWG) OD−.
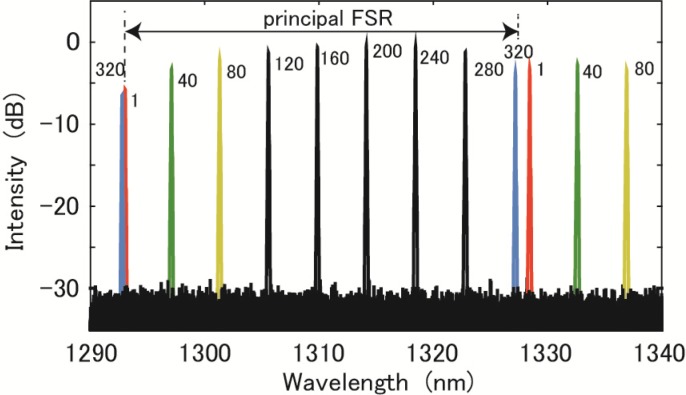
We now explain the role of the FIL in Fig. 1. We observed the spectra of selected output channels from OD+ using an optical spectrum analyzer (AQ6370, Yokogawa, Yokosuka, Japan). Without using the FIL, we attenuated the output light from SOA1 with a coupler of a 90:10 splitting ratio and directed it to the optical spectrum analyzer. Superposed spectra at 9 channels (1, 40, 80, 120, 160, 200, 240, 280, and 320) are depicted in Fig. 4 . The principal FSR region is indicated in the figure with an arrow. In the longer wavelength region, signals out of channels 1, 40, and 80 were observed. In the shorter wavelength region, the spectrum out of channel 320 was observed close to the spectral peak observed at channel 1. Without the FIL in the experimental configuration of our system shown in Fig. 1, these signals with different wavelengths outside the principal FSR were detected at each channel simultaneously. As seen in the difference in separation of the peaks in channels 1 and 320 at both sides of the principal FSR, the periodic structure of the spectrum shifted in wavelength outside the principal FSR from that inside the principal FSR. Therefore, without the FIL in Fig. 1, we observed unwanted side lobes in the PSF signals.
Fig. 4.
Superposed spectra observed at selected channels (1, 40, 80, 120, 160, 200, 240, 280, 320) of optical demultiplexer (AWG) OD+.
To measure the agreement in wavelength at corresponding channels of the two ODs, spectra at channel 160 were measured for both ODs. The FIL was used in the light source. The results are shown in Fig. 5(a) ; the red and blue lines denote OD+ and OD−, respectively. The peak was observed at practically the same position for both ODs. Similar agreement was observed for all the selected channels shown in Fig. 4. To estimate the spectral width, the OD+ signal is plotted with a linear vertical scale (solid line in Fig. 5(b)). The observed spectrum is a convolution of the real spectrum with the resolution function of the optical spectrum analyzer. We observed a spectrum at four different resolutions of the analyzer and obtained the value of ~0.05 nm for the spectral width from extrapolation to zero resolution. The spectral shape shown with as the broken line in Fig. 5(b) is a rough approximation of the real spectrum, obtained by shrinking the observed spectral shape in the horizontal direction to ~0.05 nm width. The spectral shapes shown as the thin black lines in Fig. 5(a) are drawn similarly. In the logarithmic vertical scale, it is almost overlapped with other curves. The narrow width compared with the wavelength interval between the adjacent channels effectively makes our system a frequency comb detection system. We demonstrated improvement in sensitivity roll-off [22]. Bajzraszewski et al. also demonstrated a noticeable improvement in sensitivity roll-off in their SD-OCT system using an optical frequency comb source [40].
Fig. 5.
(a) Spectra observed at 160-channel of two optical demultiplexers; OD+ : red, OD−: blue. (b) Plot of spectrum observed at channel 160 of optical demultiplexer OD+ with linear vertical scale.
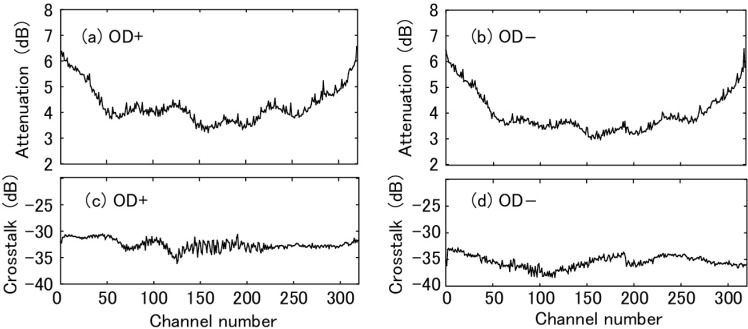
The attenuation of light by the AWGs was also provided by NEL for all the channels. Dependencies on the channel number are shown in Fig. 6 . Figures 6(a) and 6(b) show OD+ and OD−, respectively. A light source of narrow spectral width (81600B Tunable Laser Source, Agilent, USA) was used for the measurements. The minimum values were 3.21 and 2.98 dB for OD+ and OD−, respectively. The maximum values were 6.56 and 6.50 dB for OD+ and OD−, respectively. The attenuation increased as the channel approached both sides of the principal FSR. The variation is not monotonous and modulates the amplitude of the interference fringe of OCT. The modulation must be corrected in data processing. Strong attenuation by an AWG compared with that of a diffraction grating is a disadvantage in using an AWG for OCT. For example, attenuation by using a grating from Wasatch Photonics (Logan, USA) can be less than 0.5 dB. Attenuation by using an AWG also occurs due to the pass-band characteristic shown in Fig. 5(b) for a continuous light source. The portion of light indicated by the pink area in Fig. 5(b) is lost. This leads to about 3 dB attenuation at all the channels.
Fig. 6.
Dependence of attenuation on channel number are shown for (a) optical demultiplexer OD+ and (b) optical demultiplexer OD−. Dependence of non-adjacent background crosstalk on channel number are shown for (c) optical demultiplexer (AWG) OD+ and (d) optical demultiplexer (AWG) OD−.
The non-adjacent background crosstalk provided by NEL is shown in Fig. 6. Figures 6(c) and 6(d) show OD+ and OD−, respectively. The average values are −32.51 and −34.99 dB for OD+ and OD−, respectively. The dependence on channel is weak. The crosstalk weakly contributes to the noise floor in an OCT image. Our measurement in Fig. 5(a) is consistent with NEL’s data. From the figure, the crosstalk between adjacent channels was estimated. The vertical dashed green lines labeled 159 and 161 indicate the center wavelength of the adjacent channels. From the cross points of the green lines and the spectra shown by the thin solid lines, the crosstalk between the adjacent channels was estimated to be less than about −25 dB. It deteriorates spectral purity at a channel by a small amount.
2.3. Data processing
In the experimental configuration shown in Fig. 1, an A-scan interference fringe signal was acquired simultaneously with different 320-channel photoreceivers and DAQs. To perform FFT in real time for real-time display, the A-scan data distributed over 320-channel DAQs must be gathered as a set of signals immediately after data acquisition. At the time we planned this experiment four years ago, National Instruments (NI, Austin, USA) was to start selling DAQ-connected FPGA boards, which are inserted in a chassis with a PXI Express ×4 bus (NI calls a PCI Express equivalent bus PXI Express). We estimated the capability of a system comprised of NI’s off-the-shelf boards and chasses to gather data, as mentioned above, and to conduct real-time FFT processing. We found such feasibility and ordered a custom made ultrafast data processing system with the 320-channel A/D converter array shown in the right-hand side of Fig. 1.
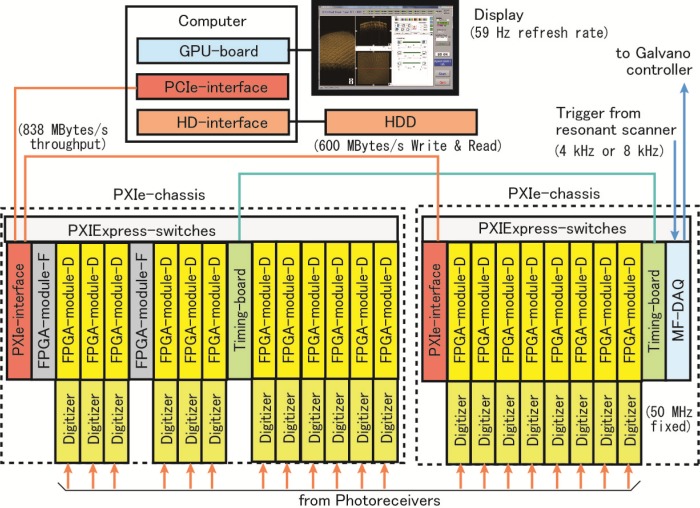
The block diagram of the A/D converter array and ultrafast data processing system is shown in Fig. 7 . Outputs from photoreceivers were connected to digitizers (5751, NI). A digitizer is a 16-channel, 50 MHz, 14-bit adapter module for FPGA-module-D (PXIe-7962R, NI). With FPGA-module-Ds, we conducted BGS and APD processing. The number of digitizers and FPGA-module-D pairs was twenty. The data processed using FPGA-module-D were transferred to two FPGA-module-Fs (PXIe-7965R, NI) via PXI Express switches. First in, first-out (FIFO) buffers were built into the FPGA boards to buffer and transfer data between boards without loss. An A-scan data of 320 channels was zero padded to 512 data points for FFT processing. Four FFT units were built into each of the two FPGA-module-Fs, and the eight units performed FFT successively. The processing speed of a FFT unit was 146,000 A-scans/second and the total processing speed with the eight FFT units was 1.17 × 10⁶ A-scans/second. NI’s PXIe-boards were inserted into two chasses (PXIe-1075, NI). Precise synchronization of clocks of the two chasses was done with two timing boards (PXIe-6674, NI). Fast data transfer between chasses and the PC was done with two PXIe-interface boards (PXIe-8375, NI) and a PCIe-interface board in the PC (PCIe-8371, NI). The sustainable throughput of the interface was 838 MBytes/s. The multifunction DAQ, (MF-DAQ) (PXIe-6363, NI), was used to receive sampling trigger signals from the resonant scanner at a rate of 4 or 8 kHz and also to output control signals for the Galvano scanner.
Fig. 7.
Block diagram of A/D converter array and ultrafast data processing system.
The PC (T7500, DELL, Austin, USA) included a GPU-board (Tesla C2050, Nvidia, Santa Clara, USA), PCIe-interface board, and HD-interface board (8262 × 4, NI). We used RAID 0-type HDD memory (HDD-8264, NI) of 3 TBytes for long recording. The sustainable writing and reading speed of the HDD was 600 MBytes/s. The image was displayed on a display (U2410, DELL). The refresh rate of the display was 59 Hz.
The firmware of the FIFO buffers and FFT units written in the FPGA boards were prepared by NI. The software to run in the PC was developed under Microsoft Windows 7 Professional operating system. The system control software and the graphical user interface were created in NI’s Labview 2009, which was operated in ×32 mode because the compiler of the FPGA boards was not supported in ×64 mode. After transferring volume data from the data processing system to the PC, we copied them into the GPU, the software of which was written using compute unified device architecture (CUDA) by NVIDIA, compiled using Microsoft Visual Studio 2008 and Intel C++ Compiler Professional Edition. The CUDA program performed volume rendering. We modified the sample program “volumeRender” in the file of “NVIDIA GPU Computing SDK” downloaded from NVIDIA’s web site [41]. The OpenGL 3.0 Library was used for visualization of the processed images. The CUDA- and OpenGL-based algorithms were implemented in Labview through dynamic link libraries (DLLs) so that rendered images could be displayed and manipulated in Labview’s screen display. Although we designed the average traffic rate of data to be lower than the limit of PCI (PXI) Express × 4, when we tried to transfer numerical 2-byte data (14-bit data acquired with DAQs and results of FFT processing) in a form of signed 16-bit integer (I16), partial loss of data occurred in the data transfer. We believed this was due to fluctuations in the data traffic rate and overflow occurring at some instance when the traffic rate exceeded the sustainable throughput of PCI (PXI) Express ×4. To reduce this fluctuation, we bunched four of the I16 data into unsigned 64-bit data (U64), and empirically found no loss of data. The FFT data were bunched using FPGAs and transferred to the PC, and un-bunching from U64 to I16 was done using the GPU in the PC.
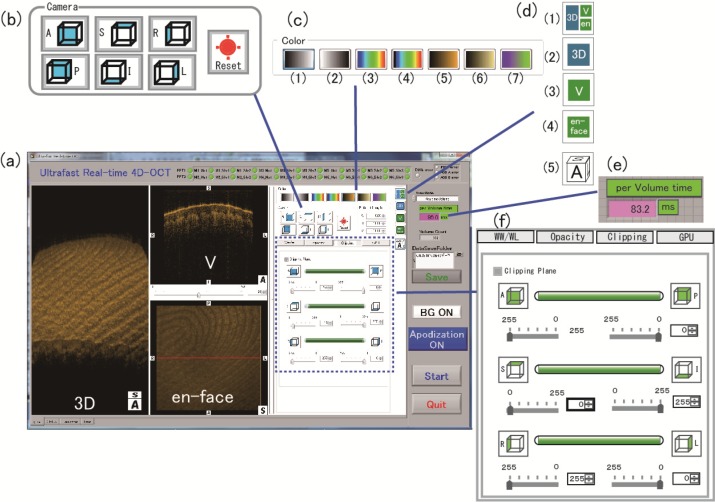
An example of the displayed screen images and functions of the software are shown in Fig. 8 . Figure 8(a) shows an example of the screen displays. To show details clearly, partial images are enlarged and illustrated as Figs. 8(b)–8(f). The 3D-rendered image (3D), a B-scan image (V), and the surface image (en face) are displayed on the left-hand side. The display of images in this area can be selected with the buttons shown in Fig. 8(d). By clicking button (d)-(1), the display image shown in Fig. 8 is selected. By clicking (d)-(2), (d)-(3), or (d)-(4), only the rendered 3D, B-scan, or en face image is displayed in the display space, respectively. Button (d)-(5) is the on-off of the directional dice display at the lower-right corner of the 3D image. The en face image is calculated by integrating the power spectrum in the axial direction for each A-scan. The direction of the view of the rendered volume is selected with the buttons shown in Fig. 8(b). The reset button orients the direction to the default. We prepared seven color codes, as shown in Fig. 8(c). Of the seven, the black-and-white (c)-(1) or tissue-like color gradation (c)-(5) was used for most tissue imaging. The rainbow color codes were sometimes useful for local enhancement in an image. Rotation, zooming, or translation can be done in real time with the mouse.
Fig. 8.
Example of screen image of ultrafast real-time 4D OCT system.
We could also cut and reveal an arbitrary surface perpendicular to one of the three axes in real time by selecting the “Clipping” button in Fig. 8(f). This corresponds to a virtual surgery in real time. Such cutting was performed with the slides shown in Fig. 8(f). Because the cutting can be done simply by eliminating the portion of volume data cut, more complicated real-time virtual surgery is possible if we write a program for that purpose. By selecting the button “WW/WL” in Fig. 8(f), we can open slides to control the threshold and window of image intensity expressed in dB scale for both the 3D image and en face image. By selecting the “Opacity” button, we can modify the color code. The GPU status can be displayed by clicking the “GPU” button, which is only used for debugging purposes.
We installed long-time data-recording capability. For recording, we did not perform FFT. With the 3-TByte HDD, volume data could be recorded for about 100 minutes.
2.4. Imaging speed and real-time display
The B-scan rate was fixed either at 4 or 8 kHz by using the RS shown in Fig. 1. The number of A-scans within a B-scan was limited by the FFT speed of 1.17 × 10⁶ A-scans/second. We chose the number of A-scans per B-scan as 256 and 128 for 4 and 8 kHz B-scan, respectively. For both cases, the FFT processing rate was 1.02 × 10⁶ A-scans/second. The maximum A-scan rate could be the DAQ speed of 50 MHz. However, the real-time processing is not possible at this sampling rate due to the limitation of the processing system. Moreover, if an A-scan rate is too fast compared with the response time of the photoreceiver, inter-A-scan blurring occurs in our system configuration [22]. The response frequency of our photoreceiver was 12 MHz at the gain of 10, which we usually used. Therefore, we added five 50-MHz data samples and set the fastest A-scan rate to 10 MHz. It should be noticed that the summation of fringes may distort the original signal, if the phase of the OCT signal keeps changing during the five 50 MHz samplings. The A-scan rate decreased by including additional 50 MHz samplings per A-scan. The lower limit of the A-scan rate was set by the condition in which a set of A-scans per B-scan must be finished within half the period of the RS. As the A-scan rate increased, the duty ratio decreased. For the A-scan rates of 2.5, 5, and 10 MHz, duty ratios were 39.8, 20.5, and 10.2%, respectively. If we consider the duty ratio, the averaged A-scan rates are all 1 MHz. The off-duty time was required to complete a series of FFT processing within a single B-scan time. Therefore, a faster A-scan rate reduced the motion artifacts in a B-scan (in the direction of the fast axis), but it did not reduce the artifacts in the direction of the slow axis. We call the lateral scan along the slow axis “B-scans per volume” .
The number of B-scans per single-volume data determined the volume rate. After a forward full swing of the GM, fly-back time and re-start processing time were required for a single volume scan. We measured the actual volume rate of real-time processing by using the indicator shown in Fig. 8(e). It indicated the time duration between successive volume scans, which fluctuated. For example, motion of the mouse or touch of the keyboard apparently reduced the volume rate. It also depended on the display format. The measured actual volume processing rates, averaged over 300 volumes, are listed in Table 1 for various choices of B-scan number per volume, B-scan rate, and display format. An example of a 3D-only display image and a 3-image display are shown in section 3.4.
Table 1. Volume rates (volumes/second) and voxel rates (MVoxels/second) of real-time processing. Voxel rates are in parentheses.
| B-scans per volume | 8 kHz B-scan rate |
4 kHz B-scan rate |
|||
|---|---|---|---|---|---|
| 3D only | 3 images | 3D only | 3 images | ||
| 32 | 93.5 (98) | 82.7 (87) | 65.8 (138) | 58.9 (124) | |
| 64 | 64.9 (136) | 58.3 (122) | 41.7 (175) | 40.2 (169) | |
| 128 | 40.7 (171) | 38.5 (161) | 22.4 (188) | 20.8 (174) | |
| 256 | 21.8 (182) | 20.8 (174) | 11.6 (195) | 11.6 (195) | |
The refresh rate of the LCD display shown in Fig. 7 was 59 Hz. In videos of volume rates faster than this rate, partial frames were lost at the display. For a volume image, more than 100 lateral scans are preferred for both axes. Therefore, we claim about 41 volumes/second as the practical fastest real-time 4D display rate with 8-kHz RS, 3D only display, and 128 B-scans per volume.
Continuous recording of volumetric 3D data is also useful. By rendering after recording, we can manipulate each 3D image to reveal an interesting aspect. The image changes faster than the display speed can be investigated from frame to frame. In recording, 320 data samples of 2 bytes per channel were collected as a set of A-scans. They were transferred to the PC without performing FFT. The recording speed was limited by the rate of 600 Mbytes/second sustained by the HDD shown in Fig. 7. Data traffic rates, under all the conditions listed in Table 1, were slower than the limit. Actual recording volume rates were measured and averaged over 300 volumes, as listed in Table 2 . In two cases, 32 and 64 B-scans per volume at an 8-kHz B-scan rate, the recording rate was faster than the corresponding 3D-only display rates listed in Table 1. In other cases, the recording rate was practically the same with the 3D-only real-time display.
Table 2. Volume rates (volumes/second) and the voxel rates (MVoxels/second) of recording. Voxel rates are in parentheses.
| B-scans per volume | 8-kHz B-scan rate | 4-kHz B-scan rate |
|---|---|---|
| 32 | 100.0 (105) | 67.0 (141) |
| 64 | 70.9 (149) | 39.1 (164) |
| 128 | 40.7 (171) | 21.9 (184) |
| 256 | 21.1 (177) | 11.4 (191) |
The voxel rate listed in Tables 1 and 2 are significantly lower than the fastest voxel rate of 4.5 GVoxels /second demonstrated by Wieser et al. [16] with their ultra-fast SS-OCT system.
3. Experimental results and discussion
3.1. Signal normalization
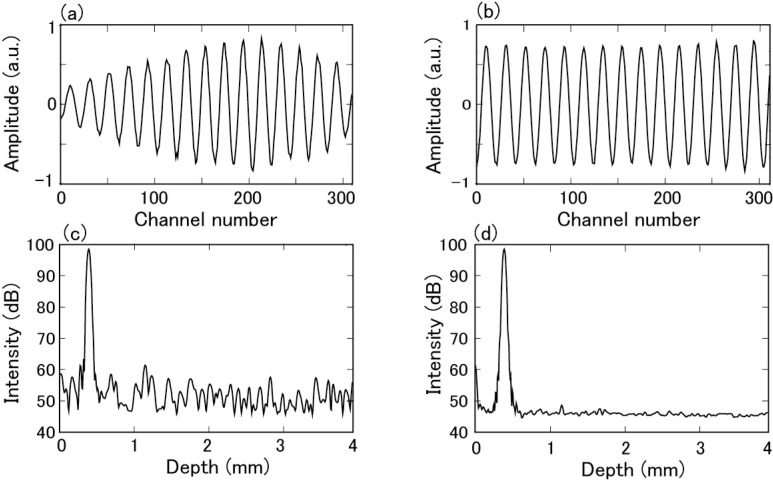
An example of the interference fringe signal of a reflector placed at a depth of 377 μm obtained after BGS processing is shown in Fig. 9(a) . The signal was modified and exhibited unwanted variations due to the channel-dependence of the intensity of the light source (Fig. 1 (a)), attenuation using AWGs (Figs. 6(a) and 6(b)), and sensitivity of photoreceivers. The variations raised the noise floor of OCT images. Measurement of the signal was repeated, the power spectrum was calculated from each signal with Hanning window, and an average of 256 spectra was obtained. The result is shown in Fig. 9(c). In spite of the averaging, the noise floor exhibited a fixed pattern composed of multiple small noise peaks, which originated from the above-mentioned variations. The dynamic range of this PSF was about 40 dB.
Fig. 9.
Effect of normalization of interference signal. (a) Interference signal before normalization. (b) Interference signal after normalization. (c) Power spectrum before normalization. (d) Power spectrum after normalization.
The noise should be reduced by correcting the above-mentioned channel-dependent variations in detection efficiency. For the correction in the differential detection shown in Fig. 1, detection efficiencies of both the + and − sides must be determined separately. Therefore, we obtained four intensities for each channel: IS+,i, IS-,i, IR+,i, and IR-,i, where i is the channel number. Here, IS+,i, IS-,i, IR+,i, and IR-,i are the response of the SA detected through OD+, response of the SA detected through OD−, response of the RA detected through OD+, and response of the RA detected through OD−, respectively. Signal normalization was performed by dividing the interference fringe signal at the ith channel by the square root of the factor (IS+,i− IS-,i)(IR+,i− IR-,i).
The procedure for determining IS+,i was as follows. A reflector was placed on the sample position. The reflected intensity was adjusted by a small tilt of the reflector so that the signal did not exceed the maximum range. The RA and OD− were disconnected by disconnecting the optical connector at r and the input to OD−, respectively. We first measured the background at all the channels by blocking the reflector. This background was mainly due to the ASE of SOA2. Then, without blocking the reflector, reflected light was measured at all channels. Subtracting the background at each channel, IS+,i was obtained at all channels. To obtain IS–,i, the input of OD– was connected and the input of OD+ was disconnected. Measurement similar to that of IS+,i was also done. To obtain IR+,i, the SA was disconnected at the connector s and the input to OD− was disconnected. The background was obtained by blocking the reflection of the RM. The intensity was measured without blocking the reflection. By subtracting the background, IR+,i was obtained, and IR-,i was obtained following a similar procedure by connecting OD− and disconnecting OD+.
By performing normalization to the signal, the interference signal shown in Fig. 9(b) was obtained. When a signal was normalized in this procedure, rectangular apodization was effectively made for the signal. Other types of apodizations could be made by simply multiplying the appropriate coefficient to data at each channel. In practice, the normalization and apodization was done simultaneously. The average power spectrum obtained by Hanning apodization is shown in Fig. 9(d). The noise floor was significantly improved compared with that shown in Fig. 9(c) without normalization. With normalization, the dynamic range of the power spectrum (PSF) was a little larger than 50 dB and improved by about 10 dB compared to that without normalization.
3.2. Optical amplification and sensitivity
In our system, SOA2 was used to enhance the signal. It is a well-known fact that, in coherent heterodyne detection as in this case, the theoretical limit of sensitivity is reduced at least by 3 dB by using optical amplification compared to that of the shot-noise-limited sensitivity without optical amplification (see for example [42], ). Although the signal is amplified by an optical amplifier, the beat noise between the reference light and ASE of the optical amplifier increases, which determines the noise floor of the OCT signals. For an SOA, the beat noise is proportional to 2Nsp, where Nsp is the spontaneous emission factor. For an ideal optical amplifier, Nsp = 1 and the reduction in the limiting sensitivity is 3 dB. In practice, however, Nsp ranges from 1.4 to more than 4 for an SOA [42]. Then the reduction in the practical limiting sensitivity from the shot-noise-limited value will range from 4.4 to more than 9.0 dB. We could not obtain information on Nsp for our particular SOA2 from the manufacturer. If reduction in the sensitivity of an OCT system is less than 9 dB from the shot-noise limit, little advantage of using an SOA is expected.
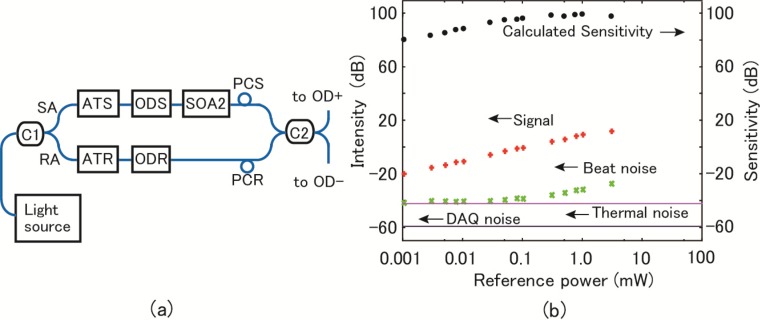
In our case, without SOA2, the measured sensitivity was 81 dB, which was smaller than the calculated shot-noise-limited sensitivity of 107 dB by 26 dB, for a 2.5-MHz A-scan rate and a sample illumination power of 20 mW. One reason for this large reduction is due to insufficient intensity of the reference power at the inputs of the photoreceivers. The particular photoreceiver used in this experiment requires input power of about 1 mW for the shot noise to sufficiently exceed the thermal noise, while the measured reference power at the inputs of the photoreceivers was less than 10 μW. Another reason is the strong attenuation of the signal by AWGs, as shown in Fig. 6. The situation is that practical sensitivity could be improved with an SOA. Even weak reference power is sufficient for the beat noise to exceed the thermal noise of the photoreceivers, and the floor of the signal-to-noise ratio is determined by the beat noise. The reduction in the signal due to AWGs shown in Fig. 6 does not deteriorate the signal-to-noise ratio because both the signal and the beat noise are attenuated by AWGs at an equal ratio.
To measure system sensitivity, we used the simplified experimental set up shown in Fig. 10 (a) . ATS and ATR are variable optical attenuators (DiCon Fiberoptics, Richmond, USA), and ODS and ODR are variable optical delays (General Photonics, Chino, USA). The optical delays were adjusted so that the optical path-length difference between the RA and SA was 0.5 mm. The power in the SA at the input of SOA2 was set to 54 nW with the ATS. The power in the RA varied with ATR. We ran the system at an A-scan rate of 2.5 MHz. The peak of the power spectrum of the signal is plotted in Fig. 10(b) as a function of the reference power, together with the noise floor levels by the DAQs and the thermal noise of the photoreceivers. Without a signal in the SA, the beat noise was measured as a function of the reference power measured at the input of C2. The beat noise exceeded the thermal noise for reference power values larger than about 0.1 mW. The sensitivity was calculated when the sample was illuminated with light of 20 mW in intensity. The results are plotted in Fig. 10(b). The maximum sensitivity was 97 dB. This value is smaller than the calculated shot-noise-limited sensitivity of 107 dB by 10 dB. However, it improved by about 16 dB compared to the experimental value of 81 dB without SOA. Within the 10-dB sensitivity reduction, the effect of the band-pass characteristic of the AWG shown in Fig. 5(b) is included. Figure 5(b) shows that about 3 dB of light intensity, shown in the pink area, was lost because the light source of the continuous spectrum was used. This also reduces the shot-noise-limited sensitivity of our system to 104 dB because about 3 dB of reduced illuminated power is used effectively. Taking into account this fact, the reduction in sensitivity was about 7 dB using SOA2 compared with the shot-noise limit, which is within the expected range mentioned above considering Nsp. The reduction in sensitivity by about 3 dB due to the band-pass characteristic of the AWG shown in Fig. 5(b) may improve by using an optical comb source, in which each intensity peak position and the frequency interval matches the AWGs, and the spectral width of each output is significantly less than the frequency interval. Then, light passes each channel at the maximum band-pass characteristic shown in Fig. 5(b).
Fig. 10.
(a) Experimental system for sensitivity measurement using semiconductor optical amplifier (SOA2). (b) Measurements of noise and signal (54 nW) as function of reference power to determine sensitivity.
Depending on the experimental condition, sensitivity varied. For the illumination power of 20 mW, sensitivities were 97 and 91 dB for the A-scan rates of 2.5 and 10 MHz, respectively. For the illumination power of 15 mW, the maximum permissible value to the eye by ANSI [43], sensitivities were 96 and 90 dB for the A-scan rates of 2.5 and 10 MHz, respectively.
The system shown in Fig. 10(a) is simplified compared with the actual system shown in Fig. 1. We made sensitivity measurement by placing a mirror at the sample position and neutral density filters between the mirror and objective OLS to make the input power to SOA2 to be 50 nW in the system shown in Fig. 1. By varying the reference power, another measurement similar to that shown in Fig. 10(b) was performed. Practically the same result of the sensitivity was obtained.
Most of SD-OCT systems adopt unbalanced detection configuration with a single camera. In our system, balanced detection configuration is adopted. We compared the sensitivity between the two detection configurations and confirmed 3 dB gain with balanced detection compared with unbalanced detection.
3.3. Point spread function and axial resolution
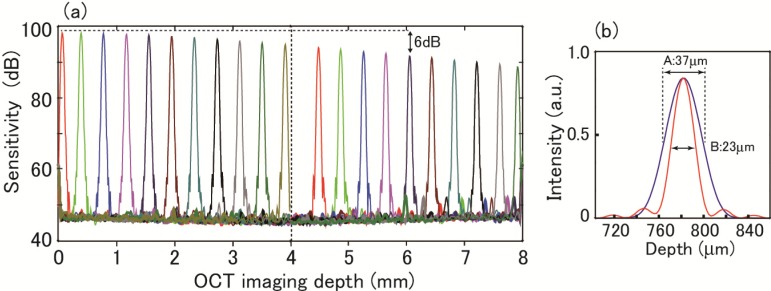
PSFs measured as a function of the axial depth (half the optical path-length difference between the RA and SA) are shown in Fig. 11(a) covering twice the principal depth range of 4 mm. In FFT, apodization with the Hanning window was conducted. The dynamic range was a little better than 50 dB at small depth ranges. The sensitivity roll-off by 6 dB was observed at a depth of about 6 mm. This sensitivity roll-off is considerably smaller than those observed for standard SD-OCT systems using an optical source of continuous spectrum and a diffraction grating for spectral dispersion. Similar small roll-off was demonstrated by Bajraszewski et al. using an optical comb source in their SD-OCT system [40]. In our system, the FWHM of the band-pass characteristic shown in Fig. 5(b) is about 0.05 nm. From this value, 6-dB roll-off is expected at about 7.5 mm. The observed 6 mm is close to this value.
Fig. 11.
(a) Point spread function as function of axial depth. (b) Axial resolution measurement; A (black): apodization with Hanning window, B (red): apodization with rectangular window.
From the linear plot of the peak observed at the depth of 780 μm shown in Fig. 11(b), the axial resolution was estimated to be 23 μm (B) and 37 μm (A) for apodization with the rectangular window and Hanning window, respectively. The rectangular apodization was obtained by the normalization of an A-scan signal following the procedure described in Section 3.1. The observed resolution for the rectangular window is about 1 μm worse compared with the theoretically expected value of 22 μm from the spectrum coverage of AWGs as mentioned above. One cause of this resolution degradation may be dispersion mismatch introduced by the SOA2. The Hanning, or other apodizations, was done to the normalized signal when required. The axial resolution of 23 −37 μm (in air) of this system is not good enough for high-resolution OCT imaging. This system is suitable for OCT imaging in which speed is critical but not axial resolution.
3.4. Tissue imaging
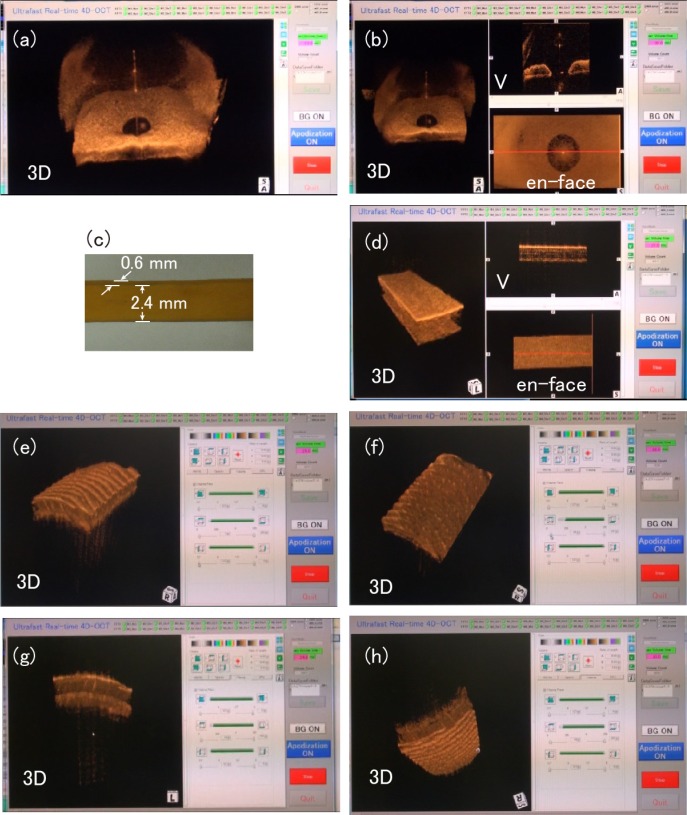
Representable frames of a few examples of real-time 4D OCT videos are shown in Fig. 12 . For all OCT imaging, the illuminated power to the sample was 12 mW, B-scan rate was 8 kHz, and the voxel size was 256 (axial) × 128 × 128 (lateral). All the attached videos were captured on a video recorder (Handycam type of SONY, Tokyo, Japan) and displayed on the PC at a frame rate of 30 frames/second. Therefore, the frame rate of videos was reduced from that of the real-time PC display shown in Table 1. Kitasato University Hospital’s Ethics Committee, in accordance with the tenets of the Declaration of Helsinki, approved the study of human imaging. Volunteers were educated on the purpose of the study and informed consent was obtained from each volunteer before beginning the study.
Fig. 12.
Representative frames of videos of 4D real-time OCT display. Videos of miosis of human eye responding to on-off of pen light: (a) only 3D-rendered image (Media 1 (2.8MB, AVI) ), (b) simultaneous display of three images (Media 2 (3.1MB, AVI) ). (d) Video of deformation of rubber band (photo (c)) following repeated change in stretching length (Media 3 (3.2MB, AVI) ). Videos of human thumb skin: (e) Virtual cutting at surface perpendicular to lateral axis (Media 4 (3.6MB, AVI) , perpendicular to fast axis; Media 5 (3.5MB, AVI) , perpendicular to slow axis), (f) virtual cutting at surface perpendicular to depth axis (Media 6 (3.8MB, AVI) ), (g) horizontal rotation (Media 7 (3.8MB, AVI) ), (h) vertical rotation (Media 8 (3.5MB, AVI) ).
Figure 12(a) is the representable frame of a video of dynamic miosis of a human eye in response to the on-off of a pen light, which illuminated the OCT probe in front of the volunteer’s view. We could observe continuous constriction and dilation of the pupil for an arbitrary time. The image size was 4 mm (depth) × 9.8 mm (lateral fast axis) × 6.6 mm (lateral slow axis). Figure 12(b) is the representable frame of simultaneous real-time three-image display of the same volunteer. The image labeled V is a B-scan along the horizontal red line shown in the en face display, the position of which could be moved in real time. We could observe the miosis dynamics with the three different displays; rendered 3D volume, B-scan cross section (image labeled as V), and en face image.
To illustrate an ultra-fast 4D OCT imaging of a material under three dimensional quick dynamical deformation, we imaged a rectangular cross section of a stretched rubber band; the dimensions at about the mean stretch length are shown in Fig. 12(c). The stretch length was repeatedly changed manually. The representable frame of real-time 4D OCT video is shown in Fig. 12(d). Three dimensional deform was clearly imaged. It is interesting to note that faint stripes appeared in the V image, probably due to increased birefringence when the band was stretched. The image dimensions were 4 mm (depth) × 7 mm (lateral fast axis) × 5 mm (lateral slow axis).
Real-time manipulations of the 3D-rendered image are illustrated for the imaging of human thumb skin. The image size was 4 mm (depth) × 5 mm (lateral fast axis) × 3.5 mm (lateral slow axis). Figure 12(e) is a representative frame of the video showing the virtual cutting of tissue at the surface perpendicular to the lateral fast or slow axis. Figure 12(f) is a representative frame of the video showing the virtual cutting at the surface perpendicular to the depth axis. The arrayed dots revealed in the epidermis are sweat glands. We could also rotate the image horizontally (Fig. 12(g)) and vertically (Fig. 12(h)) in real time to see the 3D image from an arbitrary desired angle.
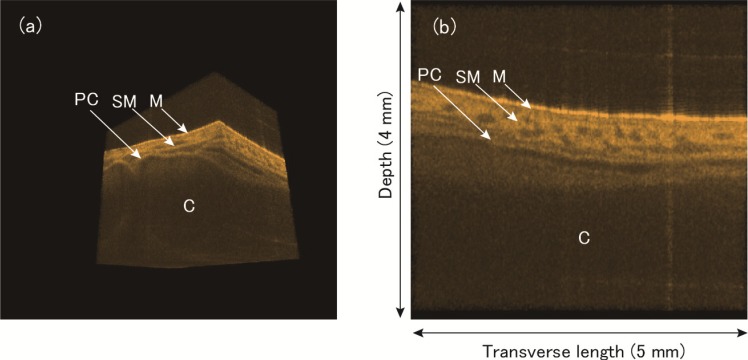
Representative frames of videos made from recorded data are shown in Fig. 13 . An excised porcine trachea was imaged at an A-scan rate of 2.5 MHz, B-scan rate of 4 kHz, and volume rate of 11 volumes/second. The voxel size was 256 (axial) × 256 × 256 (lateral) and the imaging volume size was 4 mm (depth) × 5 mm (lateral fast axis) × 5mm (lateral slow axis), respectively. The 1.5-cm-long trachea was cut at about the middle position between the throat and bronchia. The trachea tube was cut lengthwise and opened for imaging the inner wall.
Fig. 13.
(a) Representative image of video showing a series of 3D images of porcine trachea as we move the cutting surface in transverse direction (Media 9 (2.3MB, AVI) ). (b) Representative image of video showing a series of cross-sectional images in transverse direction (Media 10 (3.9MB, AVI) ). M represents mucosa region; SM: submucosa region; C: cartilage; and PC: perichondrium.
One volume data was selected as an example from 24 recorded volumes (about 2.2 seconds duration) and rendered to observe images at various surfaces. The one volume data was acquired in 64 ms. Figures 13(a) and 13(b) are representative frames of the rendered 3D image and 2D transverse cross section of the trachea, respectively. Compared with previous imaging of a pig trachea with OCT [44], the mucosa region (M), submucosa region (SM), perichondrium (PC), and cartilage (C) are distinct. In Media 9 (2.3MB, AVI) , we can clearly observe the three dimensional cartilage structure. In Media 10 (3.9MB, AVI) , a subtle change in the transverse cross-sectional image can be seen as we move along the axis direction of the trachea.
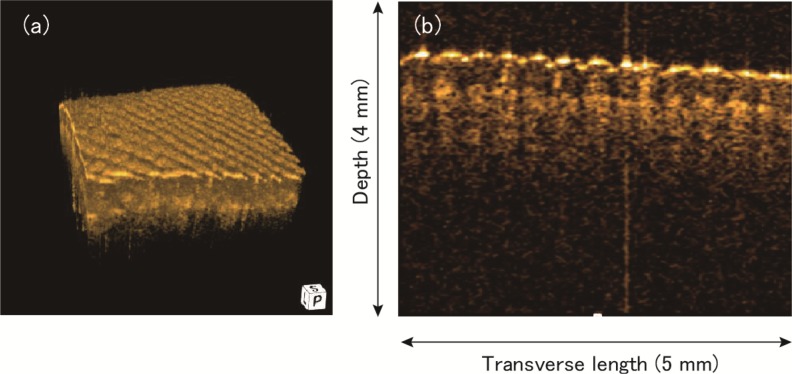
In Fig. 14 , one volume data of the human middle finger skin was selected and shown as an example from 41 volumes recording during 1 second duration. The volume rate was 41 volumes per second. The voxel size was 256 (axial) × 128 × 128(lateral) and the imaging volume size was 4 mm (depth) × 5 mm (lateral fast axis) × 5mm (lateral slow axis), respectively. The one volume data was acquired within 16 ms. Figure 14(a) is a representative rendered 3D image and Fig. 14(b) is a B-scan cross sectional image selected from the 3D image.
Fig. 14.
(a) A rendered 3D image of the human middle finger recorded at a volume rate of 41 volumes/second. (b) A B-scan image selected from the 3D image.
4. Conclusion and possible improvements
An ultra-fast spectral domain optical coherence tomography system capable of capturing volume images faster than the standard video rate has been demonstrated. The fastest A-scan rate of 10 MHz was demonstrated. The upper limit of the A-scan is limited by the frequency response of the photoreceivers and can be improved by using higher speed photo-detectors up to the speed of DAQs, which is 50 MHz in our case. However, the real-time processing is not possible at this sampling rate due to the limitation of the processing system. The A-scan rate of 10 MHz with the faster B-scan rate of 8 kHz was limited by the FFT processing speed of the FPGAs. Faster FFT processing speeds are expected by using GPU(s) instead of FPGAs. By an increase in the B-scan rate, the volume rate is expected to increase proportionally. The traffic speed of the PCI Express bus limits the total data transfer rate between the DAQ system and PC in our system, which will improved future advancement in computer technology. Another limit of the fast OCT system is the data transfer rate between a PC and GPU, as discussed by Li et al. [31]. The rapidly progressing GPU technology and/or fusion of GPU and CPU might remove this limit.
The ultra-fast SD-OCT made possible simultaneous parallel detection of the interference signal at all frequencies using optical demultiplexers, which were AWGs in our case. However, AWGs decreased sensitivity. This low sensitivity is due to the strong attenuation of the signal by the AWGs and the narrow pass-band characteristic at each channel of the AWG. In this research, sensitivity improved by about 16 dB by using an SOA compared with that without SOA. Although the achieved sensitivity was sufficient for OCT imaging with deep image penetration, as shown in Fig. 13, the reduction of 10 dB from that expected for the shot-noise limit should be improved. Using a frequency comb source, the loss due to the narrow pass band will be improved by 3 dB. The achieved axial resolution of 23 and 37 μm for rectangular and Hanning apodization, respectively, is insufficient for detailed tissue imaging. In the presented configuration using AWGs, we need to increase the channel number, which requires an additional cost. The depth range of 4 mm is sufficient for general tissue imaging but insufficient for imaging the anterior segment of the eye, which may be improved by removing the degeneracy of complex conjugate images.
Real-time 4D OCT display has been demonstrated up to 41 volumes/second with a voxel size of 256 (axial) × 128 × 128 (lateral). A volume was captured within 16 ms in this case. With the imaging speed, video recording of dynamical deformation of tissues were demonstrated for miosis of a human eye and a rubber band. Real-time manipulation of the 3D image at the imaging speed was demonstrated. Much faster volume image processing was confirmed for smaller voxel-sized images. However, the refresh rate of the LCD display was limited to 59 frames/second and the human eye cannot detect such a fast image change. In the real-time display scheme, further research should be done to increase the voxel size to obtain finer images.
Recording of 4D OCT videos has been confirmed up to 100 volumes/second with a voxel size of 256 (axial) × 128 (lateral fast axis) × 32 (lateral slow axis), which will be useful for research and detailed diagnostic purposes when a tissue exhibits fast change. Choosing a volume image out of the OCT video of porcine trachea recorded at a rate of 11 volumes/second with a voxel size 256 (axial) × 256 × 256 (lateral), deep image-penetration was demonstrated. In this work, the recording speed was limited by the speed of the HDD, which will be improved due to advancements in memory technology.
Acknowledgments
This work was supported by the Japan Science and Technology Agency (JST) “Development of Systems and Technology for Advanced Measurement and Analysis” program. The authors express their thanks to Renzo Ikeda, Atsusi Kubota, and Tutomu Ohno of System House Co. for the software development.
References and links
- 1.Huang D., Swanson E. A., Lin C. P., Schuman J. S., Stinson W. G., Chang W., Hee M. R., Flotte T., Gregory K., Puliafito C. A., Fujimoto J. G., “Optical coherence tomography,” Science 254(5035), 1178–1181 (1991). 10.1126/science.1957169 [DOI] [PMC free article] [PubMed] [Google Scholar]
- 2.Vakoc B. J., Shishko M., Yun S. H., Oh W. Y., Suter M. J., Desjardins A. E., Evans J. A., Nishioka N. S., Tearney G. J., Bouma B. E., “Comprehensive esophageal microscopy by using optical frequency-domain imaging (with video),” Gastrointest. Endosc. 65(6), 898–905 (2007). 10.1016/j.gie.2006.08.009 [DOI] [PMC free article] [PubMed] [Google Scholar]
- 3.Adler D. C., Zhou C., Tsai T. H., Schmitt J., Huang Q., Mashimo H., Fujimoto J. G., “Three-dimensional endomicroscopy of the human colon using optical coherence tomography,” Opt. Express 17(2), 784–796 (2009). 10.1364/OE.17.000784 [DOI] [PMC free article] [PubMed] [Google Scholar]
- 4.Low A. F., Tearney G. J., Bouma B. E., Jang I. K., “Technology Insight: optical coherence tomography--current status and future development,” Nat. Clin. Pract. Cardiovasc. Med. 3(3), 154–162, quiz 172 (2006). 10.1038/ncpcardio0482 [DOI] [PubMed] [Google Scholar]
- 5.Jenkins M. W., Rothenberg F., Roy D., Nikolski V. P., Hu Z., Watanabe M., Wilson D. L., Efimov I. R., Rollins A. M., “4D embryonic cardiography using gated optical coherence tomography,” Opt. Express 14(2), 736–748 (2006). 10.1364/OPEX.14.000736 [DOI] [PubMed] [Google Scholar]
- 6.Gargesha M., Jenkins M. W., Rollins A. M., Wilson D. L., “Denoising and 4D visualization of OCT images,” Opt. Express 16(16), 12313–12333 (2008). 10.1364/OE.16.012313 [DOI] [PMC free article] [PubMed] [Google Scholar]
- 7.Gargesha M., Jenkins M. W., Wilson D. L., Rollins A. M., “High temporal resolution OCT using image-based retrospective gating,” Opt. Express 17(13), 10786–10799 (2009). 10.1364/OE.17.010786 [DOI] [PMC free article] [PubMed] [Google Scholar]
- 8.Ma Z., Liu A., Yin X., Troyer A., Thornburg K., Wang R. K., Rugonyi S., “Measurement of absolute blood flow velocity in outflow tract of HH18 chicken embryo based on 4D reconstruction using spectral domain optical coherence tomography,” Biomed. Opt. Express 1(3), 798–811 (2010). 10.1364/BOE.1.000798 [DOI] [PMC free article] [PubMed] [Google Scholar]
- 9.Just T., Lankenau E., Hüttmann G., Pau H. W., “Intra-operative application of optical coherence tomography with an operating microscope,” J. Laryngol. Otol. 123(09), 1027–1030 (2009). 10.1017/S0022215109004770 [DOI] [PubMed] [Google Scholar]
- 10.Geerling G., Müller M., Winter C., Hoerauf H., Oelckers S., Laqua H., Birngruber R., “Intraoperative 2-dimensional optical coherence tomography as a new tool for anterior segment surgery,” Arch. Ophthalmol. 123(2), 253–257 (2005). 10.1001/archopht.123.2.253 [DOI] [PubMed] [Google Scholar]
- 11.Tao Y. K., Ehlers J. P., Toth C. A., Izatt J. A., “Intraoperative spectral domain optical coherence tomography for vitreoretinal surgery,” Opt. Lett. 35(20), 3315–3317 (2010). 10.1364/OL.35.003315 [DOI] [PMC free article] [PubMed] [Google Scholar]
- 12.Watanabe H., Rajagopalan U. M., Nakamichi Y., Igarashi K. M., Kadono H., Tanifuji M., “Swept source optical coherence tomography as a tool for real time visualization and localization of electrodes used in electrophysiological studies of brain in vivo,” Biomed. Opt. Express 2(11), 3129–3134 (2011). 10.1364/BOE.2.003129 [DOI] [PMC free article] [PubMed] [Google Scholar]
- 13.Huber R., Adler D. C., Fujimoto J. G., “Buffered Fourier domain mode locking: Unidirectional swept laser sources for optical coherence tomography imaging at 370,000 lines/s,” Opt. Lett. 31(20), 2975–2977 (2006). 10.1364/OL.31.002975 [DOI] [PubMed] [Google Scholar]
- 14.Oh W. Y., Vakoc B. J., Shishkov M., Tearney G. J., Bouma B. E., “>400 kHz repetition rate wavelength-swept laser and application to high-speed optical frequency domain imaging,” Opt. Lett. 35(17), 2919–2921 (2010). 10.1364/OL.35.002919 [DOI] [PMC free article] [PubMed] [Google Scholar]
- 15.Potsaid B., Baumann B., Huang D., Barry S., Cable A. E., Schuman J. S., Duker J. S., Fujimoto J. G., “Ultrahigh speed 1050nm swept source/Fourier domain OCT retinal and anterior segment imaging at 100,000 to 400,000 axial scans per second,” Opt. Express 18(19), 20029–20048 (2010). 10.1364/OE.18.020029 [DOI] [PMC free article] [PubMed] [Google Scholar]
- 16.Wieser W., Biedermann B. R., Klein T., Eigenwillig C. M., Huber R., “Multi-megahertz OCT: High quality 3D imaging at 20 million A-scans and 4.5 GVoxels per second,” Opt. Express 18(14), 14685–14704 (2010). 10.1364/OE.18.014685 [DOI] [PubMed] [Google Scholar]
- 17.Klein T., Wieser W., Eigenwillig C. M., Biedermann B. R., Huber R., “Megahertz OCT for ultrawide-field retinal imaging with a 1050 nm Fourier domain mode-locked laser,” Opt. Express 19(4), 3044–3062 (2011). 10.1364/OE.19.003044 [DOI] [PubMed] [Google Scholar]
- 18.Bonin T., Franke G., Hagen-Eggert M., Koch P., Hüttmann G., “In vivo Fourier-domain full-field OCT of the human retina with 1.5 million A-lines/s,” Opt. Lett. 35(20), 3432–3434 (2010). 10.1364/OL.35.003432 [DOI] [PubMed] [Google Scholar]
- 19.Potsaid B., Gorczynska I., Srinivasan V. J., Chen Y., Jiang J., Cable A., Fujimoto J. G., “Ultrahigh speed spectral / Fourier domain OCT ophthalmic imaging at 70,000 to 312,500 axial scans per second,” Opt. Express 16(19), 15149–15169 (2008). 10.1364/OE.16.015149 [DOI] [PMC free article] [PubMed] [Google Scholar]
- 20.An L., Li P., Shen T. T., Wang R., “High speed spectral domain optical coherence tomography for retinal imaging at 500,000 A‑lines per second,” Biomed. Opt. Express 2(10), 2770–2783 (2011). 10.1364/BOE.2.002770 [DOI] [PMC free article] [PubMed] [Google Scholar]
- 21.Wang R., Yun J. X., Yuan X., Goodwin R., Markwald R. R., Gao B. Z., “Megahertz streak-mode Fourier domain optical coherence tomography,” J. Biomed. Opt. 16(6), 066016 (2011). 10.1117/1.3593149 [DOI] [PMC free article] [PubMed] [Google Scholar]
- 22.Choi D., Hiro-Oka H., Furukawa H., Yoshimura R., Nakanishi M., Shimizu K., Ohbayashi K., “Fourier domain optical coherence tomography using optical demultiplexers imaging at 60,000,000 lines/s,” Opt. Lett. 33(12), 1318–1320 (2008). 10.1364/OL.33.001318 [DOI] [PubMed] [Google Scholar]
- 23.Liu G., Zhang J., Yu L., Xie T., Chen Z., “Real-time polarization-sensitive optical coherence tomography data processing with parallel computing,” Appl. Opt. 48(32), 6365–6370 (2009). 10.1364/AO.48.006365 [DOI] [PMC free article] [PubMed] [Google Scholar]
- 24.Su J., Zhang J., Yu L., G Colt H., Brenner M., Chen Z., “Real-time swept source optical coherence tomography imaging of the human airway using a microelectromechanical system endoscope and digital signal processor,” J. Biomed. Opt. 13(3), 030506 (2008). 10.1117/1.2938700 [DOI] [PMC free article] [PubMed] [Google Scholar]
- 25.Ustun T. E., Iftimia N. V., Ferguson R. D., Hammer D. X., “Real-time processing for Fourier domain optical coherence tomography using a field programmable gate array,” Rev. Sci. Instrum. 79(11), 114301 (2008). 10.1063/1.3005996 [DOI] [PMC free article] [PubMed] [Google Scholar]
- 26.Desjardins A. E., Vakoc B. J., Suter M. J., Yun S. H., Tearney G. J., Bouma B. E., “Real-time FPGA processing for high-speed optical frequency domain imaging,” IEEE Trans. Med. Imaging 28(9), 1468–1472 (2009). 10.1109/TMI.2009.2017740 [DOI] [PMC free article] [PubMed] [Google Scholar]
- 27.Watanabe Y., Itagaki T., “Real-time display on Fourier domain optical coherence tomography system using a graphics processing unit,” J. Biomed. Opt. 14(6), 060506 (2009). 10.1117/1.3275463 [DOI] [PubMed] [Google Scholar]
- 28.Watanabe Y., Maeno S., Aoshima K., Hasegawa H., Koseki H., “Real-time processing for full-range Fourier-domain optical-coherence tomography with zero-filling interpolation using multiple graphic processing units,” Appl. Opt. 49(25), 4756–4762 (2010). 10.1364/AO.49.004756 [DOI] [PubMed] [Google Scholar]
- 29.Van der Jeught S., Bradu A., Podoleanu A. G., “Real-time resampling in Fourier domain optical coherence tomography using a graphics processing unit,” J. Biomed. Opt. 15(3), 030511 (2010). 10.1117/1.3437078 [DOI] [PubMed] [Google Scholar]
- 30.Zhang K., Kang J. U., “Graphics processing unit accelerated non-uniform fast Fourier transform for ultrahigh-speed, real-time Fourier-domain OCT,” Opt. Express 18(22), 23472–23487 (2010). 10.1364/OE.18.023472 [DOI] [PMC free article] [PubMed] [Google Scholar]
- 31.Li J., Bloch P., Xu J., Sarunic M. V., Shannon L., “Performance and scalability of Fourier domain optical coherence tomography acceleration using graphics processing units,” Appl. Opt. 50(13), 1832–1838 (2011). 10.1364/AO.50.001832 [DOI] [PubMed] [Google Scholar]
- 32.Probst J., Hillmann D., Lankenau E., Winter C., Oelckers S., Koch P., Hüttmann G., “Optical coherence tomography with online visualization of more than seven rendered volumes per second,” J. Biomed. Opt. 15(2), 026014 (2010). 10.1117/1.3314898 [DOI] [PubMed] [Google Scholar]
- 33.Sylwestrzak M., Szkulmowski M., Szlag D., Targowski P., “Real-time imaging for spectral optical coherence tomography with massively parallel data processing,” Photonics Lett. Poland 2, 137–139 (2010). [Google Scholar]
- 34.Zhang K., Kang J. U., “Real-time 4D signal processing and visualization using graphics processing unit on a regular nonlinear-k Fourier-domain OCT system,” Opt. Express 18(11), 11772–11784 (2010). 10.1364/OE.18.011772 [DOI] [PMC free article] [PubMed] [Google Scholar]
- 35.Zhang K., Kang J. U., “Real-time intraoperative 4D full-range FD-OCT based on the dual graphics processing units architecture for microsurgery guidance,” Biomed. Opt. Express 2(4), 764–770 (2011). 10.1364/BOE.2.000764 [DOI] [PMC free article] [PubMed] [Google Scholar]
- 36.K. Okamoto, Fundamentals of Optical Waveguides, 2nd ed. (Elsevier, Amsterdam, 2006). [Google Scholar]
- 37.Nguyen V. D., Akca B. I., Wörhoff K., de Ridder R. M., Pollnau M., van Leeuwen T. G., Kalkman J., “Spectral domain optical coherence tomography imaging with an integrated optics spectrometer,” Opt. Lett. 36(7), 1293–1295 (2011). 10.1364/OL.36.001293 [DOI] [PubMed] [Google Scholar]
- 38.Akca B. I., Chang L., “G. Sengo, K. Wörhoff, R. M. de Ridder, and M. Pollnau, “Polarization-independent enhanced-resolution arrayed-waveguide grating used in spectral-domain optical low-coherence reflectometry,” IEEE Photon. Technol. Lett. 24, 848–850 (2012). [Google Scholar]
- 39.Amano T., Hiro-Oka H., Choi D., Furukawa H., Kano F., Takeda M., Nakanishi M., Shimizu K., Ohbayashi K., “Optical frequency-domain reflectometry with a rapid wavelength-scanning superstructure-grating distributed Bragg reflector laser,” Appl. Opt. 44(5), 808–816 (2005). 10.1364/AO.44.000808 [DOI] [PubMed] [Google Scholar]
- 40.Bajraszewski T., Wojtkowski M., Szkulmowski M., Szkulmowska A., Huber R., Kowalczyk A., “Improved spectral optical coherence tomography using optical frequency comb,” Opt. Express 16(6), 4163–4176 (2008). 10.1364/OE.16.004163 [DOI] [PubMed] [Google Scholar]
- 41.“CUDA Toolkit 3.1 Downloads,” http://developer.nvidia.com/cuda-toolkit-31-downloads
- 42.Olsson N. A., “Lightwave systems with optical amplifiers,” J. Lightwave Technol. 7(7), 1071–1082 (1989). 10.1109/50.29634 [DOI] [Google Scholar]
- 43.American National Standards Institute, “American national standard for safe use of lasers,” ANSI Z136.1–200 (ANSI, 2000).
- 44.Yang Y., Whiteman S., van Pittius D. G., He Y., Wang R. K., Spiteri M. A., “Use of optical coherence tomography in delineating airways microstructure: comparison of OCT images to histopathological sections,” Phys. Med. Biol. 49(7), 1247–1255 (2004). 10.1088/0031-9155/49/7/012 [DOI] [PubMed] [Google Scholar]


