Abstract
Biomolecular recognition has long been an important theme in artificial sensing technologies. A current limitation of protein- and nucleic acid-based recognition, however, is that the useful dynamic range of single-site binding typically spans an 81-fold change in target concentration, an effect that limits the utility of biosensors in applications calling for either great sensitivity (a steeper relationship between target concentration and output signal) or for the quantification of more wide-ranging concentrations. In response, we have adapted strategies employed by nature to modulate the input-output response of its biorecognition systems to rationally edit the useful dynamic range of an artificial biosensor. By engineering a structure-switching mechanism, we first generated a set of receptor variants displaying similar specificity, but spanning a wide range of target affinities. We then rationally combined sub-sets of these variants to expand the pseudo-log-linear dynamic range of our biosensor to six orders of magnitude. Using other combinations of variants we have also fabricated more elaborate, three-state dose-response sensors that respond sensitively only when the target concentration falls above or below some well-defined intermediate regime. Finally, by combining signaling and non-signaling receptor variants, we have succeeded in both compressing the dynamic range of our biosensor by an order of magnitude, and in rationally tuning its narrowed threshold response to any arbitrarily selected target concentrations. Given their widespread occurrence in nature, it would appear that these same approaches could significantly enhance the performance of many biomolecule-based technologies.
The versatility of biomolecular recognition supports the high affinity, high specificity recognition of an enormous range of molecular targets. This observation has motivated decades of research aimed at harnessing biological recognition in molecular sensing technologies, many of which have become critical tools in the modern diagnostic arsenal (e.g. ELISAs1, Western blots2, molecular beacons3).
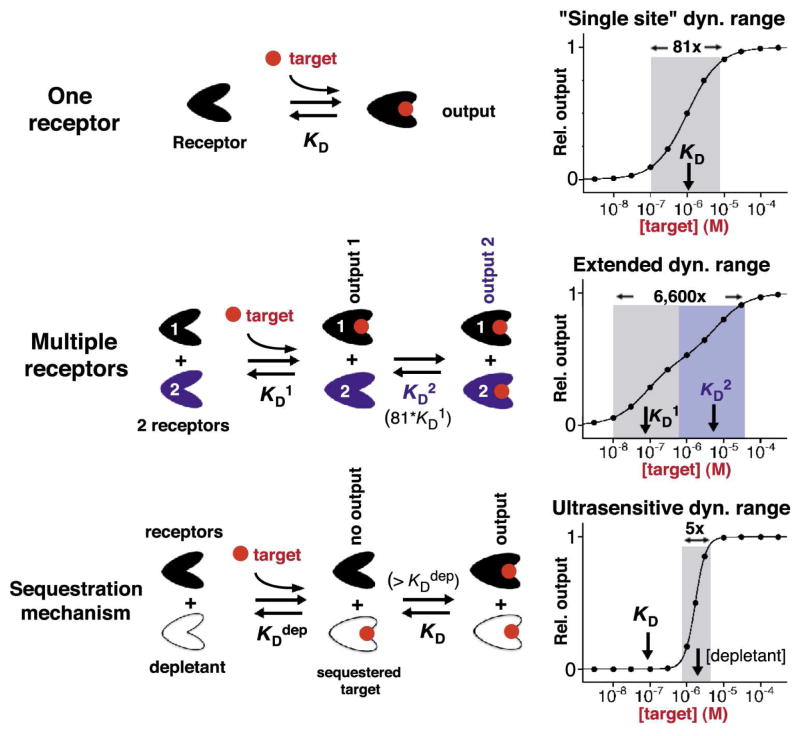
Despite the positive attributes that have ensured its widespread use in artificial sensing technologies, biological recognition exhibits a potentially significant limitation: the physics of single-site binding produces a hyperbolic dose-response curve for which the useful dynamic range spans a fixed change in target concentration. Specifically, the transition from 10% to 90% site occupancy requires a fixed 81-fold span of target concentration4,5 (Fig. 1, top). This fixed dynamic range complicates (or even precludes) the use of biosensors in many applications. Clinically relevant HIV loads, for example, typically vary over more than five orders of magnitude (e.g. from ~50 to >106 copies/mL -ref6), dwarfing the dynamic range associated with single-site binding. This same 81-fold dynamic range also renders biosensors poorly suited for applications requiring very precise measurement of target concentration. For example, the therapeutic indices (i.e., the dose that provides efficacy without toxicity) of many drugs, including cyclosporine and the aminoglycosides7, are often less than an order of magnitude. The clinical measurement of these drugs thus requires a degree of precision that is often difficult to achieve with a device that necessitates a 81-fold change in concentration in order to transition from 10% to 90% of signal saturation.
Figure 1.
Using nature’s tricks to extend or narrow the fixed dynamic ranges of single-site receptors. Top: The useful dynamic range of sensors with a single-site receptor spans a 81-fold range of target concentration over which the sensor response transits from 10% to 90% of its signal output, Middle: This useful dynamic range can be extended by combining multiple receptors differing in their affinity for the same target (shown here is the combination of two receptors exhibiting an 80-fold difference in affinity). Bottom: The dynamic range can be narrowed, producing a very steep, “ultrasensitive” dose-response curve via a sequestration mechanism that employs a high-affinity non-active depletant receptor. The depletant (white) serves as a ‘sink’ that sequesters free target molecules until it is saturated. With a concentration of the depletant above the dissociation constant of the receptor, KD, an increase in target concentration above this depletant concentration will generate a threshold response, leading to an ultrasensitive response9.
Faced with the limitations inherent with single-site binding, evolution has invented a number of simple mechanisms by which the normally fixed dynamic range of single-site binding can be extended, narrowed or otherwise “edited” to better ensure the survival of an organism 4,5,8–10. For example, in order to create extended –or even more complex, three-state– dose-response sensing systems, evolution often employs pairs of closely related receptors (recognition elements) differing in affinity (Figure 1, middle)8,11. Nature has likewise invented methods to narrow the dynamic range of single-site binding, so as to create steep, ultrasensitive outputs to ensure robust responses to small changes in target concentration. The sequestration mechanism (Figure 1, bottom)9 for example, employs a high-affinity, non-signaling receptor to prevent the accumulation of free target until the total target concentration surpasses the concentration of this “depletant” (the sink is saturated). This produces a threshold response in which further target addition leads to a dramatic increase in the relative concentration of free target, generating an apparent “all-or-none” response from a second, lower affinity –but signaling– receptor. Despite their simplicity, however, and the ubiquity with which nature employs them, these strategies have seen little (extended dynamic range:12–15) if any (narrowing and more complex editing) application in artificial sensing technologies. Indeed, the majority of efforts to this end have focused on kinetic -rather than thermodynamic- approaches to altering the useful dynamic range of biosensors16,17. In response, here we demonstrate the utility of these equilibrium strategies in rationally optimizing the useful dynamic range of synthetic biosensors.
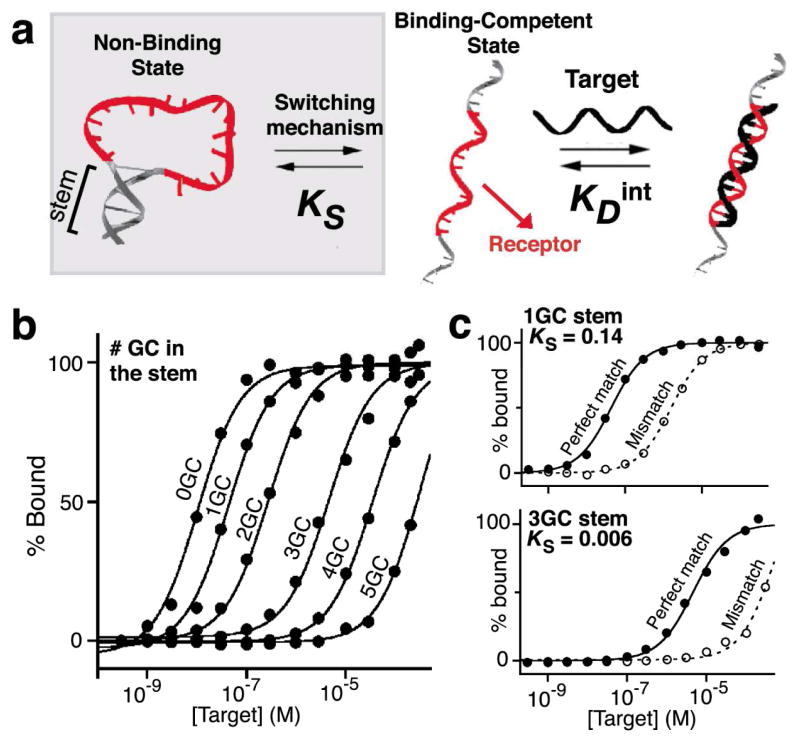
The mechanisms we have employed require the availability of matched sets of receptors varying in affinity (Figure 1). The only approaches that have been reported to date to broaden the dynamic range of a biosensor, however, has employed receptors varying in affinity via alterations of the binding site itself12–15, which also affects specificity, Sensors made by combining such receptors therefore exhibit varying specificity across their dynamic range. We have circumvented this by generating receptors that retain identical specificities whilst varying significantly in affinity. We did so by engineering a conformational switching mechanism into the receptor (Figure 2a) via the stabilization of an alternative “non-binding” state. By tuning the switching equilibrium constant of such a receptor via stabilization of the non-binding state, we can alter its apparent affinity without altering the specific interactions that it forms with its target18,19. A similar strategy is often used by nature to decrease affinity without altering specificity; an example is the intrinsically unfolded proteins, which reduce their affinity (by coupling binding to an unfavorable folding event) without altering their specificity (the binding site itself is not altered)20.
Figure 2.
The introduction of a switching mechanism (grey box) allows ready tuning of the affinity of receptors. This can be realized by stabilizing an alternative, non-binding state21. The apparent affinity of the modified receptor can be rationally tuned by altering the equilibrium constant between the two states, KS (Figure S2). (a–b) Using this strategy we have tuned the affinity of DNA molecular beacons by up to 4 orders of magnitude by varying the GC base pair content in their stems19. (c) As such modification does not alter the receptor’s binding interface (shown in red), and does not alter specificity. This is demonstrated here by comparing the difference in affinity displayed by receptor 1GC and 3GC for a perfectly matched (PM) target and a one-base mismatched (MM) target. The nearly identical offsets between the PM and MM curves illustrates the identical specificity profiles of the two receptors (see Figure S2).
Using the structure-switching approach we have generated a set of six receptors with affinities spanning four orders of magnitude (Figure 2b). Specifically, we have fabricated a set of molecular beacons3, a widely employed DNA stem-loop fluorescent biosensor for the detection of specific nucleic acid sequences (Figure S1a), that only differ in the stability of their “non-binding” conformation (i.e. stability of their double-stranded stem)19. As expected, each of these variants retains the classic hyperbolic binding curve (an 81-fold dynamic range) expected for single site binding, producing dissociation constants ranging from 0.012 to 128 μM, (Figure 2b and Table S1). Likewise, as expected, all six receptors display similar discrimination between their correct target and a mutant target differing by a single nucleotide (Figure 2c and Figure S2; on average 35-fold difference in affinity).
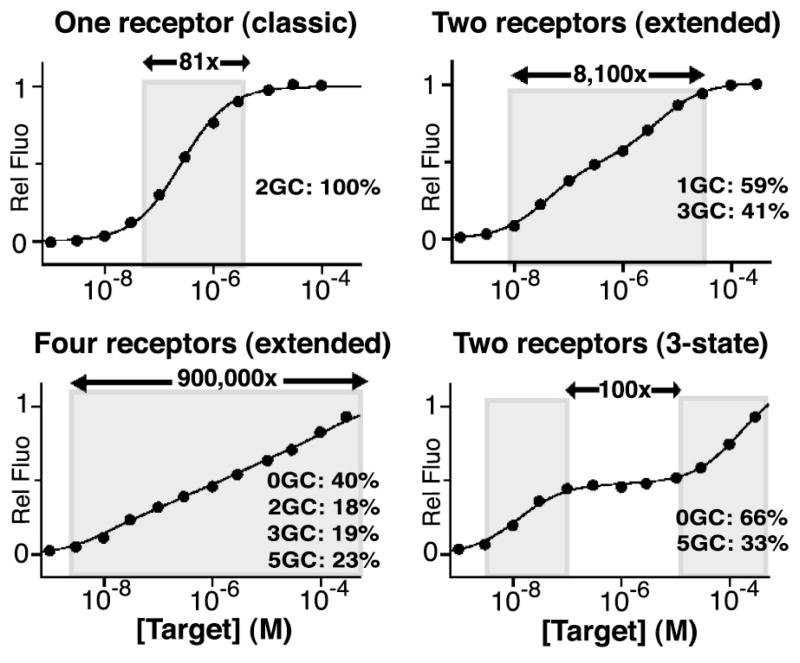
In order to extend the useful dynamic range of this biosensor we have combined two or more receptors differing in affinity (Figure 1, middle). To do so, we first performed simulations to define the difference in affinity that maximizes the linear (on a log[concentration] plot) range of the paired receptors (Figure S3). These simulations indicate that combining receptors differing by 100-fold in affinity produces a wide, yet still highly log-linear dynamic range. If the difference in the affinities of the two receptors climbs above 100- fold, significant deviations from linearity are observed at intermediate target concentrations (Figure S3). Of note, however, a limitation related to the use of a structure-switching signaling mechanism is that the signal gain of individual receptors also degrades when the switch is too unstable (see Table S1 and Figure S4a)19. More precisely, as the non-binding states becomes less stable (the switching equilibrium constant, KS, rises above 0.05), the fraction of receptor in the binding-competent signaling state in the absence of target becomes significant, reducing both the total fluorescence change and signal gain (relative fluorescence change) at saturating target concentrations19. The naïve approach of combining receptors in equimolar concentrations would thus lead to deviations from ideal behavior. Fortunately, we can correct for this effect by adjusting the molar ratios of the two receptors (Figure S4b). For example, our molecular beacons 1GC (83% of the maximum fluorescent change -Table S1) and 3GC (maximum fluorescence change), which differ in affinity by exactly 100-fold, can be combined in a ratio of 59/41 to create a sensor with an extended, 8,100-fold dynamic range of near perfect log-linearity (R2=0.995) and 9-fold signal gain (Figure 3). Moreover, the modified sensor maintains the same specificity profile across its entire extended dynamic range (Figure S5).
Figure 3.
We can extend and edit the dynamic range of sensors by combining sets of receptors differing in affinity. Extended dynamic range: We have extended the useful 81-fold dynamic range of a traditional molecular beacon to 8,100-fold by combining two beacons differing by 100-fold in affinity. Expanding on this, we can combine additional receptors to generate still broader dynamic ranges. Here we have combined four molecular beacons to achieve a 900,000-fold log-linear range (see Figure S4 for optimization of the receptor ratios). Three-state dynamic range: By combining molecular beacons differing more than 500 fold in affinity (see Figure S3), we can generate more complex “three-state” dose-response sensors, which “push” their useful dynamic range towards the extremes at the cost of poorer sensitivity at intermediate concentrations. Shown here is a mixture of two molecular beacons differing in affinity by a factor of ~12,000, which together generate an intermediate 100-fold concentration plateau over which the sensor response is flat. Of note, by using the structure-switching mechanism to modulate receptor affinity, all of these sensors share a common specificity profile across the entirety of their dynamic ranges (see Figure S5).
While 8,100-fold represents the broadest log-linear dynamic range that can be achieved using just two receptors, we can broaden the dynamic range still further by adding additional variants. A potential challenge, however, is that the precision with which we can control receptor affinity is not perfect and thus, again, non-stochiometric ratios of variants are required to produce good log-linear behavior. Here too, however, simulations can be used to determine the optimal mixing ratios (Figure S4c). To demonstrate this we have designed a mixture of four receptors, which includes two molecular beacons (0GC and 5GC) differing in affinity by more than 10,000 fold (Table S1). When combined with optimized concentrations of two molecular beacons of intermediate affinity (2GC and 3GC), we obtain a sensor with 3.6-fold signal gain and a log-linear range (R2=0.995) that, at ~900,000-fold, is more than four orders of magnitude greater than that of any single molecular beacon (Figure 3). Again, this “wider” sensor maintains a constant specificity profile across its entire dynamic range (Figure S5).
While achieving extended dynamic range improves the usefulness of biosensors for many applications, other applications could benefit from yet more complex dose-response curves. It may, for example, prove beneficial, in some circumstances to “trade-off” sensitivity (the ability to measure small changes in concentration) within a window of useful concentrations (e.g., the clinically relevant concentration range of a drug) in order to achieve enhanced precision above or below the “appropriate” concentration range. That is, in some applications it may prove useful to achieve a “three-state” dynamic range that “pushes” the useful dynamic range of a sensor towards its extremes at the cost of poorer precision at intermediate concentrations. Such an input-output can be realized by combining receptors with affinities differing by more than 500 fold (Figure S3). Here we used molecular beacons, 0GC and 5GC, differing in affinity by 12,000 fold (Table S1). The resultant sensor is highly sensitive to excursions of the target concentrations either above or below an intermediate 100-fold span of concentrations at the cost of exhibiting little sensitivity over the intermediate range (Figure 3).
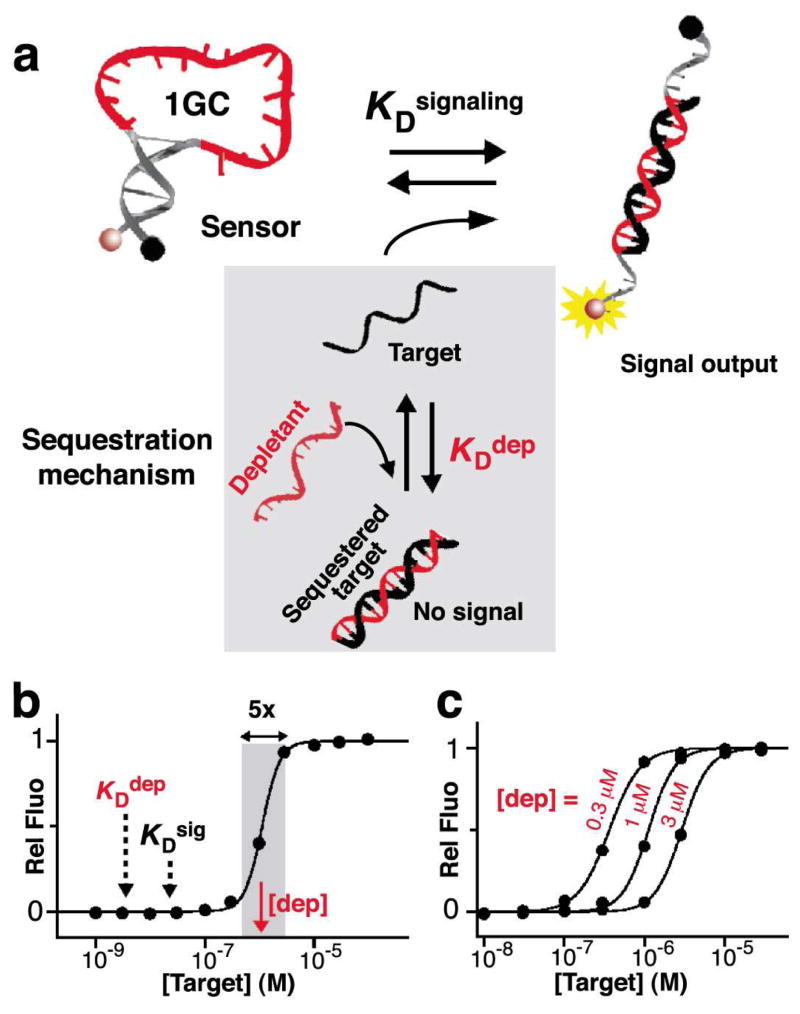
For still other applications the 81-fold dynamic range of single-site binding is too broad, limiting our ability to achieve sufficiently precise measurements of target concentration. In response we have also narrowed the dynamic range of our sensor (larger change in output for a given change in target concentration) using the sequestration mechanism (Figure 1, bottom). In this mechanism, which is thought to underlie the extraordinary sensitivity of many genetic networks9,10, the concentration of free target is suppressed via the presence of a high affinity, non-signaling receptor, termed the “depletant,” that acts as a “sink” (Figure 1, bottom)9. When the total target concentration surpasses the depletant concentration, this sink is saturated and a threshold response is achieved in which any further increase in total target drastically raises the relative concentration of free target. This, in turn, activates a second, lower affinity –but signaling- receptor generating a “pseudo-cooperative”22 dose-response curve in which the output signal rises much more rapidly with increasing target concentration than would occur in the absence of a depletant. We have adapted the sequestration mechanism to molecular beacons by employing the non-switching (and thus high-affinity), non-signaling linear DNA as the depletant (Figure 4a). Using this depletant to support the sequestration mechanism we have narrowed the dynamic range of a traditional molecular beacon by more than an order of magnitude (Figure 4b). Specifically, by employing a relatively low affinity molecular beacon (1GC) as our signaling moiety and a 30-fold excess of the higher affinity depletant, we have created an ultrasensitive sensor that transitions from 10% to 90% of its maximun output over only a 5-fold range of target concentrations (Figure 4b). Moreover, the center of the narrowed dynamic range can be arbitrarily “tuned across a broad range of target concentrations by simply varying the depletant concentration (Figure 4c)
Figure 4.
Narrowing and tuning the dynamic range of sensors using the sequestration mechanism. (a) We can narrow the dynamic range of a sensor, i.e. producing a very steep, “ultrasensitive” dose-response curve, via a sequestration mechanism (grey box) that employs a high affinity non-signaling “depletant”9. This depletant acts as a “sink,” keeping the concentration of free target molecules low until the sink is saturated. (b) With a concentration of depletant, [dep], above the dissociation constant of the receptor, KDsig, an increase in target concentration above this [dep] will generate a threshold response, leading to an ultrasensitive response. (c) Conveniently, the dynamic range of this narrowed dynamic range can be arbitrarily shifted to respond to higher target concentration by increasing the concentration of depletant. Of note, non-switching receptor variants are a useful source of depletant, as these bind more tightly than the corresponding structure-switching receptors.
Here we have employed several naturally occurring strategies to rationally extend, narrow, and otherwise edit the dynamic range of an artificial biosensor. These strategies are simple and versatile and only require the availability of sets of receptors differing in affinity, whilst retaining similar specificity for the target. Using a structure-switching approach to tune the affinity of our receptor without modifying its specificity21, and using various combination of signaling and non-signaling receptors, we have rationally extend (to 900,000-fold), narrow (to 5-fold), and edit (three-state) (Figure S6) the useful dynamic range of a molecular beacon, a widely employed biosensor for the detection of specific DNA sequences.
The approaches described here could, in principle, be applied to a wide range of biomolecules, provided that these can be engineered to support the requisite structure switching mechanism21. Fortunately, rational strategies have been developed for the design of structure-switching aptamers or aptazymes21,23–25 and for the tuning of their dynamic range19,26–29. Rational and semi-rational strategies are also available to engineer such switching mechanisms into proteins18,21,30–36. Loh and co-workers, for example, have demonstrated a generic strategy to design novel protein-based switches, termed “alternate frame folding”, which uses a duplication of a portion of a protein’s sequence to stabilize an alternative non-binding circularly permuted conformation. The introduction of mutations that disrupt target binding in the lower energy of these two conformations thus links binding affinity of the receptor to the stability of this second conformation32. Alternatively, proteins and nucleic acids can be engineered to undergo folding-induced conformational changes via the introduction of destabilizing mutations (typically remote from the target binding site so as to ensure that specificity is retained), which pushes the folding equilibrium towards the non-binding, unfolded state and thus reduces the protein’s binding affinity35.
The strategies proposed here could prove of use in many biorecognition-based applications. “Smarter” fluorescent probes for real-time in vivo imaging, for example, could be created to display optimized dynamic ranges adapted to specific biologically relevant concentration ranges. Molecular beacons, for example, which are often used for the real time monitoring of specific RNA in vivo37, could be used in a “mixture” format to precisely detect either very small or very large concentration variation of specific RNA targets. Similar strategy may be also adapted for genetically encoded fluorescent sensors (e.g. calcium reporter34 and zinc sensor38), by co-expressing various active and/or inactive variants of these sensors in vivo. Finally, the strategies presented here are likely to inspire many biotechnological innovations in all fields relying on biorecognition. For example, similar approaches could be employed to implement highly optimized input-output response in binding-activated biomaterials, nanomachines, drug-release devices, or synthetic biology systems.
Supplementary Material
Acknowledgments
The authors acknowledge members of our research group for helpful discussions on the manuscript. This work was supported by the NIH through grant R01EB007689. AVB is a Fonds de Recherche du Québec Nature et Technologies (FRQNT) Fellow. FR is thankful to the Italian Ministry of University and Research (MIUR) through the project FIRB “Futuro in Ricerca”.
Footnotes
SUPPORTING INFORMATION AVAILABLE
Supporting table, methods, figures and complete ref. 20. This material is available free of charge at http://pubs.acs.org.
References
- 1.Engvall E, Perlman P. Immunochemistry. 1971;8:871–874. doi: 10.1016/0019-2791(71)90454-x. [DOI] [PubMed] [Google Scholar]
- 2.Renart J, Reiser J, Stark GR. Proc Natl Acad Sci U S A. 1979;76:3116–20. doi: 10.1073/pnas.76.7.3116. [DOI] [PMC free article] [PubMed] [Google Scholar]
- 3.Tyagi S, Kramer FR. Nat Biotechnol. 1996;14:303–8. doi: 10.1038/nbt0396-303. [DOI] [PubMed] [Google Scholar]
- 4.Koshland DE, Jr, Goldbeter A, Stock JB. Science. 1982;217:220–5. doi: 10.1126/science.7089556. [DOI] [PubMed] [Google Scholar]
- 5.Ferrell JE., Jr Trends Biochem Sci. 1996;21:460–6. doi: 10.1016/s0968-0004(96)20026-x. [DOI] [PubMed] [Google Scholar]
- 6.Carpenter CC, Fischl MA, Hammer SM, Hirsch MS, Jacobsen DM, Katzenstein DA, Montaner JS, Richman DD, Saag MS, Schooley RT, Thompson MA, Vella S, Yeni PG, Volberding PA. JAMA. 1997;277:1962–9. [PubMed] [Google Scholar]
- 7.Goodman LS, Gilman A, Hardman JG, Gilman AG, Limbird LE. Goodman & Gilman’s the pharmacological basis of therapeutics. 9. McGraw-Hill, Health Professions Division; New York: 1996. [Google Scholar]
- 8.Bhattacharya S, Bunick CG, Chazin WJ. Biochim Biophys Acta. 2004;1742:69–79. doi: 10.1016/j.bbamcr.2004.09.002. [DOI] [PubMed] [Google Scholar]
- 9.Buchler NE, Louis M. J Mol Biol. 2008;384:1106–19. doi: 10.1016/j.jmb.2008.09.079. [DOI] [PubMed] [Google Scholar]
- 10.Young MW, Kay SA. Nat Rev Genet. 2001;2:702–15. doi: 10.1038/35088576. [DOI] [PubMed] [Google Scholar]
- 11.Linse S, Helmersson A, Forsen S. J Biol Chem. 1991;266:8050–4. [PubMed] [Google Scholar]
- 12.Marvin JS, Corcoran EE, Hattangadi NA, Zhang JV, Gere SA, Hellinga HW. Proc Natl Acad Sci U S A. 1997;94:4366–71. doi: 10.1073/pnas.94.9.4366. [DOI] [PMC free article] [PubMed] [Google Scholar]
- 13.Yamazaki T, Kojima K, Sode K. Anal Chem. 2000;72:4689–93. doi: 10.1021/ac000151k. [DOI] [PubMed] [Google Scholar]
- 14.Drabovich AP, Okhonin V, Berezovski M, Krylov SN. J Am Chem Soc. 2007;129:7260–1. doi: 10.1021/ja072269p. [DOI] [PubMed] [Google Scholar]
- 15.Andersson O, Nikkinen H, Kanmert D, Enander K. Biosens Bioelectron. 2009;24:2458–64. doi: 10.1016/j.bios.2008.12.030. [DOI] [PubMed] [Google Scholar]
- 16.Wang J. Chem Rev. 2008;108:814–25. doi: 10.1021/cr068123a. [DOI] [PubMed] [Google Scholar]
- 17.Wang Z, Lee JH, Lu Y. Adv Mater. 2008;20:3263–3267. [Google Scholar]
- 18.Marvin JS, Hellinga HW. Nat Struct Biol. 2001;8:795–8. doi: 10.1038/nsb0901-795. [DOI] [PubMed] [Google Scholar]
- 19.Vallee-Belisle A, Ricci F, Plaxco KW. Proc Natl Acad Sci U S A. 2009;106:13802–7. doi: 10.1073/pnas.0904005106. [DOI] [PMC free article] [PubMed] [Google Scholar]
- 20.Dunker AK, et al. J Mol Graph Model. 2001;19:26–59. doi: 10.1016/s1093-3263(00)00138-8. [DOI] [PubMed] [Google Scholar]
- 21.Vallée-Bélisle A, Plaxco KW. Curr Opin Struct Biol. 2010;20:518–526. doi: 10.1016/j.sbi.2010.05.001. [DOI] [PMC free article] [PubMed] [Google Scholar]
- 22.Ricci F, Vallee-Belisle A, Plaxco KW. PLoS Comput Biol. 2011;7:e1002171. doi: 10.1371/journal.pcbi.1002171. [DOI] [PMC free article] [PubMed] [Google Scholar]
- 23.Hamaguchi N, Ellington A, Stanton M. Anal Biochem. 2001;294:126–31. doi: 10.1006/abio.2001.5169. [DOI] [PubMed] [Google Scholar]
- 24.Lau PS, Coombes BK, Li Y. Angew Chem Int Ed Engl. 2010;49:7938–42. doi: 10.1002/anie.201002621. [DOI] [PubMed] [Google Scholar]
- 25.Sefah K, Phillips JA, Xiong X, Meng L, Van Simaeys D, Chen H, Martin J, Tan W. Analyst. 2009;134:1765–75. doi: 10.1039/b905609m. [DOI] [PubMed] [Google Scholar]
- 26.Liu J, Lu Y. J Am Chem Soc. 2003;125:6642–3. doi: 10.1021/ja034775u. [DOI] [PubMed] [Google Scholar]
- 27.Chen X, Ellington AD. PLoS Comput Biol. 2009;5:e1000620. doi: 10.1371/journal.pcbi.1000620. [DOI] [PMC free article] [PubMed] [Google Scholar]
- 28.Xiang Y, Tong A, Lu Y. J Am Chem Soc. 2009;131:15352–7. doi: 10.1021/ja905854a. [DOI] [PMC free article] [PubMed] [Google Scholar]
- 29.Beisel CL, Smolke CD. PLoS Comput Biol. 2009;5:e1000363. doi: 10.1371/journal.pcbi.1000363. [DOI] [PMC free article] [PubMed] [Google Scholar]
- 30.Golynskiy MV, Koay MS, Vinkenborg JL, Merkx M. Chembiochem. 2011;12:353–61. doi: 10.1002/cbic.201000642. [DOI] [PubMed] [Google Scholar]
- 31.Guntas G, Mansell TJ, Kim JR, Ostermeier M. Proc Natl Acad Sci U S A. 2005;102:11224–9. doi: 10.1073/pnas.0502673102. [DOI] [PMC free article] [PubMed] [Google Scholar]
- 32.Stratton MM, Mitrea DM, Loh SN. ACS Chem Biol. 2008;3:723–32. doi: 10.1021/cb800177f. [DOI] [PMC free article] [PubMed] [Google Scholar]
- 33.Strickland D, Yao X, Gawlak G, Rosen MK, Gardner KH, Sosnick TR. Nat Methods. 2010;7:623–6. doi: 10.1038/nmeth.1473. [DOI] [PMC free article] [PubMed] [Google Scholar]
- 34.Palmer AE, Giacomello M, Kortemme T, Hires SA, Lev-Ram V, Baker D, Tsien RY. Chem Biol. 2006;13:521–30. doi: 10.1016/j.chembiol.2006.03.007. [DOI] [PubMed] [Google Scholar]
- 35.Kohn JE, Plaxco KW. Proc Natl Acad Sci U S A. 2005;102:10841–5. doi: 10.1073/pnas.0503055102. [DOI] [PMC free article] [PubMed] [Google Scholar]
- 36.Mizoue LS, Chazin WJ. Curr Opin Struct Biol. 2002;12:459–63. doi: 10.1016/s0959-440x(02)00348-2. [DOI] [PubMed] [Google Scholar]
- 37.Mhlanga MM, Tyagi S. Nat Protoc. 2006;1:1392–8. doi: 10.1038/nprot.2006.242. [DOI] [PubMed] [Google Scholar]
- 38.Vinkenborg JL, Nicolson TJ, Bellomo EA, Koay MS, Rutter GA, Merkx M. Nat Methods. 2009;6:737–40. doi: 10.1038/nmeth.1368. [DOI] [PMC free article] [PubMed] [Google Scholar]
Associated Data
This section collects any data citations, data availability statements, or supplementary materials included in this article.


