

Abstract
Members of the NR1I subfamily of nuclear receptors play a role in the transcriptional activation of genes involved in drug metabolism and transport. NR1I3, the constitutive androstane receptor (CAR), mediates the induction of several genes involved in drug response, including members of the CYP3A, CYP2B and UGT1A subfamilies. Large inter-individual variation in drug clearance has been reported for many drug metabolising enzyme genes. Sequence variation at the CAR locus could potentially contribute to variation in downstream targets, as well as to the substantial variation in expression level reported. We used a comparative genomics-based approach to select resequencing segments in 70 subjects from three populations. We identified 21 polymorphic sites, one of which results in an amino acid substitution. Our study reveals a common haplotype shared by all three populations which is remarkably similar to the ancestral sequence, confirming that CAR is under strong functional constraints. The level and pattern of sequence variation is approximately similar across populations, suggesting that interethnic differences in drug metabolism are not likely to be due to genetic variation at the CAR locus. We also identify several common non-coding variants that occur at highly conserved sites across four major branches of the mammalian phylogeny, suggesting that they may affect CAR expression and, ultimately, the activity of its downstream targets.
Keywords: pharmacogenetics, nuclear receptors, haplotype structure, sequence variation
Introduction
The constitutive androstane receptor (CAR, NR1I3) belongs to the NR1I subfamily of nuclear receptors (NRs), members of which play a role in transcriptional activation of genes involved in drug metabolism and transport. Other members of the NR1I subfamily include the pregnane X receptor (PXR, NR1I2) and the vitamin D receptor (VDR, NR1I1). CAR is expressed in the liver and intestine and, through heterodimerisation with the retinoic acid receptor (RXR), mediates the induction of important drug metabolising enzyme (DME) genes such as CYP3A4, CYP2B6 and UGT1A1,[1] as well as drug transport genes including multidrug resistance-associated protein 2 (MRP2) [2]. In addition, CAR enhances the metabolic clearance of endogenous bile acids and bilirubin, protecting against toxicity,[3,4] and has recently been implicated in thyroid hormone regulation [5].
By contrast with PXR, which is found in a variety of species including fish -- and is able to bind a diverse variety of exogenous and endogenous ligands, including bile salts,[6] CAR has only been identified in mammals and is activated by a much smaller set of ligands [7]. Interestingly, only one xenosensor gene has been identified in non-mammalian species, such as chicken [8] and pufferfish [9]. The protein sequences of the chicken and pufferfish xenosensor genes are roughly equally related to those of mammalian PXR and CAR sequences [10]. Handschin et al. used several experimental approaches to confirm that the chicken has only one xenosensor gene, CXR, but were unable to identify additional genes, suggesting that CXR represents the ancestral gene that diverged into CAR and PXR in response to different environmental and nutritional factors [10].
CAR genes have been sequenced from a total of eight mammals, including the partial sequences of cow and dog analysed in this study. CAR has the typical nuclear hormone receptor organisation of an amino-terminal DNA binding domain (DBD) and a carboxy-terminal ligand binding domain (LBD); however, in comparing CAR sequences among mammals, a striking feature is high cross-species sequence divergence in the LBD [11,12]. The LBD of CAR shares amino acid identities of only 74-79 per cent between human and rodent sequences, which are unusually low when compared with other NRs [11,12].
The variation in the LBD of CAR is more striking when DNA sequences are analysed, in particular by comparing the rate of non-synonymous (resulting in an amino acid change) and synonymous (not resulting in an amino acid change) nucleotide substitution rates. The rates of non-synonymous substitution normalised to the synonymous substitution rate, dN/dS (ω), for CAR and PXR are 5.6 and 4.0 times higher than the average for other NR genes, respectively [12]. The elevated ω ratios of the CAR and PXR LBDs suggest adaptive evolution [13] and may be explained in part by the biological role played by CAR and PXR in the metabolism of different xenobiotic and environmental substances,[11,12] although the nature of such ligands is currently unknown. Relaxation of functional constraints may also explain the elevated ω values at CAR and PXR, but this seems less plausible, given their critical role in activating enzyme genes involved in the metabolism of important endogenous and exogenous compounds.
The role of NRs (especially PXR and CAR) in the regulation of genes involved in drug metabolism is of particular importance to clinical pharmacology. Substantial interindividual variation in mRNA expression level has been reported for CAR [14,15]. The hepatic enzyme CYP3A4 -- which is believed to play a significant role in adult drug metabolism -- exhibits wide variation in gene expression and activity, only partially explained by known genetic variants [16]. For CYP2B6, which is also regulated by CAR, large interindividual variabilities in mRNA level and activity have been reported [17,18]. Strong positive correlations in mRNA levels have been observed between CAR and CYP3A4,[19] as well as CAR and CYP2B6,[14,15] suggesting that the interindividual variability observed for some DME genes could be associated with variability in upstream regulators such as CAR. A better understanding of sequence variation in regulatory genes such as CAR, PXR or RXR, could conceivably explain increased or decreased expression and/or activity profiles of DME genes.
We characterised patterns of genetic variation in three ethnically diverse human population samples through a resequencing survey of CAR coding regions and conserved non-coding sequences (CNSs). Our study reveals a common haplotype shared by all three populations which is strikingly similar to the ancestral sequence, confirming that CAR is under strong functional constraints. In addition, the level and pattern of sequence variation is approximately similar across populations, suggesting that interethnic differences in drug response are not due to genetic variation in CAR. We also identify several common non-coding variants that occur at highly conserved sites across four major branches of the mammalian phylogeny, suggesting that they may affect CAR expression and, in turn, the activity of its downstream targets.
Methods
Re-sequencing survey design
Human primer sequences were designed based on the reverse complement of Genbank accession number AL509714. CAR human genomic sequence (AL509714) was aligned with orthologous chimpanzee (AADA01309121), dog (AAEX01049487 and AAEX01049488), cow (Scaffold 30573, 10th December, 2004), rat (AB105071) and mouse (AC084821) sequences using PipMaker [20]. All exons were included in the resequencing survey, along with intronic CNSs. The human genomic sequence was analysed using Cluster Buster [21] in order to predict clusters of the following liver-enriched transcription factors: HNF1α, HNF4, PXR/CAR, OCT-1, PPAR/RXR, CEBP, HNF3β, HNF4/COUP-TF. One region predicted by Cluster Buster with a high probability falls approximately 11 kilobases (kb) upstream of CAR and was included in the survey.
Population samples
Human population samples included 24 European individuals from the Centre d'Etude du Polymorphisme Humain families, 23 individuals from the Human Variation Panel of African Americans and 23 individuals from the Human Variation Panel of the Han People of Los Angeles. All DNA samples were obtained from the Coriell Cell Repository. Sample information can be found in PharmGKB (http://www.pgkb.org), as well as at the Di Rienzo laboratory website (http://genapps.uchicago.edu/labweb/programss.html). One Western chimpanzee (Pan troglodytes verus) was sequenced for use as an outgroup.
This study was carried out in accordance with the Declaration of Helsinki (2000) of the World Medical Association and was approved by the Institutional Review Board of the University of Chicago.
Polymerase chain reaction (PCR) amplification and sequencing
Primer sequences and conditions are available in PharmGKB and at the Di Rienzo laboratory website. PCR and sequencing were performed as described elsewhere [22]. The same primers were used to amplify the human and chimpanzee samples.
Data analysis
Summary statistics of DNA sequence variation were calculated using SLIDER. Haplotypes were inferred using PHASE2 [23,24] in each population sample separately. FST, a measure of allele frequency variation among samples, was calculated between all pairwise combinations of populations for each polymorphic site [25]. Individual transcription factor binding sites were predicted using the liver-specific profiles available with Match 1.0 [26]. Sorting Intolerant From Tolerant (SIFT) [27], version 2 was used to predict the consequence of the single amino acid substitution. Given an amino acid sequence, SIFT searches for and performs alignments of similar sequences, then calculates the probabilities for amino acid changes affecting protein function based on cross-species conservation at each position. ESEfinder was used to predict the locations of exon splice enhancers [28]. Human sequence comprising the entire resequenced region was aligned to the genomic sequences from the five mammalian species listed above using Multi-Lagan [29].
Phylogenetic analysis by maximum likelihood
Sequences were aligned with Clustal X. Estimation of ω ratios was carried out by maximum likelihood using a codon-based substitution model in Phylogenetic Analysis by Maximum Likelihood (PAML) version 3.13 [30]. The input to PAML is a treefile of the phylogeny of the sequences to be studied and a file with aligned sequences. The phylogeny is based on the known phylogenetic relationships between the species to be studied, determined by a consensus of morphological and molecular data.
PAML can determine estimates of ω for models of varying complexity. The most commonly applied models are as follows (the PAML model numbers are shown in parentheses; 'sites' refers to codons):[31,32] model M0 (null model with a single ω ratio among all sites); M3 ('discrete' model, with two or more categories of sites with the ω ratio free to vary for each site); M7 ('beta model', ten categories of sites with ten ω ratios in the range 0-1 taken from a discrete approximation of the beta distribution); and M8 ('beta plus ω model, ten categories of sites from a beta distribution as in M7 plus an additional category of sites with a ω ratio that is free to vary from 0 to greater than 1). PAML estimates the ω ratios that are allowed to vary in these models, as well as the proportion of sites (codons) with each ratio.
Of the PAML models listed above, only M3 and M8 can detect positive selection (ie ω > 1). Each PAML model generates a log-likelihood, indicating how well the models fit the input data. Some PAML models are 'nested' within each other (eg M0 within M3, M7 within M8). In those cases, twice the log-likelihood difference between the two models is compared with a χ2 distribution with degrees of freedom equal to the difference in degrees of freedom between the two models; p values for sites potentially under positive selection are obtained using a Bayesian approach in PAML [33]. The accuracy and power of PAML models increases with more sequences and longer-length sequences [34]. Simpler PAML models are preferred unless a more complex model fits the observed data significantly better.
Analysis was performed on programslicly available coding sequences, either from cDNA sequences or predicted from genomic DNA sequences. Four other genes in the NR1 family of NRs were chosen for comparison with CAR: the gene encoding thyroid receptor-α (TRα), the gene encoding farnesoid X receptor (FXR), VDR and PXR. These genes all have sequence data for four or more mammalian species. VDR and PXR are the genes most closely related to CAR; these three genes are classified in the NR1I subfamily. Separate PAML analyses were performed on datasets of full-length sequence and restricted to either DBD or LBD, the two major domains of NRs. Information regarding all sequences used for PAML analysis can be found in Supplementary Table 1 (Table 5).
Supplementary Table 1.
Sequences used in Phylogenetic Analysis by Maximum Likelihood analysis.
| Gene | Domain | Species | Accessiona |
|---|---|---|---|
| CAR | Full-length | Human | NM_005122 |
| Rhesus | AY116212 | ||
| Mouse | NM_009803 | ||
| Rat | NM_022941 | ||
| Fur Seal | AB109554 | ||
| Baikal seal | AB109553 | ||
| LBD only | Dog | AAEX01049487 and AAEX01049488 | |
| DBD only | Cow | 30573, December 10, 2004 | |
| PXR | Full-length | Human | NM_003889 |
| Chimpanzee | Nov. 2003 chimpanzee Arachne assembly, NCBI Build 1 version 1, UCSC: panTro1 | ||
| Rhesus | AF454671 | ||
| Rabbit | AF188476 | ||
| Mouse | AF031814 | ||
| Rat | AF151377 | ||
| LBD only | Dog | AF454670 | |
| Pig | AF454672 | ||
| VDR | Full-length | Human | NM_000376 |
| Cotton-top tamarin | AF354232 | ||
| Mouse | NM_009504 | ||
| Rat | NM_017058 | ||
| DBD only | Chimpanzee | Nov. 2003 chimpanzee Arachne assembly, NCBI Build 1 version 1, UCSC: panTro1 | |
| TRα | Full-length | Human | NM_003250 |
| Sheep | Z68308 | ||
| Pig | AJ005797 | ||
| Rat | M18028 | ||
| Mouse | NM_178060 | ||
| DBD only | Chimpanzee | Nov. 2003 chimpanzee Arachne assembly, NCBI Build 1 version 1, UCSC: panTro1 | |
| FXR | Full-length | Human | NM_005123 |
| Chimp | Nov. 2003 chimpanzee Arachne assembly, NCBI Build 1 version 1, UCSC: panTro1 | ||
| Rabbit | AF497630 | ||
| Golder hamster | AF478441 | ||
| Mouse | NM_009108 | ||
| Rat | NM_021745 |
a All accession number refer to Genbank sequences unless otherwise specified.
Abbreviations: CAR, constitutive androstane receptor: PXR, pregnane X receptor; VDR, vitamin D receptor; TRα, thyroid receptor-α, FXR, farnesoid X receptor; DBD, DNA binding domain; LBD, ligand binding domain; NCBI, The National Center for Biotechnology Information; UCSC, The University of California Santa Cruz.
Results
Survey design and summary statistics
The design of the resequencing survey was based in part on cross-species sequence conservation, as shown in Figure 1. The total evolutionary time spanned by the six mammalian species represented in the alignment is greater than 370 million years [35]. Thus, elements showing a high degree of sequence similarity across this set of species are more likely to be due to active conservation resulting from functional constraints (eg regulation of CAR expression) rather than limited divergence time. The predicted gene located downstream of the CAR locus (FLJ12770; Genbank accession NM_032174) is likely to account for some of the increased sequence identity flanking CAR exon 9 (Figure 1). BLASTing the mRNA sequences of the two genes against one another indicates that the 3' ends of the oppositely transcribed genes do in fact overlap, although the coding regions do not. We also used predictions of clusters of liver entyme enriched transcription factor binding sites to guide our selection of genomic segments for resequencing. One cluster was predicted with high probability approximately 11.4 kb upstream of the CAR transcription start site; a 364 base pair (bp) segment encompassing this region was included in our survey. A total of 4.1 kb were surveyed in each of three human population samples (African Americans, European Americans and the Han People of Los Angeles), including 1,051 bp of coding sequence and 3,053 bp of CNS. The same segments were sequenced in one chimpanzee, revealing that human-chimpanzee divergence at CAR is relatively low (0.76 per cent) compared with the genome-wide average of 1.24 per cent [36].
Figure 1.
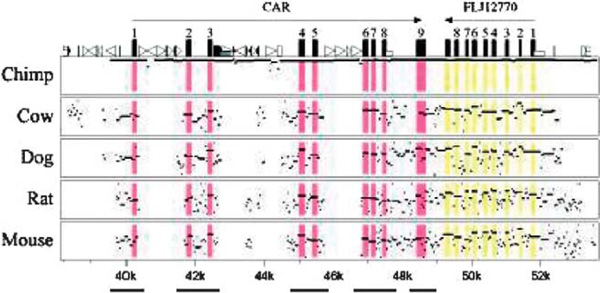
MultiPipMaker plot illustrating sequence conservation at the CAR locus. The vertical axis ranges between 50 per cent and 100 per cent sequence identity; areas within the plot shaded in pink correspond to the exons of CAR and those shaded in yellow correspond to exons of the predicted protein FLJ12770. Bars along the bottom indicate the segments included in the resequencing survey. Numbers across the bottom indicate the position relative to the reverse-complemented reference sequence (AL50974).
Summary statistics of sequence variation at the CAR locus are shown in Table 1. Levels of polymorphism are summarised by nucleotide diversity (π) -- based on the mean number of pairwise differences between samples -- and θW, based on the number of polymorphic sites and sample size [39]. The frequency spectrum of polymorphic sites at a given locus is captured by the Tajima's D statistic [40]. An excess of rare variants is indicated by a negative Tajima's D value, while a positive value signals an excess of intermediate frequency variants. The Tajima's D values observed for the non-African populations are not significantly different from zero and indicate that the spectrum of allele frequencies in these populations is consistent with the neutral-equilibrium expectation. The more negative Tajima's D value observed in the African-American sample may be reflective of recent population growth or admixture between African and European populations [41].
Table 1.
Summary statistics of sequence variation at the CAR locus.
| Sample | Sa | πb | θwc | TDd | θw/dive |
|---|---|---|---|---|---|
| African Americans | 16 | 0.50 (13) | 0.89 (33) | -1.37 (6) | 11.7 (57) |
| Europeans | 12 | 0.55 (41) | 0.66 (9.5) | -0.48 (23) | 8.7 (78) |
| Han | 6 | 0.42 | 0.33 | 0.72 |
a Number of segregating sites.
b Nucleotide diversity per base pair (× 10-3). Numbers in parentheses indicate the percentile rank of π relative to the distribution of π values in the Seattle SNP genes.
cWatterson's estimator of the population mutation rate parameter θ (= 4Nμ) per bp (× 10-3) [37].
d Tajima's D (TD) [38]. Numbers in parenthesis indicate the percentile rank of the TD value relative to the distribution of TD values in the Seattle SNP genes.
e Ratio of θW to the amount of sequence divergence between human and chimpanzee (per cent). Numbers in parenthesis indicate the percentile rank of the θW:div value relative to the distribution of θW:div values in the Seattle SNP genes.
Many standard neutrality tests are based on the assumption of populations at equilibrium. Most human populations, however, do not fit these assumptions, making a comparison of our results with an empirical distribution a more appropriate measure of deviations from neutrality. To this end, we compared our results with the resequencing data of the UW-FHCRC Variation Discovery Resource (Seattle SNP). The European and African-American samples from the Seattle SNP dataset are the same as those used in our study, resulting in a direct comparison; however, no Asian data are available from this project. Our results for nucleotide diversity (π and θW), Tajima's D, and θW normalised by human-chimpanzee divergence (to account for differences in the neutral mutation rate across loci) were all compared with the distribution of these values from 159 genes in the Seattle SNP dataset -- the results are shown in Table 1. Although the Tajima's D value in the African-American sample is at the low end of the distribution, most of the CAR statistics are well within the range observed in the larger dataset, suggesting that it evolved largely according to neutral expectations.
Coding and non-coding sequence variation
We identified a total of 21 polymorphic sites, including one singleton 24 bp indel. It is interesting that six out of 21 (29 per cent) single nucleotide polymorphisms (SNPs) occur within 374 bp in intron 2, and that five of the six disrupt predicted transcription factor binding sites (Table 2). Of the 21 SNPs, 17 fell into non-coding sequence and four into coding, of which three were synonymous changes and one was non-synonymous. The non-synonymous SNP, Arg97Trp, is located in the ~20 amino acids comprising the linker region between the DBD and LBD and results in an intolerant change, as predicted by SIFT [27]. The Arg97Trp SNP has a SIFT score of 0.00, although, since the amino acid alignment could contain only mammalian sequences, there was insufficient power to assign a quality score based on evolutionary conservation. A predicted exon splice enhancer is also disrupted by the nonsynonymous SNP [28] (data not shown).
Table 2.
Genomic features of polymorphic positions at the CAR locus.
| Positiona | Location | Nucleotide presentb | Derived allele frequency | Possible consequencesc | |||||||
|---|---|---|---|---|---|---|---|---|---|---|---|
| Human | Chimp | Cow | Dog | Rat | Mouse | AA | Han | EU | |||
| 28187 | 5' sequence | G/A | G | n/a | n/a | n/a | n/a | 0.02 | 0 | 0 | Disrupts NF-1 site |
| 41893 | Intron 2 | A/G | A | A | G | A | A | 0 | 0 | 0.02 | |
| 42202 | Intron 2 | G/C | G | G | G | - | - | 0.04 | 0 | 0 | Disrupts HNF-1 site |
| 42218 | Intron 2 | T/C | T | T | T | C | C | 0.07 | 0 | 0 | Disrupts NF-1 site |
| 42221 | Intron 2 | C/T | C | C | C | C | C | 0 | 0 | 0.02 | Disrupts NF-1 site |
| 42225 | Intron 2 | C/A | C | C | C | C | C | 0.07 | 0.18 | 0.21 | Disrupts NF-1 site |
| 42267 | Intron 2 | C/T | C | C | C | A | A | 0.04 | 0 | 0 | Disrupts C/EBP, USF sites |
| 44896 | Intron 3 | C/T | C | C | C | C | C | 0.29 | 0.47 | 0.31 | |
| 45014 | Exon 4 | C/G | C | C | C | C | C | 0.02 | 0 | 0 | |
| 45045 | Exon 4 | C/T | C | C | C | C | C | 0.02 | 0 | 0 | Radical NS change; Disrupts predicted ESE |
| 45518 | Exon 5 | C/T | C | C | C | C | G | 0.16 | 0.45 | 0.42 | |
| 45567 | Intron 5 | A/G | A | A | G | C | G | 0.05 | 0 | 0.02 | Disrupts HNF-1 site |
| 47331 | Intron 7 | G/- | G | G | - | - | - | 0.02 | 0 | 0 | |
| 47537 | Intron 8 | A/C | A | G | G | C | C | 0.05 | 0.15 | 0.21 | Disrupts NF-1 site |
| 47636 | Intron 8 | T/G | T | T | T | T | T | 0.26 | 0.09 | 0.23 | |
| 48318 | Intron 8 | T/C | T | n/a | - | C | T | 0.02 | 0 | 0.02 | |
| 48342 | Intron 8 | G/A | G | n/a | C | G | G | 0.04 | 0 | 0 | |
| 48419 | Exon 9 | G/A | G | n/a | G | A | A | 0 | 0 | 0.02 | |
| 48621 | 3' sequence | G/A | G | C | T | C | C | 0 | 0 | 0.02 | |
| 48692 | 3' sequence | A/T | A | A | T | G | G | 0.02 | 0 | 0.02 | |
| 48734 | 3' sequence | A/T | A | A | A | A | A | 0 | 0.02 | 0 | |
a Positions are based on the reverse complement of AL50974.
b Nucleotides in bold are identical to that observed in chimpanzee. 'n/a' denotes missing data, while '-' indicates that the position is absent relative to human.
c Transcription factor binding site predictions are based on output from Match; exon splice enhancer (ESE) predictions are based on predictions from ESEfinder (see Methods).
Abbreviations: C/EBP, CCAAT enhancer binding protein; HNF, hepatocyte nuclear factor; NF, nuclear factor; USF, upsteam stumulatory factor.
The ancestral allele at each polymorphic site was inferred by comparison to the chimpanzee sequence. Complete conservation of the ancestral allele across the three non-primate lineages included in our study (carnivore, artiodactyl and rodent) was observed for eight of the 21 SNPs (excluding sites where the position was missing in any lineage) (Table 2). The ancestral haplotype is observed at high frequency in the African-American sample and is present in the Asian sample. Five SNPs have a combined allele frequency of 10 per cent or higher across all populations, while the remaining 16 are rare. Four of the five common SNPs fall in positions that are conserved across all three non-primate lineages.
If a gene is evolving neutrally, the ratio of within-species polymorphism to between-species divergence is expected to be similar across functional classes of sites -- for example, synonymous and non-synonymous sites; deviation from this expectation can be detected using the McDonald-Kreitman (MK) test [42]. Any two distinct classes of sites can be assessed in this format, where skews in the ratio of levels of polymorphism and divergence are informative about the type of selection acting on the locus. The MK test applied to synonymous and non-synonymous sites was not significant. Next, we applied the test to entire surveyed segments, including coding and non-coding regions, by partitioning the sites into two classes defined by cross-species conservation. In this context, sequence conservation is taken as a measure of the probability of a site being functionally important. Sites were classified as conserved only if the ancestral allele was conserved across the three non-primate lineages; all other site configurations were considered non-conserved. For the classification of fixed differences, the human-chimpanzee alignment was used to locate all divergent sites; these were called either conserved or non-conserved, based on the same criteria as described for the polymorphic sites. We constructed a 2 × 2 table with all polymorphic sites and observed no significant deviations from neutral expectation. Because slightly deleterious polymorphic sites tend to be rare,[43] we repeated the test by partitioning the polymorphic sites based on their frequency. As shown in Table 3 a significant deviation was observed in the distribution of common polymorphisms (p = 0.02), suggesting different selective pressures on rare versus common amino acid variants.
Table 3.
McDonald-Kreitman test comparing levels of human polymorphism and divergence between human and chimpanzee at conserved versus non-conserved sites across distantly related mammals.
| Non-conserveda | Conserved | |
|---|---|---|
| Rare polymorphic sites | ||
| Fixed | 19 | 5 |
| Polymorphicb | 11 | 4 |
| Common polymorphic sites | ||
| Fixed | 19 | 5 |
| Polymorphic | 1 | 4 |
a If the allele in chimpanzee (ancestral) was identical to that found in the same position in rodent, artiodactyl and carnivore, the site was considered conserved across three lineages.
b The singleton indel was not included in this analysis.
Haplotype structure and interpopulation differentiation
The inferred haplotypes shown in Figure 2 reveal a number of common haplotypes, but no defined structure overall at this locus. One haplotype, which is only one step away from the ancestral, is the most commonly observed among non-African samples and occurs at high frequency in the African-American population. In all population samples, the vast majority of haplotypes (> 90 per cent) contain two or fewer changes from the ancestral. The strong constraint, as well as similar nucleotide diversity levels and haplotype structure across populations, suggests that the forces shaping diversity at this locus are not population specific.
Figure 2.
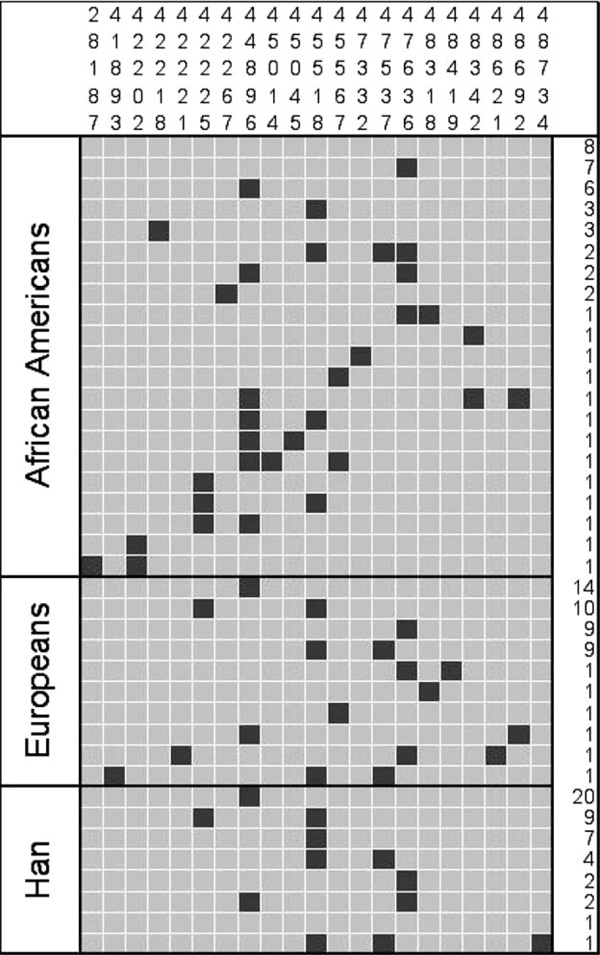
Inferred haplotypes at CAR. The chimpanzee sequence was used to infer the ancestral allele at each site, denoted with a grey box; derived alleles are indicated by black. The numbers on the right indicate the number of haplotypes in each population. Numbers across the top indicate the position of each polymorphic site relative to the reverse complemented reference sequence (AL50974).
For Rare polymorphic sites, Fisher's exact test (FET) p = 0.71; for common polymorphic sites, FET p = 0.02; For rare polymorphic sites, polymorphisms identified in the resequencing survey were classified as either rare (minor allele frequency < 10 per cent in the combined sample) or common (minor allele frequency ≥ 10 per cent in the combined sample).
The FST statistic, which measures variation in allele frequency between populations, is useful for quantifying interpopulation differentiation [44]. We estimated FST per site between pairs of population samples. At the CAR locus, only one SNP identified in this study has an FST value greater than the 0.123 average estimated by Akey et al.[45] in a study of 26,530 SNPs in three population samples. The 20 remaining SNPs fall well below the average, with 18/20 (90 per cent) having FST values of 0.05 or less. These data confirm that this locus is not characterised by a high degree of interpopulation differentiation.
Phylogenetic analysis by maximum likelihood of CAR genes
Previous phylogenetic investigations of CAR genes have only looked at two-sequence comparisons in calculating ω ratios [12,46]. We performed phylogenetic analysis on amino acid sequences of several NRs in order to detect deviations in the rate of amino acid substitutions using PAML. Table 4 shows the results of PAML analysis of sequence data for CAR and four other genes in the NR1 family which have complete sequence data for four or more mammals: TRα, NR1A1; FXR, NR1H4; VDR, NR1I1; and PXR, NR1I2. A total of three analyses were performed for each gene: full-length sequence, DBD only and LBD only.
Table 4.
Phylogenetic analysis by maximum likelihood (PAML) models from analysis of sequence data from the CAR, PXR, VDR, FXR and TRα genes (values in parentheses indicate percentage of codons falling in a particular ω category).
| PAML model | |
|---|---|
| CAR (NR1I3) | |
| Full sequence | M3, ω = 0.03 (51%), 0.47 (49%) |
| DBD only | M0, ω = 0.1598 |
| LBD only | M3, ω = 0.06 (68%), 0.72 (32%) |
| VDR (NR1I1) | |
| Full sequence | M3, ω = 0.00001 (77%), 0.333 (23%) |
| DBD only | M0, ω = 0.0085 |
| LBD only | M3, ω = 0.00001 (67%), 0.32 (33%) |
| PXR (NR1I2) | |
| Full sequence | M3, ω = 0.049 (79%), 0.666 (21%) |
| DBD only | M0, ω = 0.0441 |
| LBD only | M3, ω = 0.01 (51%), 0.26 (42%), 1.23 (7%) |
| TRα (NR1I2) | |
| Full sequence | M0, ω = 0.02 |
| DBD only | M0, ω = 0.0001 |
| LBD only | M0, ω = 0.01 |
| FXR (NR1H4) | |
| Full sequence | M3, ω = 0.00001 (72%), 0.22 (28%) |
| DBD only | M0, ω = 0.0137 |
| LBD only | M3, ω = 0.00001 (83%), 0.295 (17%) |
Abbreviations: CAR, constitutive androstane receptor; PXR, pregnane X receptor;
VDR, vitamin D receptor; FXR, farnesoid X receptor; TRα, thyroid receptor-α; DBD,
DNA binding domain; LBD, ligand binding domain.
The analyses for the full-length sequence, DBD and LBD for the TRα, FXR and VDR genes show low ω ratios, consistent with strong purifying (negative) selection as the dominant evolutionary force for these genes. The CAR and PXR analyses, for the full-length sequence and LBD show a minority of codons (sites) with ω ratios approaching one or, in the case of PXR, exceeding one, however (results in bold in Table 4). By contrast, the ω ratios for the DBD are low for CAR and PXR. These results illustrate that CAR genes have an elevated ω ratio across the mammalian species for which CAR sequence data are available, compared with other NR genes. In this regard, CAR is similar to PXR, a closely related NR that also responds to diverse exogenous and endogenous ligands.
Discussion
Our survey of sequence variation at the CAR locus in three ethnically diverse human populations identified a number of polymorphic sites which are likely to affect function, including four common polymorphisms at highly conserved sites across distantly related mammalian species and one amino acid substitution. Most of the SNPs identified are rare and population specific, while the intermediate frequency SNPs tend to be shared by all three populations at similar frequencies.
These results suggest that CAR evolved under strong functional constraints and that interethnic variability in drug response is not likely to result from genetic variation at this locus. As an upstream regulator of many genes involved in drug metabolism and detoxification, as well as a regulator of bilirubin and thyroid hormone metabolism, CAR may be more likely to be strongly constrained and may not be as subject to interpopulation differences. The role of CAR in bile acid homeostasis -- a mechanism unlikely to change across populations -- as well as its obligate heterodimerisation with RXR, corroborate the idea that this gene is under strong evolutionary constraint.
We observed only one non-synonymous variant in our survey of 70 individuals, suggesting that amino acid polymorphisms do not contribute to the substantial interindividual variability reported for CAR [14,15]. Alternative splice forms may underlie considerably more variation with regard to changes in expression pattern, expression level, protein binding and function. Many nuclear hormone receptors, including CAR,[47,48] have alternate splice forms, a mechanism which presumably offers greater complexity for this class of genes. No nucleotide variation was observed in any of the reported sequences spliced into alternate forms of CAR. Alternatively, variation in the expression level of CAR may be related to the collective effects of multiple rare polymorphisms; combinations of common and rare variation have recently been demonstrated to contribute to functional variation [49] and may play an important role in clinical drug response.
The results of a resequencing survey at PXR revealed similar findings with regard to human variation [50]. In this study, coding regions, as well as the 5' and 3' untranslated regions, the promoter and 50 bp of flanking intronic sequence, were surveyed in 170 chromosomes; only three non-synonymous SNPs were identified and two were found at low frequencies. None of the non-synonymous SNPs were located in the LBD. The diversity of the CAR and PXR LBDs between mammalian species, as evidenced by the PAML results, contrasts with the PXR and CAR resequencing studies showing very low nucleotide diversity in the CAR coding region. These results suggest that PXR and CAR may have critical roles in humans that do not vary across ethnic groups but that differ with regard to functions and/or ligands across species.
The disproportionately large number of polymorphisms located within 374 bp of intron 2 is striking and deserves further investigation. All of these SNPs fall in positions that are conserved across at least two non-primate lineages, suggesting a high level of conservation in this region overall. Estimates of diversification times of placental mammals suggest that rodents, carnivores and artiodactyls shared a common ancestor approximately 90 million years ago, leading to a total common ancestry spanning nearly 360 million years,[35] highlighting the potential importance of sequences conserved across four deep branches of the mammalian phylogeny and over such a length of evolutionary time. Five of the six SNPs disrupt predicted liver-enriched transcription factor binding sites. The results of this analysis suggest that intron 2 may contain regulatory elements conserved across several mammalian lineages.
We observe a skewed distribution of common polymorphisms relative to fixed substitutions between human and chimpanzee at sites highly conserved across distantly related mammals. This can be interpreted in several ways. One possibility is that we observe a deficit of polymorphism in non-conserved sequence, which might indicate increased evolutionary constraints in humans relative to the other mammals. Alternatively, the deviation may be due to an excess of fixed substitutions between human and chimpanzee at non-conserved sites. Perhaps a more likely explanation is that the observed deviation is due to an excess of common polymorphisms at conserved sites, suggesting that they are maintained at intermediate frequencies across populations. This implies a functional role for these SNPs. While these interpretations are highly speculative, they suggest that it may be interesting to investigate these common variants through functional assays and association studies.
Overall, our comparative genomics-based survey of sequence variation at the CAR locus reveals a history largely characterised by strong evolutionary constraints between species and across three population samples, with most FST values falling well below the genome-wide average. Interestingly, however, there is a suggestion in the phylogenetic and the population genetics analyses that a small portion of sites might have evolved adaptively. This, coupled with the finding of a relatively large number of polymorphic sites in a small conserved non-coding region in intron 2, provides further motivation for functional studies of CAR variation.
Appendix 1
Electronic database information
Coriell Cell Repositories, http://locus.umdnj.edu/ccr/
Di Rienzo Lab Web site, http://genapps.uchicago.edu/labweb/pubs.html (for primer sequences, population sample information, and data)
GenBank, http://www.ncbi.nlm.nih.gov/Genbank/ (for CAR [accession number AL509714])
MATCH 1.0, http://www.gene-regulation.com/cgi-bin/pub/programs/match/bin/match.cgi (for prediction of transcription factor binding sities)
PharmGKB, http://www.pharmgkb.org/ (for primer sequences and population samples used in resequencing study [accession number PS203897])
SLIDER, http://genapps.uchicago.edu/slider/index.html (for computing summary statistics of population genetic data) University of WashingtonFred Hutchinson Cancer Research Center, http://pga.gs.washington.edu/education.html (for SeattleSNPs, the National Heart Lung and Blood Institute's Program for Genomic Applications).
Acknowledgements
We are grateful to members of the Pharmacogenetics of Anticancer Agents Research group for helpful discussions throughout this project, and to E. Schuetz, in particular, for suggestions regarding project design and comments on the manuscript. We thank D. Nickerson and J. Akey for providing polymorphism and divergence data for the Seattle SNP genes. This work was supported by National Institutes of Health grant GM61393. E.E.T. was partially supported by training grant GM07197. M.D.K. was supported by a NIH training fellowship in Clinical Therapeutics, the University of Chicago Department of Pathology and the Robert E. Priest Fellowship Award.
References
- Xie W, Barwick JL, Simon CM. et al. Reciprocal activation of xenobiotic response genes by nuclear receptors SXR/PXR and CAR. Genes Dev. 2000;14:3014–3023. doi: 10.1101/gad.846800. [DOI] [PMC free article] [PubMed] [Google Scholar]
- Kast HR, Goodwin B, Tarr PT. et al. Regulation of multidrug resistance-associated protein 2 (ABCC2) by the nuclear receptors pregnane X receptor, farnesoid X-activated receptor, and constitutive androstane receptor. J Biol Chem. 2002;277:2908–2915. doi: 10.1074/jbc.M109326200. [DOI] [PubMed] [Google Scholar]
- Guo GL, Lambert G, Negishi M. et al. Complementary roles of farnesoid X receptor, pregnane X receptor, and constitutive androstane receptor in protection against bile acid toxicity. J Biol Chem. 2003;278:45062–45071. doi: 10.1074/jbc.M307145200. [DOI] [PubMed] [Google Scholar]
- Huang W, Zhang J, Chua SS. et al. Induction of bilirubin clearance by the constitutive androstane receptor (CAR) Proc Natl Acad Sci USA. 2003;100:4156–4161. doi: 10.1073/pnas.0630614100. [DOI] [PMC free article] [PubMed] [Google Scholar]
- Maglich JM, Watson J, McMillen PJ. et al. The nuclear receptor CAR is a regulator of thyroid hormone metabolism during caloric restriction. J Biol Chem. 2004;279:19832–19838. doi: 10.1074/jbc.M313601200. [DOI] [PubMed] [Google Scholar]
- Krasowski MD, Yasuda K, Hagey LR, Schuetz EG. Evolution of the pregnane X receptor: Adaptation to cross-species differences in biliary bile salts. Mol Endocrinol. 2005;19:1720–1739. doi: 10.1210/me.2004-0427. [DOI] [PMC free article] [PubMed] [Google Scholar]
- Moore LB, Parks DJ, Jones SA. et al. Orphan nuclear receptors constitutive androstane receptor and pregnane X receptor share xenobiotic and steroid ligands. J Biol Chem. 2000;275:15122–15127. doi: 10.1074/jbc.M001215200. [DOI] [PubMed] [Google Scholar]
- Handschin C, Podvinec M, Meyer UA. CXR, a chicken xenobiotic-sensing orphan nuclear receptor, is related to both mammalian pregnane X receptor (PXR) and constitutive androstane receptor (CAR) Proc Natl Acad Sci USA. 2000;97:10769–10774. doi: 10.1073/pnas.97.20.10769. [DOI] [PMC free article] [PubMed] [Google Scholar]
- Maglich JM, Caravella JA, Lambert MH. et al. The first completed genome sequence from a teleost fish (Fugu rubripes) adds significant diversity to the nuclear receptor superfamily. Nucleic Acids Res. 2003;31:4051–4058. doi: 10.1093/nar/gkg444. [DOI] [PMC free article] [PubMed] [Google Scholar]
- Handschin C, Blattler S, Roth A. et al. The evolution of drug-activated nuclear receptors: one ancestral gene diverged into two xenosensor genes in mammals. Nucl Recept. 2004;2:7. doi: 10.1186/1478-1336-2-7. [DOI] [PMC free article] [PubMed] [Google Scholar]
- Moore LB, Maglich JM, McKee DD. et al. Pregnane X receptor (PXR), constitutive androstane receptor (CAR), and benzoate X receptor (BXR) define three pharmacologically distinct classes of nuclear receptors. Mol Endocrinol. 2002;16:977–986. doi: 10.1210/me.16.5.977. [DOI] [PubMed] [Google Scholar]
- Zhang Z, Burch PE, Cooney AJ. et al. Genomic analysis of the nuclear receptor family: New insights into structure, regulation, and evolution from the rat genome. Genome Res. 2004;14:580–590. doi: 10.1101/gr.2160004. [DOI] [PMC free article] [PubMed] [Google Scholar]
- Yang Z, Bielawski JP. Statistical methods for detecting molecular adaptation. Trends Ecol Evol. 2000;15:496–503. doi: 10.1016/S0169-5347(00)01994-7. [DOI] [PMC free article] [PubMed] [Google Scholar]
- Chang TK, Bandiera SM, Chen J. Constitutive androstane receptor and pregnane X receptor gene expression in human liver: Interindividual variability and correlation with CYP2B6 mRNA levels. Drug Metab Dispos. 2003;31:7–10. doi: 10.1124/dmd.31.1.7. [DOI] [PubMed] [Google Scholar]
- Lamba V, Lamba J, Yasuda K. et al. Hepatic CYP2B6 expression: Gender and ethnic differences and relationship to CYP2B6 genotype and CAR (constitutive androstane receptor) expression. J Pharmacol Exp Ther. 2003;307:906–922. doi: 10.1124/jpet.103.054866. [DOI] [PubMed] [Google Scholar]
- Lamba JK, Lin YS, Thummel K. et al. Common allelic variants of cytochrome P4503A4 and their prevalence in different populations. Pharmacogenetics. 2002;12:121–132. doi: 10.1097/00008571-200203000-00006. [DOI] [PubMed] [Google Scholar]
- Yamano S, Nhamburo PT, Aoyama T. et al. cDNA cloning and sequence and cDNA-directed expression of human P450 IIB1: Identification of a normal and two variant cDNAs derived from the CYP2B locus on chromosome 19 and differential expression of the IIB mRNAs in human liver. Biochemistry. 1989;28:7340–7348. doi: 10.1021/bi00444a029. [DOI] [PubMed] [Google Scholar]
- Elkins IJ, McGue M, Iacono WG. Genetic and environmental influences on parent-son relationships: Evidence for increasing genetic influence during adolescence. Dev Psychol. 1997;33:351–363. doi: 10.1037//0012-1649.33.2.351. [DOI] [PubMed] [Google Scholar]
- Pascussi JM, Drocourt L, Gerbal-Chaloin S. et al. Dual effect of dexamethasone on CYP3A4 gene expression in human hepatocytes. Sequential role of glucocorticoid receptor and pregnane X receptor. Eur J Biochem. 2001;268:6346–6358. doi: 10.1046/j.0014-2956.2001.02540.x. [DOI] [PubMed] [Google Scholar]
- Schwartz S, Zhang Z, Frazer KA. et al. PipMaker -- A webserver for aligning two genomic DNA sequences. Genome Res. 2000;10:577–586. doi: 10.1101/gr.10.4.577. [DOI] [PMC free article] [PubMed] [Google Scholar]
- Frith MC, Li MC, Weng Z. Cluster-Buster: Finding dense clusters of motifs in DNA sequences. Nucleic Acids Res. 2003;31:3666–3668. doi: 10.1093/nar/gkg540. [DOI] [PMC free article] [PubMed] [Google Scholar]
- Wall JD, Frisse LA, Hudson RR, Di Rienzo A. Comparative linkage-disequilibrium analysis of the beta-globin hotspot in primates. Am J Hum Genet. 2003;73:1330–1340. doi: 10.1086/380311. [DOI] [PMC free article] [PubMed] [Google Scholar]
- Stephens M, Smith NJ, Donnelly P. A new statistical method for haplotype reconstruction from population data. Am J Hum Genet. 2001;68:978–989. doi: 10.1086/319501. [DOI] [PMC free article] [PubMed] [Google Scholar]
- Stephens M, Donnelly P. A comparison of Bayesian methods for haplotype reconstruction from population genotype data. Am J Hum Genet. 2003;73:1162–1169. doi: 10.1086/379378. [DOI] [PMC free article] [PubMed] [Google Scholar]
- Weir BS. Genetic Data Analysis II: Methods for Discrete Population Genetic Data. Sinauer Associates, Inc., Sunderland, MA; 1996. [Google Scholar]
- Goessling EK, Kel-Margoulis OV, Kel AE, Wingender E. MATCH -- A tool for searching transcription factor binding sites in DNA sequences. Applications for the analysis of human chromosomes. German Conference on Bioinformatics. 2001. see www.gene-regulation./com/cgi-bin/pub/programs/match/bin/match.cgi.
- Ng PC, Henikoff S. Accounting for human polymorphisms predicted to affect protein function. Genome Res. 2002;12:436–446. doi: 10.1101/gr.212802. [DOI] [PMC free article] [PubMed] [Google Scholar]
- Cartegni L, Wang J, Zhu Z. et al. ESEfinder: A web resource to identify exonic splicing enhancers. Nucleic Acids Res. 2003;31:3568–3571. doi: 10.1093/nar/gkg616. [DOI] [PMC free article] [PubMed] [Google Scholar]
- Brudno M, Do CB, Cooper GM. et al. LAGAN and Multi-LAGAN: Efficient tools for large-scale multiple alignment of genomic DNA. Genome Res. 2003;13:721–731. doi: 10.1101/gr.926603. [DOI] [PMC free article] [PubMed] [Google Scholar]
- Yang Z. PAML: A program package for phylogenetic analysis by maximum likelihood. Comput Appl Biosci. 1997;13:555–556. doi: 10.1093/bioinformatics/13.5.555. [DOI] [PubMed] [Google Scholar]
- Yang Z, Nielsen R, Goldman N, Pedersen AK. Codonsubstitution models for heterogeneous selection pressure at amino acid sites. Genetics. 2000;155:431–449. doi: 10.1093/genetics/155.1.431. [DOI] [PMC free article] [PubMed] [Google Scholar]
- Yang Z, Nielsen R. Codon-substitution models for detecting molecular adaptation at individual sites along specific lineages. Mol Biol Evol. 2002;19:908–917. doi: 10.1093/oxfordjournals.molbev.a004148. [DOI] [PubMed] [Google Scholar]
- Yang Z. Likelihood ratio tests for detecting positive selection and application to primate lysozyme evolution. Mol Biol Evol. 1998;15:568–573. doi: 10.1093/oxfordjournals.molbev.a025957. [DOI] [PubMed] [Google Scholar]
- Anisimova M, Bielawski JP, Yang Z. Accuracy and power of the likelihood ratio test in detecting adaptive molecular evolution. Mol Biol Evol. 2001;18:1585–1592. doi: 10.1093/oxfordjournals.molbev.a003945. [DOI] [PubMed] [Google Scholar]
- Springer MS, Murphy WJ, Eizirik E, O'Brien SJ. Placental mammal diversification and the Cretaceous-Tertiary boundary. Proc Natl Acad Sci USA. 2003;100:1056–1061. doi: 10.1073/pnas.0334222100. [DOI] [PMC free article] [PubMed] [Google Scholar]
- Ebersberger I, Metzler D, Schwarz C, Paabo S. Genomewide comparison of DNA sequences between humans and chimpanzees. Am J Hum Genet. 2002;70:1490–1497. doi: 10.1086/340787. [DOI] [PMC free article] [PubMed] [Google Scholar]
- Watterson GA. On the number of segregating sites in genetical models without recombination. Theor Popul Biol. 1975;7:256–276. doi: 10.1016/0040-5809(75)90020-9. [DOI] [PubMed] [Google Scholar]
- Tajima F. Statistical method for testing the neutral mutation hypothesis by DNA polymorphism. Genetics. 1989;123:585–595. doi: 10.1093/genetics/123.3.585. [DOI] [PMC free article] [PubMed] [Google Scholar]
- Stajich JE, Hahn MW. Disentangling the effects of demography and selection in human history. Mol Biol Evol. 2005;22:63–73. doi: 10.1093/molbev/msh252. [DOI] [PubMed] [Google Scholar]
- McDonald JH, Kreitman M. Adaptive protein evolution at the Adh locus in Drosophila. Nature. 1991;351:652–654. doi: 10.1038/351652a0. [DOI] [PubMed] [Google Scholar]
- Fay JC, Wyckoff GJ, Wu CI. Positive and negative selection on the human genome. Genetics. 2001;158:1227–1234. doi: 10.1093/genetics/158.3.1227. [DOI] [PMC free article] [PubMed] [Google Scholar]
- Cavalli-Sforza L. The History and Geography of Human Genes. Princeton University Press, Princeton, NJ; 1994. [Google Scholar]
- Akey JM, Zhang G, Zhang K. et al. Interrogating a highdensity SNP map for signatures of natural selection. Genome Res. 2002;12:1805–1814. doi: 10.1101/gr.631202. [DOI] [PMC free article] [PubMed] [Google Scholar]
- Clark AG, Glanowski S, Nielsen R. et al. Inferring nonneutral evolution from human-chimp-mouse orthologous gene trios. Science. 2003;302:1960–1963. doi: 10.1126/science.1088821. [DOI] [PubMed] [Google Scholar]
- Auerbach SS, Ramsden R, Stoner MA. et al. Alternatively spliced isoforms of the human constitutive androstane receptor. Nucleic Acids Res. 2003;31:3194–3207. doi: 10.1093/nar/gkg419. [DOI] [PMC free article] [PubMed] [Google Scholar]
- Lamba JK, Lamba V, Yasuda K. et al. Expression of constitutive androstane receptor splice variants in human tissues and their functional consequences. J Pharmacol Exp Ther. 2004;311:811–821. doi: 10.1124/jpet.104.069310. [DOI] [PubMed] [Google Scholar]
- Wen G, Mahata SK, Cadman P. et al. Both rare and common polymorphisms contribute functional variation at CHGA, a regulator of catecholamine physiology. Am J Hum Genet. 2004;74:197–207. doi: 10.1086/381399. [DOI] [PMC free article] [PubMed] [Google Scholar]
- Zhang J, Kuehl P, Green ED. et al. The human pregnane X receptor: Genomic structure and identification and functional characterization of natural allelic variants. Pharmacogenetics. 2001;11:555–572. doi: 10.1097/00008571-200110000-00003. [DOI] [PubMed] [Google Scholar]