

Abstract
Cytochrome P450 (P450) 2E1 is the major enzyme that oxidizes N-nitrosodimethylamine (N,N-dimethylnitrosamine, DMN), a carcinogen and also a representative of some nitrosamines formed endogenously. Oxidation of DMN by rat or human P450 2E1 to HCHO showed a high apparent intrinsic kinetic deuterium isotope effect (KIE), ≥ 8. The KIE was not attenuated in non-competitive intermolecular experiments with rat liver microsomes (DV 12.5, D(V/K) 10.9, nomenclature of Northrop, D.B. (1982) Methods Enzymol. 87, 607–625) but was with purified human P450 2E1 (DV 3.3, D(V/K) 3.7), indicating that C-H bond breaking is partially rate-limiting with human P450 2E1. With N-nitrosodiethylamine (N,N-diethylnitrosamine, DEN), the intrinsic KIE was slightly lower and was not expressed (e.g., D(V/K) 1.2) in non-competitive intermolecular experiments. The same general pattern of KIEs was also seen in the D(V/K) results with DMN and DEN for the minor products resulting from the denitrosation reactions (CH3NH2, CH3CH2NH2, and NO2−). Experiments with deuterated N-nitroso-N-methyl,N-ethylamine demonstrated that the lower KIEs associated for ethyl compared to methyl oxidation could be distinguished within a single molecule. P450 2E1 oxidized DMN and DEN to aldehydes and then to the carboxylic acids. No kinetic lags were observed in acid formation; pulse-chase experiments with carrier aldehydes showed only limited equilibration with P450 2E1-bound aldehydes, indicative of processive reactions, as reported for P450 2A6 (Chowdhury, G. et al. (2010) J. Biol. Chem. 285, 8031–8044). These same features (no lag phase for HCO2H formation, lack of equilibration in pulse-chase assays) were also seen with (rat) P450 2B1, which has lower catalytic efficiency for DMN oxidation and a larger active site. Thus, the processivity of dialkylnitrosamine oxidation appears to be shared by a number of P450s.
P450 enzymes are found throughout nature and function primarily as oxygenases.1 In mammals they oxidize sterols, fat-soluble vitamins, fatty acids, and various xenobiotics, including drugs, pesticides, and carcinogens. With regard to these xenobiotics, a subset of the P450s function with relatively slow rates of catalysis but with the advantage of broad substrate specificity.2, 3
One of the reasons for studying mammalian P450s is their roles in chemical carcinogenesis.4–6 Many carcinogens are inert until activated to electrophilic products that can bind to DNA.7, 8 One prominent group of carcinogens is the nitrosamines,9 including many derived from tobacco.10 Even simple alkyl nitrosamines, e.g. DMN and DEN, are activated by hydroxylation (Scheme 1). The point should be made that alkyl nitrosamines are not only of interest in the context of their presence in the artificial environment (e.g. industrial exposure, tobacco smoking) but because they are also formed endogenously from the reaction of secondary amines (e.g. dietary) with nitrite (formed by endogenous reduction of nitrate) in the acidic milleu of the stomach.9
Scheme 1.

Oxidations of N,N-dialkyl nitrosamines to aldehydes and acids. (A) DMN, (B) DEN.
The two most prominent human P450s involved in nitrosamine metabolism are P450s 2E1 and 2A6.11–14 The kinetics of catalysis of oxidation of DMN and DEN by P450 2A6 have been extensively studied.15 P450 2A6 oxidizes DMN with high kinetic deuterium isotope effects. An interesting feature (of the P450 2A6 oxidation of both DMN and DEN to aldehydes and then carboxylic acids) is the degree of processivity (i.e., lack of release of the first product prior to the second reaction) of the oxidation reactions (to carboxylic acids), as judged by the lack of a lag phase for carboxylic acid formation and by the results of pulse chase experiments.15
P450 2E1 is the major enzyme involved in the N-demethylation of DMN in rats16, 17 and humans.11 Studies with transgenic mice have shown that P450 2E1 is a major contributor to liver cancer caused by DEN.18 Keefer et al.19 showed that (per)deuteration of DMN greatly attenuated its ability to cause liver cancer in rats. Subsequent in vitro studies with rat liver microsomes reported a kinetic deuterium isotope effect on the Km for DMN oxidation but not Vmax.20 This pattern (isotope effect on Km but not kcat) was observed in the oxidation of ethanol by recombinant human P450 2E1 and was interpreted in terms of a rate-limiting step following product formation.21 However, this model was not applicable to P450 2A6 oxidation of DMN and DEN.15
P450s 2A6 and 2E1 have overlapping substrate specificities3, 12 and the basis for this has been established in the crystal structures, both of which are now available.22–24 We have also considered (rat) P450 2B1, an enzyme known to be able to catalyze DMN oxidation,25, 26 in the context that the active sites of Subfamily 2B P450s are known to be larger27 and might influence the processivity of sequential reactions.
In the present work we considered the oxidation of DMN and DEN with rat and human P450 2E1 and extended the work to MEN, which has elements of both DMN and DEN (i.e., both methyl and ethyl groups). We also found high expressed kinetic deuterium isotope effects for the oxidation of DMN and MEN (but not DEN) and processivity in the oxidations of DMN and DEN to carboxylic acids. Processivity of DMN oxidation was also observed with rat P450 2B1.
EXPERIMENTAL PROCEDURES
Caution! These nitrosamines and nitrosamides are mutagens and carcinogens! All syntheses should be done in a fume hood with adequate ventilation, and appropriate skin protection should be used.
Chemicals
DMN and DEN (d0d0, i.e. no deuterium on either alkyl group) were purchased from SigmaAldrich (St. Louis, MO) and purified by vacuum distillation before use (~ 12 Torr). [14C]-DMN was purchased from Moravek Radiochemicals (Brea, CA). Before use in assays for conversion to formic acid, the aqueous material was purified by passage through a Bakerbond™ quarternary amine SPE column to remove any carboxylic acids. All deuterated DMN and DEN preparations were synthesized as previously described.15 MEN (d0d0) was purchased from SigmaAldrich and purified by vacuum distillation (57–58 °C, 12 Torr) (note: MEN is no longer available from SigmaAldrich but a recent SciFinder search identified 11 other suppliers). β-Hydroxy DEN (N-nitroso,N-ethyl-2-hydroxyethylamine) was synthesized as described previously.15 Specifically deuterated forms of MEN were prepared using the methods described in Figure S1 of the Supporting Information (the NMR spectra of nitrosamines are complex due to the E/Z character produced by the nitroso group, e.g. ref. 15, and the 1H-NMR spectra of deuterated MEN substrates are shown in Supporting Information Figure S1B for reference.
Enzymes
Liver microsomes were prepared by differential centrifugation28 from male Sprague-Dawley rats (~ 150 g) that had been treated with ethanol (in the drinking water) to induce P450 2E1.29 Recombinant human P450 2E1 was expressed in Escherichia coli and purified as described elsewhere,30 except that a (His)6 tag was added at the C-terminus and Ni2+-nitriloacetic acid affinity chromatography was used in purification. Rat P450 2B1 was expressed from a plasmid obtained from P. F. Hollenberg (Univ. Michigan, Ann Arbor, MI) and purified by Ni2+-nitriloacetic acid affinity chromatography.31 P450 concentrations were determined spectrophotometrically using ferrous-CO vs. ferrous difference spectra by the method of Omura and Sato.32 Recombinant rat NADPH-P450 reductase31 and human cytochrome b533 were expressed in E. coli and purified as described elsewhere. P450 2E1, NADPH-P450 reductase, and cytochrome b5 were mixed in the ratio 1:2:1 in the presence of 30 μM L-α-1,2-dilauroyl-sn-glycero-3-phosphocholine to reconstitute catalytic activity.21, 30 The same ratios were used for P450 2B1 but cytochrome b5 was omitted.
Synthesis of N-Nitroso-N-ethylacetamide.34
BiCl3 (4.73 g, 15 mmol) and NaNO2 (1.10 g, 16 mmol) were stirred in 10 mL of dry CH2Cl2, and N-ethylacetamide (1.31 g, 1.41 mL, 15 mmol) was added dropwise. The mixture was capped and stirred vigorously for 2 h at 23 °C, during which time a yellow color appeared. The solids were removed by filtration through paper and the CH2Cl2 was removed carefully using a rotary evaporator. The product was further purified by silicic acid chromatography (CH2Cl2), yielding N-nitroso-N-ethylacetamide as a yellow oil, which chromatographed as a single spot on TLC (silica gel G, CH2Cl2, Rf 0.77). HRMS MH+ 117.0664 (calculated for C4H9N2O2, 117.0664); 1H-NMR (CDCl3) δ 0.97 (t, 3H J = 7.1 Hz, –CH2CH3), 2.76 (s, 3H, –COCH3), 3.80 (q, 2H, -CH2-, J = 7.1 Hz); UV λmax 240, 420 nm.
Synthesis of N-Nitroso-N-methylformamide.34
The same procedure utilized for N-nitroso-N-ethylacetanilide (vide supra) was used in the case of N-nitroso-N-methylformamide, except that the starting material was N-methylformamide. Rf 0.78 (TLC, silica gel G, CH2Cl2); 1H-NMR (CDCl3) δ 3.1 (s, 3H,–NCH3), 10.03 (s, 1H, –CHO); UV (CH3OH/H2O) λmax 240, 420 nm.
Determination of T1/2 for N-Nitroso-N-methylformamide and N-Nitroso-N-ethylacetamide
N-Nitroso-N-methylacetamide was added to a quartz cuvette containing 1.0 mL of 100 mM potassium phosphate buffer (pH 7.4) and repetitive spectra were collected using an OLIS/Hewlett Packard 8450A diode array spectrophotometer (On-Line Instrument Systems, Bogart, GA) (23 °C). The change in A240 was fit to a first-order exponential plot.
A solution of N-nitroso-N-ethylacetamide was prepared in 50 mM potassium phosphate buffer (pH 7.4) and immediately placed in the autosampler chamber of an Acquity UPLC system (Waters, Milford, MA). The sample tray was maintained at 37 °C. N-Nitroso-N-ethylacetamide was analyzed using a Waters Acquity UPLC system connected to a Waters photodiode array detector, utilizng an Acquity UPLC BEH C18 octadecylsilane column (1.7 μm, 2.1 mm × 100 mm). UPLC conditions were as follows: Buffer A contained 10 mM NH4CH3CO2 and 2% CH3CN (v/v), and buffer B contained 10 mM NH4CH3CO2 and 95% CH3CN (v/v). The following gradient program was used, with a flow rate of 250 μL min−1: 0–5.5 min, linear gradient from 0% to 50% B (v/v); 5.5–6.0 min, linear gradient to 100% B; 6–8 min, hold at 100% B; 8–9.5 min linear gradient to 100% A; 9.5–59 min, hold at 100% A. The temperature of the column was maintained at 25 °C. Samples (20 μL) were infused with an auto-sampler every 60 min. A240 was monitored and the peaks (tR 4.6 min) were integrated and fit to a single-exponential plot.
Assays of Catalytic Activity
General
As noted in our earlier work with P450 2A6,15 assays of trace levels of HCHO, CH3CHO, HCO2H, and CH3CO2H are all highly problematic due to the ubiquitous presence of these compounds in many laboratory reagents. We found simple colorimetric methods unsatisfactory (e.g. Nash assay35) for sensitive assays because of the high blank levels, which are notorious.28 In some cases HPLC-UV methods could be used to measure hydrazone derivatives of aldehydes, if precautions were used to eliminate sources of contamination. In some critical situations, we utilized [14C]-DMN as the substrate. LC-MS proved to yield low backgrounds if heavy isotopes of aldehydes were measured, particularly if enriched by ≥ 2 a. m. u. HCO2H is difficult to derivatize quantitatively36 and was analyzed (as a radioactive product) using ion-exchange columns.21 During the course of this work, [14C]-DMN became no longer commercially available, and our own synthetic strategies15 could not be adapted to produce high specific radioactivity. Some of the studies on rates of oxidation to formaldehyde were done with LC-MS assays with [d4]- or [13C]-DMN, as noted, i.e., microsomal kinetic deuterium isotope studies and rates of oxidation by P450 2B1.
Nitrosamine N-Dealkylation Assays
Typical steady-state N-dealkylation reactions included 400 pmol P450 2E1, 800 pmol NADPH-P450 reductase, 400 pmol cytochrome b5, 30 μM L-α-1,2-dilauroyl-sn-glycero-3-phosphocholine, and varying concentrations of the nitrosamine substrate in 0.34 mL of 50 mM potassium phosphate buffer (pH 7.4). Reaction vials (clear glass, 1-dram, 4.0 mL) were sealed with Teflon-lined rubber septa because of the volatility of the substrates. Reconstituted enzyme solutions (P450 2E1, NADPH-P450 reductase, and cytochrome b5) were dialyzed against glycerol-free 50 mM potassium phosphate buffer (pH 7.4) containing 0.2 mM EDTA and 0.1 mM dithiothreitol (two changes over 12 h at 4 °C), before the addition of the phospholipid, to minimize complications arising from residual aldehydes known to be present in glycerol, as well as the inhibitory nature of glycerol on P450 2E1.37, 38 A 60-μL aliquot of an NADPH-generating system was used to start reactions (final concentrations of 10 mM glucose 6-phosphate, 0.5 mM NADP+, and 1 IU of yeast glucose 6-phosphate dehydrogenase mL−1).28 Incubations were generally done for 15 min in a shaking water bath at 37 °C, terminated by the sequential addition of 100 μL of 10% (w/v) ZnSO4·7H2O and 100 μL of saturated aqueous Ba(OH)2·8H2O, and centrifuged (2 × 10³ × g). 2,4-Dinitrophenylhydrazine derivatization and analysis were as described previously.15 As earlier,15 2,4-dinitrophenylhydrazine was recrystallized twice from CH3OH/H2O (3:1), dried in vacuo, dissolved in 6 M HCl (0.1%, w/v), and washed multiple times with a hexane-CH2Cl2 mixture (7:3, v/v) before use as a derivatization reagent, in order to minimize interference resulting from residual hydrazone contamination. Hexanes and CH3CN were heated with and distilled from 2,4-dinitrophenylhydrazine to remove residual aldehydes.
Assays involving competitive kinetic deuterium isotope effects were done by LC-MS analysis (atmospheric pressure chemical ionization, negative ion) of derivatized formaldehyde or acetaldehyde (source temperature 550 °C; heated capillary voltage 20 V; heated capillary temperature 180 °C; ionization current 5 μA; sheath gas (N2) pressure 70 psi; auxiliary gas (N2) pressure 10 psi). Representative LC-MS data are shown in the Supporting Information (Figure S2).
In some cases, aldehydes were derivatized as dansyl hydrazones and analyzed by LC-MS, as described in detail earlier.15
The results of steady-state kinetic experiments (v vs. S) were fit to hyperbolic plots using GraphPad Prism (GraphPad, Dan Diego, CA) and parameters and standard errors were obtained with this program using non-linear regression.
Denitrosation Assays
Nitrite formation, an indirect measure of nitric oxide (NO•) formation, was measured colorimetrically by a previously described method.39
CH3NH2 and CH3CH2NH2 were analyzed by derivatization with dansyl chloride40 and LC-MS, using external standards. Incubations were generally done for 30 min in a shaking water bath at 37 °C and terminated by the addition of 100 μL of cold CH3CN. Propylamine (10 μL, 1 nmol) was added as internal standard and the samples were centrifuged (2 × 10³ × g). The supernatant (150 μL) was transferred into amber vials and 10 μL of 1 M NaOH, 40 μL of 0.5 M Na2CO3, and 100 μL dansyl chloride (1 mg ml1 in CH3CN) were added, in that order. The derivatization reaction was heated at 40 °C for 15 min and dried under a gentle stream of N2 at room temperature, and the residue was reconstituted in 100 μL of a mixture of H2O:CH3CN (3:1, v/v). Dansylated products were analyzed by LC-MS on a Waters Acquity UPLC system using an Aquity UPLC BEH C18 octadecylsilane column (1.7 μm, 2.1 mm × 100 mm) connected to a ThermoFisher TSQ quantum mass spectrometer. LC conditions were as follows: buffer A contained 0.1% HCO2H and 5% CH3CN (v/v), and buffer B contained 0.1% HCO2H and 95% CH3CN (v/v). The following gradient program was used, with a flow rate of 300 μL min−1: 0–4.0 min, linear gradient from 100% A to 40% A; 4.0–4.5 min, linear gradient to 100% B; 4.5–6.5 min, hold at 100% B; 6.5–7.0 min linear gradient to 100% A; 7.0–9.0 min, hold at 100% A. The temperature of the column was maintained at 40 °C. Samples (15 μL) were infused with an auto-sampler. Dansylated products of the alkylamines were detected in the selected ion monitoring (SIM) mode using respective m/z values. The mass spectrometer was tuned using an authentic dansylated CH3NH2 standard.
DEN β-Hydroxylation Assay.15
Typical reactions included 400 pmol 2E1, 800 pmol NADPH-P450 reductase, 400 pmol cytochrome b5, 30 μM L-α-1,2-dilauroyl-sn-glycero-3-phosphocholine, and 1 mM d0 or d4 DEN in 100 μL of 50 mM potassium phosphate buffer (pH 7.4). An NADPH-generating system was used to initiate reactions. Incubations were done for 30 min in a shaking water bath at 37 °C and terminated by the addition of 100 μL of cold CH3CN. The supernatant was transferred and CH3CN was removed under a stream of nitrogen. The volume of the reaction was made to 100 μL with H2O. β-Hydroxy DEN was analyzed by LC-MS on a Waters Acquity UPLC system using an Aquity UPLC BEH C18 octadecylsilane column (1.7 μm, 2.1 mm × 100 mm) connected to a ThermoFisher TSQ quantum mass spectrometer. LC conditions were as follows: buffer A contained 0.1% HCO2H and 5% CH3CN (v/v), and buffer B contained 0.1% HCO2H and 95% CH3CN (v/v). The following gradient program was used, with a flow rate of 300 μL min−1: 0–2.0 min, 100% A; 2,0–3.5 min, linear gradient to 100% B; 3.5–4.5 min, hold at 100% B; 4.5–5.0 min linear gradient to 100% A; 5.0–7.0 min, hold at 100% A. The temperature of the column was maintained at 40 °C. Samples (15 μL) were infused with an auto-sampler. MS was done in the positive APCI mode, and the product(s) (d0, d4) were detected using the SIM mode. The mass spectrometer was tuned using authentic β-hydroxy DEN standard.15
Time Course Assays
For DMN oxidation time course assays, 0.5 nmol P450 2E1, 1.0 nmol NADPH-P450 reductase, 0.5 nmol cytochrome b5, 30 μM L-α-1,2-dilauroyl-sn-glycero-3-phosphocholine and [14C]-DMN (1 mM, 0.1 mCi mmol−1) were incubated in 100 μL of potassium phosphate buffer (50 mM, pH 7.4). A 60-μL aliquot of an NADPH-generating system was used to initiate the reactions (final concentrations of 10 mM glucose 6-phosphate, 0.5 mM NADP+, and 1 IU of yeast glucose 6-phosphate dehydrogenase mL−1).28 Incubations were generally done for 0–10 min in a shaking water bath at 37 °C and terminated by the addition of 40 μL of 17% ZnSO4·7H2O solution (w/v). To measure formation of formaldehyde, 100 μL of potassium phthalinate buffer (250 mM, pH 4.0) was added and samples were centrifuged (2 × 10³ × g) for 10 min. The supernatants (200 μL) were transferred to new vials, 50 μL of freshly prepared aqueous O-(2,3,4,5,6-pentafluorobenzyl)hydroxylamine (15 mg mL−1) was added, and the reaction mixtures were incubated at 37 °C for 45 min. Derivatized products were analyzed by HPLC/on-line scintillation counting using a Zorbax cyano (CN) column (150 mm × 4.6 mm, 5 μm, Zorbax, Santa Clara, CA). HPLC conditions were as follows—buffer A: H2O, buffer B: CH3CN. The following gradient program was used, with a flow rate of 1.0 mL min−1: 0–6.0 min, linear gradient from 95% A (v/v) to 100% B; 6.0–10 min, hold at 100% B; 10–11 min, linear gradient to 95% A (v/v); 11–15 min, hold at 95% A (v/v). Quantitation of the product was performed using a standard curve generated with [14C]-HCHO (0–20 nmol).
To measure formation of formic acid, reactions were terminated by the addition of 40 μL of 17% (w/v) ZnSO4·7H2O solution and centrifuged (2 × 10³ × g) for 10 min. The supernatants were loaded onto Bakerbond™ quaternary amine SPE columns that had been prewashed with 6 mL of CH3OH and then equilibrated with 10 mL of H2O).21 After loading, the columns were washed with 10 mL of H2O and 10 mL of 20% CH3OH (v/v) to remove residual aldehyde or nitrosamine substrate. The bound [14C]-HCO2H was eluted with 1.0 mL of 1 M HCl and radioactivity was measured by liquid scintillation spectrometry in Fisher ScintiVerse III cocktail (Fisher, Pittsburgh, PA).
For DEN, time course assays were performed essentially as reported previously,15 with the following exceptions. d3d3-DEN (labeled in the methyl groups, i.e. CD3CH2N(N=O)CH2CD3) was used as the substrate and the internal standards used for the aldehyde and acid assays were propionaldehyde and propionic acid, respectively.
Pulse-chase Experiments
Experiments were done with [14C]-DMN (1 mM, 0.2 mCi mmol−1) in the case of DMN and with d3d3-DEN (0.5 mM) in the case of DEN. In both cases the reaction (37 °C) was initiated with 2.5 μM P450 2E1, 5 μM NADPH-P450 reductase, 2.5 μM cytochrome b5, 30 μM L-α-1,2-dilauroyl-sn-glycero-3-phosphocholine, and an NADPH-generating system (vide supra). After 1 or 2 min either (unlabeled) HCHO (1.3 mM, in the case of DMN) or CH3CHO (0.12 mM, in the case of the substrate DEN) was added and the reaction was allowed to proceed to a total of 20 min (at 37 °C) (the concentrations used were calculated to give a 20- or 10-fold excess, respectively, compared to the amount of labeled aldehyde known to be produced at that time point). In the case of DMN, the product [14C]-HCO2H was measured as described for the [14C]-HCO2H time course assays (vide supra). A similar experiment was done with [14C]-DMN and rat P450 2B1. In the case of DEN, the product (CD3CO2H/CH3CO2H) was derivatized with 4-nitrophenacyl bromide and analyzed by LC-MS, using the procedure described earlier. Assays were run in triplicate and the mean results were compared, with the extent of decrease due to the presence of the added aldehyde being indicative of the fraction of the unlabeled aldehyde (or its equivalent) that exchanged.
RESULTS
Steady-state Catalytic Activities of Human P450 2E1
Human P450 2E1 had about twice the catalytic efficiency in oxidizing DEN to an aldehyde, compared with DMN (Table 1). With MEN, P450 can catalyze hydroxylation of an ethyl or a methyl group; the former process was twice as efficient as the latter, consistent with the catalytic efficiencies measured for DMN and DEN (Table 1). However, the overall rate (sum of formation of HCHO and CH3CHO) was < 1/3 that for DEN conversion to CH3CHO (Table 1).
Table 1.
Steady-state kinetic parameters for human P450 2E1 oxidationsa
| substrate | product | kcat, s−1 | Km, mM | kcat/Km, M−1 s−1 |
|---|---|---|---|---|
| DMN | HCHO | 0.23 ± 0.01 | 0.92 ± 0.09 | 250 ± 30 |
| DEN | CH3CHO | 0.27 ± 0.02 | 0.49 ± 0.07 | 506 ± 90 |
| MEN | HCHO | 0.023 ± 0.007 | 0.50 ± 0.06 | 46 ± 5 |
| MEN | CH3CHO | 0.077 ± 0.003 | 0.76 ± 0.07 | 100 ± 20 |
| HCHO | HCO2H | 0.012 | 1.3 | 9.2 |
| CH3CHO | CH3CO2H | 0.077 | 0.12 | 640 |
All assays involved HPLC-UV analysis of 2,4-dinitrophenyl hydrazones except the oxidations of the aldehydes, which were done using 14C-labeled substrates and ion-exchange chromatography of the carboxylic acid products. Values are from hyperbolic plots (± SE) made using GraphPad Prism software, with further analysis of quotients.
In the case of DEN there is the possibility of β-oxidation (formation of β-hydroxy DEN). We searched for this using a synthetic standard15 and LC-MS but no product was detected (from d0 or d4 DEN, i.e. limit of 0.0013 nmol formed min−1 (nmol P450 2E1) −1).
HCHO and CH3CHO were both oxidized to carboxylic acids (Table 1). The ratio of catalytic efficiencies for CH3CHO > HCHO oxidation was ~ 70 (compared to 19 for P450 2A615).
Kinetic Deuterium Isotope Effects for DMN Oxidation in Rat Liver Microsomes
Wade et al.20 used liver microsomes prepared from rats treated with acetone to induce P450 2E1 and reported that a kinetic deuterium isotope effect was expressed in the Km (value of 5)41 but not Vmax, using a non-competitive intermolecular experiment (d0 vs. d6 DMN) and a Nash assay35 to measure formaldehyde colorimetrically. We repeated this work with liver microsomes prepared from rats treated with ethanol, which also induces P450 2E1.42 We utilized two assay procedures to measure Vmax and Km for the cleavage of the C–H and C–D bonds, because of the problematic issue of HCHO contamination in reagents. [13C]-DMN was utilized to measure the rate of oxidation of d0-DMN (ignoring the small 13C isotope effect), using derivatization of the 13C-formaldehyde with dansyl hydrazine and LC-MS analysis. (As pointed out under Experimental Procedures, [14C]-DMN was no longer commercially available at this point in the work.) The 13C-labeled material was used to minimize issues with exogenous HCHO. The rate of cleavage of the C–D bond (of d6-DMN) was analyzed by LC-MS analysis of the released DCDO, following derivatization with dansyl hydrazine.
Measurement of non-competitive intermolecular kinetic deuterium isotope effects provides insight into the extent to which C-H bond-breaking is rate-limiting in the overall steady-state reaction.43 The non-competitive intermolecular kinetic deuterium isotope effects measured in rat liver microsomes were DV = 12.5 (± 1.2) and D(V/K) = 10.9 (± 6.0) (Figure 1). A separate experiment involved d4-DMN (CD2H-N(NO)-CD2H), in which HCDO and DCDO were detected by LC-MS following derivatization with dansyl hydrazine.15 This estimated intrinsic kinetic deuterium isotope effect (Dk) was 8.1 ± 0.1 (n = 3), without correction for any secondary isotope effect.44 The values measured in the non-competitive intermolecular experiment (i.e. 12.5, 10.9) are as high (within experimental error) as the estimated intrinsic isotope effect (vide supra), supporting the conclusion that C–H bond breaking is largely rate-limiting. These results contrast with those in a previous report,20 in that the deuterium isotope effect was expressed in Vmax but not Km in our work.
Figure 1.

Non-competitive intermolecular kinetic deuterium isotope effects for oxidation of DMN to formaldehyde by rat liver microsomes containing P450 2E1 (d6 vs. d0). The assays were done with d0 [13C]-DMN (●) and the d6 assays were done with CD3N(NO)CD3 (❍). In these experiments the dansyl hydrazone samples were analyzed by LC-MS.
Non-competitive Intramolecular and Competitive Kinetic Deuterium Isotope Effects with Purified Recombinant Human P450 2E1
The non-competitive kinetic deuterium isotope effects were measured (MS) by competition at -CHD- sites (Table 2): 8.4–8.8 for DMN and 6.3–7.0 for DEN. Both sets of values are subject to possible contributions of secondary isotope effects (possibly as high as (1.4)2 ~ 2 for DMN44) but are still relatively high. With DEN there is a possible stereoselective contribution.45 The intramolecular competitive kinetic isotope effect for DEN was 5.6 and that for DMN was 12 (Table 2). The intermolecular competitive kinetic isotope effect for DMN was 12 (Table 2).
Table 2.
Intramolecular and competitive intermolecular kinetic deuterium isotope effects for human P450 2E1-catalyzed N-dealkylation of DMN and DENa
| substrate | product | substrate concentrationb | D(V/K) |
|---|---|---|---|
| DMN | |||
| CHD2-N(N=O)-CHD2 | formaldehyde | 0.5 × Km | 8.4 ± 0.3 |
| formaldehyde | 1.0 × Km | 8.8 ± 0.1 | |
| formaldehyde | 1.5 × Km | 8.7 ± 0.1 | |
| CH3-N(N=O)-CD3 | formaldehyde | 1.0 × Km | 12 ± 1 |
| CH3-N(N=O)-CH3/CD3-N(N=O)-CD3 | formaldehyde | 1.0 × Km | 12 ± 4 |
| DEN | |||
| CH3-CHD-N(N=O)-CHD-CH3 | acetaldehyde | 0.5 × Km | 6.3 ± 0.6 |
| acetaldehyde | 1.0 × Km | 7.0 ± 0.2 | |
| acetaldehyde | 1.5 × Km | 6.7 ± 0.5 | |
| CH3CH2-N(N=O)-CD2CH3 | acetaldehyde | 1.0 × Km | 5.6 ± 0.1 |
A series of different deuterated MEN derivatives all yielded relatively high kinetic deuterium isotope effects (Table 3) Most were > 4, with the only one lower being 2.9 for a competitive experiment with CD3-N(NO)-CD2CH3.
Table 3.
Kinetic isotope effects for human P450 2E1-catalyzed N-dealkylation of MENa
| substrate | product | D(V/K) |
|---|---|---|
| CD2H-N(N=O)-CH2CH3 | formaldehyde | 7.6 ± 0.2 |
| CH3-N(N=O)-CH2CH3/CD3-N(N=O)-CD2CH3 | formaldehyde | 4.1 ±0.1 |
| CH3-N(N=O)-CH2CH3/CD3-N(N=O)-CH2CH3 | formaldehyde | 7.6 ± 0.5 |
| CH3-N(N=O)-CHDCH3 | acetaldehyde | 6.0 ± 0.2 |
| CH3-N(N=O)-CH2CH3/CH3-N(N=O)CD2CH3 | acetaldehyde | 4.2 ± 0.1 |
| CH3-N(N=O)-CH2CH3/CD3-N(N=O)-CD2CH3 | acetaldehyde | 2.9 ± 0.1 |
All measurements were done with 2,4-dinitrophenyl hydrazones (MH+) separated by HPLC on-line. Substrate concentrations were 1 mM. n = 3, means ± SD.
Non-competitive Intermolecular Kinetic Deuterium Isotope Effects with Recombinant Human P450 2E1
The non-competitive intermolecular kinetic deuterium isotope effect was considerably higher for the oxidation of DMN than DEN (Figure 2). Further analysis of the DMN results showed components of the kinetic deuterium isotope effect mainly in the kcat component (Table 4), as in the case of rat liver microsomes containing P450 2E1 (Figure 1).
Figure 2.

Non-competitive intermolecular kinetic deuterium isotope effects for oxidation of DMN and DEN by purified human P450 2E1. A, DMN (d6 (●) vs. d0 (■); B, DEN (d4 (■) vs. d0 (●), i.e. CH3CD2N(N-O)CD2CH3). See Table 4. 2,4-Dinitrophenyl hydrazones were analyzed by HPLC-UV.
Table 4.
Non-competitive intermolecular isotope effects for human P450 2E1-catalyzed oxidations of nitrosamines to aldehydesa
| substrate | isotope location | product | DV | D(V/K) |
|---|---|---|---|---|
| DMN | CD3N(N=O)CD3 (d3d3 vs. d0d0) | formaldehyde | 3.3 ± 0.1 | 3.7 ± 1.4b |
| DEN | CH3CD2N(N=O)CD2CH3 (d2d2 vs. d0d0) | acetaldehyde | 1.4 ± 0.1 | 1.2 ± 0.1 |
| MEN | CH3CD2N(N=O)CD3 (d3d2 vs. d0d0) | formaldehyde | 2.0 ± 0.1 | 1.5 ± 0.4 |
| MEN | CH3CD2N(N=O)CD3 (d3d2 vs. d2d0) | formaldehyde | 4.7 ± 0.1 | 5.3 ± 0.9 |
| MEN | CH3CD2N(N=O)CD3 (d3d2 vs. d3d0) | acetaldehyde | 0.48 ± 0.03 | 0.77 ± 0.07 |
| MEN | CH3CD2N(N=O)CD3 (d3d2 vs. d0d0) | acetaldehyde | 1.3 ± 0.1 | 1.8 ± 0.5 |
The differences in rates of formation of formaldehyde and acetaldehyde from d0-MEN and CH3CD2N(NO)CD3 were significant but ≤ 2-fold (Table 4, Figure 3). However, closer analysis (Table 4) of the results in Figure 4 revealed more striking differences when MEN molecules with individually deuterated sites were compared. Deuterium substitution of the methylene group of MEN (d2) increased the isotope effect (DV) for demethylation 4.3-fold, in considering d0d2- vs d3d2-MEN. The DV was ~ 5 in comparing d3d0- and d0d0-MEN (Figure 3A). Similarly, an increase (~ 2-fold) in MEN deethylation was seen upon deuteration of the methyl group (Figure 3B). The value of DV was 2.4 in comparing d0d2- and d0d0-MEN, considerably more than for comparing d0d0 with d2d3 MEN (Figure 3B). These results can be attributed to “metabolic switching,” i.e. blocking one part of a molecule causes the enzyme to oxidize another site.46 Although increases in some reactions were observed by blocking other oxidations (Figure 3), it should be noted that the total amount of dealkylation did not increase due to deuteration. The metabolic switching observed here (Figure 3) is entirely consistent with the results of Tables 2 and 3, in which competitive experiments did not show an attenuation of the kinetic isotope effect due to any restriction of tumbling or exchange of the substrate with the medium.
Figure 3.

Non-competitive intermolecular kinetic deuterium isotope effects for oxidation of MEN by P450 2E1. (A) N-demethylation; (B) N-deethylation. d3 indicates CD3-N(N=O)- and d2 indicates –N(N=O)CD2CH3. 2,4-Dinitrophenyl hydrazones were analyzed by HPLC-UV.
Figure 4.

Kinetics of conversion of N,N-dialkyl nitrosamines to aldehydes (●) and carboxylic acids (■) by P450 2E1. (A) DMN; (B) DEN. The procedures are described under “Time Course Assays” in the Experimental Procedures section. For each experimental time points, the mean (■) and range (n = 2) are shown. Fits were made using linear regression. The insets are expansions of the results for formation of the carboxylic acids, which lack a lag phase in both cases.
Oxidations of Nitrosamines to Carboxylic Acids by P450 2E1
P450 2E1 oxidized HCHO and CH3CHO to carboxylic acids, as reported previously,47 with the conversion of CH3CHO to CH3CO2H being much more efficient (Table 1). The nitrosamines (DMN and DEN) were also shown to form the carboxylic acids (Figure 4). Careful analysis of the products showed the lack of a lag phase for nitrosamine oxidation to carboxylic acids, which would have been expected to occur if the aldehydes freely dissociated and bound again to P450 2E1 for further oxidation.
A model constructed using a simplified kinetic scheme for the sequential oxidations (Supporting Information Figures S3, S4) showed (Figure 5): (i) an expected lag in the production of the second oxidation product (HCO2H) and inconsistency with the experimentally observed rapid, immediate formation of HCO2H (Figure 4), and (ii) that the level of HCO2H product formation is considerably greater than expected based on the measured kcat and Km values for oxidations of DMN and HCHO. However, because of the much higher efficiency of P450 2E1 conversion of acetaldehyde to acetic acid (than formaldehyde to formic acid) (Table 1), this latter relationship (Fig. 5) did not apply with DEN (results not presented.)
Figure 5.

Comparison of human P450 2E1 experimental (“Actual”) time course of product formation (Figure 4) with prediction (“Theo” (theoretical)) based on kcat and Km values for individual reactions (Table 1). For each experimental time point, the mean (■) and range (n = 2) are shown. The experimental fit used linear regression analysis. See Supporting Information Figure S4 for DynaFit script and differential equations used in the modeling.
Pulse Chase Experiments
Pulse chase experiments were done with P450 2E1. Reactions were initiated with labeled DMN (14C) or DEN (d6, i.e. CD3CH2N(N=O)CH2CD3) and, after 1 or 2 min, excess unlabeled aldehyde was added and the reactions were continued for a total of 20 min (Figure 7). If the aldehyde had completely exchanged with the intermediate (aldehyde) bound to the P450 2E1, the yield of (labeled) carboxylic acid would have been reduced to 5–10%. Contrary to the expected 5–10% yield reduction if complete equilibration were to occur, the carboxylic acid yields with P450 2E1 remained as high as 30–40% for DEN and 90% with DMN and, with P450 2B1, ~ 50% for DMN (Figure 7). Thus, limited equilibration occurred with the added aldehydes in the medium.
Figure 7.
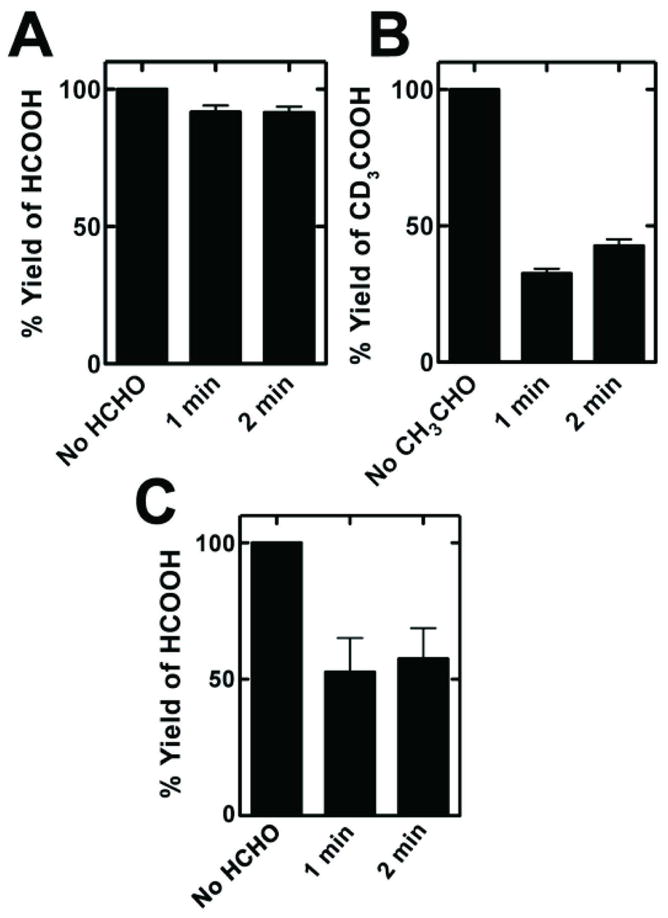
Pulse chase experiments. (A) P450 2E1 and DMN oxidation to formic acid; (B) P450 2E1 and DEN oxidation to acetic acid; C, P450 2B1 and DMN oxidation to formic acid. Results are shown as means (n = 3) ± SD. In the case of complete equilibration of the intermediate aldehyde with the medium in the 20 min incubation, the expected yield of labeled carboxylic acid would be ~5% for a 1 min pre-incubation and ~10% for a 2 min initial incubation with labeled substrate, based on the expected production of product calculated for other assays. The procedures are described under “Pulse Chase Experiments” in the Experimental Procedures section.
Denitrosation of DMN and DEN by P450 2E1
The denitrosation of DMN has been demonstrated in rat liver microsomes and in vivo 20, 39, 48, 49 and proposed to follow a sequence similar to that of N-demethylation (Scheme 2).20 The released nitric oxide is oxidized (non-enzymatically) to nitrite, and another product of the reaction is the aldehyde (HCHO from DMN, CH3CHO from DEN) (Scheme 2).
Scheme 2.

Possible mechanisms for N-dealkylation and denitrosation of dialkyl nitrosamines.20
We analyzed the products with recombinant human P450 2E1 (Supporting Information Figure S5). Nitrite was measured colorimetrically 39 and the kcat values with DMN and DEN were 1.0 and 1.1 min−1 (0.017 and 0.018 s−1, respectively). CH3NH2 and CH3CH2NH2 were assayed (as dansyl derivatives) by LC-MS and were found to be generated (from DMN and DEN, respectively) with kcat values of 2.8 and 3.6 min−1 (0.047 and 0.06 s−1). In line with the microsomal results,20, 39, 48 this pathway accounts for ≤ 15% of the formation of aldehydes from d0 DMN and DEN (Figure 2). Our measuremnts showed about one-half as much NO2− formation as alkylamine from DMN and DEN, possibly due to the complexity of NO• oxidation to NO2− (Scheme 2).20 The complexity of the denitrosation pathways may also be responsible for the variation in the Km values, compared with the N-dealkylation reactions (Table 1, Fig. 2).
The kinetic deuterium isotope effects on the denitrosation reaction were also measured (Supporting Information, Figure S5). The formation of nitrite from DMN showed DV = 0.69 (± 0.10) and D(V/K) = 8.8 (± 3.3). With DEN, nitrite production yielded DV = 0.77 ± 0.09 and D(V/K) = 2.0 ± 0.6. The analysis of the alkylamines (LC-MS) yielded DV = 0.76 ± 0.24 and D(V/K) = 4.2 ± 3.4 for DMN and for DV = 1.6 ± 0.3 and D(V/K) = 1.3 ± 0.5 for DEN. Although the errors for D(V/K) were large, inspection of the plots (Supporting Information Figure S5) clearly shows the kinetic isotope effects on the initial slopes in the DMN series (and the small isotope effects with DEN).
Although NO• is apparently produced in the denitrosation of dialkyl nitrosamines and can complex P450 heme, the concentration was apparently not great enough to be significant in that the reactions (dealkylation) were linear for ≥10 min (Figure 4). Further, ferric P450-NO• complexes have strong 430 nm bands,50, 51 and we were unable to detect such a complex when steady-state spectra were collected (350–600 nm, data not presented).
Oxidation of DMN by Rat P450 2B1
Although P450s 2E1 and 2A6 appear to be the enzymes most involved in the oxidations of small alkyl nitrosamines,11–14, 16, 17 other P450s can oxidize nitrosamines to aldehydes, including DMN.25, 26, 52, 53 In many earlier studies relatively high concentrations of DMN were used, but P450 enzymes in what is now known as Subfamily 2B were active.25, 26 We selected (rat) P450 2B1, which had been studied before (then termed “P450 PB-B”).25, 26
P450 2B1 oxidized DMN to HCHO with a kcat of 0.11 (± 0.01) s−1 and Km of 2.5 (± 0.5) mM (Supporting Information Figure S6), a catalytic efficiency 6-fold lower than that of P450 2E1. The intrinsic kinetic deuterium isotope effect (Dk) was estimated to be 2.0 ± 0.1, using LC-MS analysis of DCDO and HCDO formed from d4-DMN (DMN with –CD2H groups). footnote 1 The enzyme formed HCO2H, as well as HCHO, with the former not showing a lag in formation (Figure 6).
Figure 6.

Kinetics of conversion of [14C]-DMN to formaldehyde and formic acid by P450 2B1. Results are means of duplicate experiments, with the means (● for HCHO, ▲ for HCO2H) and ranges shown. Fits were by linear regression analysis. Note the lack of a lag phase for carboxylic acid formation.
Attempts to Implicate N-Nitrosamides as Secondary Oxidation Products
One potential explanation for the processivity of P450 2E1 reactions is that the initial α-hydroxylation product is further oxidized to an N-nitrosamide (Scheme 3, step 12), circumventing (at least in part) decomposition to an aldehyde. The nitrosamide derivatives of DMN and DEN are previously synthesized compounds34 and are known to decompose to HCO2H and CH3CO2H, respectively. In order to address the possibility that these compounds are formed, we synthesized and characterized both N-nitrosamides (Figure S7 of Supporting Information). The methyl and ethyl nitrosamides had respective t1/2 values of 56 s (determined by scanning UV spectroscopy, at 23 ° C) and 114 min (determined by HPLC) (in 0.10 M potassium phosphate buffer, pH 7.4, at 37 °C).
Scheme 3.

Expanded scheme of oxidations of N,N-dialkyl nitrosamines to aldehydes and acids, including the possibility of N-nitrosamides. Reported rates of non-enzymatic reactions in steps 8 and 9 are from the indicated references.55, 61, 63, 64
Both N-nitrosamides had poor MS ionization characteristics, and accordingly searches for the production of these compounds as oxidation products were done by UPLC-UV (diode array detection), using the wavelength maxima at 240 nm (for both N-nitroso-N-methylformamide and N-nitroso-N-ethylacetamide). Incubations were done with DMN and DEN under the usual reaction conditions (1 mM substrate, 37 °C), with UPLC-UV analysis from the steady-state (5 min of reaction). The retention times for N-nitroso-N-methylformamide and N-nitroso-N-ethylacetamide were 5.9 and 4.6 min, respectively, under these HPLC conditions, and we estimate that the limit of detection was ~ 10 pmol of product. No N-nitrosamide products could be detected from either DMN or DEN in P450 2E1 reactions under these conditions, and we conclude that any production of these N-nitrosamides, if formed, is below or near the detection limit of our UPLC-UV detection method.
In other efforts on this hypothesis, we added 1 mM α-acetoxy DMN (gift of L.A. Peterson, Univ. Minnesota)54 plus an excess of hog liver esterase (to generate α-hydroxy DMN, which has a t1/2 of 7 s)55 to P450 2E1, NADPH-P450 reductase, cytochrome b5, and NADPH. No evidence for production of N-nitroso-N-methylformamide was obtained in these experiments either.
DISCUSSION
The oxidation of the N-alkyl nitrosamines DMN, DEN, and MEN was examined with rat and human P450 2E1, the major enzyme involved in DMN oxidation. Kinetic deuterium isotope effects were measured, and the C-H bond-breaking step was found to be at least partially rate-limiting in DMN oxidation. As in the case of the metabolism of DMN and DEN by P450 2A6,15 P450 2E1 formed not only the aldehyde products but also the corresponding carboxylic acids. The lack of a lag phase in the production of the acids (Figures 4, 6) and the results of the pulse-chase experiments (Figure 7) indicate a largely processive nature of the conversion of DMN and DEN to the respective carboxylic acids, which was observed previously in the human P450 2E1 oxidation of CH3CH2OH to CH3CO2H.47
P450 2E1 showed a preference for the oxidation of the ethyl moiety relative to methyl, as judged by the catalytic efficiencies (kcat/Km), which showed about a 2-fold difference (Table 1). The same difference was also seen in comparing the two alkyl substituents of MEN (Table 1). However the ethyl selectivity (i.e. DEN > DMN) was not as great as with P450 2A6 (~ 40-fold selectivity).15
An intramolecular non-competitive deuterium isotope effect (Table 2) is an estimate of the intrinsic isotope effect, with the caveat that secondary kinetic isotope effects might be included.44 The estimated isotope effects were 8.4–8.8 for DMN and 6.3–7.0 for DEN for human P450 2E1 (Table 2), values that are consistent with many other P450 reactions.21, 56–58 In experiments with intermolecular competition (requiring substrate exchange, i.e. dissociation and re-association) or competition between the two alkyl groups on a single substrate (requiring substrate flipping), little attenuation was observed (Table 2). Thus, we conclude that substrate exchanges freely in the active site of P450 2E1. In a series of kinetic isotope effect experiments with MEN, similar conclusions could be reached (although the value of 2.9 seen for the competition between d0 and d5 MEN was lower) (Table 3).
Comparisons between the kinetic isotope effects measured in non-competitive intermolecular experiments (Table 4, Figures 1, 2) with the higher values in Table 2 are useful. In the simplest case, the values (D(V/K)) = 3.7 and 1.2 for DMN and DEN, respectively (Table 4, Figure 2) may be compared with the respective values of 8.4–8.8 and 6.3–7.0 in Table 2. These values indicate that (i) C-H bond breaking is partially rate-limiting in the oxidation of DMN and (ii) C-H bond breaking is not rate-limiting in DEN oxidation.
The results with MEN in the remainder of Table 4 and Figure 3 are more complex. These are indicative of “metabolic switching,” i.e. a shift in oxidation from one alkyl group (ethyl or methyl) to the other due to deuteration.46 The overall yields of product formation (acetaldehyde plus formaldehyde) are approximately constant when one of the alkyl chains is deuterated (but less when both are). A simplified overall conclusion is that the overall rate of oxidation of MEN is not changed by deuteration at a particular carbon, but the intramolecular site of oxidation is. These results are consistent with the lack of attenuation of the (apparent) intrinsic kinetic deuterium isotope effect. Thus, for MEN and DEN (Table 2), a step(s) other than C-H bond breaking is largely rate-limiting, and deuteration at one part of the molecule will block oxidation but tumbling/exchange occurs to change the site of oxidation but not the overall rate. However, the results with DMN showed a lack of a switch from N-dealkylation to denitrosation due to deuteration, consistent with the proposal (Scheme 2)20 that both pathways involve initial hydrogen abstraction. The possibility of an initial 1-electron abstraction from the nitrogen atom is considered unlikely with N-nitrosamines in light of the limited electron density of the nitrogen atom (as shown by 15N NMR)59 and the high kinetic isotope effects (Tables 2–4). With DEN, there is a lack of a switch to β-hydroxylation, based on the lack of detection of that product with or without deuteration of the methylenes of DEN (vide supra).
The reason for the greater attenuation of the kinetic isotope effect in DEN compared to DMN is not clear. The same pattern was seen with P450 2A6.15 The C-H bond in a methylene group should be ~ 6 kcal mol−1 weaker than in a methyl60, 61 (without consideration of the influence of the nitrosamine), due to an inductive effect. Oxidation is more efficient at the methylene carbon (i.e., DEN > DMN, Table 1) but the difference is only ~ two-fold (cf. 40-fold for P450 2A6).15 Which P450 step(s) in catalysis (with DEN) is rate-limiting is not clear. We previously reported that P450 2E1 reduction (of the ferric iron) is rapid even in the absence of substrate.62 A step following product formation is limiting in the oxidation of ethanol, as judged by the burst kinetics.21
One of the reasons for initiating this study, as well as those with P450 2E1/ethanol21 and P450 2A6/DMN/DEN,15 was the initial observation by Keefer et al.19 on the protective effect of DMN deuteration against liver cancer in rats. Later work with rat liver microsomes showed a kinetic deuterium isotope effect (for DMN N-demethylation) only on Km but not Vmax.20 Such a pattern was observed in the oxidation of ethanol, in our own work, and rationalized in the context of burst kinetics and a rate-limiting step following product formation.21 We did not find such a burst for aldehyde formation with DMN or DEN (Figure 4). P450 2E1 is now recognized to be the major enzyme involved in DMN oxidation in rat16, 17 and human11 liver. However, the kinetic deuterium isotope effects we measured for N-dealkylation were only for kcat and not Km (Figures 1, 2, Table 4).
Our N-dealkylation results (Figure 1) clearly differ from those of Wade et al.20 We propose that the use of the Nash colorimetric assay35 is not sensitive enough to accurately measure low rates of formaldehyde formation, due to the issues with background formaldehyde, which have complicated our own studies. We found that we could only reliably assay formaldehyde with HPLC-based methods (with derivatives), preferably using isotopically-labeled DMN (14C, 13C, or 2H). Even (LC-MS) assays generating H13CHO were problematic under sensitive conditions and required numerous controls.
Processivity was observed in the conversion of DMN and DEN to the respective carboxylic acids (HCO2H and CH3CO2H), i.e. the intermediate did not readily exchange with added aldehydes. Evidence for processivity is based on the lack of any lag in the formation of acids from nitrosamines (Figure 4), which would have been expected with free dissociation of aldehyde (Figure 5). Further, pulse-chase experiments did not show complete equilibration of the aldehydes with the P450-bound intermediate (Figure 7).
Several possibilities can be considered regarding the observed processivity. One is that the intermediate aldehydes are inherently tightly bound to P450 2E1. However, this was not found to be the case previously.47 Another possibility we considered was that the α-hydroxynitrosamines might be directly oxidized, in part, to yield nitrosamides (Scheme 3, step 12). This explanation has attraction, in that the relevant nitrosamides are known to be mutagens34 and also to break down to carboxylic acids (Scheme 3, step 15). However, we could not detect either N-nitroso-N-methylformamide or N-nitroso-N-ethylacetamide using UV or MS detection. Another possibility is that some aspect of the aldehyde hydration/dehydration process is missing in the kinetic analysis, e.g., several of the rate constants for hydration and rehydration of aldehydes are either slow (in solution, i.e. < 0.1 s−1, Scheme 363, 64) or unknown in the presence of the enzyme. At least three mechanisms are possible for P450 oxidation of an aldehyde65 and, depending on which is used, the aldehyde might require a certain pathway (Scheme 3).
Another possibility for the processivity has been proposed, with kinetic modeling, for the same phenomenon observed in P450 2A6.15 The gist of the mechanism is that the P450 undergoes an initial conformation change (for which there is general evidence based upon substrate binding66), α-oxidation of the nitrosamine occurs, and then the second oxidation occurs while the enzyme is still in the “reactive” conformation (before it relaxes). We did not do the kinetic modeling with P450 2E1, although the P450 2A6 model can be readily adapted with some numerical changes. The modeling admittedly has arbitrary rate constants and does not in itself prove the mechanism. Nevertheless, a model similar to that proposed for P450 2A615 is certainly viable and can explain the phenomenon.
In light of some of the unresolved issues regarding the P450 oxidation of nitrosamines, we also considered the oxidation of DMN by rat P450 2B1. The structures of P450s 2A622 and 2E123 indicate small active sites, with some substrates (including an N-nitrosamine) fitting rather tightly.24 The features of oxidation of small alkyl nitrosamines considered here (kinetic deuterium isotope effects, processivity) are of interest in the sense that they may be related to the size of the active site. Earlier studies indicated that other P450s can oxidize DMN to HCHO, including rat P450 2B1.25, 26 Crystal structures of the closely related rabbit P450 2B427 and human P450 2B667 enzymes have been determined and indicate much larger binding sites, which probably apply to rat P450 2B1 as well in light of similar catalytic selectivities. We did some investigations with P450 2B1 and found, as expected, 17, 26 a higher Km (2.5 mM). Nevertheless several of the phenomena observed with P450s 2A6 and 2E1 were also present with P450 2B1, including the oxidation of DMN to both HCHO and HCO2H without a lag (Figure 6) and the lack of equilibration of added HCHO with the enzyme in the pulse chase experiments (Figure 7). We suggest that (i) the small size of the active sites of P450s 2A6 and 2E1 is not the major factor in at least some of the observed processive phenomena and (ii) that these phenomena may be more widespread among the P450s that can carry out these reactions.
In summary, we have examined several aspects of the oxidation of DMN and related alkyl N-nitrosamines by P450 2E1, the major enzyme involved in the activation of this substrate. A large intrinsic kinetic deuterium isotope was observed for DMN N-demethylation, which was only partially attenuated in non-competitive intermolecular studies with rat and human P450 2E1 and indicative of a partial rate-limiting contribution of C-H bond cleavage. The results can explain the attenuated hepatocarcinogenicity of deuterated DMN in rats.19 As in the case of P450 2A6,15 oxidation of DMN and DEN occurs to give aldehydes and carboxylic acids in a rather processive manner. Several explanations can be considered but the most likely involve conformational changes or possibly slow carbonyl hydration/dehydration steps.65 We were unable to demonstrate postulated oxidation to N-nitrosamides, although the possibility should not be dismissed in light of the technical limitations in our work.
Supplementary Material
Acknowledgments
Funding: This work was supported, in whole or in part, by National Institutes of Health Research Grants R37 CA0090426 (F.P.G.), T32 ES007028 (F.P.G., M.W.C.), F32 ES012123 (M.W.C.), and P30 ES000267 (F.P.G.).
We thank L. M. Folkmann and M. V. Martin for preparing NADPH-P450 reductase and cytochrome b5, N. G. Avadhani for livers of ethanol-treated rats, and K. Trisler for assistance in preparation of the manuscript.
ABBREVIATIONS
- DEN
N,N-diethylnitrosamine (N-nitrosodiethylamine)
- DMN
N,N-dimethylnitrosamine (N-nitrosodimethylamine)
- HPLC
high performance liquid chromatography
- HPLC-MS
high performance liquid chromatography with MS detection
- HPLC-UV
HPLC with UV detection
- HRMS
high resolution mass spectrometry
- LC
liquid chromatography
- MEN
N-methyl-N-ethylnitrosamine (N-nitroso-N-methylethylamine)
- MS
mass spectrometry
- P450
cytochrome P450
- UPLC
ultra-performance liquid chromatography
- UPLC-MS
ultra-performance liquid chromatography with MS detection
- UPLC-UV
ultra-performance liquid chromatography with UV detection. The terms DV and D(V/K) refer to kinetic deuterium isotope effects on Vmax (or kcat) and Vmax/Km (or kcat/Km), respectively, using the nomenclature of Northrop.41
Footnotes
footnote 1: These assays were done with [d4]-DMN (HD2C-N(N=O)CD2H) to reduce the contribution of background HCHO in the LC-MS assays and because [14C]-DMN was no longer available at the time that these studies were done. The intrinsic kinetic deuterium isotope effect was low for P450 2B1 (2.0, vide supra). The apparent kcat (0.053 s−1, Supporting Information Figure S6), measured for the production of DCHDO, was corrected by multiplying by 2 because the statistical chance of breaking a C-D bond (in –CD2H) is twice that for a C-H bond but the apparent intrinsic kinetic isotope effect of 2.0 makes this one-half as rapid, thus suggesting a yield of HCDO equal to DCDO.
Conflict of Interest Statement: The authors declare no competing financial interests.
Synthesis of deuterated MEN substrates and 1H-NMR spectra, LC-MS of 2,4-dinitrophenyl hydrazone of HCHO formed from DMN, binding spectra of P450 2E1 with DMN and DEN, Dynafit modeling of theoretical time courses of formation of HCHO and HCO2H, steady-state kinetics of denitrosation products, steady-state kinetics of N-demethylation of [d4]-DMN by rat P450 2B1, and HPLC-UV of N-nitroso-N-methylformamide. This material is available free of charge via the Internet at http://pubs.acs.org.
References
- 1.Ortiz de Montellano PR, editor. Cytochrome P450: Structure, Mechanism, and Biochemistry. 3. Kluwer Academic/Plenum Publishers; New York: 2005. [Google Scholar]
- 2.Jakoby WB. Detoxication enzymes. In: Jakoby WB, editor. Enzymatic Basis of Detoxication. Vol. 1. Academic Press; New York: 1980. pp. 1–6. [Google Scholar]
- 3.Guengerich FP. Human cytochrome P450 enzymes. In: Ortiz de Montellano PR, editor. Cytochrome P450: Structure, Mechanism, and Biochemistry. 3. Kluwer Academic/Plenum Press; New York: 2005. pp. 377–530. [Google Scholar]
- 4.Mueller GC, Miller JA. The metabolism of 4-dimethylaminoazobenzene by rat liver homogenates. J Biol Chem. 1948;176:535–544. [PubMed] [Google Scholar]
- 5.Guengerich FP. Metabolism of chemical carcinogens. Carcinogenesis. 2000;21:345–351. doi: 10.1093/carcin/21.3.345. [DOI] [PubMed] [Google Scholar]
- 6.Rendic S, Guengerich FP. Contributions of human enzymes in carcinogen metabolism. Chem Res Toxicol. 2012;25:1316–1383. doi: 10.1021/tx300132k. [DOI] [PMC free article] [PubMed] [Google Scholar]
- 7.Miller JA. Carcinogenesis by chemicals: an overview. G.H.A Clowes Memorial Lecture. Cancer Res. 1970;30:559–576. [PubMed] [Google Scholar]
- 8.Guengerich FP. Cytochrome P450 and chemical toxicology. Chem Res Toxicol. 2008;21:70–83. doi: 10.1021/tx700079z. [DOI] [PubMed] [Google Scholar]
- 9.Preussmann R, Eisenbrand G. N-Nitroso carcinogens in the environment. In: Searle CE, editor. Chemical Carcinogens. 2. Vol. 2. American Chemical Society; Washington, D.C: 1984. pp. 829–868. [Google Scholar]
- 10.Hecht SS. Progress and challenges in selected areas of tobacco carcinogenesis. Chem Res Toxicol. 2008;21:160–171. doi: 10.1021/tx7002068. [DOI] [PMC free article] [PubMed] [Google Scholar]
- 11.Wrighton SA, Thomas PE, Molowa DT, Haniu M, Shively JE, Maines SL, Watkins PB, Parker G, Mendez-Picon G, Levin W, Guzelian PS. Characterization of ethanol-inducible human liver N-nitrosodimethylamine demethylase. Biochemistry. 1986;25:6731–6735. doi: 10.1021/bi00370a001. [DOI] [PubMed] [Google Scholar]
- 12.Yamazaki H, Inui Y, Yun CH, Mimura M, Guengerich FP, Shimada T. Cytochrome P450 2E1 and 2A6 enzymes as major catalysts for metabolic activation of N-nitrosodialkylamines and tobacco-related nitrosamines in human liver microsomes. Carcinogenesis. 1992;13:1789–1794. doi: 10.1093/carcin/13.10.1789. [DOI] [PubMed] [Google Scholar]
- 13.Crespi CL, Penman BW, Leakey JAE, Arlotto MP, Stark A, Parkinson A, Turner T, Steimel DT, Rudo K, Davies RL, Langenbach R. Human cytochrome P450IIA3: cDNA sequence, role of the enzyme in the metabolic activation of promutagens, comparison to nitrosamine activation by human cytochrome P450IIE1. Carcinogenesis. 1990;11:1293–1300. doi: 10.1093/carcin/11.8.1293. [DOI] [PubMed] [Google Scholar]
- 14.Crespi CL, Penman BW, Gelboin HV, Gonzalez FJ. A tobacco smoke-derived nitrosamine, 4-(methylnitrosamino)-1-(3-pyridyl)-1-butanone, is activated by multiple human cytochrome P450s including the polymorphic human cytochrome P4502D6. Carcinogenesis. 1991;12:1197–1201. doi: 10.1093/carcin/12.7.1197. [DOI] [PubMed] [Google Scholar]
- 15.Chowdhury G, Calcutt MW, Guengerich FP. Oxidation of N-nitrosodimethylamine and N-nitrosodiethylamine by human cytochrome P450 2A6: sequential oxidation to carboxylic acids and analysis of reaction steps. J Biol Chem. 2010;285:8031–8044. doi: 10.1074/jbc.M109.088039. [DOI] [PMC free article] [PubMed] [Google Scholar]
- 16.Tu YY, Yang CS. Demethylation and denitrosation of nitrosamines by cytochrome P-450 isozymes. Arch Biochem Biophys. 1985;242:32–40. doi: 10.1016/0003-9861(85)90476-x. [DOI] [PubMed] [Google Scholar]
- 17.Levin W, Thomas PE, Oldfield N, Ryan DE. N-Demethylation of N-nitrosodimethylamine catalyzed by purified rat hepatic microsomal cytochrome P-450: isozyme specificity and role of cytochrome b5. Arch Biochem Biophys. 1986;248:158–165. doi: 10.1016/0003-9861(86)90412-1. [DOI] [PubMed] [Google Scholar]
- 18.Kang JS, Wanibuchi H, Morimura K, Gonzalez FJ, Fukushima S. Role of CYP2E1 in diethylnitrosamine-induced hepatocarcinogenesis in vivo. Cancer Res. 2007;67:11141–11146. doi: 10.1158/0008-5472.CAN-07-1369. [DOI] [PubMed] [Google Scholar]
- 19.Keefer LK, Lijinsky W, Garcia H. Deuterium isotope effect on the carcinogenicity of dimethylnitrosamine in rat liver. J Natl Cancer Inst. 1973;51:299–302. doi: 10.1093/jnci/51.1.299. [DOI] [PubMed] [Google Scholar]
- 20.Wade D, Yang CS, Metral CJ, Roman JM, Hrabie JA, Riggs CW, Anjo T, Keefer LK, Mico BA. Deuterium isotope effect on denitrosation and demethylation of N-nitrosodimethylamine by rat liver microsomes. Cancer Res. 1987;47:3373–3377. [PubMed] [Google Scholar]
- 21.Bell LC, Guengerich FP. Oxidation kinetics of ethanol by human cytochrome P450 2E1. Rate-limiting product release accounts for effects of isotopic hydrogen substitution and cytochrome b5 on steady-state kinetics. J Biol Chem. 1997;272:29643–29651. doi: 10.1074/jbc.272.47.29643. [DOI] [PubMed] [Google Scholar]
- 22.Yano JK, Hsu MH, Griffin KJ, Stout CD, Johnson EF. Structures of human microsomal cytochrome P450 2A6 complexed with coumarin and methoxsalen. Nat Struct Biol. 2005;12:822–823. doi: 10.1038/nsmb971. [DOI] [PubMed] [Google Scholar]
- 23.Porubsky PR, Meneely KM, Scott EE. Structures of human cytochrome P-450 2E1. Insights into the binding of inhibitors and both small molecular weight and fatty acid substrates. J Biol Chem. 2008;283:33698–33707. doi: 10.1074/jbc.M805999200. [DOI] [PMC free article] [PubMed] [Google Scholar]
- 24.Devore NM, Scott EE. Nicotine and 4-(methylnitrosamino)-1-(3-pyridyl)-1-butanone binding and access channel in human cytochrome P450 2A6 and 2A13 enzymes. J Biol Chem. 2012;287:26576–26585. doi: 10.1074/jbc.M112.372813. [DOI] [PMC free article] [PubMed] [Google Scholar]
- 25.Guengerich FP. Separation and purification of multiple forms of microsomal cytochrome P-450. Activities of different forms of cytochrome P-450 towards several compounds of environmental interest. J Biol Chem. 1977;252:3970–3979. [PubMed] [Google Scholar]
- 26.Guengerich FP, Dannan GA, Wright ST, Martin MV, Kaminsky LS. Purification and characterization of liver microsomal cytochromes P-450: electrophoretic, spectral, catalytic, and immunochemical properties and inducibility of eight isozymes isolated from rats treated with phenobarbital or β-naphthoflavone. Biochemistry. 1982;21:6019–6030. doi: 10.1021/bi00266a045. [DOI] [PubMed] [Google Scholar]
- 27.Scott EE, White MA, He YA, Johnson EF, Stout CD, Halpert JR. Structure of mammalian cytochrome P450 2B4 complexed with 4-(4-chlorophenyl)imidazole at 1.9-Å resolution: insight into the range of P450 conformations and the coordination of redox partner binding. J Biol Chem. 2004;279:27294–27301. doi: 10.1074/jbc.M403349200. [DOI] [PubMed] [Google Scholar]
- 28.Guengerich FP, Bartleson CJ. Analysis and characterization of enzymes and nucleic acids. In: Hayes AW, editor. Principles and Methods of Toxicology. 5. CRC Press; Boca Raton, FL: 2007. pp. 1981–2048. [Google Scholar]
- 29.Bansal S, Liu C-P, Sepuri NBV, Anandatheerthavarada HK, Guengerich FP, Avadhani NG. Mitochondria-targeted cytochrome P450 2E1 preferentially induces oxidative damage and augments alcohol mediated mitochodrial dysfunction in cultured cells. J Biol Chem. 2010;285:24609–24619. doi: 10.1074/jbc.M110.121822. [DOI] [PMC free article] [PubMed] [Google Scholar]
- 30.Gillam EMJ, Guo Z, Guengerich FP. Expression of modified human cytochrome P450 2E1 in Escherichia coli, purification, and spectral and catalytic properties. Arch Biochem Biophys. 1994;312:59–66. doi: 10.1006/abbi.1994.1280. [DOI] [PubMed] [Google Scholar]
- 31.Hanna IH, Teiber JF, Kokones KL, Hollenberg PF. Role of the alanine at position 363 of cytochrome P450 2B2 in influencing the NADPH- and hydroperoxide-supported activities. Arch Biochem Biophys. 1998;350:324–332. doi: 10.1006/abbi.1997.0534. [DOI] [PubMed] [Google Scholar]
- 32.Omura T, Sato R. The carbon monoxide-binding pigment of liver microsomes. I Evidence for its hemoprotein nature. J Biol Chem. 1964;239:2370–2378. [PubMed] [Google Scholar]
- 33.Guengerich FP. Reduction of cytochrome b5 by NADPH-cytochrome P450 reductase. Arch Biochem Biophys. 2005;440:204–211. doi: 10.1016/j.abb.2005.06.019. [DOI] [PubMed] [Google Scholar]
- 34.Elespuru RK, Saavedra JE, Kovatch RM, Lijinsky W. Examination of α-carbonyl derivatives of nitrosodimethylamine and ethylnitrosomethylamine as putative proximate carcinogens. Carcinogenesis. 1993;14:1189–1193. doi: 10.1093/carcin/14.6.1189. [DOI] [PubMed] [Google Scholar]
- 35.Nash T. The colorimetric estimation of formaldehyde by means of the Hantzsch reaction. Biochem J. 1953;55:416–421. doi: 10.1042/bj0550416. [DOI] [PMC free article] [PubMed] [Google Scholar]
- 36.Cai H, Guengerich FP. Mechanism of aqueous decomposition of trichloroethylene oxide. J Am Chem Soc. 1999;121:11656–11663. [Google Scholar]
- 37.Yoo JSH, Cheung RJ, Patten CJ, Wade D, Yang CS. Nature of N-nitrosodimethylamine demethylase and its inhibitors. Cancer Res. 1987;47:3378–3383. [PubMed] [Google Scholar]
- 38.Clejan LA, Cederbaum AI. Role of cytochrome P450 in the oxidation of glycerol by reconstituted systems and microsomes. FASEB J. 1992;6:765–770. doi: 10.1096/fasebj.6.2.1537467. [DOI] [PubMed] [Google Scholar]
- 39.Lorr NA, Tu YY, Yang CS. The nature of nitrosamine denitrosation by rat liver microsomes. Carcinogenesis. 1982;3:1039–1043. doi: 10.1093/carcin/3.9.1039. [DOI] [PubMed] [Google Scholar]
- 40.Cha W, Nalinakumari B, Fox P. High-performance liquid chromatography for determination of N-nitrosodimethylamine in water. Proc Water Environment Federation, WEFTEC; 2006; Alexandria, VA: Water Environment Federation; 2006. pp. 889–900. ( www.environmental-expert.com/Files/5306/articles/8712/065.pdf) [Google Scholar]
- 41.Northrop DB. Deuterium and tritium kinetic isotope effects on initial rates. Methods Enzymol. 1982;87:607–625. doi: 10.1016/s0076-6879(82)87032-8. [DOI] [PubMed] [Google Scholar]
- 42.Thomas PE, Bandiera S, Maines SL, Ryan DE, Levin W. Regulation of cytochrome P-450j, a high-affinity N-nitrosodimethylamine demethylase, in rat hepatic microsomes. Biochemistry. 1987;26:2280–2289. doi: 10.1021/bi00382a031. [DOI] [PubMed] [Google Scholar]
- 43.Northrop DB. Steady-state analysis of kinetic isotope effects in enzymic reactions. Biochemistry. 1975;14:2644–2651. doi: 10.1021/bi00683a013. [DOI] [PubMed] [Google Scholar]
- 44.Matsson O, Westaway KC. Secondary deuterium kinetic isotope effects and transition state structure. Adv Phys Org Chem. 1998;31:143–248. [Google Scholar]
- 45.Jalas JR, McIntee EJ, Kenney PM, Upadhyaya P, Peterson LA, Hecht SS. Stereospecific deuterium substitution attenuates the tumorigenicity and metabolism of the tobacco-specific nitrosamine 4-(methylnitrosamino)-1-(3-pyridyl)-1-butanone (NNK) Chem Res Toxicol. 2003;16:794–806. doi: 10.1021/tx034022l. [DOI] [PubMed] [Google Scholar]
- 46.Miwa GT, Lu AYH. Kinetic isotope effects and ‘metabolic switching’ in cytochrome P450-catalyzed reactions. Bio Essays. 1987;7:215–219. doi: 10.1002/bies.950070506. [DOI] [PubMed] [Google Scholar]
- 47.Bell-Parikh LC, Guengerich FP. Kinetics of cytochrome P450 2E1-catalyzed oxidation of ethanol to acetic acid via acetaldehyde. J Biol Chem. 1999;274:23833–23840. doi: 10.1074/jbc.274.34.23833. [DOI] [PubMed] [Google Scholar]
- 48.Keefer LK, Anjo T, Wade D, Wang T, Yang CS. Concurrent generation of methylamine and nitrite during denitrosation of N-nitrosodimethylamine by rat liver microsomes. Cancer Res. 1987;47:447–452. [PubMed] [Google Scholar]
- 49.Streeter AJ, Nims RW, Sheffels PR, Heur Y, Yang CS, Mico BA, Gombar CT, Keefer LK. Metabolic denitrosation of N-nitrosodimethylamine in vivo in the rat. Cancer Res. 1990;40:1144–1150. [PubMed] [Google Scholar]
- 50.Singh UP, Obayashi E, Takahashi S, Iizuka T, Shoun H, Shiro Y. The effects of heme modification on reactivity, ligand binding properties and iron-coordination structures of cytochrome P450nor. Biochim Biophys Acta. 1998;1384:103–111. doi: 10.1016/s0167-4838(98)00006-5. [DOI] [PubMed] [Google Scholar]
- 51.Franke A, Stochel G, Jung C, Van Eldik R. Substrate binding favors enhanced NO binding to P450cam. J Am Chem Soc. 2004;126:4181–4191. doi: 10.1021/ja038774d. [DOI] [PubMed] [Google Scholar]
- 52.Argus MF, Arcos JC, Pastor KM, Wu BC, Venkatesan N. Dimethylnitrosamine-demethylase: absence of increased enzyme catabolism and multiplicity of effector sites in repression. Hemoprotein involvement. Chem-Biol Interactions. 1976;13:127–140. doi: 10.1016/0009-2797(76)90002-8. [DOI] [PubMed] [Google Scholar]
- 53.Lai DY, Myers SC, Woo YT, Greene EJ, Friedman MA, Argus MF, Arcos JC. Role of dimethylnitrosamine-demethylase in the metabolic activation of dimethylnitrosamine. Chem-Biol Interactions. 1979;28:107–126. doi: 10.1016/0009-2797(79)90118-2. [DOI] [PubMed] [Google Scholar]
- 54.Peterson LA, Mathew R, Hecht SS. Quantitation of microsomal α-hydroxylation of the tobacco-specific nitrosamine, 4-(methylnitrosamino)-1-(3-pyridyl)-1-butanone. Cancer Res. 1991;51:5495–5500. [PubMed] [Google Scholar]
- 55.Mesic M, Fishbein JC. Effects of structure on the reactivity of α-hydroxydialkylnitrosamines in aqueous solutions. J Am Chem Soc. 1996;118:7412–7413. [Google Scholar]
- 56.Groves JT, McClusky GA, White RE, Coon MJ. Aliphatic hydroxylation by highly purified liver microsomal cytochrome P-450: Evidence for a carbon radical intermediate. Biochem Biophys Res Commun. 1978;81:154–160. doi: 10.1016/0006-291x(78)91643-1. [DOI] [PubMed] [Google Scholar]
- 57.Guengerich FP, Krauser JA, Johnson WW. Rate-limiting steps in oxidations catalyzed by rabbit cytochrome P450 1A2. Biochemistry. 2004;43:10775–10788. doi: 10.1021/bi0491393. [DOI] [PubMed] [Google Scholar]
- 58.Yun CH, Kim KH, Calcutt MW, Guengerich FP. Kinetic analysis of oxidation of coumarins by human cytochrome P450 2A6. J Biol Chem. 2005;280:12279–12291. doi: 10.1074/jbc.M411019200. [DOI] [PubMed] [Google Scholar]
- 59.Kupper R, Hilton BD, Kroeger-Koepke MB, Koepke SR, Michejda CJ. 15N and 13C NMR study of N-methyl-N-nitrosoaniline and its ring-substituted derivatives. J Org Chem. 1984;49:3781–3784. [Google Scholar]
- 60.Kerr JA. Bond dissociation energies by kinetic meethods. Chem Rev. 1966;66:465–500. [Google Scholar]
- 61.Carey FA, Sundberg RJ. Advanced Organic Chemistry, Part A: Structure and Mechanisms. Plenum Press; New York: 1990. p. 683. [Google Scholar]
- 62.Guengerich FP, Johnson WW. Kinetics of ferric cytochrome P450 reduction by NADPH-cytochrome P450 reductase: Rapid reduction in absence of substrate and variations among cytochrome P450 systems. Biochemistry. 1997;36:14741–14750. doi: 10.1021/bi9719399. [DOI] [PubMed] [Google Scholar]
- 63.Greenzaid P, Luz Z, Samuel D. A nuclear magnetic resonance study of the reversible hydration of aliphatic aldehydes and ketones. II The acid-catalyzed oxygen exchange of acetaldehyde. J Am Chem Soc. 1967;89:756–759. [Google Scholar]
- 64.Greenzaid P, Luz Z, Samuel D. A nuclear magnetic resonance study of the reversible hydration of aliphatic aldehydes and ketones. I Oxygen-17 and proton spectra and equilibrium constants. J Am Chem Soc. 1967;89:749–755. [Google Scholar]
- 65.Guengerich FP, Sohl CD, Chowdhury G. Multi-step oxidations catalyzed by cytochrome P450 enzymes: processive vs. distributive kinetics and the issue of carbonyl oxidation. Arch Biochem Biophys. 2011;507:126–134. doi: 10.1016/j.abb.2010.08.017. [DOI] [PMC free article] [PubMed] [Google Scholar]
- 66.Ortiz de Montellano PR, De Voss JJ. Substrate oxidation by cytochrome P450 enzymes. In: Ortiz de Montellano PR, editor. Cytochrome P450: Structure, Mechanism, and Biochemistry. 3. Kluwer Academic/Plenum Publishers; New York: 2005. pp. 183–245. [Google Scholar]
- 67.Shah MB, Pascual J, Zhang QH, Stout CD, Halpert JR. Structures of cytochrome P450 2B6 bound to 4-benzylpyridine and 4-(4-nitrobenzyl)pyridine: Insight into inhibitor binding and rearrangement of active site side chains. Mol Pharmacol. 2011;80:1047–1055. doi: 10.1124/mol.111.074427. [DOI] [PMC free article] [PubMed] [Google Scholar]
Associated Data
This section collects any data citations, data availability statements, or supplementary materials included in this article.