Abstract
Murine models are valuable instruments in defining the pathogenesis of diabetic nephropathy (DN), but they only partially recapitulate disease manifestations of human DN, limiting their utility. To define the molecular similarities and differences between human and murine DN, we performed a cross-species comparison of glomerular transcriptional networks. Glomerular gene expression was profiled in patients with early type 2 DN and in three mouse models (streptozotocin DBA/2, C57BLKS db/db, and eNOS-deficient C57BLKS db/db mice). Species-specific transcriptional networks were generated and compared with a novel network-matching algorithm. Three shared human–mouse cross-species glomerular transcriptional networks containing 143 (Human-DBA STZ), 97 (Human-BKS db/db), and 162 (Human-BKS eNOS−/− db/db) gene nodes were generated. Shared nodes across all networks reflected established pathogenic mechanisms of diabetes complications, such as elements of Janus kinase (JAK)/signal transducer and activator of transcription (STAT) and vascular endothelial growth factor receptor (VEGFR) signaling pathways. In addition, novel pathways not previously associated with DN and cross-species gene nodes and pathways unique to each of the human–mouse networks were discovered. The human–mouse shared glomerular transcriptional networks will assist DN researchers in selecting mouse models most relevant to the human disease process of interest. Moreover, they will allow identification of new pathways shared between mice and humans.
Diabetic nephropathy (DN) is the leading cause of end-stage renal disease in the United States (1). Advances in the understanding of the pathogenesis of DN have revealed multiple genetic and environmental factors that affect many renal and extrarenal biological pathways (2). These factors help lead to the gradual and inexorable scarring of both glomerular and tubulointerstitial compartments of the kidney that results in renal functional decline and finally failure. Despite these advances, the functional link between signaling alterations and clinical progression in human DN remains elusive. Good experimental models that reliably reproduce the human disease process would help lead to accurate identification of these linkages and guide development of optimal therapeutic interventions (2,3).
Much of the basic research in DN in the past decade has focused on the use of mouse models because of the ease of genetic manipulation and relatively low maintenance costs of mice compared with other mammalian models (2). In the best models, only the early manifestations of DN reliably occur; these manifestations include moderately elevated albuminuria, mesangial expansion, mild glomerulosclerosis, and reduction in glomerular podocyte number. The lack of progression in diabetic mouse models could be due to absent or muted pathogenic responses and/or the presence of distinctive protective mechanisms. Although hypothesis-driven research using mouse models has elucidated a variety of signaling pathways that almost certainly have a pathogenic role in human DN (2,4), a systems approach to the identification of pathways and networks of abnormalities in both humans and mouse models of DN would allow unbiased dissection of molecular pathways and networks that are common, or unique, between species. With such knowledge, murine models could be derived that better reproduce the human pathophysiology, and experiments could be designed with current mouse models of DN that share regulatory pathways of interest with human DN.
In the current study, we profiled glomerular gene expression in a cohort of patients with early type 2 DN and in three reproducible mouse models of DN. Using these profiles, we generated four transcriptional networks (one human and three mouse) and compared them across species with a novel network-matching algorithm. This approach produced three shared human–mouse cross-species transcriptional networks. All three shared networks were enriched for several transcriptional pathways known to have a possible role in the pathogenesis of DN as well as for novel pathways not formally associated with DN. These disease network maps will enable the DN research community to interrogate novel pathways in well-established model systems, and permit a priori selection of the mouse model that most closely recapitulates the human DN pathway under investigation.
RESEARCH DESIGN AND METHODS
Human and mouse samples.
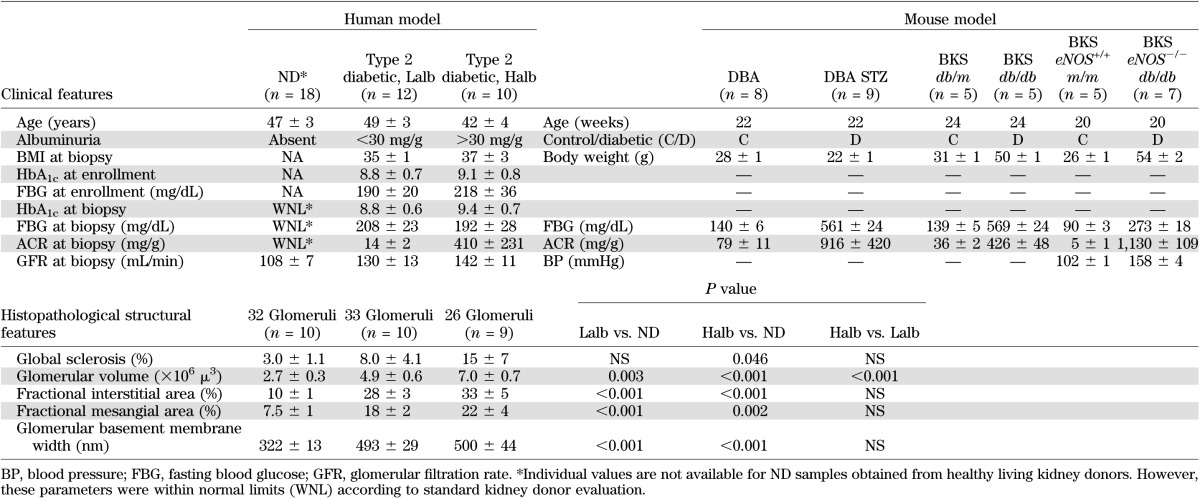
Kidney biopsy specimens were procured from 22 Southwestern American Indians enrolled in a randomized, placebo-controlled clinical trial to evaluate the renoprotective efficacy of losartan in type 2 diabetes (clinical trial reg. no. NCT00340678, clinicaltrials.gov). Protocol biopsies were performed 5–6 years into the study, after obtaining informed consent. These subjects were followed longitudinally for many years prior to enrollment in the clinical trial, and the occurrence and severity of diabetes and DN were carefully documented. The cohort was divided into two groups according to their average albumin/creatinine ratio (ACR) around the time of biopsy (±6 months) based on clinical practice guidelines and recommendations (5). Subjects with a urinary ACR of <30 mg/g (average, 14 ± 2 mg/g; range, 5–26 mg/g) were placed into the low albuminuric group (Lalb; n = 12), and subjects with an ACR >30 mg/g (average, 410 ± 231 mg/g; range, 34–2426 mg/g) were placed in the high albuminuric group (Halb; n = 10) (Table 1). The Halb and Lalb groups had similar HbA1c levels (9.1 ± 0.8 vs. 8.8 ± 0.7%, P = 0.78) at enrollment. For analysis of changes in glomerular gene expression with DN, Halb was compared with Lalb. At biopsy, the two groups showed no difference in age, BMI, HbA1c, fasting plasma glucose concentration, or measured glomerular filtration rate (Table 1). Table 1 also shows the histopathologic features in the human cohorts at time of biopsy. Glomerular gene expression profiles obtained from living donor kidney biopsies (nondiabetic [ND]; n = 18) were used for Halb versus ND and Lalb versus ND comparisons. In addition, glomerular gene expression profiles were obtained from patients with membranous nephropathy (MN; n = 21) and a separate cohort of ND patients (n = 5) to enable comparison with an ND proteinuric disease. All samples were processed according to the European Renal cDNA Bank protocol (6), and RNA was isolated from microdissected glomeruli as previously described (3). RNAs were hybridized to Affymetrix Human Genome U133 Plus Genechips (Affymetrix, Inc., Santa Clara, CA) and processed according to the manufacturer’s instructions (3).
TABLE 1.
Phenotypic characterization of human and mouse models
Glomerular RNA was also obtained from three mouse models of DN: low-dose streptozotocin (STZ)–induced diabetes in DBA2/J mice (DBA STZ mice), a type 1 diabetes model; homozygous leptin receptor mutation (leprdb/db) on a C57BLKS genetic background (BKS db/db mice), an obese type 2 diabetes model; and BKS db/db mice with targeted deletion of endothelial nitric oxide synthase (BKS eNOS−/− db/db mice), an obese and hypertensive type 2 diabetes model. DBA mice were fasted for 4 h and then given intraperitoneal injections of 40 mg/kg STZ or vehicle control daily for five consecutive days (7). BKS db/db and BKS eNOS−/− db/db mice became obese around 4 weeks of age and developed hyperglycemia between 4 and 8 weeks of age. DN, as evidenced by increased albuminuria, mesangial expansion, and podocyte loss was manifest in all mouse models after 12 weeks and was more severe after 24 weeks of diabetes (7–9). Diabetic mice were compared with ND littermate controls (Table 1). Standardized phenotypic analysis followed protocols established by the Animal Models of Diabetic Complications Consortium (www.diacomp.org) (2). Body weights, fasting blood glucose, and ACR were in agreement with previously published studies (7–10). When the mice were killed, glomeruli from diabetic and control mice were iron perfused and magnetically isolated (7). Total glomerular RNA was obtained using the RNeasy Mini Kit (Qiagen, Hilden, Germany). Gene expression profiling was performed (11) using Affymetrix GeneChip Mouse Genome 430 2.0 Arrays in the University of Michigan Microarray Core Facility according to the manufacturer’s instructions. These procedures were in accordance with the policies of the University of Michigan and Vanderbilt University Institutional Animal Care and Use Committees.
Verification of selected differentially expressed genes (DEGs) by quantitative real-time RT-PCR (qRT-PCR) was performed using Taqman Low Density Arrays (Applied Biosystems) per the manufacturer’s instructions. Reverse transcription of RNA and amplification were performed as described previously (12). Commercially available predeveloped Taqman reagents were used. Normalization of qRT-PCR results was performed using the geometric mean from multiple housekeeping genes for human (n = 4) and mouse (n = 5) samples) (13). Samples were assayed in duplicate. Human Halb and Lalb samples are the same as those shown in Table 1, unless otherwise specified. A subset of ND samples was used (average age, 49.8 + 6.1 years; n = 6 [3 males and 3 females]). Diabetic and control mouse samples were also identical to those in Table 1. Only cycle threshold (Ct) values <35 were used for analysis; thus, eight Halb samples assayed for COL1A1 and KIT and 11 Lalb samples assayed for KIT and interleukin (IL)-16 were analyzed (12). Fold differences were calculated using the delta-delta Ct method as previously described (14). Significance was set to P < 0.05.
Data analysis.
All quantitative phenotypic data were expressed as means ± SEM. Files containing raw mRNA expression data (CEL files) were processed, normalized, log transformed, and analyzed using the ChipInspector software (Genomatix Software, www.genomatix.de) (13). ChipInspector analyzes the expression signals at single-probe level, and they are reported summarized at gene-level annotation (15). The statistical method implemented in this software is based on a Student t test with a permuted background that enhances the original SAM algorithm by Tusher et al. (16). We used one class of exhaustive matching to detect the differentially regulated genes in the Halb versus Lalb, Halb versus ND, and Lalb versus ND human comparisons. We applied a false discovery rate of <1% on all datasets to detect the significantly regulated genes. Murine gene expression datasets were uploaded into Gene Expression Omnibus under GEO no. GSE33744. No individual-level genetic data can be publicly released from the Southwestern American Indian study. The three cross-species that shared transcriptional datasets will be available for data mining using state-of-the-art systems biology tools at www.nephromine.org.
To elucidate the functional relationships among the significantly regulated genes, transcriptional networks were generated using a natural language programming strategy (Bibliosphere module; Genomatix Software Suite). The natural language programming scans were set to establish a connection between any two genes if they were cocited in the same sentence in a PubMed abstract. As a second level of evidence for a gene-gene interaction, information defining transcription factor–target transcript pairs was retrieved by scanning differentially regulated transcripts for binding sites of coregulated transcription factors.
To compare the large transcriptional networks comprising thousands of gene nodes from humans and mice, an algorithm implemented in TALE (tool for approximate LargE graph matching) was used (17). TALE compares the network structure and extracts overlapping conserved relations between the query and database networks. To allow a cross-species transcriptional network comparison, all mouse genes were converted to human orthologs according to the National Center for Biotechnology Information (NCBI) Homolog build64 and Genomatix annotated ortholog database. This resulted in a loss of 10–13% of genes in the mouse transcriptional networks as no unique human orthologs could be identified for those genes. The three mouse networks were populated into the database, and the human network was used as the query network. Next, the most important genes (seed genes) were identified based on the degree of connectivity within the query (human) network (top 20% of total gene nodes in the network). Finally, a 10% mismatch parameter was used to allow for a modicum of mismatches while generating the neighborhood of the seed gene nodes as well as extending the network. The resulting three TALE cross-species networks were then evaluated for their functional enrichment using the Genomatix Pathway System (GePS) from the Genomatix Software Suite.
RESULTS
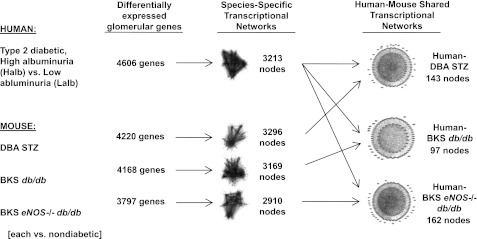
To establish a genome-wide expression cross-species network of DN in humans and mice, we first generated four species-specific transcriptional networks from differentially expressed glomerular genes detected in the human DN cohort and three mouse DN models (Fig. 1). In the networks, genes were represented as gene nodes with connections that indicate functional dependencies. To create the mouse-specific networks, we compared glomerular gene expression in diabetic mice with their appropriate ND controls. For the human-specific network, we compared glomerular gene expression in diabetic subjects who had Halb with those who had Lalb at the time of biopsy. This approach allowed us to identify shared human–mouse glomerular genes enriched for their specific contribution to nephropathy, because genes differentially regulated in human diabetes per se, in the absence of nephropathy, were excluded by this strategy. After creation of the four species-specific networks, the human glomerular transcriptional network was overlaid on each mouse glomerular transcriptional network to identify similar, but not necessarily identical, subnetworks operational in both species. At each step of the analysis, the number of genes and gene nodes decreased, demonstrating that the analysis reduced network complexity while iteratively identifying species-specific and cross-species–conserved, differentially regulated subnetworks (Fig. 1).
FIG. 1.
Analytical strategy used to generate shared glomerular human–mouse transcriptional networks. Transcriptional networks were generated from significantly regulated genes in human and mouse glomeruli using Genomatix Bibliosphere software. These networks were then overlapped using TALE to define cross-species shared transcriptional networks.
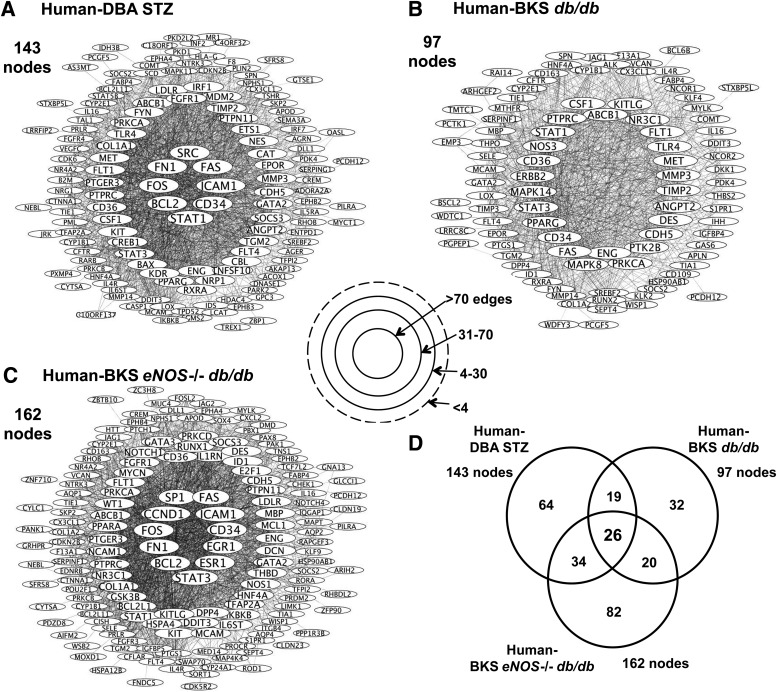
Figure 2 graphically displays the human–mouse shared transcriptional DN networks. A greater number of connections between gene nodes suggested increased network importance or centrality. In the Human-DBA STZ (Fig. 2A) and the Human-BKS eNOS−/− db/db transcriptional networks (Fig. 2C), there were 143 and 162 nodes, respectively, each with several high connectivity nodes (>70 connections). The Human-BKS db/db transcriptional network contained fewer gene nodes (total 97), none of which had >70 connections (Fig. 2B). Figure 2D displays the overlap between each shared human–mouse glomerular transcriptional network; 26 gene nodes were shared by all three human–mouse networks (Fig. 2D).
FIG. 2.
Human–mouse shared glomerular transcriptional networks. Each circle represents a gene node, and the lines represent a connection between two gene nodes. Shared transcriptional networks for Human-DBA STZ (A), Human-BKS db/db (B), and Human-BKS eNOS−/− db/db (C), as defined by TALE, are displayed with the most connected gene nodes in the center (>70 gene-gene connections) and the least connected gene nodes at the periphery. The overlap between the shared human–mouse networks is shown in D.
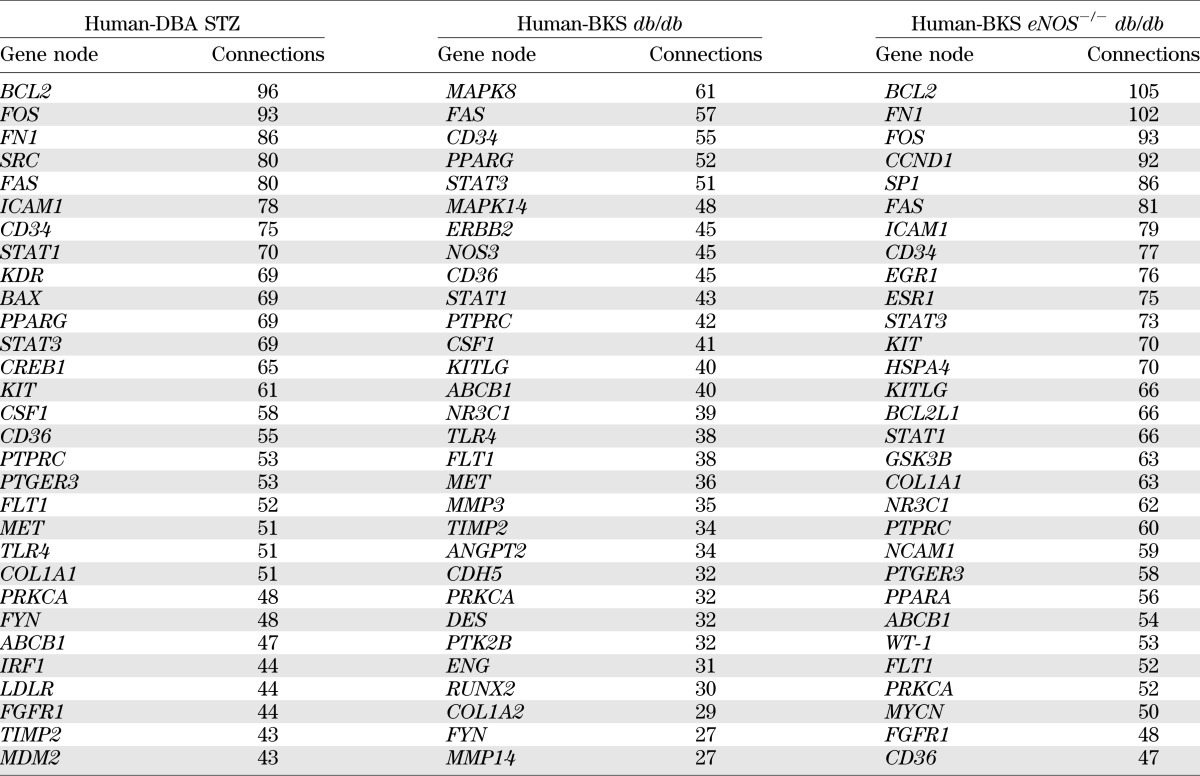
Table 2 lists the 30 gene nodes in each shared human–mouse transcriptional network with the highest number of connections (full list in Supplementary Table 2). Nine genes were shared among the high-connectivity gene nodes in all three networks. For example, STAT1 and STAT3, members of the Janus kinase (JAK)/signal transducer and activator of transcription (STAT) pathway, were among the top gene nodes in all three shared networks. In addition, genes expressed by endothelial cells and associated with endothelial cell dysfunction, including CD34, CD36, and FLT1, were among those with the most connections in each shared network. Fifteen gene nodes in the list were present in only two networks. For example, BCL2, FOS, and FN1 were the three most-connected gene nodes in the Human-DBA STZ and the Human-BKS eNOS−/− db/db networks. However, these genes were not differentially regulated in BKS db/db mouse glomeruli and were therefore not in the Human-BKS db/db network. PPARG (peroxisome proliferator–activated receptor-γ [PPARγ]) and MET (hepatocyte growth factor receptor) were found only in the Human-DBA STZ and Human-BKS db/db networks, whereas NR3C1, which encodes the glucocorticoid receptor, was shared only between Human-BKS db/db and Human-BKS eNOS−/− db/db networks.
TABLE 2.
Genes with highest connectivity in human–mouse transcriptional networks
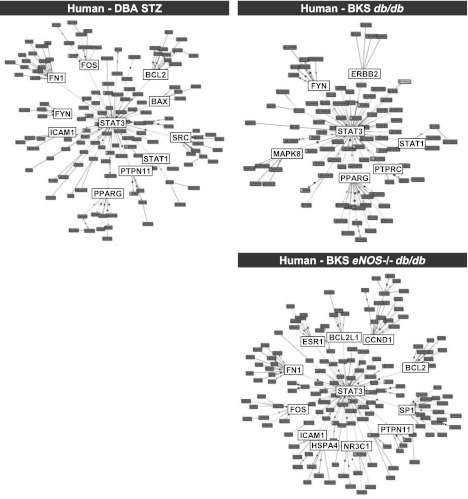
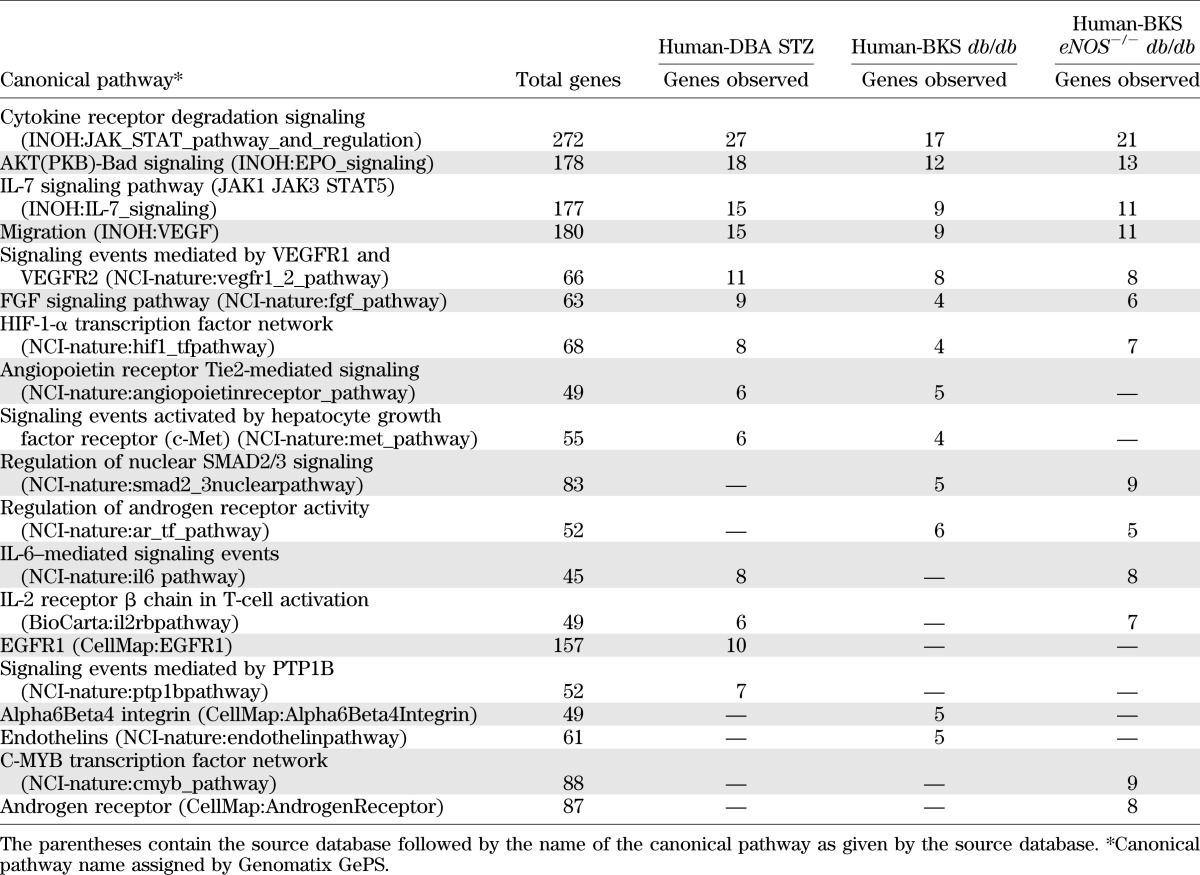
The glomerular human–mouse transcriptional networks were subsequently interrogated for insight into molecular mechanisms shared between the species. First, the shared networks were examined for dependencies between gene nodes derived via natural language processing and automated promoter analysis. As an example of such analysis, Fig. 3 displays each shared transcriptional network centered on STAT3 and depicts key gene nodes of the TALE analysis associated with JAK/STAT (STAT1), PPAR (PPARG), and apoptosis (BAX, BCL2, and FOS) signaling pathways. Using this method, one can input any functionally connected gene to determine its neighborhood of functionally related genes and its potential regulatory role. As a second method of network analysis, we used pathway enrichment analysis (GePS; Genomatix) of the gene node list from the human–mouse comparison to assess the biological relevance of each cross-species network (Table 3). All three shared networks were highly enriched for canonical JAK/STAT signaling. Canonical pathways well described in DN, such as vascular endothelial growth factor receptor (VEGFR), FGF signaling, and HIF-1 gene regulation pathways, were also enriched among all three shared networks (4,18,19). Finally, the IL-7 signaling pathway was enriched in all three shared networks. To our knowledge this network has not been previously implicated in the pathogenesis of DN. Table 3 also lists the top canonical pathways enriched in any two networks and those unique to one human–mouse shared transcriptional network.
FIG. 3.
Shared human–mouse transcriptional networks centered on STAT3. Focusing on any gene of interest allows for comparison of neighborhoods of functionally related genes within each shared network. We performed this analysis using STAT3 given its likely central role in the pathogenesis of DN, as suggested by previous studies.
TABLE 3.
Top canonical pathways
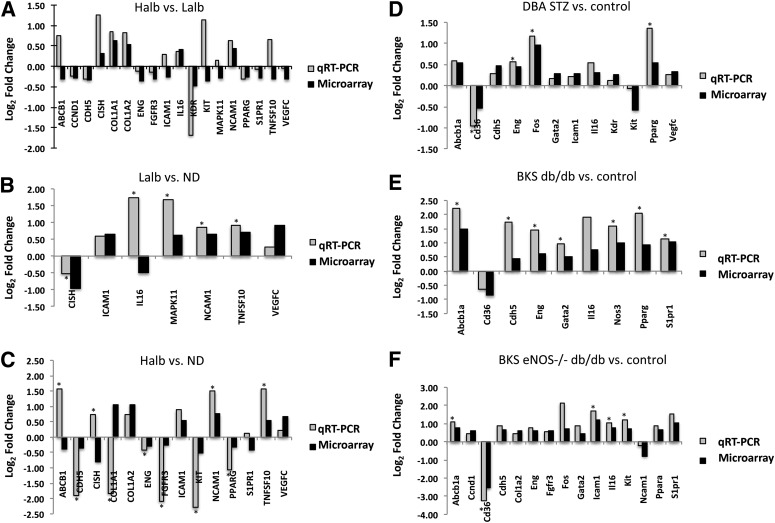
qRT-PCR analysis was performed to confirm the degree and direction of expression changes in 18 human and 19 mouse genes within the shared human–mouse transcriptional networks (Fig. 4). All 18 human genes assayed by qRT-PCR were significantly differentially expressed by microarray in the Halb versus Lalb comparison. By qRT-PCR analysis, 13 of these genes demonstrated the same direction of expression. Similarly, the direction of gene expression by qRT-PCR analysis agreed with gene expression by microarray for Lalb versus ND (6 genes out of 7) and Halb versus ND (10 out of 14) comparisons. For the mouse samples, the direction of expression of all genes assayed by qRT-PCR agreed with the microarray data.
FIG. 4.
qRT-PCR confirmation. qRT-PCR was performed to confirm the direction of fold change in expression (shown as log2 fold change in human and mouse models by microarray). Human comparisons for Halb vs. Lalb (A), Lalb vs. ND (B), and Halb vs. ND (C) by qRT-PCR were compared with differential expression from microarray data. Mouse comparisons for DBA STZ vs. control (D), BKS db/db vs. control (E), and BKS eNOS−/− db/db (F) were also compared with significant differential expression from microarray data. *P < 0.05.
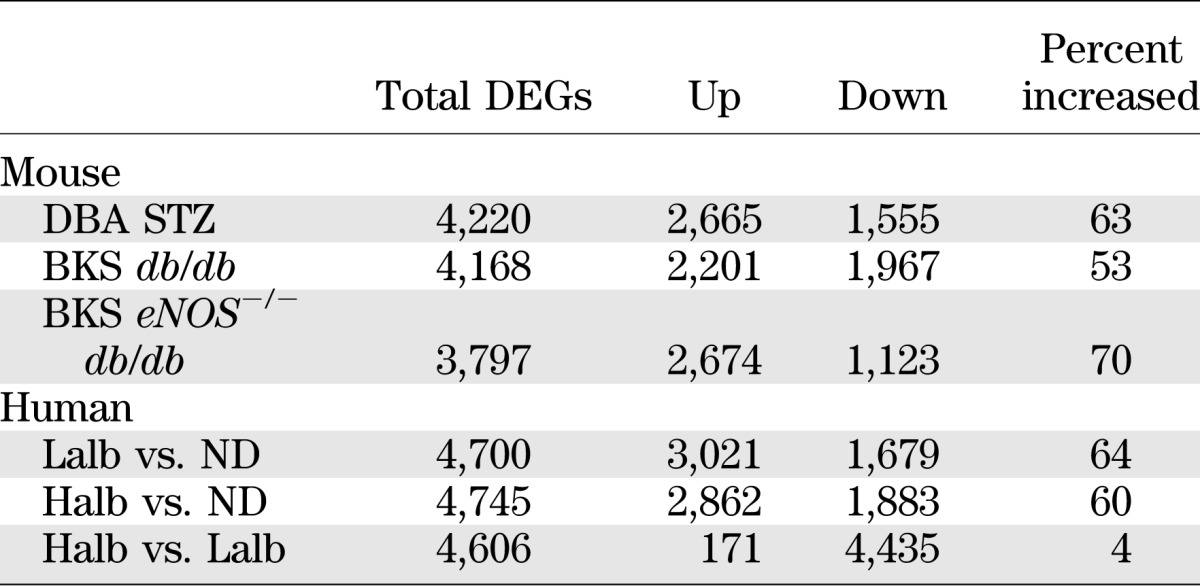
To maximize the detection of shared pathways and cooperating genes, our initial analysis selected overlapping, differentially regulated genes without determination of the concordance of expression changes (i.e., when the change in expression of a human gene with DN was in the same direction as that of the orthologous mouse gene with diabetes). In each shared mouse-human network, the number of genes with concordant changes in expression was lower than the number of genes with discordant changes. Since gene expression during disease progression is dynamic, often nonlinear, and can be reversed due to compensatory changes, we then expanded our analysis to compare glomerular expression of these shared network genes in diabetic patients with either Halb or Lalb to the expression in ND living donors, comparisons more akin to the mouse diabetic versus ND comparison. We then assessed the number of DEGs in each human–mouse comparison that were either concordant (changed in the same direction) or discordant (changed in opposite directions). The examination of all DEGs (tabulated in Supplementary Table 1) showed that the concordance of mouse and human expression changes increased in the diabetic to ND comparisons (Table 4), especially in the Lalb to ND comparison, suggesting that the gene changes from ND to early glomerulopathy in humans were most similar to those found in the mouse models. The directionality of all DEGs in both the diabetic humans and mouse models was assessed (Table 5). The pattern of these changes supports the analysis of the gene changes in the shared networks. In the mouse models, the change in gene expression from ND to diabetic was positive (increased) in 53–70% of the DEGs, which is similar to the percentage of DEGs that increased with DN in the comparison of Lalb versus ND (64%) and Halb versus ND (60%) humans, whereas the Halb versus Lalb comparison showed a very low percentage of increased expression, suggesting that most gene expression increases were near maximal in the Lalb group and then showed a relative decline in the Halb group.
TABLE 4.
Concordance of human–mouse gene expression within shared networks

TABLE 5.
Human and mouse DEGs
The gene expression changes reported above may have resulted from specific mechanisms activated in DN or, alternatively, from those altered in all proteinuric diseases. To determine the specificity of the gene expression profiles found in DN, we investigated changes in glomerular gene expression between the diabetic mouse models and human subjects with MN, an ND proteinuric disease (Supplementary Table 4). A number of the DEGs found in the shared human–mouse DN comparisons were also found in the human MN versus control comparison. However, over half of the DEGs were specific to DN.
DISCUSSION
Novel approaches that directly compare animal models to humans with DN are needed to better understand the pathogenesis of the human disease. Such comparisons will help shift the focus away from pathways that are relevant to processes in models but not in humans. In the current study, we performed an unbiased transcriptomic comparison of glomerular gene expression in diabetic humans and mouse models of DN to identify shared pathways and networks of transcriptional dysregulation in kidney glomeruli in DN. By using a human type 2 diabetes cohort with a shared environment and genetic background and by comparing human glomerular gene expression from patients with either high or low albumin excretion, we were able to select for gene dysregulation that is likely relevant to human DN and not to diabetes alone or other nonspecific factors. By comparing these results with three well-characterized mouse models, we identified cross-species glomerular transcriptional networks shared between humans and mice that further define gene networks involved in DN.
Analysis of the DEG lists in the three human–mouse shared networks revealed only partial overlap between any two shared networks (45, 46, and 60 gene nodes) and less commonality among all three (26 gene nodes) (Fig. 2D). However, when similarities were mapped into canonical signaling and metabolic pathways, more than one-third of the cross-species–conserved pathways overlapped between all three human–mouse comparisons (Table 3 and Supplementary Table 3). Alterations in some of these pathways have been described previously in human and animal DN (4,18,20), especially in those related to signaling in the microvasculature (JAK/STAT signaling, VEGF signaling, and HIF-1-α activation), confirming our ability to identify previously identified and relevant biological targets. However, some of the alterations were in pathways not previously associated with DN or diabetes. For example, the IL-7 signaling pathway was enriched in human DN and in all three murine models. IL-7 is a cytokine important for B- and T-cell survival, proliferation, and differentiation (21), and the change in expression of genes in this pathway suggests that the pathway may play a role as a regulator of glomerular lymphocytes or of intrinsic glomerular cells that contribute in some way to the pathogenesis of DN (22). In addition, several pathways were enriched in only one of the shared human–mouse networks. For example, the Human-DBA STZ shared network was enriched for genes in epidermal growth factor receptor-1 (EGFR1) signaling. The EGFR system plays an important role in mediating renal hypertrophy in diabetes, and inhibition of this pathway attenuates albuminuria in experimental DN (23). These data suggest that the DBA STZ mouse model, but not necessarily the other models, could be useful for studying this pathway in DN.
When examining the direction of gene expression changes in each human–mouse shared network, we observed that a significant proportion of genes with increased expression in the murine models were decreased in the Halb versus Lalb human comparison (Table 4 and Supplementary Table 1). However, when gene expression changes were analyzed in early DN (Lalb vs. normal human subjects), many more of these were directionally similar to changes (usually increases) seen in the mouse model comparisons. Although several potential explanatory factors are possible, it seems most likely that the nephropathy in humans was significantly more advanced than in the murine models. In support of this explanation, histopathological features of DN, such as global glomerulosclerosis and fractional interstitial fibrosis/area, were common in all subjects with type 2 diabetes studied (Halb and Lalb), but not in ND healthy kidney donors (Table 1). In addition, the duration of diabetes and nephropathy in the human subjects was much greater than in the murine models. Thus, our findings are consistent with the conclusion that mouse models, at the time points studied, demonstrate gene expression changes that are similar to those in human nephropathy before the development of microalbuminuria and therefore are most relevant to changes in very early human disease.
Gene expression generally increased in the shared pathways in the murine DN models compared with controls but was mostly repressed in the human Halb versus Lalb comparison. When all DEGs were examined in both humans and mice, a similar pattern emerged (Table 5), namely that differentially regulated gene expression tended to be increased in early DN in both mice and humans (Lalb vs. ND) but then was repressed as the disease progressed in humans (Halb vs. Lalb). This could reflect a loss of cell number with disease progression, since a reduction in podocyte number is associated with increased proteinuria in humans (24,25). However, this seems an unlikely explanation because the differentially regulated genes in the Halb versus Lalb comparison are not simply podocyte specific, and established podocyte-specific markers are not consistently repressed. For example, in the Halb versus Lalb comparison, nephrin and WT-1 expression were each decreased ∼40%, but the expression of podocin was unchanged. More likely, changes in cell phenotype and loss of specialized cellular functions occur with progression of nephropathy. In response to high glucose, the podocyte phenotype in mice in vivo and in vitro simplifies to a more embryonic form (26). Cellular de-differentiation and reduction of cell-specific transcripts throughout the glomerulus occurs and contributes to disease progression. Whether this tendency toward repression of cell lineage–specific genes in glomeruli would continue with even more progressive disease is unknown but would be of interest as this could represent a general pathological response.
A current challenge in DN research is the selection of the best murine model to evaluate a specific molecular pathway. Our data define the extent to which murine DN models recapitulate human DN, at least in terms of gene expression changes. Networks of the conserved genes can assist in the dynamic investigation of all networks to determine overlap between mouse models and humans with DN. In addition, to facilitate identification of the most adequate model system for a given pathway or to screen multiple models for molecular DN mechanisms using systems biology tools, the cross-species shared datasets will be uploaded to the Web-based search engine Nephromine (www.nephromine.org).
The most consistently shared networks in all of the human–mouse DN comparisons were in pathways that use JAK/STAT signaling, which corroborates our previous report that changes in expression of JAK/STAT family members occurs in glomerular cells from humans with early DN (20). In our previous report, we demonstrated an increase of glomerular JAK1, JAK2, STAT1, and STAT3 in early human DN, but no changes in JAK2 gene expression in glomeruli from DBA STZ or BKS db/db models by qRT-PCR and Western analysis (20). In agreement with the previous study, we observed no significant differential expression of JAK2 in DBA STZ or BKS eNOS−/− db/db by microarray analysis in the current study (data not shown). However, there was a modest increase in JAK2 expression in BKS db/db glomeruli that reached statistical significance, but did not reach statistical significance in the more extensive analysis previously reported (20). Thus, the data in this study support the general conclusion that increased JAK2 expression found in early human DN is not replicated in mouse models. Similarly, SOCS2 and SOCS3 were repressed in progressive human DN but not in the mouse models. Reduction in SOCS gene expression would enhance STAT transcriptional activity (27), and this difference in human and mouse SOCS gene expression could underlie a more potent upregulation of the JAK/STAT signaling pathway in humans than in mice.
In summary, we have discovered shared glomerular transcriptional networks, enriched for genes most likely to contribute to disease progression, in humans with type 2 DN and three frequently used mouse models of DN. The shared networks contain genes that are members of pathways previously linked to the pathogenesis of DN as well as those in signaling pathways not previously implicated in DN. Our pathway data also suggest that the murine models, at the time points studied, demonstrate transcriptional changes that occur quite early in human DN. Indeed, multiple pathways activated early in human DN, and in the mouse models, are repressed during progression of the disease in humans, consistent with stage-specific regulation of human DN. The results of this study thus help to unravel the complex sequence of events leading to progression of human DN and point to both the applicability and limitations of current murine models.
ACKNOWLEDGMENTS
This work was supported by grants U01-DK-076139, U24-DK-076169/subaward 20497-16, R01-DK-054639-14, R01-DK-079912, and R24-DK-082841 from the National Institute of Diabetes and Digestive and Kidney Diseases and by funds from the Juvenile Diabetes Research Foundation. Support for informational analysis was provided by the Applied Systems Biology Core of the University of Michigan O’Brien Kidney Center (P30-DK-081943).
No potential conflicts of interest relevant to this article were reported.
J.B.H. and V.N. performed experiments, analyzed data, and wrote the manuscript. H.Z. provided mouse samples and clinical data. A.R. processed mouse and human samples for analysis. R.C.H. provided mouse samples, assisted with study design, and edited the manuscript. R.G.N. and E.J.W. provided human samples, collected clinical data, and edited the manuscript. J.D.C. and J.M.P. assisted with analysis. F.C.B. and M.K. designed and supervised experiments, analyzed the results, and wrote the manuscript. F.C.B. and M.K. are the guarantors of this work and, as such, had full access to all the data in the study and take responsibility for the integrity of the data and the accuracy of the data analysis.
Parts of this study were presented at the 43rd Annual Meeting of the American Society of Nephrology, Denver, Colorado, 16–21 November 2010.
Footnotes
This article contains Supplementary Data online at http://diabetes.diabetesjournals.org/lookup/suppl/doi:10.2337/db11-1667/-/DC1.
See accompanying commentary, p. 31.
REFERENCES
- 1.U.S. Renal Data System USRDS 2010 Annual Data Report: Atlas of Chronic Kidney Disease and End-Stage Renal Disease in the United States. Bethesda, MD, National Institutes of Health, National Institute of Diabetes and Digestive and Kidney Diseases, 2010 [Google Scholar]
- 2.Brosius FC, 3rd, Alpers CE, Bottinger EP, et al. Animal Models of Diabetic Complications Consortium Mouse models of diabetic nephropathy. J Am Soc Nephrol 2009;20:2503–2512 [DOI] [PMC free article] [PubMed] [Google Scholar]
- 3.Schmid H, Henger A, Kretzler M. Molecular approaches to chronic kidney disease. Curr Opin Nephrol Hypertens 2006;15:123–129 [DOI] [PubMed] [Google Scholar]
- 4.Brosius FC, Khoury CC, Buller CL, Chen S. Abnormalities in signaling pathways in diabetic nephropathy. Expert Rev Endocrinol Metab 2010;5:51–64 [DOI] [PMC free article] [PubMed] [Google Scholar]
- 5.KDOQI. KDOQI clinical practice guidelines and clinical practice recommendations for diabetes and chronic kidney disease Am J Kidney Dis 2007;49:S12–S154 [DOI] [PubMed] [Google Scholar]
- 6.Cohen CD, Frach K, Schlöndorff D, Kretzler M. Quantitative gene expression analysis in renal biopsies: a novel protocol for a high-throughput multicenter application. Kidney Int 2002;61:133–140 [DOI] [PubMed] [Google Scholar]
- 7.Zhang H, Saha J, Byun J, et al. Rosiglitazone reduces renal and plasma markers of oxidative injury and reverses urinary metabolite abnormalities in the amelioration of diabetic nephropathy. Am J Physiol Renal Physiol 2008;295:F1071–F1081 [DOI] [PMC free article] [PubMed] [Google Scholar]
- 8.Zhang H, Schin M, Saha J, et al. Podocyte-specific overexpression of GLUT1 surprisingly reduces mesangial matrix expansion in diabetic nephropathy in mice. Am J Physiol Renal Physiol 2010;299:F91–F98 [DOI] [PMC free article] [PubMed] [Google Scholar]
- 9.Zhao HJ, Wang S, Cheng H, et al. Endothelial nitric oxide synthase deficiency produces accelerated nephropathy in diabetic mice. J Am Soc Nephrol 2006;17:2664–2669 [DOI] [PMC free article] [PubMed] [Google Scholar]
- 10.Gurley SB, Clare SE, Snow KP, Hu A, Meyer TW, Coffman TM. Impact of genetic background on nephropathy in diabetic mice. Am J Physiol Renal Physiol 2006;290:F214–F222 [DOI] [PubMed] [Google Scholar]
- 11.Wiggin TD, Kretzler M, Pennathur S, Sullivan KA, Brosius FC, Feldman EL. Rosiglitazone treatment reduces diabetic neuropathy in streptozotocin-treated DBA/2J mice. Endocrinology 2008;149:4928–4937 [DOI] [PMC free article] [PubMed] [Google Scholar]
- 12.Henger A, Kretzler M, Doran P, et al. Gene expression fingerprints in human tubulointerstitial inflammation and fibrosis as prognostic markers of disease progression. Kidney Int 2004;65:904–917 [DOI] [PubMed] [Google Scholar]
- 13.Vandesompele J, De Preter K, Pattyn F, et al. Accurate normalization of real-time quantitative RT-PCR data by geometric averaging of multiple internal control genes. Genome Biol 2002;3:RESEARCH0034 [DOI] [PMC free article] [PubMed]
- 14.Livak KJ, Schmittgen TD. Analysis of relative gene expression data using real-time quantitative PCR and the 2(-Delta Delta C(T)) Method. Methods 2001;25:402–408 [DOI] [PubMed] [Google Scholar]
- 15.Moll AG, Lindenmeyer MT, Kretzler M, Nelson PJ, Zimmer R, Cohen CD. Transcript-specific expression profiles derived from sequence-based analysis of standard microarrays. PLoS ONE 2009;4:e4702. [DOI] [PMC free article] [PubMed] [Google Scholar]
- 16.Tusher VG, Tibshirani R, Chu G. Significance analysis of microarrays applied to the ionizing radiation response. Proc Natl Acad Sci USA 2001;98:5116–5121 [DOI] [PMC free article] [PubMed] [Google Scholar]
- 17.Tian J, Patel JM. TALE: a tool for approximate large graph matching. In Proceedings of the 24th International Conference on Data Engineering, Cancun, Mexico, 2008. Washington, DC, IEEE Computer Society, p. 963–972 [Google Scholar]
- 18.Takiyama Y, Harumi T, Watanabe J, et al. Tubular injury in a rat model of type 2 diabetes is prevented by metformin: a possible role of HIF-1α expression and oxygen metabolism. Diabetes 2011;60:981–992 [DOI] [PMC free article] [PubMed] [Google Scholar]
- 19.Vasko R, Koziolek M, Ikehata M, et al. Role of basic fibroblast growth factor (FGF-2) in diabetic nephropathy and mechanisms of its induction by hyperglycemia in human renal fibroblasts. Am J Physiol Renal Physiol 2009;296:F1452–F1463 [DOI] [PubMed] [Google Scholar]
- 20.Berthier CC, Zhang H, Schin M, et al. Enhanced expression of Janus kinase-signal transducer and activator of transcription pathway members in human diabetic nephropathy. Diabetes 2009;58:469–477 [DOI] [PMC free article] [PubMed] [Google Scholar]
- 21.Fry TJ, Mackall CL. Interleukin-7: from bench to clinic. Blood 2002;99:3892–3904 [DOI] [PubMed] [Google Scholar]
- 22.Mentzel S, Van Son JP, De Jong AS, et al. Mouse glomerular epithelial cells in culture with features of podocytes in vivo express aminopeptidase A and angiotensinogen but not other components of the renin-angiotensin system. J Am Soc Nephrol 1997;8:706–719 [DOI] [PubMed] [Google Scholar]
- 23.Advani A, Wiggins KJ, Cox AJ, Zhang Y, Gilbert RE, Kelly DJ. Inhibition of the epidermal growth factor receptor preserves podocytes and attenuates albuminuria in experimental diabetic nephropathy. Nephrology (Carlton) 2011;16:573–581 [DOI] [PubMed] [Google Scholar]
- 24.Dalla Vestra M, Masiero A, Roiter AM, Saller A, Crepaldi G, Fioretto P. Is podocyte injury relevant in diabetic nephropathy? Studies in patients with type 2 diabetes. Diabetes 2003;52:1031–1035 [DOI] [PubMed] [Google Scholar]
- 25.White KE, Bilous RW, Marshall SM, et al. Podocyte number in normotensive type 1 diabetic patients with albuminuria. Diabetes 2002;51:3083–3089 [DOI] [PubMed] [Google Scholar]
- 26.Herman-Edelstein M, Thomas MC, Thallas-Bonke V, Saleem M, Cooper ME, Kantharidis P. Dedifferentiation of immortalized human podocytes in response to transforming growth factor-β: a model for diabetic podocytopathy. Diabetes 2011;60:1779–1788 [DOI] [PMC free article] [PubMed] [Google Scholar]
- 27.Ortiz-Muñoz G, Lopez-Parra V, Lopez-Franco O, et al. Suppressors of cytokine signaling abrogate diabetic nephropathy. J Am Soc Nephrol 2010;21:763–772 [DOI] [PMC free article] [PubMed] [Google Scholar]


