


Abstract
The forkhead transcription factor FoxO1 is a critical regulator of hepatic glucose and lipid metabolism, and dysregulation of FoxO1 function has been implicated in diabetes and insulin resistance. We globally identified FoxO1 occupancy in mouse hepatic chromatin on a genome-wide level by chromatin immunoprecipitation coupled with high-throughput DNA sequencing (ChIP-seq). To establish the specific functional significance of FoxO1 against other FoxO proteins, ChIP-seq was performed with chromatin from liver-specific FoxO1 knockout and wild-type mice. Here we identified 401 genome-wide FoxO1-binding locations. Motif search reveals a sequence element, 5′ GTAAACA 3′, consistent with a previously known FoxO1-binding site. Gene set enrichment analysis shows that the data from FoxO1 ChIP-seq are highly correlated with the global expression profiling of genes regulated by FoxO1, demonstrating the functional relevance of our FoxO1 ChIP-seq study. Interestingly, gene ontology analysis reveals the functional significance of FoxO1 in retinoid metabolic processes. We show here that FoxO1 directly binds to the genomic sites for the genes in retinoid metabolism. Notably, deletion of FoxO1 caused a significantly reduced induction of Pck1 and Pdk4 in response to retinoids. As Pck1 and Pdk4 are downstream targets of retinoid signaling, these results suggest that FoxO1 plays a potential role in linking retinoid metabolism to hepatic gluconeogenesis.
INTRODUCTION
The liver plays a central role in maintaining tight control of glucose homeostasis. Under feeding conditions, there is increased hepatic glucose uptake and glycogen storage, whereas during fasting, the liver produces glucose by gluconeogenesis and glycogenolysis (1). Glucose homeostasis during this transition period is orchestrated by the two counteracting pancreatic hormones, insulin and glucagon. During feeding, insulin activates phosphoinositide 3-kinase (PI3K)/Akt (also known as PKB) signaling, which induces phosphorylation of forkhead transcription factor FoxO1, leading to the export of FoxO1 to the cytoplasm from the nucleus (2). As a result, insulin inhibits expression of FoxO1 target genes, including those encoding phosphoenolpyruvate carboxykinase (PCK1) and glucose-6-phosphatase (G6PC), the rate-limiting enzymes in hepatic gluconeogenesis (3,4).
FoxO1 is a member of the evolutionarily conserved mammalian forkhead box O class (FoxO) family that also includes FoxO3, FoxO4 and FoxO6. FoxO proteins bind to their consensus DNA sequence, (T/C)(G/A)AAACAA, as a monomer, and regulate expression of genes involved in a variety of biological processes, including cell cycle arrest, apoptosis, detoxification, energy metabolism and longevity (5). Studies using genetically modified mouse models have well documented the physiological role of FoxO1 in vivo in insulin action in suppressing hepatic glucose production (6). Additionally, recent studies have shown that the involvement of Notch (7) and Wnt (8) signaling in regulating hepatic glucose production is through modulating FoxO1 activity. There is also an emerging theme suggesting a role of FoxO1 in hepatic lipid homeostasis. Consistent with its critical role in hepatic metabolism, aberrant function of FoxO1 is associated with deleterious characteristics of type 2 diabetes, including hyperglycemia and hypertriglyceridemia (9).
Given the critical function of FoxO1 in hepatic metabolism, it is necessary to completely understand how FoxO1 functions in controlling the diverse metabolic processes. To this end, we have performed genome-wide analysis of FoxO1-binding occupancy in hepatic chromatin by chromatin immunoprecipitation coupled with high-throughput DNA sequencing (ChIP-seq) (10). Here we have identified 401 FoxO1-binding locations in mouse hepatic chromatin. Gene ontology (GO) analysis reveals a significant role of FoxO1 in metabolic processes for carboxylic acids, fatty acids and steroids. Interestingly, we also observed a cluster of genes involved in retinoid (vitamin A) metabolic processes.
Retinoids (retinol derivatives) play critical roles in development, immune function, vision, tissue modeling and metabolism. The liver is the major organ for retinoid uptake and storage in the body (11,12). Biologically active retinoid metabolites include retinoic acids that are generated by a two-step process from retinol, catalyzed by retinol dehydrogenases and retinaldehyde dehydrogenases. All-trans retinoic acid (atRA) is a transcriptionally active metabolite that functions as a ligand for its specific receptors, retinoic acid receptors (RARs), and directly regulates its target genes with its heterodimeric partners, retinoid X receptors. Cellular retinol-binding protein 1 encoded by retinol-binding protein 1 (Rbp1) serves as a carrier protein for retinol and retinal.
It has been shown that retinoids play an essential role in hepatic glucose metabolism by regulating expression of gluconeogenic gene Pck1 (13–16). Also, pyruvate dehydrogenase kinase isozyme 4 (Pdk4) expression levels are regulated by vitamin A in vivo (17,18). Therefore, we were interested in further studying the role of FoxO1 in retinoid metabolic processes and its downstream effects on hepatic gluconeogenesis. We show here that FoxO1 is required for full induction of Pck1 and Pdk4 in response to retinoids, suggesting a previously unappreciated role of FoxO1 in retinoid signaling, regulating hepatic gluconeogenesis.
MATERIALS AND METHODS
Animals
All animal care and experimental procedures were performed according to the guidelines of the Institutional Animal Care and Use Committee. Liver-specific FoxO1 (l-FoxO1) knockout (KO) mice were produced by crossing FoxO1flox/flox mice expressing CRE recombinase under the control of the α1-antitrypsin promoter, as described in a previous study (19). Littermates FoxO1flox/flox were used as wild-type (WT) controls. Mice were maintained on a 12-h light/dark cycle with free access of food and water. Eight- to 9-week-old male mice were either fed ad libitum or fasted for 24 h. Livers were removed and processed immediately for chromatin isolation, as described previously. The remaining 10% of liver was frozen in liquid nitrogen and stored at −80°C until RNA and protein were isolated.
ChIP and ChIP sequencing
Mouse liver chromatin was prepared, as described previously (19). An aliquot of chromatin was pre-cleared with protein A and immunoprecipitated with an anti-FoxO1 (Cell Signaling Technology). ChIP-enriched DNA was isolated and further purified by QIAquick PCR purification kit (Qiagen). After verification of FoxO1 enrichment to known FoxO1 target promoters by quantitative real-time polymerase chain reaction (qPCR) using gene-specific primers, 20 ng of ChIP-enriched DNA was sent to Ambry Genetics (Aliso Viejo, CA), where it was processed for high-throughput DNA sequencing. Briefly, the DNA fragments were blunted and ligated to sequencing adapters. Samples were size-fractionated on a 2% agarose gel, and DNA fragments 200 ± 25 bp in length were isolated. After PCR amplification, the resulting DNA library was sequenced on the Solexa/Illumina Genome Analyzer. The sequence reads of 36 bases were aligned to the mm9 mouse genome using ELAND, allowing one mismatch. The aligned reads were used as input to identify peaks as well as visualization in the UCSC Genome Browser. To compare the genomic locations of our FoxO1 ChIP-seq peaks with those of FoxA2 ChIP-seq peaks, the FoxO1 ChIP-seq bed files aligned to the mm9 mouse reference genome were re-mapped onto the mm8 mouse reference genome using UCSC liftOver (http://genome.ucsc.edu/cgi-bin/hgLiftOver), as the sequence reads of FoxA2 ChIP-seq were aligned onto the mouse reference genome version mm8. The FoxA2 ChIP-seq data were obtained from http://www.bcgsc.ca/data/chipseq/chip-seq-data (20).
Peak finding, density map plot and motif analysis
Peak finding was performed to identify significantly enriched reads in peaks in WT chromatin ChIPed with an anti-FoxO1 relative to those in WT immunoglobulin G (IgG) or in l-FoxO1 KO chromatin ChIPed with an anti-FoxO1 by using SEAN, custom peak finding software developed by the University of Connecticut Bioinformatics and Bio-Computing Institute (Supplementary Materials and Methods S1) with a default P-value cut-off criterion of 1 × 10⁻⁵ to generate a high-confidence peak set. Density map plots were produced from each read in peaks 5 kb upstream and downstream from the center of the peak. Each read was displayed horizontally with a green spot. Density maps for random peaks were produced from reads in the peaks of randomly selected 10 kb of genomic regions.
To search for sequence motifs representing FoxO1-binding sites, the underlying DNA sequences of the identified peaks were obtained by Galaxy (main.g2.bx.psu.edu) and fed into motif-finding program MEME 4.7.0 with default parameters (21). Motifs were represented as position-dependent letter-probability matrices, which describe the probability of each possible letter at each position in the pattern. To identify enriched binding sites for co-regulatory proteins in FoxO1 peaks, the regions spanning 250 bp upstream and downstream from the FoxO1 motifs were scanned by HOMER motif analysis.
Peak distribution, GO analysis and gene set enrichment analysis
The peak distribution was computed based on the UCSC refFlat file database. The distance from the peak to the nearest transcription start site (TSS) was analysed and plotted. The random peaks were placed on the genome at random locations and determined the distance to TSS, and a background plot was produced. The TSSs were referenced from the UCSC refFlat file. GO analysis was performed with nearest genes of FoxO1-binding peaks as input to the National Institutes of Health Database for Annotation, Visualization and Integrated Discovery GO (22). Gene set enrichment analysis (GSEA) was carried out by comparing a data set of FoxO1 ChIP-seq genes with that from genome-wide mRNA expression profiling (23). Enrichment score was obtained with a P-value by running sum of the ChIP-seq genes and differentially expressed rank-ordered genes in mRNA profiling.
RNA isolation, qPCR and microarray data analysis
Total RNA was isolated from mouse livers or primary mouse hepatocytes using TRIzol (Invitrogen) according to the manufacturer’s instructions. cDNA was synthesized using the iScript cDNA synthesis kit (Bio-Rad). qPCR was performed with the iQ5 real-time PCR detection system (Bio-Rad), and the results were analysed by using the ΔΔ-Ct method supplied by the manufacturer, as described previously (19). mRNA levels were normalized to the level of mRNA for the housekeeping ribosomal protein L32. Gene expression profiling was performed using the Mouse Gene 1.0 OST (Affymetrix, Santa Clara, CA) by hybridizing RNA from fed or fasted livers of WT and fasted l-FoxO1 KO livers in triplicate. cRNA generation, labeling and hybridization were performed at the DNA Microarray Facility of the University of California, Irvine. Expression values were analysed using Limma (Linear Models for Microarray Data) (24), SAM (25) and Bayesian-based Semi-Parametric Hierarchical Model (26) for statistical significance.
Primary mouse hepatocytes, adenovirus infection and retinoid treatment
Primary mouse hepatocytes were isolated from 8 to 10 weeks old C57BL/6J male mice (The Jackson Laboratory), as described previously (19). Briefly, hepatocytes were obtained by two-step collagenase perfusion through the cannulated portal vein, followed by Percoll gradient selection. Isolated cells were resuspended in medium 199 supplemented with 10% FBS, 10 nM dexamethasone, 2 mM glutamine, 100 U/ml penicillin, 100 U/ml streptomycin and 1 × ITS, and plated in collagen-coated 12-well dishes at a density of 2.5 × 10⁵/well. After 4-h attachment, the medium was replaced with serum-free medium 199 supplemented with 10 nM dexamethasone, 2 mM glutamine, 100 U/ml penicillin and 100 U/ml streptomycin. Sixteen hours after isolation, hepatocytes were infected with a recombinant adenovirus expressing un-specific RNAi or FoxO1 shRNA (gift from Dr. D. Accili, Columbia University) at a multiplicity of infection of 25 and incubated for 24 h in medium 199 supplemented with 2% serum, followed by treatment with retinol (Sigma) or atRA (Sigma). Six hours later, cells were harvested for RNA analysis.
RESULTS
We prepared chromatin from mouse livers after 24-h fasting because FoxO1 is predominantly localized in the nucleus during fasting, promoting the expression of its target genes. Before carrying out ChIP-seq analysis, we first evaluated the quality of an antibody against FoxO1 in liver-specific FoxO1 (l-FoxO1) KO mice. Immunoblot analysis showed (Supplementary Figure S1A) that hepatic FoxO1 protein was barely detectable in l-FoxO1 KO, compared with WT littermates. The protein levels were proportionally reflected with mRNA levels of FoxO1 that were significantly decreased more than 90% in l-FoxO1 KO (Supplementary Figure S1B). We used this antibody for gene-specific ChIP with chromatin from WT and l-FoxO1 KO and analysed the enrichment of FoxO1 to known FoxO1-binding sites to verify the ability of the antibody to immunoprecipitate FoxO1. We observed significant enrichment of FoxO1 at the promoter region of the Pck1 gene, which has been previously shown occupied by FoxO1 (3), compared with IgG in WT, whereas a genomic fragment of Yy1 locus used as a negative control was not enriched (Supplementary Figure S2). The significant binding of FoxO1 in WT was further verified by ChIP with chromatin from l-FoxO1 KO where there was no specific FoxO1 binding to the Pck1 promoter regions observed (Supplementary Figure S2). Consequently, we used the antibody for ChIP-seq for a genome-wide analysis of FoxO1 binding. Because there are several members of FoxO proteins that share a DNA-binding domain, in addition to an IgG control, we prepared an additional negative control for the specificity of FoxO1 against other FoxO proteins. Hepatic chromatin from l-FoxO1 KO was immunoprecipitated with a FoxO1 antibody and used as a second negative control.
ChIPed DNA was processed for sequencing by Solexa/Illumina Genome Analyzer II, which generated a data set of 5–6 million reads in each group (Figure 1A). The peaks were mapped onto the mouse reference genome mm9 in the UCSC Genome Browser Database. FoxO1-binding peaks were identified by SEAN (Supplementary Materials and Methods S1) with the threshold P-value 1 × 10⁻⁵. We found 583 peaks in FoxO1-enriched chromatin compared with IgG in WT (WT-FoxO1/WT-IgG), designated FoxO1/IgG, whereas 460 peaks were identified in FoxO1-enriched chromatin in WT compared with that in l-FoxO1 KO (WT-FoxO1/l-FoxO1 KO-FoxO1), designated WT/KO (Figure 1B). Notably, the overlapping peaks were 401, accounting for as much as 69% of peaks in FoxO1/IgG and 87% of peaks in WT/KO. The genomic locations of the 401 peaks are shown in Supplementary Table S9. We used the overlapping peaks as a reference for further analysis of genome-wide FoxO1-binding sites. We randomly selected three representative examples of ChIP-seq peaks, as shown in Figure 2. The location of the peaks for Pdk4 and Pck1-a encompasses the previously known FoxO1-binding sites (3,27), whereas the peaks for Elk4 and Pck1-b are newly found as putative FoxO1-binding sites in the current studies.
Figure 1.
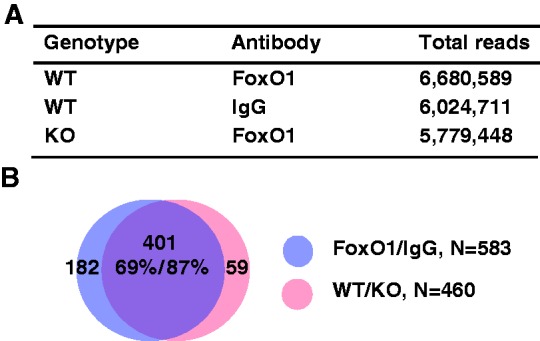
ChIP-seq analysis for FoxO1 binding in hepatic chromatin. (A) Total ChIP-seq reads are shown in WT or l-FoxO1 KO (KO) chromatin enriched with an anti-FoxO1 or IgG. (B) Peaks were found by SEAN, as described in ‘Supplementary Materials and Methods S1’. FoxO1-binding peaks in WT FoxO1/WT IgG (FoxO1/IgG) were compared with those of WT FoxO1/KO FoxO1 (WT/KO) and overlapping peaks were identified.
Figure 2.

Representative view of a ChIP-seq peak. FoxO1-binding peaks were mapped onto the mouse reference genome mm9 and visualized using the UCSC Genome Browser. Arrows indicate peaks associated with genes: (A), Elk4; (B), Pck1; (C), Pdk4. WT = wild-type; KO = l-FoxO1 KO; Fx = FoxO1.
To evaluate the quality of genomic FoxO1-binding peaks, we generated density map plots, where each read in a peak was displayed as a green spot on a dark background horizontally spanning 5 kb upstream and downstream from the center of the peak (Figure 3A). Therefore, the more reads you have, the brighter the spots are. The reads in all of the peaks were presented vertically. As shown in Figure 3A (top panel),there was a clearly visible vertical bright green line at the center of the FoxO1-enriched DNA sample in WT (column 2), whereas there was no noticeable line at the center in WT-IgG (column 1) and l-FoxO1 KO-FoxO1 (column 3), both of which were used as negative controls. When the peaks in WT-FoxO1 were normalized against WT-IgG or l-FoxO1 KO-FoxO1, a more distinctive vertical line was found at the center in columns 4 and 5, respectively. As a negative control, 10 kb of genomic regions were randomly selected, and reads in the peaks were plotted on a density map (Figure 3A, bottom panel). There were no vertical lines visible in the density maps generated from random peaks in every case. The peak reads in the data set of Figure 3A were plotted in a two-dimensional array where the x-axis represents the location of reads relative to the center of the peak (marked as 0) 5 kb upstream and downstream, and the y-axis represents the cumulative number of reads in that specific location (Figure 3B). Reads from all peaks were summed up and plotted. The maximum number of reads was set at 100. There was a clear cumulative spike shown in WT-FoxO1; however, no visible spike was generated from the random peaks of WT-IgG and l-FoxO1-KO FoxO1. The cumulative peak maps that were produced from samples normalized against negative controls, FoxO1/IgG and WT/KO, showed a higher spike than that of WT-FoxO1 without normalization. Overall, the results in Figure 3 clearly demonstrate that there were no distinctive peaks present in two negative controls and that the FoxO1 peaks are highly specific.
Figure 3.
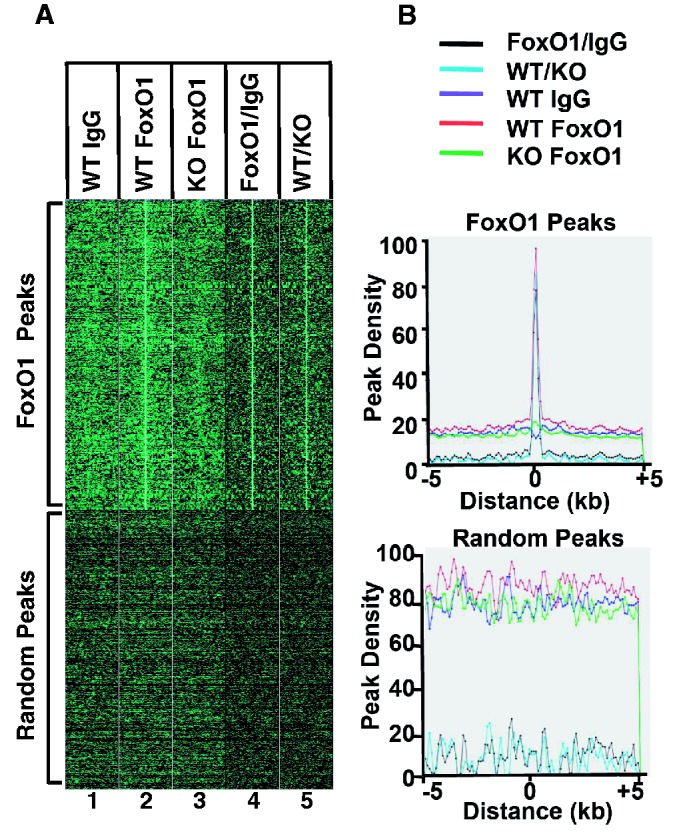
Density map plots of FoxO1 ChIP-seq peaks. (A) The top panel represents the read distribution of peaks in ChIP-seq for FoxO1, whereas the bottom panel represents the read distribution of random peaks. (B) The top and the bottom plots represent cumulative reads of FoxO1 ChIP-seq peaks and those of random peaks, respectively. The maximum number of read is set to 100.
The analysis of peak distribution demonstrates that the preferential binding sites are localized to the intergenic regions (37.4%) and introns (34.5%), whereas 15.4% of binding sites were mapped within the proximal promoter regions. The remaining binding sites were found in 5′ untranslated regions (8.4%), exons (3.4%) and 3′ untranslated regions (1.0%) (Figure 4A). The analysis of peak distribution relative to a known TSS revealed a significant enrichment of FoxO1-binding sites around TSS (Figure 4B), whereas the distribution of random peaks was spread out relatively even throughout the genome. The search for enriched motifs within the FoxO1-binding peaks using MEME (21) revealed a sequence element, 5′ GTAAACA 3′, as the highest-scoring motif that was found in 362 (90%) of 401 peaks with an E = 3.1e-150 (Figure 4C). It turns out that this motif closely corresponds to a consensus site that has been previously known as a FoxO1-binding site, GTAAACAA (5,28). There were no other variants of the consensus motif found in the MEME analysis. It has been shown that FoxO1 is associated with other transcription factors to regulate its target gene expression (29). To identify enriched binding sites for co-regulatory transcription factors that are associated with FoxO1, we screened the sequence spanning 250 bp upstream and downstream from the FoxO1 motifs. The motif search revealed transcription factor-binding sites for hepatocyte nuclear factor 4 (HNF-4), estrogen-related receptor alpha (ERRα), CCAAT/enhancer binding protein beta (CEBPβ) and glucocorticoid receptor (GR) (Supplementary Table S3), in addition to FoxO1.
Figure 4.

Genome-wide distribution of FoxO1-binding sites. (A) Genomic distribution of FoxO1-binding sites relative to mouse RefSeq genes is shown. The promoter regions are defined as 2 kb of 5′ flanking sequence. (B) Peak distribution relative TSS is shown. The peak distribution of FoxO1 binding is shown in red, whereas the distribution of random peaks is shown in blue. (C) The top-scoring motif present in the FoxO1-binding peaks is shown by MEME motif analysis. E = 3.1e-150.
FoxO1 has been shown to bind to its consensus DNA sites with higher affinity when the binding site is flanked with its reverse complementary sequence and a specific sequence, 5′ ACAACA 3′ (30). Therefore, we investigated whether there are any enriched specific sequences in the flanking regions of the FoxO1-binding sites and whether there are multiple FoxO1-binding sites present in a peak. We found that the majority of peaks contain one FoxO1-binding site (81%), whereas 17% of peaks harbor two of them. The remaining peaks contain three or four FoxO1-binding sites in a peak (Supplementary Figure S6A). The number of nucleotides between the FoxO1-binding sites ranged from 1 to 182, without any specific enrichment in the number of nucleotides between them (Supplementary Figure S6B). We did not observe any enrichment of particular sequences in the flanking regions in our study.
To evaluate how the genome-wide binding analysis correlates with global expression profiling of genes regulated by FoxO1, we performed GSEA (23). Nearest genes within 20 kb of FoxO1-binding peaks were identified in the ChIP-seq analysis (Supplementary Table S8). To obtain the gene expression profiling for GSEA, we carried out genome-wide mRNA expression analysis in livers of WT mice either under fed or fasted conditions. As FoxO1 is mostly active in regulating its target genes during fasting, the genes identified by the expression profiling assays most likely represent physiologically relevant putative FoxO1 targets. Additionally, genome-wide mRNA expression analysis was performed in livers of WT and l-FoxO1 KO mice under fasted condition to prepare another set of FoxO1-regulated gene expression profiling. Differentially expressed genes in each of the mRNA expression analyses were rank-ordered and input into GSEA along with the data set of nearest genes in our ChIP-seq analysis. The outcome was an enrichment plot, shown in Figure 5 and Supplementary Figure S3. The results in Figure 5 demonstrate a significant association of the high density of ChIP-seq genes in the running sum plot with the genes that were differentially expressed with higher fold changes between fed and fasted conditions, indicating that the two data sets are significantly correlated. The enrichment score (ES) 0.6 was obtained by running GSEA with 8350 as number of permutation with P-value less than 1.818181E-5. A similar significant correlation was observed between the two data sets from ChIP-seq and from gene expression profiling obtained from WT versus KO under fasted conditions (Supplementary Figure S3). Fasting triggers adaptive changes in metabolic processes primarily for carbohydrates, lipids and amino acids in the liver (31). We show in Supplementary Table S4 examples of ChIP-seq genes in the metabolic processes, which have been significantly correlated with genes in the mRNA profiling. Functional categories of genes were obtained by GO analysis, as described below, to analyse ChIP-seq genes. Insulin-like growth factor-binding protein 1 (Igfbp1) is shown as a positive control, as the expression of the gene is directly regulated by FoxO1 and changed during fasting (32,33).
Figure 5.

Gene set enrichment analysis. All genes (n = ∼2.5 × 10⁴) in microarray expression profiling from fed versus fasted mouse livers were ranked by fold difference and P-value and expressed on the x-axis. This data set was compared with the gene list of nearest genes (n = 296) identified in ChIP-seq peaks located within 20 kb of a known gene. The plot of running sum for genes in ChIP-seq data is shown at the bottom with the leading-edge subset. The location of maximum enrichment score indicates a high correlation of the two data sets.
To analyse the putative biological function of FoxO1 ChIP-seq genes, we performed GO analysis using the National Institutes of Health Database for Annotation, Visualization and Integrated Discovery GO (22). When the genes nearest within 20 kb of the FoxO1-binding peaks were analysed by broad biological categories, the metabolic process (GO:0008152, 54%) and cellular process (GO:0009987, 47%) turned out as highest enriched terms (Supplementary Table S1). When we performed the analysis for more specialized biological processes, we found that FoxO1 ChIP-seq genes are significantly associated with metabolic processes for carboxylic acids, steroids, fatty acids and amino acids (Supplementary Table S2). Some genes were also categorized for biological processes involved in regulation of DNA replication and gene expression/transcription. Unexpectedly, with a high fold enrichment score, we also observed a category of retinoid (vitamin A) metabolic processes where dehydrogenase/reductase SDR family member 9 (Dhrs9), retinol saturase (Retsat), Rbp1 and Rdh8 were included. Interestingly, retinoids have been shown to play an important role in hepatic gluconeogenesis (13–15). Given that FoxO1 plays a critical role in hepatic gluconeogenesis, we were prompted to investigate the involvement of FoxO1 in retinoid metabolism further and its association with hepatic gluconeogenesis.
We first confirmed the FoxO1 binding to the genomic region of the genes in retinoid metabolic processes. Gene-specific manual ChIP was performed with an anti-FoxO1 or IgG. The chromatin peak regions bearing the FoxO1-binding motif were amplified by qPCR with gene specific primers. Additionally, we randomly picked several FoxO1-binding peak regions and the enrichment of FoxO1 was verified. The peaks for Elk4, Pck1 and Pdk4 are visualized in Figure 2 as examples. The results demonstrate significant enrichment of FoxO1 in the chromatin peak regions associated with the genes in retinoid metabolism as well as others selected randomly (Table 1). We used Pdk4 and Pck1-a as positive controls for FoxO1 binding and Rpl32 was used as a negative control. We noticed minor peaks for Pck1 (Figure 2), which were not identified as significant peaks by our peak finding program. qPCR confirmation of FoxO1 binding to the regions indicated no significant enrichment of FoxO1 binding (data not shown).
Table 1.
Gene-specific ChIP analysis was performed with an anti-FoxO1 or IgG
| Gene | Fold change | P-value |
|---|---|---|
| Dhrs9 | 6.01 | 0.0024 |
| Retsat | 4.94 | 0.0117 |
| Rbp1 | 3.79 | 0.0293 |
| Rdh8 | 3.87 | 0.0066 |
| Elk4 | 4.79 | 0.0000 |
| Midn | 4.21 | 0.0151 |
| Itpa | 1.76 | 0.0078 |
| Nr0b2 | 2.59 | 0.0035 |
| Txnip | 3.05 | 0.0001 |
| Pdk4 | 12.52 | 0.0015 |
| Pck1 | 6.34a | 0.0045 |
| Pck1 | 6.01b | 0.0024 |
| Rpl32 | 0.82 |
Twelve FoxO1-binding regions were randomly picked from ChIP-seq data, and the chromatin regions that harbor the FoxO1-binding site were amplified by qPCR using gene-specific primers. Results are expressed as fold change in comparison of DNA enriched by an anti-FoxO1 with that of IgG. Data represent the mean of triplicates.
a,bIndicate the peaks Pck1-a and Pck1-b, shown in Figure 2, respectively.
Because FoxO1 activity is increased during fasting, regulating its target genes, we wondered whether the expression of the putative FoxO1 target genes in retinoid metabolism is altered during fasting. As shown in Supplementary Figure S4, there was a significant elevation of Retsat expression by fasting, consistent with a previous report (34). The expression of Dhrs9 and Rdh8 was not significantly changed. We observed a mild but statistically significant reduction of Rbp1 expression by fasting. Expression of Pck1 and sterol regulatory binding protein 1c, a key regulator of hepatic lipogenesis (35), was shown as positive and negative controls for fasting, respectively. There was no significant change in FoxO1 mRNA levels.
If FoxO1 is an important player in retinoid metabolism, deletion of FoxO1 should result in impaired retinoid signaling in regulating its downstream signaling targets. To test this idea, we knock-downed FoxO1 in primary hepatocytes by an shRNA adenovirus targeting FoxO1 (FoxO1 shRNA) and analysed mRNA expression of genes for Pck1 and Pdk4 in response to retinol or atRA, as Pck1 and Pdk4 have been shown regulated by retinoids (13,14,16–18). Efficient knockdown of FoxO1 by FoxO1 shRNA is shown in Supplementary Figure S5 along with significantly reduced expression of Pck1, a known FoxO1 target. In line with our ChIP-seq analysis, the expression levels of genes for Retsat, Rbp1, Dhrs9 and Rdh8 in retinoid metabolism were significantly lower in hepatocytes where FoxO1 expression was disrupted. As shown in Figure 6, expression of Pck1 was significantly induced by retinol and atRA, consistent with the presence of retinoic acid response elements in the promoter region (13,16). PDK4 phosphorylates and inhibits the pyruvate dehydrogenase complex, promoting the conversion of pyruvate to lactate that is used for hepatic gluconeogenesis. We also observed markedly increased Pdk4 expression by retinol and atRA. In contrast, the gene encoding glucose-6-phosphatase showed no significant response to retinol and atRA. Notably, deletion of FoxO1 resulted in a significantly blunted induction of Pck1 and Pdk4 in response to retinol and atRA, suggesting that FoxO1 is required for full response of the genes to retinoids.
Figure 6.

FoxO1 is required for full response of Pck1 and Pdk4 to retinoids. Primary mouse hepatocytes were infected with an adenovirus expressing FoxO1 shRNA or un-specific RNAi for 24 h. Hepatocytes were treated with retinol (20 µM) or atRA (20 µM) for 6 h. mRNA levels were measured by qPCR and were normalized for ribosomal protein Rpl32 mRNA levels. Results are expressed as fold change relative to those of control. The mean values obtained from triplicates in each group as shown with error bars. *P < 0.05. Ctrl = control; rol = retinol; atRA = all-trans RA.
In addition to FoxO1, FoxA2, a member of the FoxA subfamily of forkhead box proteins, plays important roles in hepatic metabolism (36). FoxA2 has been shown to be involved in hepatic glucose homeostasis by regulating genes for Pck1, G6pc and tyrosine aminotransferase (37–39). FoxA2 also has been shown to be involved in hepatic lipid metabolism (40). To investigate whether FoxO1 and FoxA2 share some aspects of their biological functions in the liver or whether they have their own distinctive function, we compared our FoxO1 ChIP-seq data with those of FoxA2 ChIP-seq. Examples of peaks that represent a dual target by FoxO1 and FoxA2, and a distinctive target by FoxO1 or FoxA2, are shown in Supplementary Figure S7. Tmem140 is a putative dual target by FoxO1 and FoxA2, whereas Fig1a is a putative FoxO1-specific target. Bcas3 is shown as a putative FoxA2-specific target. We found that 58.6% of FoxO1 ChIP-seq genes were co-targeted by FoxA2, whereas the remaining FoxO1 ChIP-seq genes turned out as FoxO1-specific genes (Supplementary Figure S8). A GO analysis suggests that FoxO1 and FoxA2 share their roles in metabolic processes for carboxylic acids, lipids and steroids (Supplementary Table S5). Interestingly, the category of vitamin A metabolic processes appeared as a functional group that is shared by FoxO1 and FoxA2. In addition to their shared functions, we found that FoxO1 and FoxA2 may have distinct function in DNA metabolism and liver development, respectively (Supplementary Tables S6 and S7).
DISCUSSION
The current study provides high-resolution mapping of FoxO1-binding sites throughout the mouse genome in hepatic chromatin. We identified 401 FoxO1-binding locations on a genome-wide level. To identify functionally significant FoxO1-binding locations, we used two independent negative controls in our ChIP-seq study. One was an IgG control for non-specific binding of FoxO1 antibody in chromatin from WT mice, as an IgG control is used widespread in conventional ChIP-seq studies. Because there are four members of the mammalian FoxO family that share a conserved DNA-binding domain (5), we used l-FoxO1 KO mice to establish the specificity of FoxO1 against other FoxO1 proteins. Chromatin from l-FoxO1 KO mice was immunoprecipitated with an anti-FoxO1 and used as a second mock control. This approach would eliminate the possibility that ChIP-seq data could be driven erroneously from the cross-reactivity of anti-FoxO1 with other FoxO proteins, supporting that the peaks found in our studies are likely representative of binding sites specifically for FoxO1. Notably, the density maps of negative controls, IgG in WT and anti-FoxO1 in l-FoxO1 KO, (Figure 3A, columns 1 and 3 in the top panel) show no visible distinct line at the center that is generated from peaks otherwise shown in ChIP with an anti-FoxO1 in WT (Figure 3A, columns 2, 4 and 5 in the top panel).
The analysis of FoxO1-binding peak distribution demonstrates that the majority of peaks were located distant from TSS. This trend of genome-wide transcription factor binding is consistent with other studies (41,42). In particular, in RAW264.7 macrophages stably over-expressing FoxO1, only 5.23% of FoxO1 peaks are found in the proximal regions (43). Similarly, 6% of binding sites for FoxA2 in mouse livers were mapped within 1 kb from TSS (20). Although intergenic binding sites of some transcription factors have been suggested to mediate biological functions of the factors (44,45), it remains largely elusive what the precise biological functions of transcription factor bindings in non-proximal promoter regulatory regions would be.
We compared our ChIP-seq data with global analysis of gene expression regulated by FoxO1 in mouse livers (Figure 5 and Supplementary Figure S3). The high degree of correlation between the two data sets demonstrates the functional relevance of our FoxO1 ChIP-seq genes. During fasting conditions in liver, FoxO1 plays a significant role in glucose production by regulating gluconeogenesis, whereas it functions in suppressing lipid accumulation (3,4,46). Consistent with the role of FoxO1 during fasting, GO analysis of ChIP-seq genes found in GSEA showed significant enrichment of functional groups of genes in metabolic processes for carboxylic acids, fatty acids and amino acids. Supplementary Table S4 shows examples of putative novel FoxO1 targets in the metabolic processes along with known FoxO1 targets, Pck1 and Igfbp1. As the three metabolic processes are shown most significantly affected during fasting (31), the data support the relevance of FoxO1 ChIP-seq genes in hepatic metabolism during fasting.
In line with these findings, motif search within the FoxO1-binding peaks by MEME revealed 5′ GTAAACA 3′ that closely matches a consensus FoxO1-binding site (28). It is enriched in 90% of the peaks with the highest enrichment score (E = 3.1e-150) (Figure 4C). FoxO1 has been shown to cooperate with multiple transcription factors to regulate its target gene expression (29). The co-enriched transcription factor-binding sites (Supplementary Table S3) found in our studies are consistent with previous studies that FoxO1 is associated with HNF-4, ERRα, CEBPβ and GR. While FoxO1 synergizes with HNF-4 to induce transcription of G6pc, it plays a role in modulating the activity of ERR and peroxisome proliferator-activated receptor gamma coactivator 1 to regulate Pdk4 expression (47,48). FoxO1 functions cooperatively with CEBPβ and CEBPα, an isoform of CEBPβ, to regulate Pck1 expression in perinatal liver (49). Additionally, FoxO1 serves as an accessory factor for GR-mediated transcription of Pck1, Igfbp1 and Pdk4 possibly by recruiting and directly interacting with p300/CREB-binding protein (CBP), which also binds to GR (50–52). These co-regulatory transcription factors play important roles in hepatic metabolism, supporting the critical biological function of FoxO1 for the metabolic network in the liver.
It has been shown that the binding affinity of FoxO1 to its consensus site is enhanced by the presence of its reverse complementary sequence and a specific 6-mer sequence in the flanking regions of the binding site. This increased binding of FoxO1 has been shown to enhance transcriptional activity of FoxO1 in regulating its target gene expression (30). Interestingly, the results from our studies that the majority of peaks contain one FoxO1-binding site suggest that in vivo, FoxO1 is able to bind to a single DNA-binding site. This is in line with a previous study showing that a single consensus motif is sufficient for FoxO1 binding (28). Among the peaks containing two binding sites, we observed that 42% of duplicate FoxO1-binding sites consist of a binding site and its reverse complementary copy in the flaking regions, and that the remaining duplicate FoxO1-binding sites are arranged in a direct repeat manner. Therefore, it is likely that the multiple DNA-binding sites can be either in a direct- or inverted-repeat manner.
GO analysis of FoxO1 and FoxA2 overlapping genes demonstrates that FoxO1 and FoxA2 may share metabolic processes for carboxylic acids, lipids and steroids. Indeed, FoxO1 and FoxA2 play roles in hepatic glucose homeostasis by controlling gluconeogenic gene expression (3,4,37,39). Additionally, both transcription factors have been shown to be involved in lipid metabolism. FoxO1 controls hepatic lipid accumulation by increasing expression of gene for microsomal triglyceride transfer protein to promote triglyceride (TG) secretion during fasting (46), whereas FoxA2 increases fatty acid oxidation and TG secretion, reducing hepatic TG accumulation (40). Interestingly, we observed that in GO analysis of FoxO1-only or FoxA2-only genes, different sets of genes were categorized in some of the same functional groups found in the GO analysis of overlapping genes. Therefore, it is possible that FoxO1 and FoxA2 may share some metabolic pathways through regulating their common targets as well as their distinct targets in the same pathways. Nevertheless, it is likely that they may have their distinct functions, shown in Supplementary Figures S6 and S7.
Starvation triggers a complex array of physiologic and biochemical pathways to adapt changes in energy metabolism. In liver, glucose production is increased by glycogenolysis and gluconeogenesis from non-carbohydrate precursors to meet the need for glucose as an energy source, especially for the brain and nervous system, whereas there is increased fatty acid oxidation and ketone body production. Amino acids serve as non-carbohydrate precursors for gluconeogenesis, and there is a significantly increased amino acid catabolism during fasting. GO analysis of the FoxO1 ChIP-seq genes demonstrated that the ChIP-seq genes are most highly enriched in broad categories of metabolic processes. In particular, they were significantly associated with metabolic processes for carboxylic acids, steroids and fatty acids, which is in accordance with known functions of FoxO1 shown in previous studies. A functional category of metabolic processes for cellular amino acid metabolism was also observed. Interestingly, there was an additional category of gene cluster that is involved in retinoid metabolic processes. In the current report, we demonstrate the possibility of a previously unappreciated role of FoxO1 in retinoid metabolic processes and suggest that FoxO1 may couple retinoid metabolism to hepatic gluconeogenesis.
It is generally thought that retinoids exert their roles in biological functions by their active metabolite, atRA, a ligand for RARs. The physiological synthesis of atRA is tightly controlled through processes involving retinoid-binding proteins and retinoid-metabolizing enzymes (12). RetSat catalyzes the saturation of all-trans retinol to (R) all-trans 13,14-dihydroretinol (dhretinol). Interestingly, dhretinol has also been shown to bind to RARs, regulating RAR-dependent gene expression (53). It remains unknown whether the concentrations of retinoid metabolites are being changed during the period of transition from the fed to fasted states in liver. Based on our study, however, it would be possible that altered expression of genes, including Retsat and Rbp1, during fasting might influence the availability of retinoid metabolites for RARs, which in turn affects their downstream signaling targets. Alternately, it is possible that altered retinoid metabolites could function independently of atRA. Indeed, recent studies have shown that parental vitamin A (retinol) and retinaldehyde exert their action through signaling that is not mediated by RARs/retinoid X receptors (54,55). It would be interesting to investigate further how the alterations of RetSat and RBP1 modulate their downstream signaling pathways.
Regulation of the Pck1 gene by retinoids has been well documented in vivo and in vitro. Two retinoic acid response elements that mediate retinoic acid responsiveness have been identified on the Pck1 promoter (13,16). Pck1 encodes the rate-limiting enzyme in hepatic gluconeogenesis, and the expression of the gene is induced by fasting. Importantly, this fasting-mediated induction of Pck1 is blunted by vitamin A deficiency (14). Additionally, increased retinol-binding protein-4 (RBP-4), a transport protein for retinol in the circulation, causes insulin resistance and elevated hepatic Pck1 expression (56). Similar to Pck1, Pdk4 expression is markedly reduced in vivo by vitamin A deficiency (17,18). These findings suggest that retinoids play a significant role in regulating hepatic glucose metabolism. Because aberrant expression of Pck1 and Pdk4 is associated with insulin resistance in type 2 diabetes, tight control of retinoid metabolic processes might be needed to maintain glucose homeostasis.
Our current studies show that the deletion of FoxO1 in primary hepatocytes resulted in blunted induction of Pck1 and Pdk4 in response to retinol and atRA, suggesting that FoxO1 is required for full response of the genes to retinoids. Based on our studies, we propose that during feeding conditions where there is increased circulating insulin, phosphorylated FoxO1 in the cytoplasm would be ineffective in activating its target genes, including those in retinoid metabolism, which would result in diminished effects of retinoids on its downstream targets. Under fasting conditions when the circulating levels of insulin go down, nuclear FoxO1 would regulate its target genes, including genes in retinoid metabolism. This would in turn regulate downstream targets of retinoids such as Pck1 and Pdk4, to supply glucose needed during fasting. In support of our notion, retinoid-mediated regulation of Pck1 gene expression is significantly blocked by insulin (15). Hyperglycemia is the hallmark of type 2 diabetes, which is highly associated with insulin resistance. Under the insulin-resistant status, overactive FoxO1 promotes hepatic glucose production. We propose that alterations in gene expression in retinoid signaling by overactive FoxO1 might contribute in part to the hyperglycemia associated with insulin resistance. There is growing evidence that retinoids play a role in energy expenditure and adiposity (55,57,58). Consistently, altered retinoid signaling pathways have been implicated in type 2 diabetes and insulin resistance. Future studies will be warranted to explore the involvement of FoxO1 in retinoid signaling and its crosstalk with insulin in diabetes.
SUPPLEMENTARY DATA
Supplementary Data are available at NAR Online: Supplementary Tables 1–9, Supplementary Figures 1–8, Supplementary Methods and Supplementary Reference [59].
FUNDING
National Institutes of Health [DK71021, HL48044 to T.O., DE021088 to D.-G.S.]; American Heart Association Scientist Development Grant [0730189N to D.-J.S.]. Funding for open access charge: NIH [HL48044].
Conflict of interest statement. None declared.
Supplementary Material
ACKNOWLEDGEMENTS
The authors are grateful to Dr. D. Accili for providing Ad-FoxO1 shRNA. They thank the Genomics Microarray Facility at the University of California, Irvine, for help with Affymetrix microarray.
REFERENCES
- 1.Pilkis SJ, Granner DK. Molecular physiology of the regulation of hepatic gluconeogenesis and glycolysis. Annu. Rev. Physiol. 1992;54:885–909. doi: 10.1146/annurev.ph.54.030192.004321. [DOI] [PubMed] [Google Scholar]
- 2.Nakae J, Park BC, Accili D. Insulin stimulates phosphorylation of the forkhead transcription factor FKHR on serine 253 through a Wortmannin-sensitive pathway. J. Biol. Chem. 1999;274:15982–15985. doi: 10.1074/jbc.274.23.15982. [DOI] [PubMed] [Google Scholar]
- 3.Hall RK, Yamasaki T, Kucera T, Waltner-Law M, O'Brien R, Granner DK. Regulation of phosphoenolpyruvate carboxykinase and insulin-like growth factor-binding protein-1 gene expression by insulin. The role of winged helix/forkhead proteins. J. Biol. Chem. 2000;275:30169–30175. doi: 10.1074/jbc.M004898200. [DOI] [PubMed] [Google Scholar]
- 4.Nakae J, Kitamura T, Silver DL, Accili D. The forkhead transcription factor Foxo1 (Fkhr) confers insulin sensitivity onto glucose-6-phosphatase expression. J. Clin. Invest. 2001;108:1359–1367. doi: 10.1172/JCI12876. [DOI] [PMC free article] [PubMed] [Google Scholar]
- 5.Barthel A, Schmoll D, Unterman TG. FoxO proteins in insulin action and metabolism. Trends Endocrinol. Metab. 2005;16:183–189. doi: 10.1016/j.tem.2005.03.010. [DOI] [PubMed] [Google Scholar]
- 6.Matsumoto M, Pocai A, Rossetti L, Depinho RA, Accili D. Impaired regulation of hepatic glucose production in mice lacking the forkhead transcription factor Foxo1 in liver. Cell Metab. 2007;6:208–216. doi: 10.1016/j.cmet.2007.08.006. [DOI] [PubMed] [Google Scholar]
- 7.Pajvani UB, Shawber CJ, Samuel VT, Birkenfeld AL, Shulman GI, Kitajewski J, Accili D. Inhibition of Notch signaling ameliorates insulin resistance in a FoxO1-dependent manner. Nat. Med. 2011;17:961–967. doi: 10.1038/nm.2378. [DOI] [PMC free article] [PubMed] [Google Scholar]
- 8.Liu H, Fergusson MM, Wu JJ, Rovira II, Liu J, Gavrilova O, Lu T, Bao J, Han D, Sack MN, et al. Wnt signaling regulates hepatic metabolism. Sci. Signal. 2011;4:ra6. doi: 10.1126/scisignal.2001249. [DOI] [PMC free article] [PubMed] [Google Scholar]
- 9.Gross DN, van den Heuvel AP, Birnbaum MJ. The role of FoxO in the regulation of metabolism. Oncogene. 2008;27:2320–2336. doi: 10.1038/onc.2008.25. [DOI] [PubMed] [Google Scholar]
- 10.Johnson DS, Mortazavi A, Myers RM, Wold B. Genome-wide mapping of in vivo protein-DNA interactions. Science. 2007;316:1497–1502. doi: 10.1126/science.1141319. [DOI] [PubMed] [Google Scholar]
- 11.Shirakami Y, Lee SA, Clugston RD, Blaner WS. Hepatic metabolism of retinoids and disease associations. Biochim. Biophys. Acta. 2011;1821:124–136. doi: 10.1016/j.bbalip.2011.06.023. [DOI] [PMC free article] [PubMed] [Google Scholar]
- 12.Napoli JL. Physiological insights into all-trans-retinoic acid biosynthesis. Biochim. Biophys. Acta. 2012;1821:152–167. doi: 10.1016/j.bbalip.2011.05.004. [DOI] [PMC free article] [PubMed] [Google Scholar]
- 13.Lucas PC, O'Brien RM, Mitchell JA, Davis CM, Imai E, Forman BM, Samuels HH, Granner DK. A retinoic acid response element is part of a pleiotropic domain in the phosphoenolpyruvate carboxykinase gene. Proc. Natl Acad. Sci. USA. 1991;88:2184–2188. doi: 10.1073/pnas.88.6.2184. [DOI] [PMC free article] [PubMed] [Google Scholar]
- 14.Shin DJ, McGrane MM. Vitamin A regulates genes involved in hepatic gluconeogenesis in mice: phosphoenolpyruvate carboxykinase, fructose-1,6-bisphosphatase and 6-phosphofructo-2-kinase/fructose-2,6-bisphosphatase. J. Nutr. 1997;127:1274–1278. doi: 10.1093/jn/127.7.1274. [DOI] [PubMed] [Google Scholar]
- 15.Zhang Y, Li R, Chen W, Li Y, Chen G. Retinoids induced Pck1 expression and attenuated insulin-mediated suppression of its expression via activation of retinoic acid receptor in primary rat hepatocytes. Mol. Cell Biochem. 2011; 355:1–8. doi: 10.1007/s11010-011-0831-4. [DOI] [PubMed] [Google Scholar]
- 16.Scott DK, Mitchell JA, Granner DK. Identification and charaterization of the second retinoic acid response element in the phosphoenolpyruvate carboxykinase gene promoter. J. Biol. Chem. 1996;271:6260–6264. doi: 10.1074/jbc.271.11.6260. [DOI] [PubMed] [Google Scholar]
- 17.Kang HW, Bhimidi GR, Odom DP, Brun PJ, Fernandez ML, McGrane MM. Altered lipid catabolism in the vitamin A deficient liver. Mol. Cell. Endocrinol. 2007;271:18–27. doi: 10.1016/j.mce.2007.03.002. [DOI] [PubMed] [Google Scholar]
- 18.McClintick JN, Crabb DW, Tian H, Pinaire J, Smith JR, Jerome RE, Edenberg HJ. Global effects of vitamin A deficiency on gene expression in rat liver: evidence for hypoandrogenism. J. Nutr. Biochem. 2006;17:345–355. doi: 10.1016/j.jnutbio.2005.08.006. [DOI] [PubMed] [Google Scholar]
- 19.Shin DJ, Osborne TF. FGF15/FGFR4 integrates growth factor signaling with hepatic bile acid metabolism and insulin action. J. Biol. Chem. 2009;284:11110–11120. doi: 10.1074/jbc.M808747200. [DOI] [PMC free article] [PubMed] [Google Scholar]
- 20.Wederell ED, Bilenky M, Cullum R, Thiessen N, Dagpinar M, Delaney A, Varhol R, Zhao Y, Zeng T, Bernier B, et al. Global analysis of in vivo Foxa2-binding sites in mouse adult liver using massively parallel sequencing. Nucleic Acids Res. 2008;36:4549–4564. doi: 10.1093/nar/gkn382. [DOI] [PMC free article] [PubMed] [Google Scholar]
- 21.Bailey TL, Boden M, Buske FA, Frith M, Grant CE, Clementi L, Ren J, Li WW, Noble WS. MEME SUITE: tools for motif discovery and searching. Nucleic Acids Res. 2009;37:W202–W208. doi: 10.1093/nar/gkp335. [DOI] [PMC free article] [PubMed] [Google Scholar]
- 22.Huang da W, Sherman BT, Lempicki RA. Systematic and integrative analysis of large gene lists using DAVID bioinformatics resources. Nat. Protoc. 2009;4:44–57. doi: 10.1038/nprot.2008.211. [DOI] [PubMed] [Google Scholar]
- 23.Subramanian A, Tamayo P, Mootha VK, Mukherjee S, Ebert BL, Gillette MA, Paulovich A, Pomeroy SL, Golub TR, Lander ES, et al. Gene set enrichment analysis: a knowledge-based approach for interpreting genome-wide expression profiles. Proc. Natl Acad. Sci. USA. 2005;102:15545–15550. doi: 10.1073/pnas.0506580102. [DOI] [PMC free article] [PubMed] [Google Scholar]
- 24.Wettenhall JM, Smyth GK. limmaGUI: a graphical user interface for linear modeling of microarray data. Bioinformatics. 2004;20:3705–3706. doi: 10.1093/bioinformatics/bth449. [DOI] [PubMed] [Google Scholar]
- 25.Tusher VG, Tibshirani R, Chu G. Significance analysis of microarrays applied to the ionizing radiation response. Proc. Natl Acad. Sci. USA. 2001;98:5116–5121. doi: 10.1073/pnas.091062498. [DOI] [PMC free article] [PubMed] [Google Scholar]
- 26.Newton MA, Noueiry A, Sarkar D, Ahlquist P. Detecting differential gene expression with a semiparametric hierarchical mixture method. Biostatistics. 2004;5:155–176. doi: 10.1093/biostatistics/5.2.155. [DOI] [PubMed] [Google Scholar]
- 27.Ma K, Zhang Y, Elam MB, Cook GA, Park EA. Cloning of the rat pyruvate dehydrogenase kinase 4 gene promoter: activation of pyruvate dehydrogenase kinase 4 by the peroxisome proliferator-activated receptor gamma coactivator. J. Biol. Chem. 2005;280:29525–29532. doi: 10.1074/jbc.M502236200. [DOI] [PubMed] [Google Scholar]
- 28.Furuyama T, Nakazawa T, Nakano I, Mori N. Identification of the differential distribution patterns of mRNAs and consensus binding sequences for mouse DAF-16 homologues. Biochem. J. 2000;349:629–634. doi: 10.1042/0264-6021:3490629. [DOI] [PMC free article] [PubMed] [Google Scholar]
- 29.van der Vos KE, Coffer PJ. FOXO-binding partners: it takes two to tango. Oncogene. 2008;27:2289–2299. doi: 10.1038/onc.2008.22. [DOI] [PubMed] [Google Scholar]
- 30.Sidhu A, Miller PJ, Johanson KE, Hollenbach AD. Novel flanking DNA sequences enhance FOXO1a DNA binding affinity but do not alter DNA bending. Biochemistry. 2008;47:6809–6818. doi: 10.1021/bi702495m. [DOI] [PubMed] [Google Scholar]
- 31.Sokolovic M, Sokolovic A, Wehkamp D, Ver Loren van Themaat E, de Waart DR, Gilhuijs-Pederson LA, Nikolsky Y, van Kampen AH, Hakvoort TB, Lamers WH. The transcriptomic signature of fasting murine liver. BMC Genomics. 2008;9:528. doi: 10.1186/1471-2164-9-528. [DOI] [PMC free article] [PubMed] [Google Scholar]
- 32.Durham SK, Suwanichkul A, Scheimann AO, Yee D, Jackson JG, Barr FG, Powell DR. FKHR binds the insulin response element in the insulin-like growth factor binding protein-1 promoter. Endocrinology. 1999;140:3140–3146. doi: 10.1210/endo.140.7.6856. [DOI] [PubMed] [Google Scholar]
- 33.Murphy LJ, Seneviratne C, Moreira P, Reid RE. Enhanced expression of insulin-like growth factor-binding protein-I in the fasted rat: the effects of insulin and growth hormone administration. Endocrinology. 1991;128:689–696. doi: 10.1210/endo-128-2-689. [DOI] [PubMed] [Google Scholar]
- 34.Sun Y, Ng L, Lam W, Lo CK, Chan PT, Yuen YL, Wong PF, Tsang DS, Cheung WT, Lee SS. Identification and characterization of a novel mouse peroxisome proliferator-activated receptor alpha-regulated and starvation-induced gene, Ppsig. Int. J. Biochem. Cell Biol. 2008;40:1775–1791. doi: 10.1016/j.biocel.2008.01.006. [DOI] [PubMed] [Google Scholar]
- 35.Horton JD, Bashmakov Y, Shimomura I, Shimano H. Regulation of sterol regulatory element binding proteins in livers of fasted and refed mice. Proc. Natl Acad. Sci. USA. 1998;95:5987–5992. doi: 10.1073/pnas.95.11.5987. [DOI] [PMC free article] [PubMed] [Google Scholar]
- 36.Friedman JR, Kaestner KH. The Foxa family of transcription factors in development and metabolism. Cell Mol. Life Sci. 2006;63:2317–2328. doi: 10.1007/s00018-006-6095-6. [DOI] [PMC free article] [PubMed] [Google Scholar]
- 37.Lin B, Morris DW, Chou JY. The role of HNF1alpha, HNF3gamma, and cyclic AMP in glucose-6-phosphatase gene activation. Biochemistry. 1997;36:14096–14106. doi: 10.1021/bi9703249. [DOI] [PubMed] [Google Scholar]
- 38.Roux J, Pictet R, Grange T. Hepatocyte nuclear factor 3 determines the amplitude of the glucocorticoid response of the rat tyrosine aminotransferase gene. DNA Cell Biol. 1995;14:385–396. doi: 10.1089/dna.1995.14.385. [DOI] [PubMed] [Google Scholar]
- 39.Wang JC, Stromstedt PE, O'Brien RM, Granner DK. Hepatic nuclear factor 3 is an accessory factor required for the stimulation of phosphoenolpyruvate carboxykinase gene transcription by glucocorticoids. Mol. Endocrinol. 1996;10:794–800. doi: 10.1210/mend.10.7.8813720. [DOI] [PubMed] [Google Scholar]
- 40.Wolfrum C, Asilmaz E, Luca E, Friedman JM, Stoffel M. Foxa2 regulates lipid metabolism and ketogenesis in the liver during fasting and in diabetes. Nature. 2004;432:1027–1032. doi: 10.1038/nature03047. [DOI] [PubMed] [Google Scholar]
- 41.Robertson G, Hirst M, Bainbridge M, Bilenky M, Zhao Y, Zeng T, Euskirchen G, Bernier B, Varhol R, Delaney A, et al. Genome-wide profiles of STAT1 DNA association using chromatin immunoprecipitation and massively parallel sequencing. Nat. Methods. 2007;4:651–657. doi: 10.1038/nmeth1068. [DOI] [PubMed] [Google Scholar]
- 42.Visel A, Blow MJ, Li Z, Zhang T, Akiyama JA, Holt A, Plajzer-Frick I, Shoukry M, Wright C, Chen F, et al. ChIP-seq accurately predicts tissue-specific activity of enhancers. Nature. 2009;457:854–858. doi: 10.1038/nature07730. [DOI] [PMC free article] [PubMed] [Google Scholar]
- 43.Fan W, Morinaga H, Kim JJ, Bae E, Spann NJ, Heinz S, Glass CK, Olefsky JM. FoxO1 regulates Tlr4 inflammatory pathway signalling in macrophages. EMBO J. 2010;29:4223–4236. doi: 10.1038/emboj.2010.268. [DOI] [PMC free article] [PubMed] [Google Scholar]
- 44.Li XY, MacArthur S, Bourgon R, Nix D, Pollard DA, Iyer VN, Hechmer A, Simirenko L, Stapleton M, Luengo Hendriks CL, et al. Transcription factors bind thousands of active and inactive regions in the Drosophila blastoderm. PLoS Biol. 2008;6:e27. doi: 10.1371/journal.pbio.0060027. [DOI] [PMC free article] [PubMed] [Google Scholar]
- 45.Tanay A. Extensive low-affinity transcriptional interactions in the yeast genome. Genome Res. 2006;16:962–972. doi: 10.1101/gr.5113606. [DOI] [PMC free article] [PubMed] [Google Scholar]
- 46.Kamagate A, Qu S, Perdomo G, Su D, Kim DH, Slusher S, Meseck M, Dong HH. FoxO1 mediates insulin-dependent regulation of hepatic VLDL production in mice. J. Clin. Invest. 2008;118:2347–2364. doi: 10.1172/JCI32914. [DOI] [PMC free article] [PubMed] [Google Scholar]
- 47.Hirota K, Sakamaki J, Ishida J, Shimamoto Y, Nishihara S, Kodama N, Ohta K, Yamamoto M, Tanimoto K, Fukamizu A. A combination of HNF-4 and Foxo1 is required for reciprocal transcriptional regulation of glucokinase and glucose-6-phosphatase genes in response to fasting and feeding. J. Biol. Chem. 2008;283:32432–32441. doi: 10.1074/jbc.M806179200. [DOI] [PubMed] [Google Scholar]
- 48.Zhang Y, Ma K, Sadana P, Chowdhury F, Gaillard S, Wang F, McDonnell DP, Unterman TG, Elam MB, Park EA. Estrogen-related receptors stimulate pyruvate dehydrogenase kinase isoform 4 gene expression. J. Biol. Chem. 2006;281:39897–39906. doi: 10.1074/jbc.M608657200. [DOI] [PubMed] [Google Scholar]
- 49.Sekine K, Chen YR, Kojima N, Ogata K, Fukamizu A, Miyajima A. Foxo1 links insulin signaling to C/EBPalpha and regulates gluconeogenesis during liver development. EMBO J. 2007;26:3607–3615. doi: 10.1038/sj.emboj.7601784. [DOI] [PMC free article] [PubMed] [Google Scholar]
- 50.Kwon HS, Huang B, Unterman TG, Harris RA. Protein kinase B-alpha inhibits human pyruvate dehydrogenase kinase-4 gene induction by dexamethasone through inactivation of FOXO transcription factors. Diabetes. 2004;53:899–910. doi: 10.2337/diabetes.53.4.899. [DOI] [PubMed] [Google Scholar]
- 51.Nasrin N, Ogg S, Cahill CM, Biggs W, Nui S, Dore J, Calvo D, Shi Y, Ruvkun G, Alexander-Bridges MC. DAF-16 recruits the CREB-binding protein coactivator complex to the insulin-like growth factor binding protein 1 promoter in HepG2 cells. Proc. Natl Acad. Sci. USA. 2000;97:10412–10417. doi: 10.1073/pnas.190326997. [DOI] [PMC free article] [PubMed] [Google Scholar]
- 52.Stafford JM, Wilkinson JC, Beechem JM, Granner DK. Accessory factors facilitate the binding of glucocorticoid receptor to the phosphoenolpyruvate carboxykinase gene promoter. J. Biol. Chem. 2001;276:39885–39891. doi: 10.1074/jbc.M105370200. [DOI] [PubMed] [Google Scholar]
- 53.Moise AR, Alvarez S, Dominguez M, Alvarez R, Golczak M, Lobo GP, von Lintig J, de Lera AR, Palczewski K. Activation of retinoic acid receptors by dihydroretinoids. Mol. Pharmacol. 2009;76:1228–1237. doi: 10.1124/mol.109.060038. [DOI] [PMC free article] [PubMed] [Google Scholar]
- 54.Berry DC, Jin H, Majumdar A, Noy N. Signaling by vitamin A and retinol-binding protein regulates gene expression to inhibit insulin responses. Proc. Natl Acad. Sci. USA. 2011;108:4340–4345. doi: 10.1073/pnas.1011115108. [DOI] [PMC free article] [PubMed] [Google Scholar]
- 55.Ziouzenkova O, Orasanu G, Sharlach M, Akiyama TE, Berger JP, Viereck J, Hamilton JA, Tang G, Dolnikowski GG, Vogel S, et al. Retinaldehyde represses adipogenesis and diet-induced obesity. Nat. Med. 2007;13:695–702. doi: 10.1038/nm1587. [DOI] [PMC free article] [PubMed] [Google Scholar]
- 56.Yang Q, Graham TE, Mody N, Preitner F, Peroni OD, Zabolotny JM, Kotani K, Quadro L, Kahn BB. Serum retinol binding protein 4 contributes to insulin resistance in obesity and type 2 diabetes. Nature. 2005;436:356–362. doi: 10.1038/nature03711. [DOI] [PubMed] [Google Scholar]
- 57.Amengual J, Ribot J, Bonet ML, Palou A. Retinoic acid treatment enhances lipid oxidation and inhibits lipid biosynthesis capacities in the liver of mice. Cell Physiol. Biochem. 2010;25:657–666. doi: 10.1159/000315085. [DOI] [PubMed] [Google Scholar]
- 58.Villarroya F, Iglesias R, Giralt M. Retinoids and retinoid receptors in the control of energy balance: novel pharmacological strategies in obesity and diabetes. Curr. Med. Chem. 2004;11:795–805. doi: 10.2174/0929867043455747. [DOI] [PubMed] [Google Scholar]
- 59.Good IJ. Some statistical applications of poisson's work. Stat. Sci. 1986;1:157–171. [Google Scholar]
Associated Data
This section collects any data citations, data availability statements, or supplementary materials included in this article.