

Abstract
It is well known that noise is inevitable in gene regulatory networks due to the low-copy numbers of molecules and local environmental fluctuations. The prediction of noise effects is a key issue in ensuring reliable transmission of information. Interlinked positive and negative feedback loops are essential signal transduction motifs in biological networks. Positive feedback loops are generally believed to induce a switch-like behavior, whereas negative feedback loops are thought to suppress noise effects. Here, by using the signal sensitivity (susceptibility) and noise amplification to quantify noise propagation, we analyze an abstract model of the Myc/E2F/MiR-17-92 network that is composed of a coupling between the E2F/Myc positive feedback loop and the E2F/Myc/miR-17-92 negative feedback loop. The role of the feedback loop on noise effects is found to depend on the dynamic properties of the system. When the system is in monostability or bistability with high protein concentrations, noise is consistently suppressed. However, the negative feedback loop reduces this suppression ability (or improves the noise propagation) and enhances signal sensitivity. In the case of excitability, bistability, or monostability, noise is enhanced at low protein concentrations. The negative feedback loop reduces this noise enhancement as well as the signal sensitivity. In all cases, the positive feedback loop acts contrary to the negative feedback loop. We also found that increasing the time scale of the protein module or decreasing the noise autocorrelation time can enhance noise suppression; however, the systems sensitivity remains unchanged. Taken together, our results suggest that the negative/positive feedback mechanisms in coupled feedback loop dynamically buffer noise effects rather than only suppressing or amplifying the noise.
Introduction
Gene expression is a complex stochastic process involving numerous components and reaction steps. It also spans several time and concentration scales, including gene transcription, translation, and chromosome remodeling. Ozbuda et al. provided the first direct experimental evidence of the biochemical origin of phenotypic noise, this concept is currently receiving increased attention [1]. Phenotypic noise is due to low-copy-number molecules and fluctuations in the local environment [2]. Recently, a quantitative model of noise in genetic networks has been established, and the components that contribute to fluctuations have been suggested [3]. Noise has been found to play a pivotal role in phenotypic variation and cellular differentiation [4]. Fluctuations can be considered useful for balancing precision and diversity in eukaryotic gene expression [5] and for promoting non-genetic diversity to increase the survival capabilities of prokaryotic gene expression [6]. More importantly, noise affects most biological processes, such as cellular development and the determination of cellular fates [7]. Noise levels are also related to the frequency of cellular differentiation, and a noise-related motif can be adjusted based on its dynamic behavior [8].
In a living cell, a gene regulatory network is a complex web in which a reliable signal must be propagated from one gene to the next to execute its genetic program. However, the stochastic fluctuations in gene expression and expression fluctuations transmitted from one gene to the next may interfere with genetic programs [9], and there are inherent noises in the cellular signal transduction networks [10]–[12]. Therefore, expression of a gene can be affected by fluctuations upstream. Thus, a gene's noise can be propagated from its upstream genes. Thus, it is important to address the interactions between gene expression and noise in regulatory networks.
It is well known that, in a gene regulatory network, feedback loops are considered to be common [13] and have a critical role in cellular signaling networks [14], [15]. A feedback loop can use its output as an input signal to adapt to external and internal changes [16]. Hooshangi et al. suggested that the prevalence of feedback motifs in natural systems can be attributed to other favorable cellular behaviors and may provide robustness to extrinsic noise [17]. In addition, Passos et al. showed that a feedback loop is both necessary and sufficient for the stability of growth arrest during the establishment of a senescent phenotype [18]. Moreover, a large number of positive and negative feedback loops exist in various gene regulatory networks. A negative feedback loop produces system stability in genetic and biochemical networks [19] and induces the oscillatory [20] and linear dose-response relationship in gene expression [21]. The positive feedback loop in the mitogen-activated protein kinase (MAPK) cascade of Xenopus oocytes can produce a switch-like response [22], [23] and improves cellular memory [24]. Positive feedback loops can also suppress noise propagation [25]. Both negative and positive feedback loops have important implications for controlling noise in gene regulatory networks.
Interestingly, interlinked positive and negative feedback loops are favored by biological systems. Single positive/negative feedback loops are also important [26], [27]. Examples include the interaction between miR-15a and c-myb in human hematopoietic cells [28], the regulation between cell cycle E2F1 and miR-223 in acute myeloid leukemia [29], the p53-targeting of miR-21 in Glioblastoma cells [30], and the feedback loops involving miR-17-92, E2F and Myc in cancer networks [31] (see Figure 1). Tian et al. suggested that a combination of positive and negative feedback loops can fine-tune dynamic behaviors in gene regulatory networks [28] and create flexible biological switches [32], [33]. Moreover, Hornung showed that fast negative feedback loops can enhance the system stability and that positive feedback can buffer noise propagation within the network via a combination of positive and negative feedback loops [25]. However, it is still not clear how interlinked positive and negative feedback loops affect signal propagation in gene regulatory networks, or how they act in response to stochastic fluctuations in gene expression.
Figure 1. Examples of the interlinked positive and negative feedback loops in genetic networks.

(A) The interaction between C-myb and miR-15a in human hematopoietic cells. (B) The regulation between cell cycle E2F1 and mizr-223 in acute myeloid leukemia. (C) MiR-21 targets p53 in Glioblastoma cells, and (D) the feedback loops involving miR-17-92, E2F and Myc in cancer networks.
To answer these questions, we developed a formula with plausible experimental parameters that represents the systemic signal sensitivity and noise amplification in an abstracted model of E2F/Myc/miR-17-92 networks. Our results show that the role of feedback loop in sensitivity and noise amplification is related to the dynamic properties of the system. The noise is always buffered at high protein concentrations in the monostable and bistable regions, but this buffering ability is reduced by the existence of negative feedback. While the signal sensitivity is enhanced in these regions, the improvements in noise propagation are due to negative feedback. Additionally, the noise is constantly enhanced at low protein concentrations in the excitable, bistable and monostable regions, but this enhancement ability is reduced by the existence of negative feedback. The signal sensitivity is also reduced in these regions. Notably, the effect of positive feedback is opposite to that of negative feedback. Furthermore, we also found that a fast-reacting protein module or a low noise autocorrelation time can enhance noise suppression without changing the signal sensitivity of the system. Our findings show that interlinked positive and negative feedback loops play a key role in reliable signal propagation.
Results
Model formulation
In this study, we use the abstract model of miR-17-92 and E2F/Myc that was presented by Aguda et al. Figure 2 illustrates the essential abstract structure of the Myc/E2F/miR-17-92 network [31], [34]. The terms  and
and  are used to describe the protein module (Myc and E2F) and miRNA cluster module, respectively. The basic principles of the network can be described in terms of
  and
and  in the following equations,
| (1) |
| (2) |
Here,  represents the protein module's autocatalytic process, which is a positive feedback loop, and
  represents the protein that is inhibited by the miRNAs. At the same time, protein module
  induces the transcription of miRNAs
  , which is denoted by
  . The protein is eliminated with a rate constant of
  . The number of the proteins stimulated by a growth factor synthesized in the extracellular medium is
  . The constant
  in Eq. (2) represents the transcription of
  , and
, and  is the degradation rate of
  .
.
Figure 2. An illustration of the reducing process in cancer networks involving miR-17-92, E2F, and Myc.
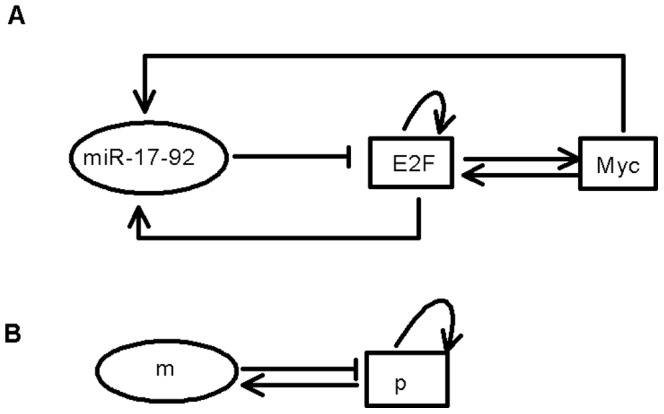
(A) Model of the interaction between E2F, Myc and miR-17-92. (B) The final reduced abstract model. Variables  and
and  represent the protein module (Myc and E2Fs) and the miR-17-92 gene cluster, respectively.
Using the dimensionless variables and parameters,  , Eqs. (1) and (2) can be rewritten as follows by a series of nondimensionalizing processes [31],
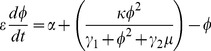 |
(3) |
| (4) |
Because that protein is less stable than miRNA,  is less than 1.0.
  varies in the range of 2.0–5.0. The parameters
  and
and  are experimentally controlled and vary from 0–0.4 and 0–2.5, respectively, and
  is set as 1.0 [31], [34].
The protein and miRNAs in the interlinked Myc/E2F/miR-17-92 network have been shown to transition from monostability to excitability to bistability, then to monostability with increasing  [31], [34]. A practical way of producing diverse signal-response behaviors is to combine
  , the positive feedback loop, with
  , the inhibition of miRNAs [34]. Figure 3 presents an overview of the tunable dynamics in the
  plane.
Figure 3. The bifurcation diagram spanned by the positive feedback ( ) and the miRNAs inhibition (
 ).
).
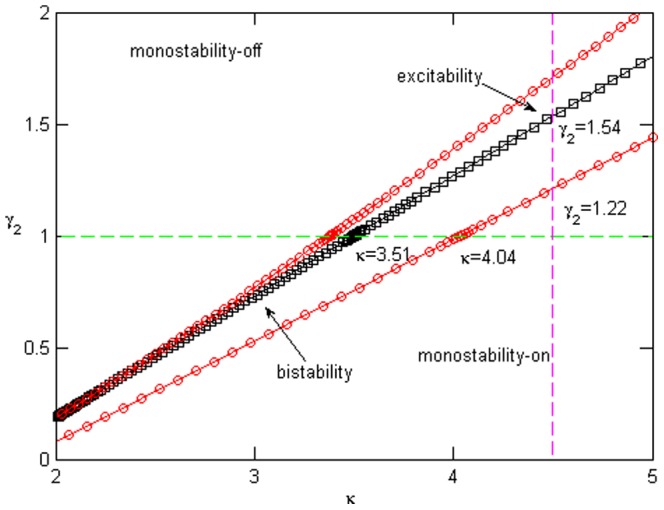
The red circles and black squares on borderlines represent saddle-nodes and Hopf bifurcations, respectively. The diagram includes three features: monostability, bistability, and excitability. The green and plum dashed lines denote the cases in which  and
and  , respectively. The parameter values are
  ,
,  , and
, and  .
.
Three types of dynamics exist: monostability, bistability, and excitability. Note that we denote the low protein steady state as the off state and the high protein steady state as the on state. In monostability, a system remains in a stable state (on/off), when it is perturbed. A bistable system exhibits an unstable state and two stable states [35]. During excitability, there is a rest state, an excited state, and a recovery state. The system resides in the rest state if it is unperturbed. However, the system can leave the rest state in response to a sufficiently strong input stimulus, undergoing firing and refractory states before it returns to a rest state [36]. As shown in Figure 4B, the region from saddle node  to Hopf bifurcation node
  represents excitability (
 ), the region from
  to saddle node bifurcation
  represents the bistability (
 ), and the other regions are monostability. When
  (excitability), there is only one stable state. With a pulse from
  to
to  (monostability-on state), the system exhibits excitability by first coming into a stable state, then jumping into a higher stable state for
  , and finally dropping into the previous stable state post-pulse. However, when the system appears bistable (
 ), as in the case of a pulse from
  to
to  , it undergoes a trajectory from the lower stable state to the higher state for
  , and then to a higher stable state for
  .
.
Figure 4. The steady-state bifurcation diagrams of the protein concentration  (black line) and miRNA concentration
  (red line) for (A)
  and (B)
  with increasing
  and
and  , respectively.

 denote saddle points and
  represent a Hopf bifurcations. Clearly, the system has completed the transitions (A) from monostability to bistability to excitability, and has finally transitioned to monostability with increasing
  or (B) from monostability to excitability to bistability, and has finally transitioned to monostability with increasing
  . The parameter values are
  ,
,  ,
,  , and
, and  .
.
In this work, considering that the contribution of extrinsic noise is dominant [2], we assume that the protein input signal fluctuates around its mean value  ,
,  .
.  denotes the extrinsic noise fluctuation. Since colored noise is more realistic, especially in biological systems [37], the autocorrelation time of
  is non-negligible and is related to the cell cycle [9], [38], [39]. Thus, the noise involved in this interlinked loop is described by
| (5) |
| (6) |
where  is the autocorrelation time of the noise and
  is the noise intensity. In other words,
  describes the noise bandwidth and
  represents the spectral height of the colored noise [40].
Signal sensitivity and noise amplification
To study the propagation of an input signal with noise, we define the steady-state sensitivity susceptibility  as a measure of the change in the output signal due to a change in the input signal [41]–[43],
| (7) |
| (8) |
Here,  and
and  represent the relative change in protein and miRNAs in response to changes in the input signal, respectively. The symbol
  means that the parameters are measured at the stable state.
To obtain the noise propagation from the input signal to the output signal, we measure the noise amplification  , which is defined as the ratio between the output noise and the input noise [25],
| (9) |
| (10) |
where  and
and  denote the noise amplification of protein and miRNAs due to fluctuations in the input signal, respectively. The variables
  and
and  represent the standard deviation and the relative standard deviation, respectively. Clearly, for
  (
( ), the noise of
  (
( ) is propagated and amplified, whereas the noise of
  (
( ) is repressed when
  (
( ).
).
The detailed deduction process to calculate the signal sensitivity and noise amplification formulas (Eq. (3–4)) is presented in Text S1.
Interlinked positive and negative feedback loop
As stated above, the system has a transition from monostability to excitability, then switches to bistability before it finally reaches monostability with an increased intensity of negative feedback  . Switching behaviors from the bistability are commonly reported. These behaviors are important in the biological processes, such as circadian clocks [44], [45], the eukaryotic cell cycle [46], [47], the p53-Mdm2 network [48], and so on. Therefore, in this work, we mainly focus on the gene network's bistable behaviors that involve interlinked positive and negative feedback loops. Note that in bistability, the system's stable state is determined by its initial state. As mentioned above, the higher and the lower steady states are normally referred to as the on-state and the off-state, respectively. Thus, in the following section, we study the bistability region in two different cases, one in which the initial steady state is in the on-state and the other when it is in the off-state.
For an initial stable steady state in the on-state, Figure 5A presents a bulk diagram of the noise amplification  as a function of the positive feedback loop
  and the negative feedback loop
  . The diagram can be divided into two parts based on the Hopf bifurcation line, which is marked with a black square in Figure 3. The upper, warmer-colored pattern in Figure 5A corresponds to the monostability and excitability regions, and the lower, cooler-colored pattern corresponds to the on-state in the bistability and monostability regions (also see Figure 3). In the upper region,
  is larger than
  , and it increases as
  increases, but decreases as
  increases.In the lower region,
  is less than
  and it decreases as
  increases, but
  is amplified as
  increases.
Figure 5. The effects of the positive feedback ( ) and miRNA inhibition (
 ) with initial steady on-state.

(A) The noise amplification and (D) the sensitivity of the protein module as a function of  and
and  when the initial stable steady state is on-state in a bistable region.
  and
and  for
for  (B, E) and
  (C, F), respectively. Note that
  and
and  reach their maximum values at
  (B, E) and
  (C, F), respectively. The parameters values are
  ,
,  ,
,  , and
, and  .
.
Figure 5B illustrates the noise amplification  for
for  . Clearly, a maximal
  exists at
  in Figure 5B. This value corresponds to the Hopf bifurcation
  in the steady-state bifurcation diagrams of the protein concentration
  (see Figure 3 and 4A). In the region where
  is less than its value at the maximal point,
  is always less than
  , even though it increases with increasing
  . Note that this parameter region corresponds to the on-state of the systems (the lower area in Figure 5A). Therefore, the noise is buffered in the on-state, but the repression ability is reduced when approaching the Hopf bifurcation value. Similarly, when
  is larger than its value at the maximal point (the upper region of Figure 5A), the system is in the off-state. The noise is amplified when it comes into the excitability region (because
  always is larger
  ), and and this amplifying ability is enhanced as the value approaches the Hopf bifurcation.
Figure 5C plots the  dependence of
  in an example with miRNA inhibition of
  . When the system is initially in the off-state, the noise is clearly amplified (
 ) in the monostability and excitability regions. This amplification ability is improved by increasing
  until it reaches its maximum value at
  . However, after crossing this maximum point (the Hopf bifurcation point
  in Figure 4B), the system transitions into an on-state,
  quickly reduces to less than
  and
and  begins to repress the noise.
Figures 5D–F present the signal sensitivity  in terms of
  and
and  . The dependence properties of
  are compared to those of
  . Similar to Figures 5A, the bulk diagram of
  is also divided into two regions by the Hopf bifurcation points from Figure 3. In the upper region (the off-state),
  increases with increasing
  or decreasing
  , whereas it decreases with decreasing
  or increasing
  , in the lower region (the on-state).
For the case in which the initial stable steady is the off-state, we plot the bulk diagrams of  and
and  as the function with
  and
and  in Figure 6. It is clear that the
  and
and  dependence of
  /
/ is the same as the case described in Figure 5. The only difference between Figures 5 and 6 is that the boundary line in Figures 6A and 6D represent the saddle nodes (marked with red circles in Figure 3) rather than the Hopf bifurcation points in Figures 5A and 5D. The maximal
  and
and  values are located on the lower saddle-node boundary of the bistability region in Figure 3. The upper regions of Figures 6A and 6D correspondto the off-states, including monostability, excitability, and bistability. However lower regions only represent the on-state in monostability.
Figure 6. The effects of the positive feedback ( ) and miRNA inhibition (
 ) with an initial steady off-state.

(A) The noise amplification and (D) the sensitivity of the protein module as a function of  and
and  when the initial steady state is an off-state in the bistable region. The parameter values are
  ,
,  ,
,  ,
,  .
.  and
and  for
for  (B, E) and
  (C, F), respectively. Note that
  and
and  reach their maximum values at
  (B, E) and
  (C, F), respectively.
Clearly, because the deviation between the steady states of the miRNA and protein modules is constant [31], [34], the noise amplification  and the signal sensitivity
  of the miRNA should have the same evolutionary tendencies. In fact, we observe similar
  /
/ -dependent behaviors in
  and
and  , but
, but  is always less than
  based on the dynamic properties of the system (see Figures 1 and 2 in Text S2).
These results indicate that the role of interlinked positive and negative feedback loops is not a simple noise suppressor or a noise amplifier. The effects of positive and negative feedback loops are dependent on the dynamic properties and initial state of the system. In the case of an initial on-state, noise propagation is always suppressed, but the the miRNA's negative feedback loop enhances the signal sensitivity and noise amplification. When there is an initial off-state, the negative feedback loop begins to reduce the noise amplification and signal sensitivity. The positive feedback loop is always contrary to the negative feedback loop in all cases. It is clear that the role of interlinked feedback loops appears to be a noise buffer, based on both of its components. Moreover, the boundary line between the two different roles is determined by the bistability properties of the system (see Figures 5, 6).
Autocorrelation time of the input noise and time scale of the reactions
It is well known from previous experiments that the extrinsic noise is usually colored noise with a long autocorrelation time [38], [49], [50]. When the noise autocorrelation time  is lower than the relaxation time of the system, the noise should not be neglected.
  is also crucial to system behavior. Hornung et al. reported that noise amplification is buffered by decreasing noise autocorrelation times in linear networks [25].
In terms of cellular regulation, gene transcription networks can be considered a slow reaction when the time scale of the network is minutes, and reactions with a sub-second timescale are considered fast reactions [51]. In systems with a single-loop switch, a fast-loop switch can induce rapid responses. miRNA has been found to diversify the response behaviors of a system based on its input stimulus [34], [52]. The research on budding yeast polarization shows that slow positive feedback loop is in favor of the stability of the polarized on-state [53]. In the Ca signaling, the long-term Ca
 signals are robust in response to weak stimuli and noise [54].
As presented above, the properties of noise amplification and signal sensitivity in a system with interlinked feedback are dependent on its dynamic status and its initial state. However, we observed that the autocorrelation time  and the time scale of the protein reaction
  did not have an effect on the signal sensitivity
  (see Figures 1–4 in Text S3).
The noise amplification  is influenced by
  and
and  , especially in the region of lower parameter values. Figures 7A and 7D illustrate
  and
and  as the function of
  and
and  , respectively, in the case of an initial steady on-state in the bistable region (similar behaviors were observed in other cases; see Figures 5–7 in Text S3). Both noise amplifications (
 /
/ ) increase quickly and then tend towards their saturation values with increasing
  . The noise saturation values decrease with increasing
  . However, when
  ,
,  sharply increases at first, then decreases with increasing
  . This behavior indicates that a maximal noise amplification value possibly exists with a smaller
  (faster reaction) and a smaller
  (shorter noise autocorrelation time). In addition, in the same parameter region,
  declines faster than
  with increasing
  .
.
Figure 7. The role of the noise autocorrelation time  and the time scale of the protein reaction
  on noise amplification.

The noise amplification in (A) the protein module and (D) miRNAs as a function of  and
and  . The noise amplification evolutes with
  in input signal for various
  (B, E), and
  for different
  (C, F) for protein and miRNA modules, respectively. The parameter values are
  ,
,  ,
,  ,
,  .
.
For example, in Figure 7B,  first increases to a maximum, then it reduces to a stationary value for smaller
  as
as  increases. When
  is slightly larger,
  increases directly to its saturation value, similar to
  in Figure 7E. In the case of a fixed
  (Figures 7C and 7F), both
  and
and  reduce with increasing
  . The smaller
  , the more
  and
and  quickly decrease. Moreover,
  decreases more slowly than
  because miRNA is more stable than protein.
Therefore, decreasing the autocorrelation time of the noise and increasing the time scales of the reaction can reduce noise amplification without compromising signal sensitivity. Increasing the timescale of the extrinsic fluctuations can enhance a noise effect in the feedforward loops [39]. Slow feedback loops are critical for some cellular processes. For example, in the Xenopus oocyte's maturation period, interkinesis occurred with Cdc2 partially deactivated [55]. The slow positive feedback loop between Cdc2 and the MAPK cascade can maintain an on-state rather than transition to an off-state [52]. If the bistable system stay at off-state, like the transcriptional factor E2F, as the level of E2F is off-state without proper serum [56], however, a rapid feedback loop can induce E2F to remain in the on-state to control the cell cycle [57]. While, overexpression E2F-1 can promote neoplastic transformation [58]. Therefore, complex circuits can be properly constructed in terms of fitness.
Discussion
It has been reported that interlinked positive and negative feedback loops can act as tunable modules for superior adaptability and robustness [32]. In previous studies, it was reported that a single positive feedback loops can buffer the noise [25], while a single negative feedback loop can optimize noise repression levels within a defined range [59]. A role for coupled positive and negative feedback motifs has been reported in cellular signaling pathways, such as the PDGF signaling pathway [60], muscle cell fate specification [61], [62], Ca signaling [63], and so on. In addition, mathematical equations have been created [64], [65] to observe the specific regulatory functions of coupled feedback loops in cellular circuits. Positive feedback loops have been shown to turn on in response to a stimulus and robustly remain in the on-state, whereas negative feedback loops can suppress a sustained response. These observations are in accordance with previous experimental results [60]–[62]. In Ref. [66], it was shown that the higher concentration of the positice feedback can induce the off-cells switch to the on-state in a stochastic way. It was also theoretically investigated that the negative feedback reduces the variance of the noise in the higher protein level [67]. Thus, interlinked positive and negative feedback loops can properly modulate signal responses and effectively handle noise, enabling them to make reliable decisions in signaling pathways.
The response of interlinked positive and negative feedback loops to stochastic fluctuations has not been thoroughly examined in a bistable system with various dynamic properties. Feedback loops play a critical role in noise propagation. The E2F/Myc/miR-17-92 network has various dynamic properties (e.g., monostability, bistability, excitability; see Figure 3) that are fine-tuned by positive and negative feedback loops. Thus, the tunable effect of interlinked feedback loops on signal sensitivity and noise propagation is expected to be much different than that of single positive/negative feedback loops. The present work shows that interlinked positive and negative feedback loops dynamically tune noise propagation signals rather than monotonically suppressing or amplifying these signals, as would be expected in single feedback loops.
In this paper, we used frequency domain analysis [25], [67], [68] to obtain expressions of systemic noise amplification and signal sensitivity and to show that the roles of the positive and negative feedback loops are dependent on dynamic behaviors. This deduced recipe is consistent with the stochastic simulation result from Gillespie algorithm with an acceptable deviation (See Text S4). Noise amplification and signal sensitivity behaviors change in various regions depending on the levels of positive and negative feedback.
The positive/negative feedback in an interlinked feedback loop does not simply suppress or enhance noise. For example, Figures 5 and 6 show that the miRNA negative feedback loop reduces noise buffering to improve the signal sensitivity. This buffering is achieved by slightly compromising on noise robustness when the noise amplification ( ) is less than 1. When
  , the negative feedback loop appears to suppress noise. In addition to these synergetic, tunable behaviors between the positive and negative feedback loops, it is interesting to note that the noise autocorrelation time
  and the response time constant of the protein module
  have no effect on the signal sensitivity (Figures 1–4 in Text S3). Thus, the noise amplification can be tuned to a fixed signal sensitivity based on the effects of
  and
and  on
on  (see Figure 7 and Figures 5–
7 in Text S3).
(see Figure 7 and Figures 5–
7 in Text S3).
In addition, due to the underlying biochemical reactions, gene regulatory networks involve time delays. Thus, the E2F/Myc/miR-17-92 network should also consider the effects of time delays. It is well known that long time delays can generate oscillations in a negative feedback loop, and that the oscillations amplitude can be increased by the addition of positive feedback loop [32], [69], [70]. Therefore, we assume that there will not be any qualitative changes in our results by including time delays in our systemic signal sensitivity and noise amplification.
Materials and Methods
Bifurcation analyses of the ordinary differential equations are performed with OSCILL 8.28 [71]. The integral is calculated in Mathematica 7.01.0 for Linux. The ordinary differential equations were numerically solved using the fourth-order Runge-Kutta scheme [72] in Fortran 95 codes.
Supporting Information
The deduction processes for the signal sensitivity
 and the noise amplification
 .
.
(PDF)
Effects of the positive feedback loop
 and miRNA inhibition
 on noise amplification and the sensitivity of the miRNA module when the initial steady is in the on-state or the off-state in a bistable region.
(PDF)
Effects of the noise autocorrelation time
 and the time scale of the protein reaction
 on signal sensitivity and noise amplification for the system with an initial steady in the on-state or the off-state in a bistable region and an on/off state in a monostable region.
(PDF)
The noise amplification from the stochastic simulation results with Gillespie algorithm and from the deduced results Equation (42) in Text S1.
(PDF)
Funding Statement
This work was supported by the National Natural Science Foundation of China (Grants No. 10975063), the Fundamental Research Funds for the Central Universities (Grant No. lzujbky-2012-17), and the Program for New Century Excellent Talents in University (Grant No. NCET-11-0206). The funders had no role in study design, data collection and analysis, decision to publish, or preparation of the manuscript.
References
- 1. Ozbuda EM, Thattai M, Kurtser I, Grossman AD, van Oudenaarden A (2002) Regulation of noise in the expression of a single gene. Nat Genet 31: 69–73. [DOI] [PubMed] [Google Scholar]
- 2. Elowitz MB, Levine AJ, Siggia ED, Swain PS (2002) Stochastic Gene Expression in a Single Cell. Science 297: 1183–1186. [DOI] [PubMed] [Google Scholar]
- 3. Pedraza JM, Paulsson J (2008) Effects of Molecular Memory and Bursting on Fluctuations in Gene Expression. Science 319: 339–343. [DOI] [PubMed] [Google Scholar]
- 4. Blake WJ, Kaern M, Cantor CR, Collins JJ (2003) Noise in eukaryotic gene expression. Nature 422: 633–637. [DOI] [PubMed] [Google Scholar]
- 5. Raser JM, O'Shea EK (2004) Control of Stochasticity in Eukaryotic Gene Expression. Science 304: 1811–1814. [DOI] [PMC free article] [PubMed] [Google Scholar]
- 6. McAdams HH, Arkin A (1997) Stochastic mechanisms in gene expression. Proc Natl Acad Sci U S A 94: 814–819. [DOI] [PMC free article] [PubMed] [Google Scholar]
- 7. Heitzlerb P, Simpsonb P (1991) The choice of cell fate in the epidermis of Drosophila. Cell 64: 1083–1092. [DOI] [PubMed] [Google Scholar]
- 8. Süel GM, Kulkarni RP, Dworkin J, Garcia-Ojalvo J, Elowitz MB (2007) Tunability and Noise Dependence in Differentiation Dynamics. Science 315: 1716–1719. [DOI] [PubMed] [Google Scholar]
- 9. Pedraza JM, van Oudenaarden A (2005) Noise Propagation in Gene Networks. Science 307: 1965–1969. [DOI] [PubMed] [Google Scholar]
- 10. Sako Y, Minoguchi S, Yanagida T (2000) Single-molecule imaging of EGFR signalling on the surface of living cells. Nat Cell Biol 2: 168–172. [DOI] [PubMed] [Google Scholar]
- 11. Ueda M, Sako Y, Tanaka T, Devreotes P, Yanagida T (2001) Single-molecule analysis of chemotactic signaling in Dictyostelium cells. Science 294: 864–867. [DOI] [PubMed] [Google Scholar]
- 12. Korobkova E, Emonet T, Vilar JM, Shimizu TS, Cluzel P (2004) From molecular noise to behavioural variability in a single bacterium. Nature 428: 574–578. [DOI] [PubMed] [Google Scholar]
- 13. McAdams HH, Shapiro L (1995) Circuit simulation of genetic networks. Science 269: 650–656. [DOI] [PubMed] [Google Scholar]
- 14. Kholodenko BN (2006) Cell-signalling dynamics in time and space. Nat Rev Mol Cell Biol 7: 165–176. [DOI] [PMC free article] [PubMed] [Google Scholar]
- 15. Freeman M (2000) Feedback control of intercellular signalling in development. Nature 408: 313–319. [DOI] [PubMed] [Google Scholar]
- 16. Mitrophanov AY, Groisman EA (2008) Positive feedback in cellular control systems. BioEssays 30: 542–555. [DOI] [PMC free article] [PubMed] [Google Scholar]
- 17. Hooshangi S, Weiss R (2006) The effect of negative feedback on noise propagation in transcriptional gene networks. Chaos 16: 026108. [DOI] [PubMed] [Google Scholar]
- 18. Passos JF, Nelson G, Wang C, Richter T, Simillion C, et al. (2010) Feedback between p21 and reactive oxygen production is necessary for cell senescence. Mol Syst Biol 6: 347. [DOI] [PMC free article] [PubMed] [Google Scholar]
- 19. Becskei A, Serrano L (2000) Engineering stability in gene networks by autoregulation. Nature 405: 590–593. [DOI] [PubMed] [Google Scholar]
- 20. Wolf DM, Arkin AP (2003) Motifs, modules and games in bacteria. Curr Opin Microbiol 6: 125–134. [DOI] [PubMed] [Google Scholar]
- 21. Nevozhay D, Adamsa RM, Murphy KF, Josić K, Balázsi G (2009) Negative autoregulation linearizes the dose-response and suppresses the heterogeneity of gene expression. Proc Natl Acad Sci U S A 106: 5123–5128. [DOI] [PMC free article] [PubMed] [Google Scholar]
- 22. Xiong W, Ferrell JE Jr (2003) A positive-feedback-based bistable ‘memory module’ that governs a cell fate decision. Nature 426: 460–465. [DOI] [PubMed] [Google Scholar]
- 23. Ferrell JE Jr, Machleder EM (1998) The biochemical basis of an all-or-none cell fate switch in Xenopus oocytes. Science 280: 895–898. [DOI] [PubMed] [Google Scholar]
- 24. Cheng Z, Liu F, Zhang XP, Wang W (2008) Robustness analysis of cellular memory in an autoactivating positive feedback system. FEBS Lett 582: 3776–3782. [DOI] [PubMed] [Google Scholar]
- 25. Hornung G, Barkai N (2008) Noise Propagation and Signaling Sensitivity in Biological Networks: A Role for Positive Feedback. PLoS Comput Biol 4: e8. [DOI] [PMC free article] [PubMed] [Google Scholar]
- 26. Hornstein E, Shomron N (2006) Canalization of development by microRNAs. Nat Genet 38: S20–S24. [DOI] [PubMed] [Google Scholar]
- 27. Inui M, Martello G, Piccolo S (2010) MicroRNA contorl of signal transduction. Nat Rev Mol Cell Biol 11: 252–263. [DOI] [PubMed] [Google Scholar]
- 28. Zhao HW, Kalota A, Jin SH, Gewirtz AM (2009) The c-myb proto-oncogene and microRNA-15a comprise an active autoregulatory feedback loop in human hematopoietic cells. Blood 113: 505–516. [DOI] [PMC free article] [PubMed] [Google Scholar]
- 29. Pulikkan JA, Dengler V (2010) Cell-cycle regulator E2F1 and microRNA-223 comprise an autoregulatory negative feedback loop in acute myeloid leukemia. Blood 115: 1768–1778. [DOI] [PMC free article] [PubMed] [Google Scholar]
- 30. Papagiannakopoulos T, Shapiro A, Kosik KS (2008) MicroRNA-21 targets a network of key tumorsuppressive pathways in glioblastoma cells. Cancer Res 68: 8164–8172. [DOI] [PubMed] [Google Scholar]
- 31. Aguda BD, Kim Y (2008) MicroRNA regulation of a cancer network: Consequences of the feedback loops involving miR-17-92, E2F, and Myc. Proc Natl Acad Sci U S A 105: 19678–19683. [DOI] [PMC free article] [PubMed] [Google Scholar]
- 32. Tian XJ, Zhang XP, Liu F, Wang W (2009) Interlinking positive and negative feedback loops. Phys Rew E 80: 011926. [DOI] [PubMed] [Google Scholar]
- 33. Pfuety B, Kaneko K (2009) The combination of positive and negative feedback loops confers exquisite exibility to biochemical switches,. Physical Biology 6: 046013. [DOI] [PubMed] [Google Scholar]
- 34. Li Y, Li Y, Zhang H, Chen Y (2011) MicroRNA-mediated Positive Feedback Loop and Optimized Bistable Switch in a Cancer Network Involving miR-17-92. PLoS ONE 6: e26302. [DOI] [PMC free article] [PubMed] [Google Scholar]
- 35.Bistability website. Available: http://en.wikipedia.org/wiki/Bistability. Accessed 2012 Nov 14.
- 36. Lindner B, Garcia-Ojalvo J, Neiman A, Schimansky-Geier L (2004) Effects of noise in excitable systems. Phys Report 392: 321–424. [Google Scholar]
- 37. Ma J, Xiao T, Hou Z, Xin H (2008) Coherence resonance induced by colored noise near Hopf bifurcation. Chaos 18: 043116. [DOI] [PubMed] [Google Scholar]
- 38. Rosenfeld N, Young JW, Alon U, Swain PS, Elowitz MB (2005) Gene Regulation at the Single-Cell Level. Science 307: 1962–1965. [DOI] [PubMed] [Google Scholar]
- 39. Shahrezaei V, Ollivier JF, Swain PS (2008) Colored extrinsic uctuations and stochastic gene expression. Mol Syst Biol 4: 196. [DOI] [PMC free article] [PubMed] [Google Scholar]
- 40. Klosek-Dygas MM, Matkowsky BJ, Schuss Z (1988) Colored noise in dynamical systems. SIAM J Appl Math 48: 425–441. [DOI] [PubMed] [Google Scholar]
- 41. Paulsson J (2004) Summing up the noise in gene networks. Nature 427: 415–418. [DOI] [PubMed] [Google Scholar]
- 42. Paulsson J (2005) Models of stochastic gene expression. Phys Life Rev 2: 157–175. [Google Scholar]
- 43. Swain PS, Elowitz MB, Siggia ED (2002) Intrinsic and extrinsic contributions to stochasticity in gene expression. Proc Natl Acad Sci U S A 99: 12795–12800. [DOI] [PMC free article] [PubMed] [Google Scholar]
- 44. Lee K, Loros JJ, Dunlap JC (2000) Interconnected feedback loops in the neurospora circadian system. Science 289: 107–110. [DOI] [PubMed] [Google Scholar]
- 45. Shearman LP, Sriram S, Weaver DR, Maywood ES, Chaves I, et al. (2000) Interacting molecular loops in the mammalian circadian clock. Science 288: 1013–1019. [DOI] [PubMed] [Google Scholar]
- 46. Pomerening JR, Sontag ED, Ferrell JE Jr (2003) Building a cell cycle oscillator: Hysteresis and bistability in the activation of Cdc2. Nat Cell Biol 5: 346–351. [DOI] [PubMed] [Google Scholar]
- 47. Pomerening JR, Kim SY, Ferrell JE Jr (2005) Systems-level dissection of the cell-cycle oscillator: Bypassing positive feedback produces damped oscillations. Cell 122: 565–578. [DOI] [PubMed] [Google Scholar]
- 48. Wee KB, Surana U, Aguda BD (2009) Oscillations of the p53-Akt Network: Implications on Cell Survival and Death. PLoS ONE 4: e4407. [DOI] [PMC free article] [PubMed] [Google Scholar]
- 49. Kaufmann BB, Yang Q, Mettetal JT, van Oudenaarden A (2007) Heritable Stochastic Switching Revealed by Single-Cell Genealogy. PLoS Biol 5: e239. [DOI] [PMC free article] [PubMed] [Google Scholar]
- 50. Sigal A, Milo R, Cohen A, Geva-Zatorsky N, Klein Y, et al. (2006) Variability and memory of protein levels in human cells. Nature 444: 643–646. [DOI] [PubMed] [Google Scholar]
- 51. Shen-Orr SS, Milo R, Mangan S, Alon U (2002) Network motifs in the transcriptional regulation network of Escherichia coli . Nat Genet 31: 64–68. [DOI] [PubMed] [Google Scholar]
- 52. Brandman O, Ferrell JE Jr, Li R, Meyer T (2005) Interlinked fast and slow positive feedback loops drive reliable cell decisions. Science 310: 496–498. [DOI] [PMC free article] [PubMed] [Google Scholar]
- 53. Wedlich-Soldner R, Wai SC, Schmidt T, Li R (2004) Robust cell polarity is a dynamic state established by coupling transport and GTPase signaling. J Cell Biol 166: 889–900. [DOI] [PMC free article] [PubMed] [Google Scholar]
- 54. Berridge MJ (2001) The versatility and complexity of calcium signalling. Complexity in biological information processing 239: 52–67. [PubMed] [Google Scholar]
- 55. Abrieu A, Doree M, Fisher D (2001) The interplay between cyclin-B-Cdc2 kinase (MPF) and MAP kinase during maturation of oocytes. J Cell Sci 114: 257–267. [DOI] [PubMed] [Google Scholar]
- 56. Yao G, Lee TJ, Mori S, Nevins JR, You L (2008) A bistable Rb-E2F switch underlies the restriction point. Nat Cell Biol 10: 476–482. [DOI] [PubMed] [Google Scholar]
- 57. Ren B, Cam H, Takahashi Y, Volkert T, Terragni J, et al. (2002) E2F integrates cell cycle progression with DNA repair, replication, and G(2)/M checkpoints. Genes Dev 16: 245–256. [DOI] [PMC free article] [PubMed] [Google Scholar]
- 58. Singh P, Wong SH, Hong W (1994) Overexpression of E2F-1 in rat embryo fibroblasts leads to neoplastic transformation. Embo J 13: 3329–3338. [DOI] [PMC free article] [PubMed] [Google Scholar]
- 59. Dublanche Y, Michalodimitrakis K, Kümmerer N, Foglierini M, Serrano L (2006) Noise in transcription negative feedback loops: simulation and experimental analysis. Mol Syst Biol 2: 41. [DOI] [PMC free article] [PubMed] [Google Scholar]
- 60. Bhalla US, Ram PT, Iyengar R (2002) MAP kinase phosphatase as a locus of exibility in a mitogen-activated protein kinase signaling network. Science 297: 1018–1023. [DOI] [PubMed] [Google Scholar]
- 61. Cole F, Zhang W, Geyra A, Kang JS, Krauss RS (2004) Positive regulation of myogenic bHLH factors and skeletal muscle development by the cell surface receptor CDO. Dev Cell 7: 843–854. [DOI] [PubMed] [Google Scholar]
- 62. Lee S-J (2004) Regulation of muscle mass by myostatin. Annu Rev Cell Dev Biol 20: 61–86. [DOI] [PubMed] [Google Scholar]
- 63. Keizer J, Li Y, Stojilkovic S, Rinzel J (1995) InsP3-induced Ca 2+ Excitability of the Endoplasmic Reticulum. Mol Biol Cell 6: 945–951. [DOI] [PMC free article] [PubMed] [Google Scholar]
- 64. Kim D, Kwon YK, Cho KH (2007) Coupled positive and negative feedback circuits form an essential building block of cellular signaling pathways. Bioessays 29: 8590. [DOI] [PubMed] [Google Scholar]
- 65. Kim JR, Yoon Y, Cho KH (2008) Coupled feedback loops form dynamic motifs of cellular networks. Biophys J 94: 35965. [DOI] [PMC free article] [PubMed] [Google Scholar]
- 66. Becskei A, Seraphin B, Serrano L (2001) Positive feedback in eukaryotic gene networks: cell differentiation by graded to binary response conversion. EMBO J 20: 2528–2535. [DOI] [PMC free article] [PubMed] [Google Scholar]
- 67. Simpson ML, Cox CD, Sayler GS (2003) Frequency domain analysis of noise in autoregulated gene circuits. Proc Natl Acad Sci U S A 100: 4551–4556. [DOI] [PMC free article] [PubMed] [Google Scholar]
- 68.Papoulis A (1991) Probability, Random Variables and Stochastic Process. New York: McGraw-Hill.
- 69. Bratsun D, Volfson D, Tsimring LS, Hasty J (2005) Delay-induced stochastic oscillations in gene regulation. Proc Natl Acad Sci U S A 102: 14593–14598. [DOI] [PMC free article] [PubMed] [Google Scholar]
- 70. Tsai TY, Choi YS, Ma W, Pomerening JR, Tang C, et al. (2008) Robust, tunable biological oscillations from interlinked positive and negative feedback loops. Science 321: 126–129. [DOI] [PMC free article] [PubMed] [Google Scholar]
- 71.Oscill8 website. Available: http://oscill8.sourceforge.net/. Accessed 2012 Nov 14.
- 72. Kasdin J (1995) Runge-Kutta algorithm for the numerical integration of stochastic differential equations. J Guid Control Dynam 18: 114–120. [Google Scholar]
Associated Data
This section collects any data citations, data availability statements, or supplementary materials included in this article.
Supplementary Materials
The deduction processes for the signal sensitivity
and the noise amplification
.
(PDF)
Effects of the positive feedback loop
and miRNA inhibition
on noise amplification and the sensitivity of the miRNA module when the initial steady is in the on-state or the off-state in a bistable region.
(PDF)
Effects of the noise autocorrelation time
and the time scale of the protein reaction
on signal sensitivity and noise amplification for the system with an initial steady in the on-state or the off-state in a bistable region and an on/off state in a monostable region.
(PDF)
The noise amplification from the stochastic simulation results with Gillespie algorithm and from the deduced results Equation (42) in Text S1.
(PDF)