Abstract
The intensity of light scattered from a porous Si photonic crystal is used to monitor physiological changes in primary rat hepatocytes. The cells are seeded on the surface of a porous Si photonic crystal that has been filled with polystyrene and treated with an O2 plasma. Light resonant with the photonic crystal is scattered by the cell layer and detected as an optical peak with a charge-coupled-device (CCD) spectrometer. It is demonstrated that exposure of hepatocytes to the toxins cadmium chloride or acetaminophen leads to morphology changes that cause a measurable increase in scattered intensity. The increase in signal occurs before traditional assays are able to detect a decrease in viability, demonstrating the potential of the technique as a complementary tool for cell viability studies. The scattering method presented here is non-invasive and can be performed in real-time, representing a significant advantage compared to other techniques for in vitro monitoring of cell morphology.
Keywords: Cell-based biosensor, porous Si, photonic crystal, cell assay, high-throughput screening
Introduction
Cell and tissue-based biosensors are useful for many medical, pharmaceutical, and environmental applications. One significant advantage of using living elements in sensors is that, in principle, complex biological interactions can be identified due to changes in cellular physiology. However, many biological events that signal changes in cellular physiology cannot readily be converted into an electronic signal in real-time. Transduction schemes that have been proposed for cell-based biosensors involve measurement of local pH,1 fluorescence (from genetically engineered cells),2 intra- or extra-cellular potential,3,4 electrical impedance, capacitance, resonant acoustic frequency, or refractive index.5 Porous Si is an attractive substrate for cell-based biosensing since label-free detection6–9 and cell compatibility10–12 have been demonstrated with this material. Additionally, photonic structures with narrow-band reflectivity spectra can be generated that can be used to encode small beads or specific regions of a chip for small-sample, highly parallel assays.13,14
In this work, it is shown that the spectrum of light scattered from an assembly of cells resident on a porous Si photonic crystal provides a unique optical signature that is especially sensitive to changes in cell morphology. The scattering technique presented here provides many advantages over current methods of signal transduction since measurements can be performed continuously on incubated cells without the use of on-chip sensors, modified or specialized cell-types,15 or fluorescent markers. This technique complements existing methods for studying cell morphology and viability and can be adapted to high-throughput screening schemes.13,14 Primary rat hepatocytes were chosen as a model cell type due to the importance of hepatocytes in studies of drug metabolism.16 In particular, we chose to monitor changes in morphology induced by exposure to toxic substances to demonstrate the potential of the method as a screening tool for cell viability studies.
Experimental
Preparation of porous Si photonic crystals
Samples of one-dimensional photonic crystals of porous Si displaying a single spectral peak were prepared and the pores were filled with polystyrene by solution-casting to provide a surface coating similar to the surfaces of conventional Petri dishes and multi-well plates. Porous Si samples were prepared from single-crystal, highly doped p-type Si (boron doped, 0.0005–0.0015 Ω-cm resistivity, polished on the (100) face) by electrochemical etch in a 3:1 solution of 49% aqueous hydrofluoric acid:ethanol (hydrofluoric acid from Fisher, inc. CAUTION: hydrofluoric acid is highly toxic and contact with skin should be immediately treated). Samples were etched using a computer-generated sinusoidal waveform with current density ranging from 13–66 mA/cm2 and a period of 4–7 s (depending on the exact resistivity of the wafer and the color desired) for 75 cycles, producing a porous film of ~30 µm in thickness on the Si substrate.
The samples were then placed in neat undecylenic acid (98%, Aldrich) and heated to 140 °C for 2 hours, resulting in a covalently bound hydrocarbon layer terminated with a carboxylic acid group. To coat the porous film with a uniform polymer layer, a solution of 30% (by wt.) polystyrene (45,000 average M.W., Aldrich) in toluene was spin-coated on the undecylenic acid-terminated surface, and heated to 180 °C in an oven for 30 minutes. The polystyrene-coated surface was activated by exposure to a 200 W O2 plasma (Technics PEIIB Plasma Etcher) for 1 min. to provide a hydrophilic substrate that promoted cell adhesion. Hepatocytes were then seeded on the activated polystyrene-coated chip.
Cell seeding
Porous Si photonic crystal samples were sterilized in a 35 mm dish with 2 mL of 100% ethanol for 1 hour. Ethanol was removed and the samples were allowed to dry in a sterile laminar-flow hood. The samples and dish were washed twice with sterile water. To improve adhesion, 2 mL of a 0.1 mg/mL solution of rat-tail collagen (collagen I) was added to the dish, and the samples were incubated at 37 °C for 1 h. The collagen-coated samples were then washed once with sterile water and once with growth media. Media for all experiments was DMEM with high glucose (Invitrogen), 10% fetal bovine serum, supplemented with 0.5 U/mL insulin, 7 ng/mL glucagon, 7.5 mg/mL hydrocortisone, 10 U/mL penicillin, and 10 mg/mL streptomycin. Hepatocytes were isolated from 2–3 month old adult female Lewis rats (Charles River Laboratories) by collagenase perfusion as previously described.17 Less than one hour after isolation, 1.25×10⁶ cells per dish were seeded in 2 mL of media for scattering experiments and 6×10⁵ cells per dish for microscope experiments. As the porous Si samples were smaller than the dish, some cells settled and attached to the polystyrene surface. Unattached cells were removed after one hour and dishes were incubated at 37 °C in 5% CO2 for 24 hours to allow spreading before the start of observation.
Chemical preparation
Cadmium chloride (Cd2+) and N-acetyl-p-aminophenol (abbreviated APAP, commonly referred to as acetaminophen) stock solutions were prepared by dissolving the solids in fresh media and heating to 37 °C in an incubator. To adjust cell media solutions to the correct concentration of toxin, an aliquot of media was removed and replaced with an equal aliquot of concentrated toxin solution.
Cell viability assays
Cell viability assays were performed in 6 well plates (BD/Falcon). The procedure for seeding cells was the same as for porous Si samples except for the seeding concentration, which was 5×10⁵ cells per well. For live/dead staining, samples were incubated with ethidium homodimer (Molecular Probes) and Hoechst 33258 (Molecular Probes) for 30 minutes and examined by fluorescence microscopy. Cultures of hepatocytes assayed for cell viability with MTT (Methylthiazolyldiphenyl-tetrazolium bromide or Thiazolyl Blue Tetrazolium Bromide, Sigma) were washed with sterile PBS (phosphate buffered saline solution) and a solution of 0.5 mg/mL MTT in DMEM without phenol red was added. After one hour at 37 °C, the media was removed and the purple precipitate was dissolved in 50% DMSO/isopropanol. The intensity of the purple color was measured as the absorbance at 570 nm minus background at 660 nm (Molecular Devices Spectramax Plus). Viability was determined by comparison to control cultures with no exposure to toxin.
Optical measurements
Images for cells seeded on porous Si photonic crystals were collected using a reflectance microscope (Meiji MA655/05) and a 10× LWD objective (Optical Product Development) with onnormal and off-normal illumination using a white light source. Phase contrast images for cells seeded on tissue culture polystyrene multi-well plates were obtained on a Nikon TE200 microscope with a 10× objective and captured with a CoolSnap HQ camera (Roper Scientific). Images were processed on Metamorph (Universal Imaging) and ImageJ. To obtain optical microscope images on porous Si photonic crystal chips, cells were seeded on the chips at less than 100% coverage so that the porous Si background could provide contrast. In order to follow the same subset of cells throughout the course of morphology changes for the Cd2+ toxicity studies, the cells were not incubated while monitoring with the microscope. Rather, cells were placed on a chip and Cd2+ concentration was adjusted to a final concentration of 200 µM. Images were obtained at time 0 and 85 minutes.
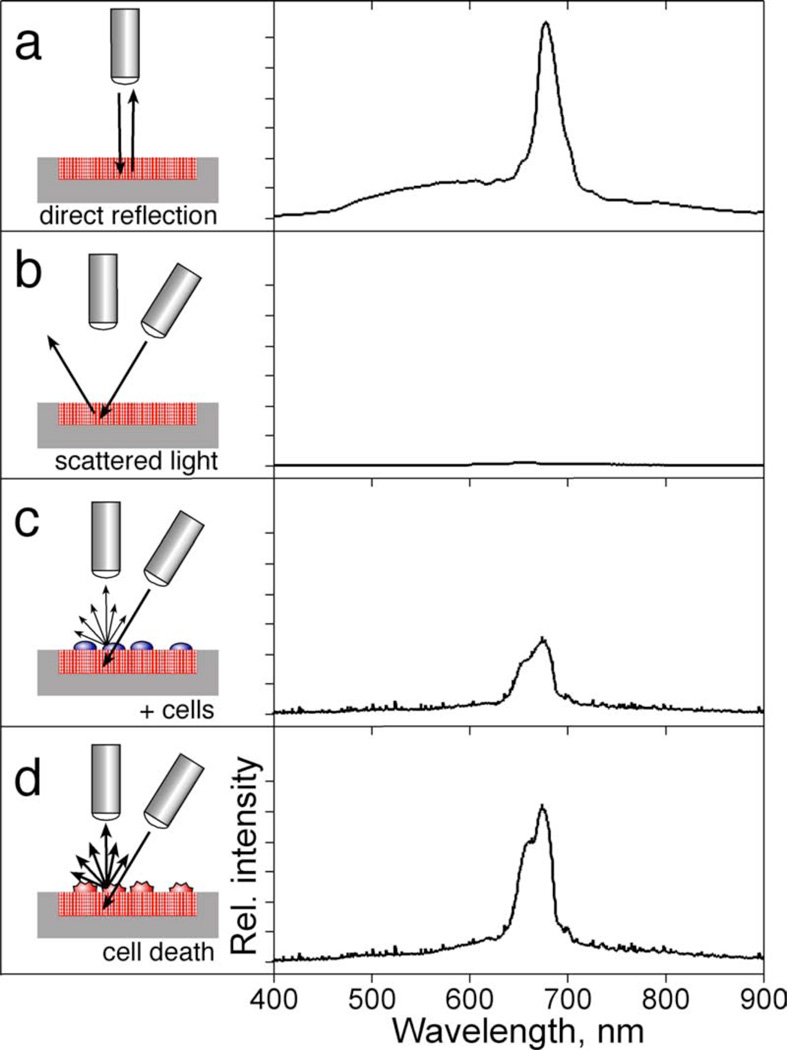
Reflectance and scattered light spectra were collected using an Ocean Optics S-2000 CCD spectrometer fitted with a microscope objective lens coupled to either a bifurcated fiber optic cable (for specular measurements) or a single fiber optic cable (for scattering measurements). Fiber optic cables were purchased from Ocean Optics, and had a numerical aperture of 0.22. An unpolarized tungsten light source was focused onto the center of the porous Si photonic crystal surface with a spot size of approximately 1 mm2, either through the same optics used by the spectrometer (normal reflection mode configuration, Figure 1a) or via separate optics (scattering mode configuration, Figure 1b). The angle between the lenses for scattering mode was ~50 degrees. The solid angle for light collection was ~0.035 steradians (the distance from the sample to the collection lens was ~80 mm, the spot size was ~1 mm, and the lens was ~18 mm in diameter). It should be noted that the scale for normal compared to off-normal reflectance (as shown in Figure 1) is not the same. Typically, the intensity of the initial scattering peak (Figure 1c) was < 1% of the intensity measured at normal reflection (Figure 1a). Reflectivity data were recorded in the wavelength range 400–1000 nm, with a spectral acquisition time of 22–2000 ms (depending on whether data was collected in normal reflection or off-normal reflection mode, and also depending on the quality of the photonic structure generated). Typically 20–100 spectral scans (up to 50 s total acquisition time) were averaged per time point. Data points were collected every 300 s.
Figure 1.
Optical design used to monitor biological events on a polystyrene-filled porous Si photonic crystal, with representative spectra. (a) In order to measure the specular reflection from the photonic crystal, illumination and observation share the same optical path, along the axis normal to the chip surface, leading to a sharp reflectivity peak as shown on the right of the diagram. (b) In order to measure scattered (diffuse) reflectivity from the photonic crystal, the light source is incident from an off-normal position. The specular reflection from the photonic crystal is no longer observed. (c) Placing cells on the surface of the chip introduces scattering centers that direct some of the light into the detection optics. (d) Changes in cell morphology alter scattering efficiency, which are detected as changes in intensity of the spectral peak. The y-axes for the spectra c–d are expanded by 100× relative to spectrum (a).
Data analysis
The wavelength axis of the spectrum from the Ocean Optics spectrometer was calibrated using a least-squares fit of five spectral lines observed from a neon lamp, at 585.3, 614.3, 640.2, 703.2, and 811.5 nm. The data spacing was approximately 0.4 nm. The intensity of the spectral peak was quantified as the total integrated area of the peak by trapezoidal integration. For the data presented in Figure 4, the scattering peak was integrated between 615 and 680 nm. The relative scattered peak intensity (I/Io) is defined as the ratio of the integrated peak intensity at a given time to the integrated peak intensity at time t = 0, with t = 0 being defined as the time immediately before addition of toxin (or media blanks in the case of the controls).
Figure 4.
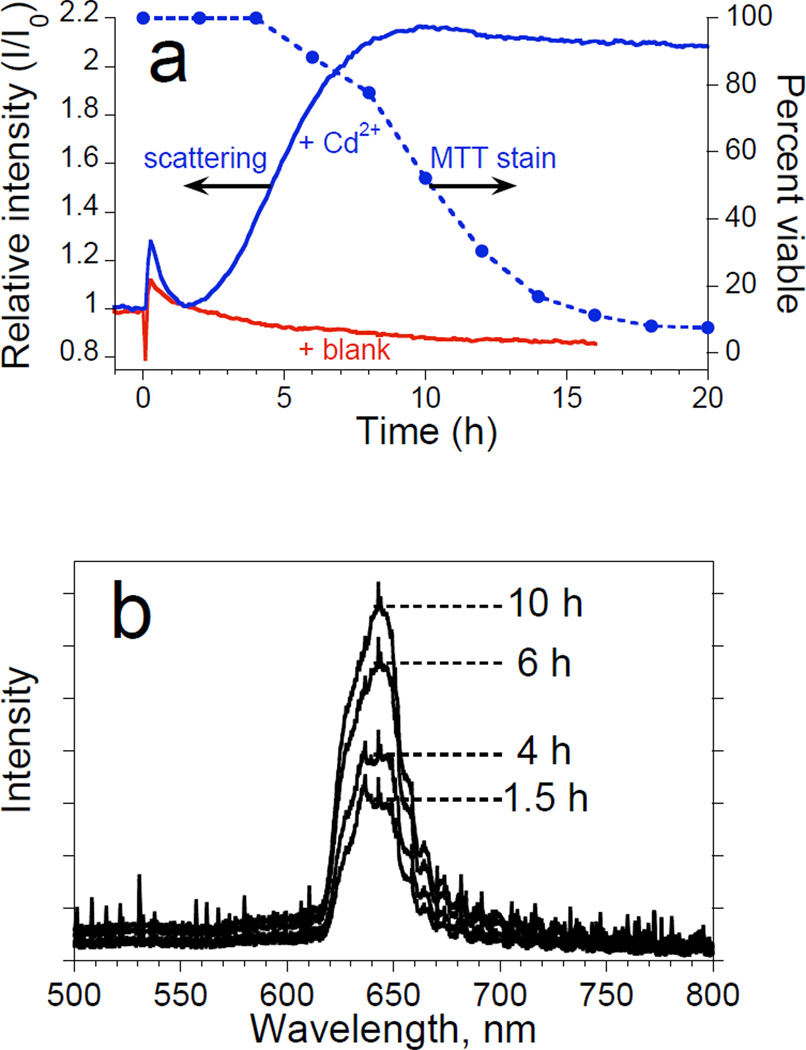
Observation of morphology changes of a monolayer of primary rat hepatocyte cells by monitoring the intensity of light scattered from a porous Si photonic crystal substrate. Cells are monitored after exposure to a toxic dose of Cd2+ and are obtained using the optical setup shown in Figures 1c and 1d. Experiments are performed on cells maintained in an incubator. (a) Plots of intensity of scattered light (left axis) from a porous Si photonic crystal and percent viability from MTT stain (right axis) as a function of time after introduction of 50 µM Cd2+ to primary rat hepatocytes. The quantity I/I0 is defined as the ratio of the value of the integrated intensity of the scattered spectral peak to its value at t = 0 (time point immediately before injection of the toxin or blank). Solid trace marked “+Cd2+” represents the change in relative scattering intensity after the solution is adjusted to 50 µM Cd2+ at t = 0. Solid trace marked “blank” represents a control experiment in which relative scattering intensity is monitored after an equivalent volume of culture media is added to the cells instead of Cd2+. Solid circles (dashed line) represent the results of the corresponding viability assay (MTT stain) for hepatocytes exposed to 50 µM Cd2+ on tissue culture polystyrene. (b) Representative spectra used to obtain the “scattering” trace in (a). The peak maximum occurs at ~650 nm.
Results and Discussion
Figure 1 shows a schematic illustration of the optical design and representative spectra for the work reported here. The photonic crystal used in these studies consists of a modified porous Si film filled with polystyrene. The sample is prepared by hydrosilylation of the freshly-etched porous Si film with undecylenic acid, resulting in a covalently bound hydrocarbon layer terminated with a carboxylic acid group. The undeceylenic acid layer was found to improve adhesion of the polystyrene coating and also to increase stability of the chip towards corrosion in cell media. The porous film is then filled with a uniform polystyrene layer by spin-coating. Activation of the polystyrene-coated film with an O2 plasma provides a hydrophilic substrate, similar to standard Petri dishes and multi-well plates, that promotes cell adhesion. The photonic crystal displays a reflectivity spectrum containing a sharp peak (at a wavelength of ~650 nm in this work) when both the light source and the detector optics are positioned along the surface normal (optics perpendicular to the surface, as illustrated in Figure 1a). If the incident light source is positioned off the surface normal, reflected light does not enter the acceptance cone of the detection optics (positioned normal to the surface, Figure 1b) and the reflectivity peak is not detected by the spectrometer. The introduction of cells to the surface of the photonic crystal generates diffuse scattering, and some of the light incident on the wafer from the off-normal source is diverted into the detector (Figure 1c). Changes in morphology of the scattering center affect the scattering efficiency and lead to changes in intensity of the observed peak (Figure 1d).
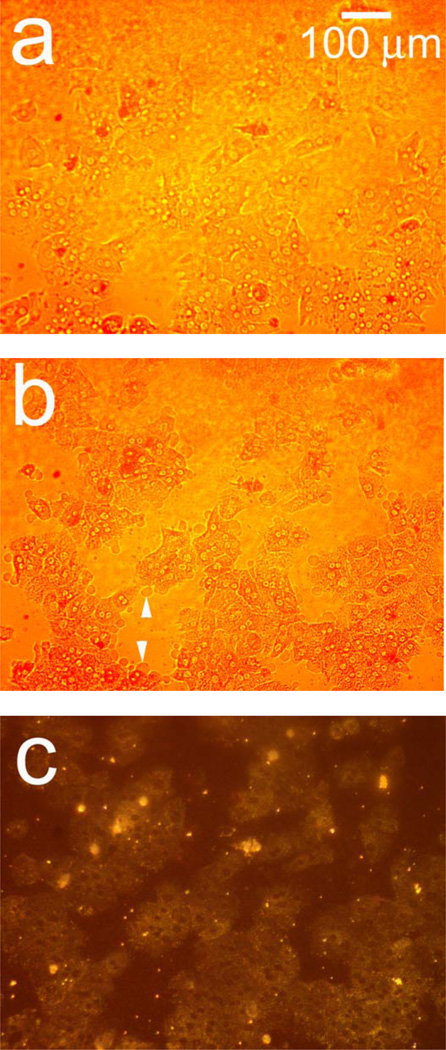
Figure 2 shows hepatocyte cells on a porous Si photonic crystal, and illustrates the sensitivity of the scattered light signal to changes in cellular morphology. In order to observe toxin-induced changes on the same group of cells in a reasonable amount of time, a large dose of Cd2+ (200 µM) was used. Before exposure to Cd2+, conventional reflectance light microscopy using the optical setup defined in Figure 1a (but with the spectrometer lens assembly replaced with a microscope) reveals individual cells that are somewhat difficult to resolve on the photonic crystal substrate (Figure 2a). Upon exposure to Cd2+, characteristic changes in morphology that accompany loss of viability, such as blebbing (indicated by arrows, Figure 2b) and increased granularity, are observed.
Figure 2.
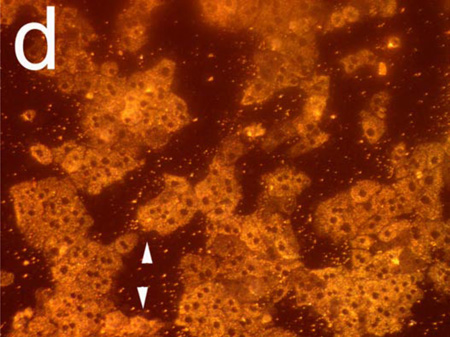
Observation of morphology changes in a monolayer of primary rat hepatocytes resident on a polystyrene-filled porous Si photonic crystal using optical microscopy. Cells are monitored before and after exposure to a toxic dose of aqueous cadmium chloride (Cd2+). Hepatocytes (a) before and (b) after exposure to 200 µM aqueous Cd2+, obtained with the illumination source and observation axis coincident with the surface normal to the chip, as illustrated in Figure 1a. The same set of hepatocytes (c) before and (d) 85 min. after exposure to 200 µM aqueous Cd2+, but obtained in the scattering configuration indicated in Figures 1c and 1d, in which light is incident from an off-normal white light source. The arrows in (b) indicate blebbing, a common feature found for unhealthy mammalian cells. Blebbing does not appear to contribute to the scattering signal, as is evident by the fact that the feature cannot be distinguished in the scattering configuration (d).
The optical setup defined in Figures 1c and 1d produces more dramatic images upon exposure to a toxic dose of Cd2+, as shown in Figures 2c and 2d. In this arrangement, cells appear with a color characteristic of the underlying photonic crystal, while the regions that are not covered with cells appear darker (Figure 2c). Eighty-five min. after introduction of 200 µM Cd2+, the cells in the image appear significantly brighter due to changes induced by the toxin, with increased contrast in the nuclear and cell boundaries (Figure 2d). The arrows in Figures 2b and 2d indicate regions of cell blebbing; membrane blebbing does not appear to contribute to an increase in light scattering. The images demonstrate that changes in cellular morphology lead to a significant increase in the amount of light scattered to the detector (in this case, to the microscope camera).
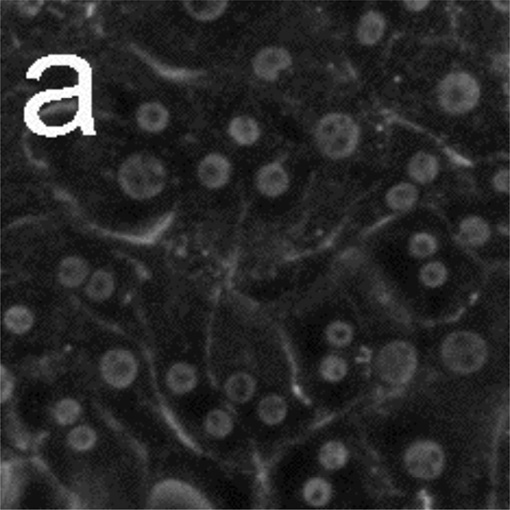
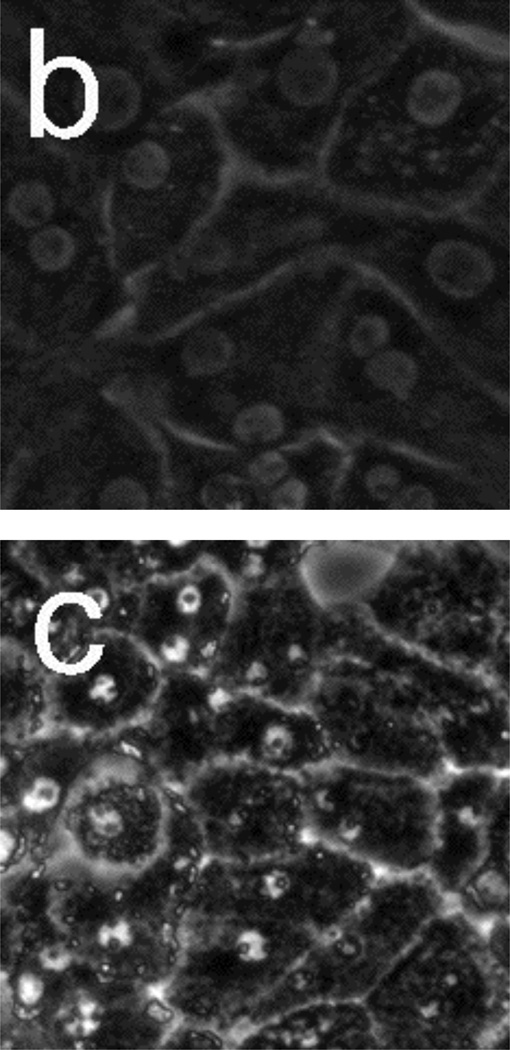
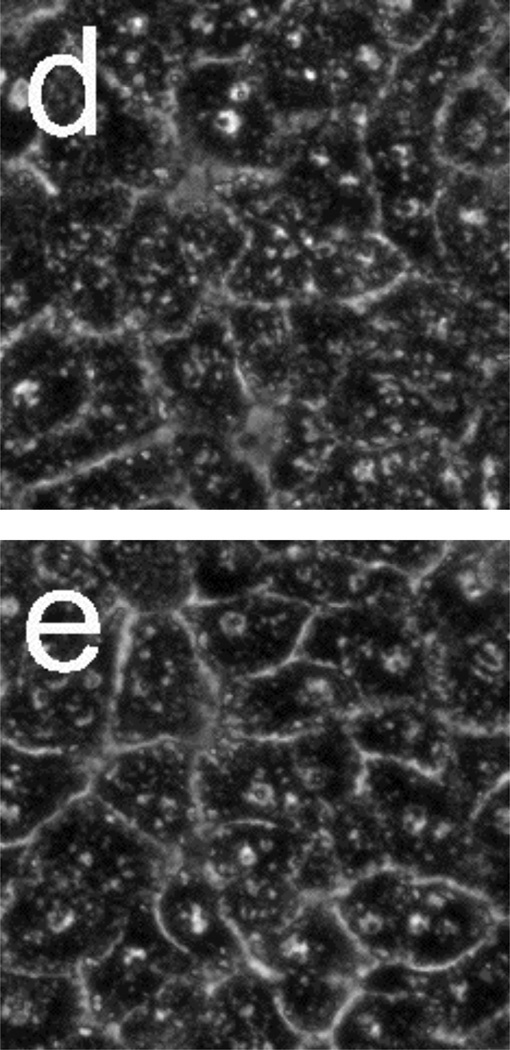
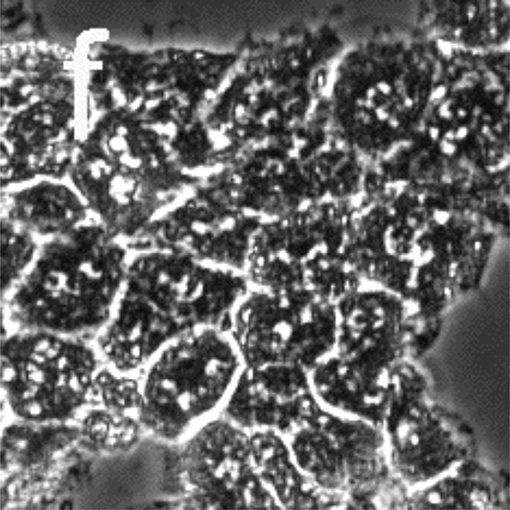
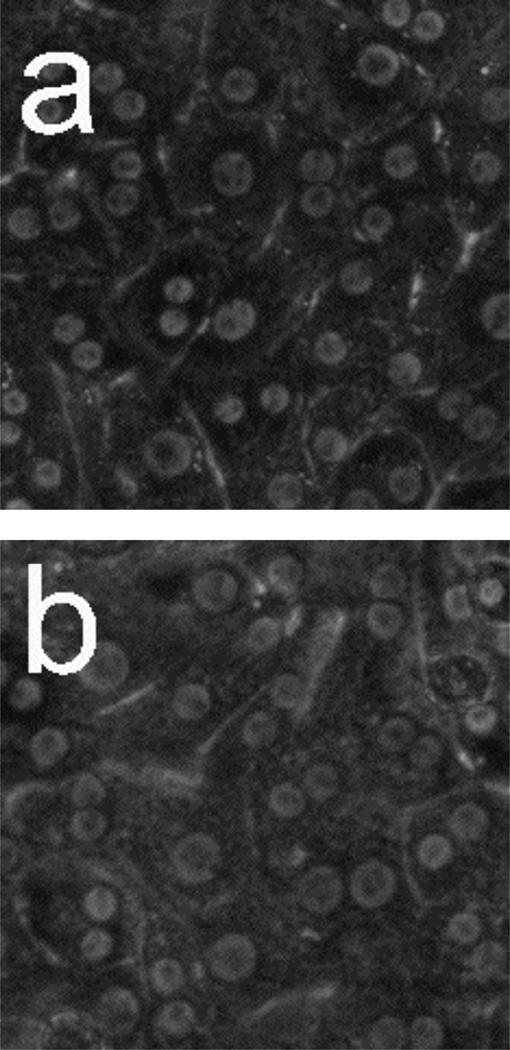
In order to verify that the observed morphology changes are not affected by the presence of the porous Si photonic crystal substrate, control experiments were performed in conventional tissue culture polystyrene dishes. Figure 3 shows phase-contrast microscope images for hepatocytes seeded on tissue-culture polystyrene and incubated after (a) 0 hours and (b) 18 hours, and hepatocytes exposed to 50 µM Cd2+ after (c) 2 h (d) 6 h, (e) 10 h, and (f) 14 h. Time 0 is defined as the point when toxin (or a blank for the control) is added. Hepatocytes remain healthy and relatively unchanged after 18 h for the control (Figure 3b). However, the images of Figure 3 reveal very distinct changes in morphology after hepatocytes are exposed to 50 µM Cd2+. In particular, granular appearance increases substantially, even after 2 h. Apparent lipid droplet formation is also evident after 2 h (circular, phase-bright features), but either disappears or is obscured by other morphological changes at later times. By 14 h, most cellular features become indistinguishable due to the structural breakdown associated with necrotic cell death.
Figure 3.
Phase-contrast microscope images of primary rat hepatocytes seeded on tissue-culture polystyrene multi-well plates. (a) Hepatocytes without toxin at t = 0. (b) Hepatocytes without toxin after 18 h. Hepatocytes after exposure to 50 µM Cd2+ at (c) 2 h, (d) 6 h, (e) 10 h, and (f) 14 h. Time 0 corresponds to the time in which toxin (or a blank for the control) was added. Cells exposed to Cd2+ begin to show granular appearance within the first 2 h. Most cellular features become indistinguishable 14 h after Cd2+ exposure. Image dimensions are 150 µm × 150 µm.
The changes in light scattering observed in the optical microscope can be more precisely monitored using spectroscopy.18,19 An important additional advantage of a spectroscopic measurement is that fiber optic cables can be used to interface an external illumination source and spectrometer with cells maintained in an incubator. Thus, hepatocytes seeded on a porous Si photonic crystal can be monitored in their ideal environment under conditions of controlled temperature and atmosphere. The spot size used for the present experiments is on the order of 1 mm2, which encompasses approximately 500 hepatocytes.
Figure 4a shows plots of relative intensity of scattered light vs. time for hepatocytes seeded on porous Si photonic crystals after exposure to 50 µM Cd2+ (“+Cd2+”) or 0 µM Cd2+ (“+Blank”), and plots of cell viability after exposure to 50 µM Cd2+ monitored on the same cell culture isolation using a conventional MTT (Methylthiazolyldiphenyl-tetrazolium bromide) stain (“MTT stain;” solid circles). Representative scattered light spectra are shown in Figure 4b. For samples monitored spectroscopically, addition of solution (containing Cd2+ or blank media) produces an initial spike in peak intensity, attributed to condensation effects caused by opening the incubator. However, while scattering intensity for the control returns to baseline after condensation dissipates, the sample in which hepatocytes are exposed to 50 µM Cd2+ shows a significant increase in relative intensity after ~2 h.
The changes in scattering intensity after hepatocytes are exposed to 50 µM Cd2+ (Figure 4) correlate to observed physical changes using phase-contrast microscopy (Figure 3), and occur ~2 h before the MTT stain begins to indicate loss of viability. The intensity of scattered light reaches a constant value after ~10 h, while viability according to the MTT stain only decreases to ~50% of the initial value in the same time period. Scattered light intensity stabilizes before the MTT stain indicates complete loss of viability, demonstrating that the scattered light method is not a direct measure of cell viability. However, since loss of viability is invariably accompanied by changes in cell morphology, the scattered light method represents an early indicator of these changes (in advance of the traditional assay), providing a tool for preliminary monitoring of cellular health.
Several morphological changes that are considered precursors to loss of cell viability might lead to the increase in light scattering observed in the present experiments, including changes in mitochondrial composition and lipid formation.19–22 The phenomenon of Cd2+-induced toxicity in hepatocytes has been widely studied;23–25 the primary cause for loss of viability is generally attributed to interruption of metabolic activity.24 Cell damage due to concentrations of Cd2+ in the 50–400 µM range occurs within the first hour of exposure, and includes a decrease in membrane and metabolic integrity.24,25 Measures of metabolic function and membrane integrity are sensitive early indicators of Cd2+-induced cytotoxicity, and the timescale in which scattering changes occur due to a toxic dose of Cd2+ coincides with the timescale reported for these tests.24,25 However, while most other techniques require sampling of media or addition of dyes, light scattering can be continuously observed while the cells remain incubated and undisturbed.
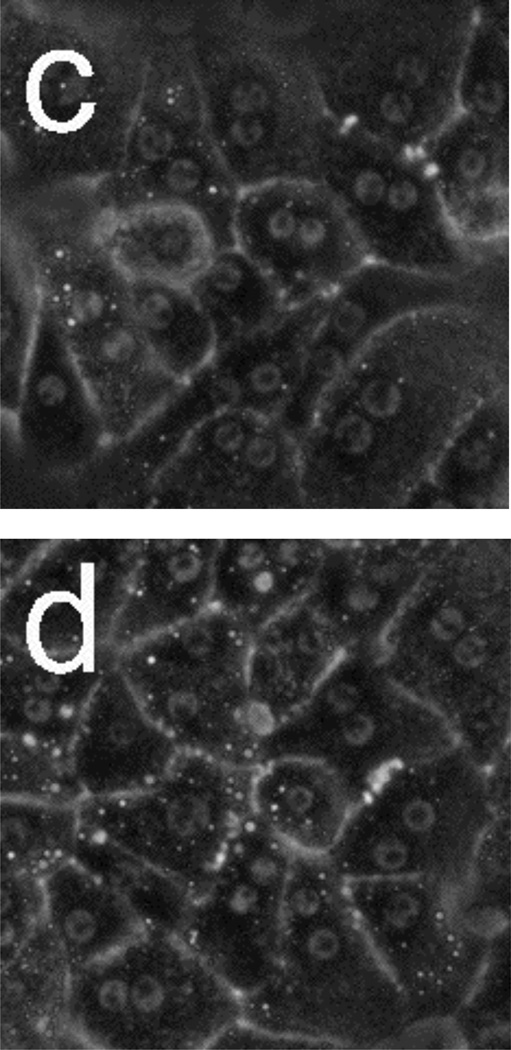
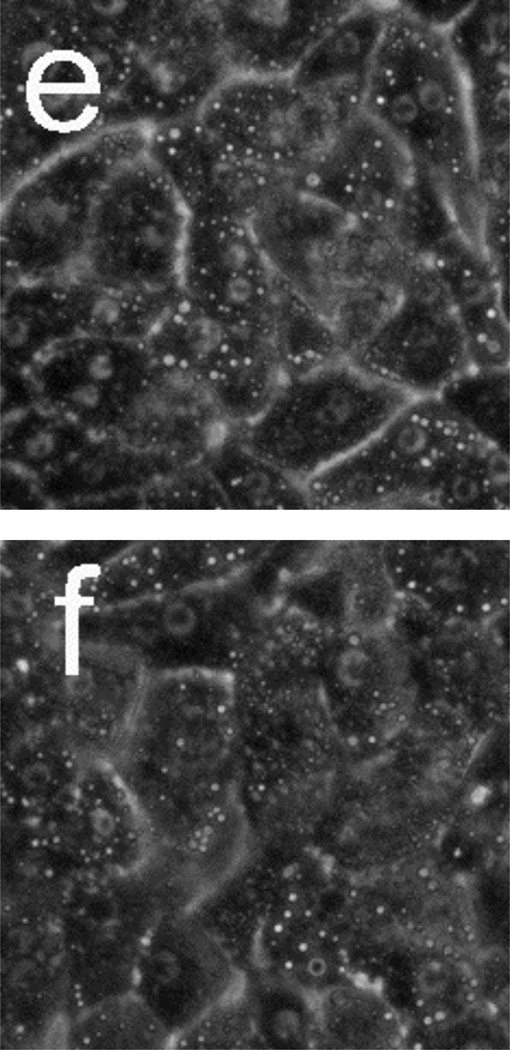
Figure 5 presents phase-contrast microscope images of hepatocytes exposed to toxic and subtoxic doses of N-acetyl-p-aminophenol (abbreviated APAP, and commonly referred to as acetaminophen). Hepatocytes remain healthy and relatively unchanged 18 h after the addition of a sub-toxic dose (10 mM) of APAP, and appear similar to the control experiment shown in Figure 3a and b in which no toxin is added. However, the images in Figure 5 c–f indicate that exposure to a toxic dose (40 mM) of APAP leads to significant morphology changes. In particular, lipid droplets (circular, phase-bright features) are observed starting at 4 h, with the frequency of these features increasing for each time point. After 12.5 h, hepatocytes exposed to APAP begin to show a significant granular appearance, similar to what is observed for toxic doses of Cd2+.
Figure 5.
Phase-contrast microscope images of primary rat hepatocytes seeded on tissue-culture polystyrene multi-well plates after exposure to 10 mM N-acetyl-p-aminophenol (APAP) for (a) 2 h and (b) 18 h, and 40 mM APAP for (c) 4 h, (d) 8 h, (e) 12.5 h, and (f) 18 h. There is little to no change in cellular morphology after exposure to 10 mM APAP for 18 h. However, 4 h after exposure to 40 mM APAP, the presence of lipid droplets (circular, phase-bright features) becomes evident. The number of lipid droplets continues to increase up to 12.5 h. There is significant granular appearance 18 h after introduction of 40 mM APAP, although some cellular features are still apparent. Image dimensions are 150 µm × 150 µm.
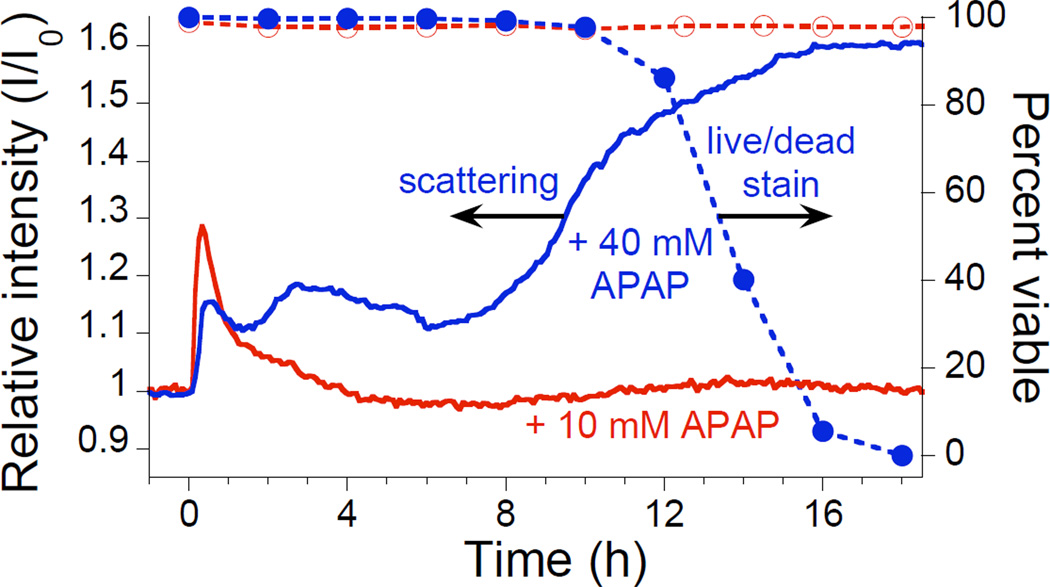
Figure 6 presents light scattering and viability data for hepatocytes exposed to 10 and 40 mM doses of APAP. The light scattering results for hepatocytes on a porous Si photonic crystal are compared to the ethidium live/dead assay on cells seeded on tissue-culture polystyrene. After introduction of 10 mM APAP (Figure 6, “+ 10 mM APAP”), a spike in scattering intensity due to condensation effects is followed by a return to baseline, indicating that this dose is not toxic to hepatocytes within the time scale of the experiment. The live/dead assay (Figure 6, open circles) and phase-contrast microscope images (Figure 5b) confirm that a 10 mM dose of APAP is sub-toxic and does not cause a loss of hepatocyte viability. By contrast, exposure to 40 mM APAP results in a significant increase in scattered intensity within ~2 h of addition, with the largest intensity change beginning after ~8 h (Figure 6, “+ 40 mM APAP”). Phase-contrast microscopy (Figure 5c–f) also reveals signs of cellular stress within the first few hours of introduction of 40 mM APAP. The live/dead stain indicates that all cells lose viability within ~19 h of introduction of 40 mM APAP, with the first signs of cell death occurring after ~12 h (Figure 6, solid circles). Similar to the Cd2+-exposure results (Figure 4), light scattering from a porous Si photonic crystal indicates changes in cell morphology well before loss of viability is observed using a traditional assay.
Figure 6.
Monitoring acetaminophen (APAP)-induced morphology changes in rat hepatocytes by light scattering from a photonic crystal substrate. Aqueous APAP is added at t = 0 to bring the concentration to either 10 mM (“+10 mM APAP”) or 40 mM (“+40 mM APAP”). Scattering data were obtained in an incubator using the configuration indicated in Figures 1c and 1d. Also shown are the results of the corresponding viability assay (ethidium stain) for 10 mM (Open circles, dashed line) and 40 mM (Solid circles, dashed line) APAP added to hepatocytes seeded and incubated on tissue-culture polystyrene multi-well plates.
The light scattering results for hepatocytes exposed to 40 mM APAP are similar, but not identical, to those observed for Cd2+ exposure. The mechanism for APAP-induced toxicity differs from Cd2+ in that APAP does not directly cause cell damage. Rather, APAP is metabolized to form N-acetyl-p-benzoquinone (NAPQI), which then covalently binds proteins and interrupts cellular function.26–28 APAP toxicity occurs in two distinct phases, a metabolic phase and an oxidative phase, with the first signs of cell lysis or leakage occurring after ~2 h.29 Distinct changes in mitochondrial permeability have been observed for hepatocytes exposed to toxic doses of APAP, with the first occurring 3–6 h and the second 9–16 h after administration.30 In the present work, the light scattering data reproducibly display a feature ~2–6 h after APAP introduction (Figure 6, “+40 mM APAP”), which may be attributable to cell morphology changes induced by the metabolic phase of APAP toxicity, although further testing is necessary to confirm this. Importantly, the difference in the time-dependent scattering changes observed for the different toxins (APAP and Cd2+) indicates that this method provides time-resolved information that should be useful in detailed mechanistic studies of cell viability.
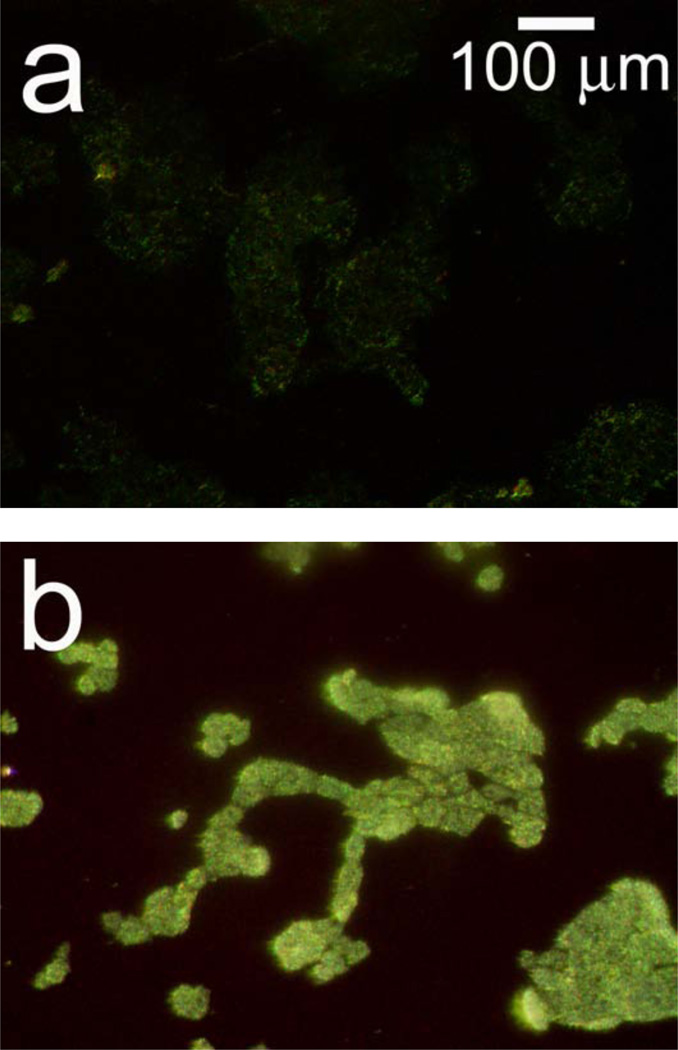
One advantage of porous Si-based photonic crystals is that the materials can be prepared with >106 spectral “barcodes,”14 enabling multiplexing of cellular libraries for high-throughput screening applications. The potential to use the scattering method in high-throughput applications was investigated using a porous Si photonic crystal encoded with a spectrum different from the one used to obtain the images in Figure 2 above. Figure 7 shows a comparison of microscope images collected using off-normal optics (As illustrated in Figures 1c and 1d) for hepatocytes (a) before and (b) 20 h after exposure to 40 mM APAP. The photonic crystal used for the APAP experiment in Figure 7 was etched such that the reflectance peak appears in the green region of the spectrum, and the cells appear with a color characteristic of that underlying photonic crystal. Upon exposure to APAP, the cells lose viability and appear much brighter in the scattered light image (Figure 7b). The images in Figures 2 and 7 thus illustrate the principle of using a porous Si photonic crystal in a high-throughput application. Using different color-coded photonic crystals (in this case, red and green) containing different drugs, drug concentrations, or combinations, it would be possible to determine which is toxic by observing the color of the more intensely scattering cells either visually or spectrally.
Figure 7.
Microscope images monitoring APAP-induced morphology changes of hepatocytes on a photonic crystal. Data were collected using the optical design illustrated in Figures 1c and d. Cells were seeded on a chip that was etched to reflect in the green region of the spectrum to demonstrate potential multiplexing applications. Images collected (a) before and (b) 20 h after addition of 40 mM APAP. Hepatocytes were incubated for this experiment, and therefore different regions are observed for (a) and (b) since the cells were removed from the incubator prior to image acquisition.
Conclusions
The changes in intensity of a spectral band scattered from an assembly of hepatocyte cells on a polystyrene-filled porous Si photonic crystal are related to morphology changes in the cells as they respond to toxic doses of acetaminophen (APAP) or Cd2+. Exposure to toxins results in changes in scattering efficiency that can be correlated to loss of viability several hours in advance of conventional viability staining methods. Healthy cells show minimal changes in scattering efficiency under the experimental conditions. While the light scattering methodology was tested on rat hepatocyte cells, it should in principle operate with any biological entity that is large enough to scatter light. Thus the method may be useful for measuring other cellular biological processes such as cell proliferation.
One of the primary advantages of the porous Si-based system is that the monitoring apparatus can be incorporated into an incubator or integrated with a conventional light microscope equipped with an inexpensive CCD spectrometer for real-time analysis. This method for monitoring cells provides a good preliminary indicator of changes in cellular health, and can be used as a complementary tool to determine when staining or other traditional assays might be necessary. The polystyrene-coated porous Si photonic crystal on which the cells reside provides a surface similar to a standard Petri dish or multi-well plate, although more complex biosensing schemes could be envisioned. For example, recognition elements could be incorporated in the porous layer to monitor specific cellular by-products,7–9 or drugs could be loaded in different regions of the porous chip. In more general terms, the scattering method reported here represents a label-free, non invasive method to continuously monitor cell morphology, important to many areas of biotechnology.
Acknowledgements
This work was supported by the David and Lucile Packard Foundation, the National Cancer Institute of the National Institutes of Health (Contract No. N01-C0-37117) and the Air Force Office of Scientific 26 Research (Grant# F49620-02-1-0288). MPS thanks the La Jolla Interfaces in Science program, funded by the Burroughs Wellcome Fund for a post-doctoral fellowship. AMD thanks the UC Biotechnology Research and Education Program for a G.R.E.A.T. fellowship (#2004-16). SDA is grateful for fellowships provided by the Department of Education, Graduate Assistance in Areas of National Need (GANN) program (P200A030163), and the San Diego Fellowship, administered by the University of California, San Diego.
References
- 1.McConnell HM, Owicki JC, Parce JW, Miller DL, Baxter GT, Wada HG, Pitchford S. Science. 1992;257:1906. doi: 10.1126/science.1329199. [DOI] [PubMed] [Google Scholar]
- 2.Daunert S, Barrett G, Feliciano JS, Shetty RS, Shrestha S, Smith-Spencer W. Chem. Rev. 2000;100:2705. doi: 10.1021/cr990115p. [DOI] [PubMed] [Google Scholar]
- 3.Kovacs GTA. Proc. IEEE. 2003;91:915. [Google Scholar]
- 4.Pancrazio JJ, Whelan JP, Borkholder DA, Ma W, Stenger DA. Ann. Biomed. Eng. 1999;27:697. doi: 10.1114/1.225. [DOI] [PubMed] [Google Scholar]
- 5.Hug TS. Assay Drug Dev. Technol. 2003;1:479. doi: 10.1089/154065803322163795. [DOI] [PubMed] [Google Scholar]
- 6.Starodub NF, Fedorenko LL, Starodub VM, Dikij SP, Svechnikov SV. Sens. Actuators B. 1996;35:44. [Google Scholar]
- 7.Lin VSY, Motesharei K, Dancil KS, Sailor MJ, Ghadiri MR. Science. 1997;278:840. doi: 10.1126/science.278.5339.840. [DOI] [PubMed] [Google Scholar]
- 8.Janshoff A, Dancil K-PS, Steinem C, Greiner DP, Lin VSY, Gurtner C, Motesharei K, Sailor MJ, Ghadiri MR. J. Am. Chem. Soc. 1998;120:12108. [Google Scholar]
- 9.Dancil K-PS, Greiner DP, Sailor MJ. J. Am. Chem. Soc. 1999;121:7925. [Google Scholar]
- 10.Bayliss SC, Buckberry LD, Harris PJ, Tobin M. J. Porous Mater. 2000;7:191. [Google Scholar]
- 11.Bayliss SC, Buckberry LD, Fletcher I, Tobin MJ. Sens. Actuators A. 1999;74:139. [Google Scholar]
- 12.Chin V, Collins BE, Sailor MJ, Bhatia SN. Adv. Mater. 2001;13:1877. [Google Scholar]
- 13.Cunin F, Schmedake TA, Link JR, Li YY, Koh J, Bhatia SN, Sailor MJ. Nature Mater. 2002;1:39. doi: 10.1038/nmat702. [DOI] [PubMed] [Google Scholar]
- 14.Meade SO, Yoon MS, Ahn KH, Sailor MJ. Adv. Mater. 2004;16:1811. [Google Scholar]
- 15.Wegrzyn G, Czyz A. J. Appl. Microbiol. 2003;95:1175. doi: 10.1046/j.1365-2672.2003.02121.x. [DOI] [PubMed] [Google Scholar]
- 16.O'Brien PJ, Chan K, Silber PM. Chem.-Biol. Interact. 2004;150:97. doi: 10.1016/j.cbi.2004.09.003. [DOI] [PubMed] [Google Scholar]
- 17.Dunn JCY, Yarmush ML, Koebe HG, Tompkins RG. Faseb J. 1989;3:174. doi: 10.1096/fasebj.3.2.2914628. [DOI] [PubMed] [Google Scholar]
- 18.Wax A, Yang C, Backman V, Badizadegan K, Boone CW, Dasari RR, Feld MS. Biophys. J. 2002;82:2256–2264. doi: 10.1016/S0006-3495(02)75571-9. [DOI] [PMC free article] [PubMed] [Google Scholar]
- 19.Wilson JD, Bigelow CE, Calkins DJ, Foster TH. Biophys. J. 2005;88:2929. doi: 10.1529/biophysj.104.054528. [DOI] [PMC free article] [PubMed] [Google Scholar]
- 20.Beauvoit B, Chance B. Mol. Cell. Biochem. 1998;184:445. [PubMed] [Google Scholar]
- 21.Boustany NN, Drezek R, Thakor NV. Biophys. J. 2002;83:1691. doi: 10.1016/S0006-3495(02)73937-4. [DOI] [PMC free article] [PubMed] [Google Scholar]
- 22.Kital T, Beauvoit B, Chance B. Transplantation. 1996;62:642. doi: 10.1097/00007890-199609150-00018. [DOI] [PubMed] [Google Scholar]
- 23.Rikans LE, Yamano T. J. Biochem. Mol. Toxicol. 2000;14:110. doi: 10.1002/(sici)1099-0461(2000)14:2<110::aid-jbt7>3.0.co;2-j. [DOI] [PubMed] [Google Scholar]
- 24.Santone KS, Acosta D, Bruckner JV. J. Toxicol. Environ. Health A. 1982;10:169. doi: 10.1080/15287398209530240. [DOI] [PubMed] [Google Scholar]
- 25.Stacey NH, Cantilena LR, Klaassen CD. Toxicol. Appl. Pharmacol. 1980;53:470. doi: 10.1016/0041-008x(80)90359-2. [DOI] [PubMed] [Google Scholar]
- 26.Jollow DJ, Mitchell JR, Potter WZ, Davis DC, Gillette JR, Brodie BB. J. Pharmacol. Exp. Ther. 1973;187:195. [PubMed] [Google Scholar]
- 27.Dahlin DC, Miwa GT, Lu AYH, Nelson SD. Proc. Nat'l. Acad. Sci. USA. 1984;81:1327. doi: 10.1073/pnas.81.5.1327. [DOI] [PMC free article] [PubMed] [Google Scholar]
- 28.James LP, Mayeux PR, Hinson JA. Drug Metab. Dispos. 2003;31:1499. doi: 10.1124/dmd.31.12.1499. [DOI] [PubMed] [Google Scholar]
- 29.Reid AB, Kurten RC, McCullough SS, Brock RW, Hinson JA. J. Pharmacol. Exp. Ther. 2005;312:509. doi: 10.1124/jpet.104.075945. [DOI] [PubMed] [Google Scholar]
- 30.Kon K, Kim JS, Jaeschke H, Lemasters JJ. Hepatology. 2004;40:1170. doi: 10.1002/hep.20437. [DOI] [PubMed] [Google Scholar]


