

Abstract
Although changes in chromatin are integral to transcriptional reprogramming during cellular differentiation, it is currently unclear how chromatin modifications are targeted to specific loci. To systematically identify transcription factors (TFs) that can direct chromatin changes during cell fate decisions, we model the relationship between genome-wide dynamics of chromatin marks and the local occurrence of computationally predicted TF binding sites. By applying this computational approach to a time course of Polycomb-mediated H3K27me3 marks during neuronal differentiation of murine stem cells, we identify several motifs that likely regulate the dynamics of this chromatin mark. Among these, the sites bound by REST and by the SNAIL family of TFs are predicted to transiently recruit H3K27me3 in neuronal progenitors. We validate these predictions experimentally and show that absence of REST indeed causes loss of H3K27me3 at target promoters in trans, specifically at the neuronal progenitor state. Moreover, using targeted transgenic insertion, we show that promoter fragments containing REST or SNAIL binding sites are sufficient to recruit H3K27me3 in cis, while deletion of these sites results in loss of H3K27me3. These findings illustrate that the occurrence of TF binding sites can determine chromatin dynamics. Local determination of Polycomb activity by REST and SNAIL motifs exemplifies such TF based regulation of chromatin. Furthermore, our results show that key TFs can be identified ab initio through computational modeling of epigenome data sets using a modeling approach that we make readily accessible.
Cellular differentiation entails organized changes in gene expression. Pluripotent stem cells that commit to a somatic fate have to stably repress pluripotency genes and activate lineage specific genes in a temporally correct fashion. This regulation is coordinated by transcription factors (TFs) in concert with dynamic changes in local chromatin organization of the DNA template. These changes have recently been documented in genome-wide analyses of histone modifications and DNA methylation (Mikkelsen et al. 2007; Meissner et al. 2008; Mohn et al. 2008; Zhou et al. 2011). Together with genetic studies, epigenome maps have helped to establish the relevance of specific reprogramming of chromatin during differentiation. While several large international efforts to gather epigenome data have been launched (Satterlee et al. 2010; Abbott 2011), only limited tools exist to determine the regulatory circuitry that guides chromatin dynamics.
Chromatin modifications can act upstream of TF activity by inhibiting or enhancing their ability to bind their cognate sites in the DNA (Barrera and Ren 2006; Kouzarides 2007). In turn, TFs can also act upstream of chromatin modifications by recruiting chromatin modifying enzymes, that modify the epigenome (Chan and La Thangue 2001; Lee et al. 2005). It is this latter mechanism that we wish to investigate here in a systematic manner. Since mammalian genomes encode an estimated 1500–2000 TFs (Vaquerizas et al. 2009), a comprehensive experimental investigation of all TFs is precluded, and other strategies are thus required to identify candidate TFs that are involved in particular aspects of chromatin regulation. To address this need, we adapted our recently published MARA (motif activity response analysis) approach, which models gene expression dynamics in terms of predicted transcription factor binding sites (TFBS) (FANTOM Consortium and Riken Omics Science Center 2009), to, instead, model genome-wide measured chromatin dynamics. The resulting Epi-MARA (Epigenome–motif activity response analysis) provides an analytical approach to identify TFs associated with chromatin reorganization ab initio, which we have made directly accessible through a web server (http://ismara.unibas.ch).
Here we use this approach to identify TFs that are involved in dynamic changes of a chromatin modification set by the Polycomb system, arguably the most relevant gene repression system during development (Schuettengruber and Cavalli 2009; Simon and Kingston 2009; Beisel and Paro 2011; Margueron and Reinberg 2011). A central component of Polycomb-mediated silencing is trimethylation of lysine 27 on histone H3 (H3K27me3), which is set by the Polycomb repressive complex 2 (PRC2). The protein enhancer of zeste homolog 2 (EZH2) catalyzes the methylation of H3K27 as part of PRC2 (Czermin et al. 2002; Muller et al. 2002) and it is required for differentiation and reprogramming (O'Carroll et al. 2001; Pereira et al. 2010). Target genes include important developmental regulators in mouse embryonic stem (ES) cells (Boyer et al. 2006) and are in part cell-type specific (Bracken et al. 2006; Mikkelsen et al. 2007; Mohn et al. 2008). Although DNA binding factors with limited sequence specificity have been implicated in targeting of the Polycomb system in flies (Ringrose and Paro 2007; Schwartz and Pirrotta 2008), the question of how Polycomb targets are specified remains currently unresolved, especially in vertebrates (Simon and Kingston 2009; Beisel and Paro 2011). We applied Epi-MARA on three developmental time points, where we measured the H3K27me3 chromatin mark during in vitro neurogenesis starting from murine stem cells (Mohn et al. 2008), resulting in a number of putative TFs involved in regulating different aspects of this chromatin reorganization. Among the top predictions were that binding sites for the SNAIL family of TFs and for sites of the TF RE1-silencing transcription factor (REST) are associated with a transient increase in H3K27me3 at promoters in neuronal progenitors (NPs). We experimentally validate the role of REST using genome-wide mapping of REST binding and H3K27me3 levels in both wild-type and REST-knockout cells. Furthermore, using transgenic constructs we show that promoter fragments containing REST or SNAIL binding sites are sufficient to recruit H3K27me3 while fragments in which these sites are deleted show reduced H3K27me3 levels. These results provide clear examples in vertebrates of TFs that locally influence Polycomb activity and, more generally, illustrate that TFs with regulatory function for epigenome reprogramming can be identified ab initio using computational modeling.
Results
Predicting mediators of chromatin changes using Epi-MARA
Comprehensive mapping of promoter regions (Harbers and Carninci 2005; de Hoon and Hayashizaki 2008; Balwierz et al. 2009) combined with comparative genomic prediction of TFBSs (van Nimwegen 2007) for known TF binding motifs (Wasserman and Sandelin 2004) have enabled researchers to study to what extent local occurrence of TFBSs can explain patterns of gene expression (Beer and Tavazoie 2004; Gao et al. 2004; Das et al. 2006; FANTOM Consortium and Riken Omics Science Center 2009). Here, we ask to what extent dynamic changes in chromatin can be explained by local TFBS occurrence and aim to identify TFs that are involved in modulating chromatin locally.
To address this question systematically, we adapted our recently developed MARA (FANTOM Consortium and Riken Omics Science Center 2009), which models mRNA expression dynamics in terms of predicted TFBSs, to model genome-wide patterns of epigenetic marks, and termed this approach Epi-MARA (Fig. 1). Concretely, if Mps quantifies the amount of a particular epigenetic mark M at promoter p in sample s, and Npm denotes the total number of predicted binding sites for regulatory motif m in promoter p, then we assume a linear model of the following form:
where cp is the basal level of the chromatin mark at promoter p, and Ams is the unknown activity of motif m in sample s, which is inferred by Epi-MARA (see Methods). Abstractly speaking, the activity Ams quantifies how much each occurrence of motif m contributes to the level of epigenetic mark M in sample s. One can think of Ams as reflecting the amount of TF binding to sites of motif m and the resulting effect on chromatin mark M. Thus, whenever Epi-MARA infers a highly positive activity Ams, this predicts that the binding TF recruits the chromatin mark at stage s, whereas a highly negative Ams implies that the binding TF inhibits deposition of the mark at stage s. Notably, since the average level at each promoter p is fitted by the parameter cp, the activities Ams capture the relative contributions of a motif across the different stages and will thus include both positive and negative activities.
Figure 1.

Epi-MARA's approach to predicting transcription factor activities that explain dynamics in H3K27me3 levels during neuronal differentiation. Transcription factor binding sites were predicted in proximal promoters genome-wide, using a Bayesian method that explicitly models binding site evolution. Epi-MARA models measured chromatin dynamics in terms of predicted TFBSs. Mps quantifies the amount of a particular epigenetic mark M at promoter p in sample s, Npm denotes the total number of predicted binding sites for regulatory motif m in promoter p, cp indicates the basal level of the mark at promoter p, and Ams is the unknown activity of motif m in sample s, which is inferred by the method. Depicted are the normalized activity profiles of the top nine motifs (green lines, with standard errors indicated) with their respective z-values. The three time points correspond to the embryonic stem cell (ES), neuronal progenitor (NP), and terminal neuron (TN) stage. (Insets) Sequence logos of each of the motifs and the transcription factors thought to bind to them are shown.
Notably, it is not the aim of Epi-MARA to provide accurate fits of epigenetic profiles at individual promoters. Since the actual levels of a chromatin mark at any promoter are likely a complex function of many variables acting both in cis and in trans, the simple linear model of Equation 1 typically captures only part of the variance in epigenetic mark levels. Importantly, however, the motif activities are inferred from the combined statistics of the hundreds to thousands of promoters that contain a site for a given motif. Thus, the linear model applied by Epi-MARA effectively averages out the complications at individual promoters, and the remaining signal provides a robust statistical average activity for each motif, enabling reliable prediction of the TFs involved in chromatin mark dynamics. To allow easy application of this method, we have made automated Epi-MARA analysis available online (http://ismara.unibas.ch).
As a biological model of dynamic changes of transcriptome and epigenome, we used a well-characterized mouse differentiation system, which progresses from ES cells to terminal neurons (TNs) through a defined NP state (Bibel et al. 2004, 2007; Plachta et al. 2004). We set out to identify the possible role of TFs in cell-type specific targeting of Polycomb-mediated H3K27 trimethylation in this system and applied Epi-MARA to our data set of H3K27me3 at promoters in the ES, NP, and TN stages (Mohn et al. 2008). The general approach is shown in Figure 1 together with the predicted activities of the nine motifs that contributed most to explaining the genome-wide H3K27me3 dynamics at promoters as indicated by a z-statistic (see Supplemental Fig. 1 for a more extensive list). Five of these nine, i.e., SP1, Snail (SNAI1), ZEB1, REST, and ARNT/AHR, show a pattern in which there is a strong transient increase in motif activity at the NP stage. That is, Epi-MARA predicts the TFs binding these motifs to be involved in the recruitment of H3K27me3 going from the ES to the NP stage. Of these candidate TFs we chose REST as a target for in-depth experimental validation as it is the only one of these motifs that is likely bound by a single TF and thus highly suitable for functional testing by genetic deletion. In contrast, Snail, ZEB1, and SP1 motifs can each be recognized by multiple TFs (Postigo and Dean 2000; Bouwman and Philipsen 2002; Nieto 2002).
To compare the activity of TFs in regulating chromatin dynamics with their activities regulating expression we also analyzed transcriptome data of the three consecutive stages using the MARA method (FANTOM Consortium and Riken Omics Science Center 2009). One of the motifs that, according to the MARA analysis, most significantly regulate expression changes is the E2F motif (Supplemental Fig. 2). Its inferred transcriptional activity is highly positive in the ES and NP stages where cells are proliferating, while it strongly decreases at the TN stage where cells are post-mitotic and have exited the cell cycle. This is consistent with the known function of the E2F family of cell-cycle regulators that bind to this motif (Tao et al. 1997). In contrast, Epi-MARA predicts no significant activity on H3K27me3 dynamics for the E2F motif.
Interestingly, REST is also inferred to have an important role in driving expression changes, and its activity profile is consistent with its known role as a repressor of neuronal genes in nonneuronal tissues (Schoenherr and Anderson 1995). That is, REST target genes become active at the TN stage where REST itself is down-regulated (Supplemental Fig. 3A). However, the activity profile of REST directing expression changes (Supplemental Fig. 2) is clearly distinct from its activity profile directing H3K27me3 (Fig. 1), suggesting that REST's effects on transcription levels are at least partially independent from its effects on H3K27me3 levels. Notably, we find that predicted REST sites have higher than average H3K27me3 levels at all three time points in line with previous observation in individual cell states (Supplemental Table 1; Zheng et al. 2009; Liu et al. 2010). We note that two recent studies, which appeared well past our decision to functionally validate the role of REST, reported biochemical interaction between REST and members of the Polycomb group (Ren and Kerppola 2011; Dietrich et al. 2012). However, these observations of a general co-occurrence of REST and Polycomb do not predict the cell-type specific activity for REST, which depends on the analysis of dynamic changes in H3K27me3 levels across the time course.
Experimentally determined REST binding sites support the computational prediction
To ask whether Epi-MARA's activity prediction, which is based on computationally predicted REST sites, is confirmed by REST binding sites that are indeed occupied by the factor, we mapped REST binding at the ES and NP stages. We carried out chromatin immunoprecipitation (ChIP) of REST bound DNA and subjected the precipitated DNA to high throughput sequencing (ChIP-seq). Peak finding was done on pooled replicates and revealed 1599 REST binding peaks in ES cells and 1035 in progenitors. Identified binding sites show a large overlap to those previously reported (Supplemental Fig. 4; Johnson et al. 2008). The reduced number of peaks in progenitors likely reflects the fact that REST protein levels decrease during neuronal differentiation (Supplemental Fig. 3A). In agreement with this hypothesis 97% of the peaks present in progenitors are also present in stem cells. The majority of REST peaks contain a predicted binding site (Supplemental Table 2), and the number of predicted sites and the amount of binding as assayed by ChIP-seq correlate positively (r = 0.48, P-value 2.9 × 10−53). As we recently showed (Arnold et al. 2012), the rate of false positive predicted REST sites is generally low. Of the 24,004 promoters without evidence of REST binding, only 164 (0.7%) were predicted to harbor a REST binding site. REST binding occurs preferentially in proximity to transcription start sites (TSS) (Supplemental Fig. 3B) and we classified genes with REST binding within ±2 kb of the TSS as potentially regulated by this factor (Supplemental Fig. 3C). Mammalian promoters separate into two classes associated with either high or low density of CpG dinucleotides (Bird 1986; Carninci et al. 2006; Balwierz et al. 2009), and we observe that REST predominantly targets high-CpG promoters (Supplemental Table 3). Interestingly, promoter-proximal REST binding sites show a distinct positioning immediately downstream from TSS (Sun et al. 2005; Zhang et al. 2006), which we also observe for both predicted and measured REST binding (Fig. 2A). While there is general agreement between predicted and measured REST binding, not all predicted promoter sites are occupied and some of the promoter-proximal REST peaks lay just outside the regions covered by the computational predictions. We therefore asked whether Epi-MARA predicts different activities for REST if we replace the computationally predicted REST sites with the actual binding data (see Methods). This analysis resulted in a strikingly identical activity profile for REST, but with much larger significance as the z-value almost doubled (Fig. 2B). These results not only support the REST activity profile inferred using the TFBS predictions but also illustrate how actual in vivo binding data can be incorporated, which, in this case, increased the accuracy of Epi-MARA's inference.
Figure 2.

Analysis of REST binding data supports computational predictions. (A) Frequency of predicted (green line) and measured (blue line) binding sites around TSSs. (B) REST activity profiles calculated by Epi-MARA are similar when using either computationally predicted (green line) or measured REST binding sites (blue line). The prediction has higher significance when using the measured sites as indicated by the higher z-value (i.e., higher variance in activity relative to the error bars).
REST binding is associated with H3K27me3 dynamics genome-wide
Next, we assessed H3K27me3 dynamics beyond promoter regions by performing ChIP-seq at the three differentiation stages and determined all genomic regions that were enriched for H3K27me3 in at least one of the cellular states (see Methods). First, we noted that H3K27me3 levels peak immediately downstream from the TSS very similar to the binding pattern of REST (Supplemental Fig. 5A). Moreover, H3K27me3 levels peak around REST binding sites, suggesting that the TF and chromatin mark colocalize (Supplemental Fig. 5B). If REST is mediating deposition of H3K27me3 by recruitment of Polycomb, we would expect REST binding to also colocalize with members of the PRC2 complex. To test this we analyzed SUZ12 ChIP-seq binding data from mouse ES cells (Pasini et al. 2010) and NPs around REST binding sites. Importantly, we find that SUZ12 is even more localized at REST sites than H3K27me3 (Supplemental Fig. 5B).
Although many H3K27me3 enriched regions occur proximal to promoters, more than two-thirds of H3K27me3 enriched regions are distal to promoters. However, these distal H3K27me3 regions are much less likely to be targeted by REST than promoter-proximal regions (Supplemental Table 4). Given REST's preferred targeting to high-CpG promoters, we investigated the CpG content of all H3K27me3 regions and found that, strikingly, these separate into high- and low-CpG classes, similar to promoters (Fig. 3A). Moreover, CpG content cleanly distinguishes proximal and distal H3K27me3 regions, with 85% of proximal regions being high-CpG and 75% of distal regions being low-CpG (Fig. 3A). High-CpG regions are further distinct as they show higher levels of H3K27me3 than low-CpG regions (Supplemental Fig. 5C). Motivated by these differences, we asked whether Epi-MARA predicts different motif activities for REST if we analyze high- and low-CpG regions separately (see Methods). For high-CpG regions Epi-MARA predicts the same general activity profile for REST as previously for promoters, but with even higher significance (Fig. 3B). Strikingly, for low-CpG regions REST's significance is not only reduced but the inferred activity is almost “opposite” to that of REST on high-CpG regions (Fig. 3B), i.e., with a transient “loss” of H3K27me3 at the NP stage. Interestingly, high- and low-CpG regions have distinct H3K27me3 dynamics in general and the dynamics observed at REST targets are consistent with Epi-MARA's predictions (Fig. 3C,D).
Figure 3.

REST is associated with H3K27me3 dynamics at high- and low-CpG regions genome-wide. (A) The distribution of CpG dinucleotide frequencies of H3K27me3 regions genome-wide is bimodal and can be fit by a mixture of two log-normal distributions (red and blue lines) corresponding to high- and low-CpG regions, respectively. (Inset) Numbers of K27me3 regions that are promoter-proximal and distal for high-CpG and low-CpG regions. (B) REST activity profiles on high- (red) and low-CpG regions (blue) as inferred by running Epi-MARA on all H3K27me3 regions genome-wide show a transient gain and loss, respectively, at the NP stage. Note that, whereas REST activity on the high-CpG regions is highly significant, on the low-CpG regions REST activity has a much weaker significance. (C) Reverse cumulative distributions of changes in H3K27me3 levels at the transition from ES to NP stage. We divided regions that were enriched for H3K27me3 into high-CpG/low-CpG (red/blue) and REST-target/nontarget (solid/broken lines) regions. At high-CpG regions REST targets tend to gain H3K27me3 going from the ES to the NP stage whereas nontarget regions are equally likely to gain or lose H3K27me3. In contrast, most low-CpG regions lose H3K27me3 going to the NP stage, and REST targets tend to lose even more H3K27me3. (D) As in panel C but now for the transition from the NP to the TN stage. High-CpG regions generally tend to lose H3K27me3 and REST targets tend to lose even more, whereas low-CpG regions tend to gain H3K27me3 and REST targets tend to gain even more.
In summary, genome-wide analysis of H3K27me3 levels predicts that REST binding at high-CpG regions, which includes most promoter-proximal REST targets, leads to a transient gain in H3K27me3 at the NP stage. In addition, a less significant transient loss of H3K27me3 at the NP stage for low-CpG regions is also predicted by Epi-MARA. We next tested these predictions by analyzing cells in which the Rest gene is deleted.
REST protein is required for local H3K27 methylation levels
REST is an essential protein for development as knockout mice die at embryonic day 11.5 (Chen et al. 1998). However, knockout ES cells (RESTko) are viable and show no defects in pluripotency (Jorgensen et al. 2009; Yamada et al. 2010), enabling us to test if they are competent to undergo neuronal differentiation in our in vitro system. Here, RESTko cells formed morphologically normal neurons with high efficiency, correct marker protein expression, and limited changes in gene expression (Supplemental Figs. 6, 7), suggesting that REST is not essential for the initial steps of neuronal differentiation in vitro.
Next, we measured genome-wide H3K27me3 levels in RESTko cells at the stem cell and progenitor stages to investigate whether REST's absence affects H3K27me3 levels at its target genes. We separated all regions enriched for H3K27me3 at any of the stages into high-CpG versus low-CpG and further into REST-target and nontarget (see Methods). Next, we compared H3K27me3 levels in wild-type and RESTko cells between these four classes. This reveals little difference between REST target regions and nontarget regions at the ES stage (Table 1; Fig. 4B), in line with Epi-MARA's predicted REST activity at this stage. In contrast at the NP stage, as exemplified at two loci in Figure 4A, we observe a substantial loss of H3K27me3 in the RESTko cells relative to wild-type cells, affecting a substantial number of high-CpG REST targets (Table 1; Fig. 4B; Supplemental Fig. 8). In addition, although the changes at low-CpG regions are much weaker, a notable gain of H3K27me3 is observed at low-CpG REST targets (Fig. 4B). This experimentally confirms Epi-MARA's predictions for REST at both high- and low-CpG regions. We conclude that REST contributes functionally to local levels of H3K27me3, which is strongest at high-CpG regions in NPs. Next we tested if the observed loss of H3K27me3 is accompanied by a loss of PRC2, which mediates the H3K27me3 mark. We compared occupancy of the PRC2 component SUZ12 in RESTwt and RESTko NPs. This reveals a loss of SUZ12 at a substantial number of high-CpG REST targets (Supplemental Fig. 9A) and a loss of colocalization of SUZ12 with REST binding (Supplemental Fig. 9B). Moreover, compatible with a role for REST in Polycomb recruitment, there is a correlation between reduction in SUZ12 levels and reduction in K27me3 levels at high-CpG REST targets (Supplemental Fig. 9C).
Table 1.
Estimated percentages of REST targets that significantly lose/gain H3K27me3 in the RESTko cells, separately at low- and high-CpG regions, and separately at the ES and NP stages
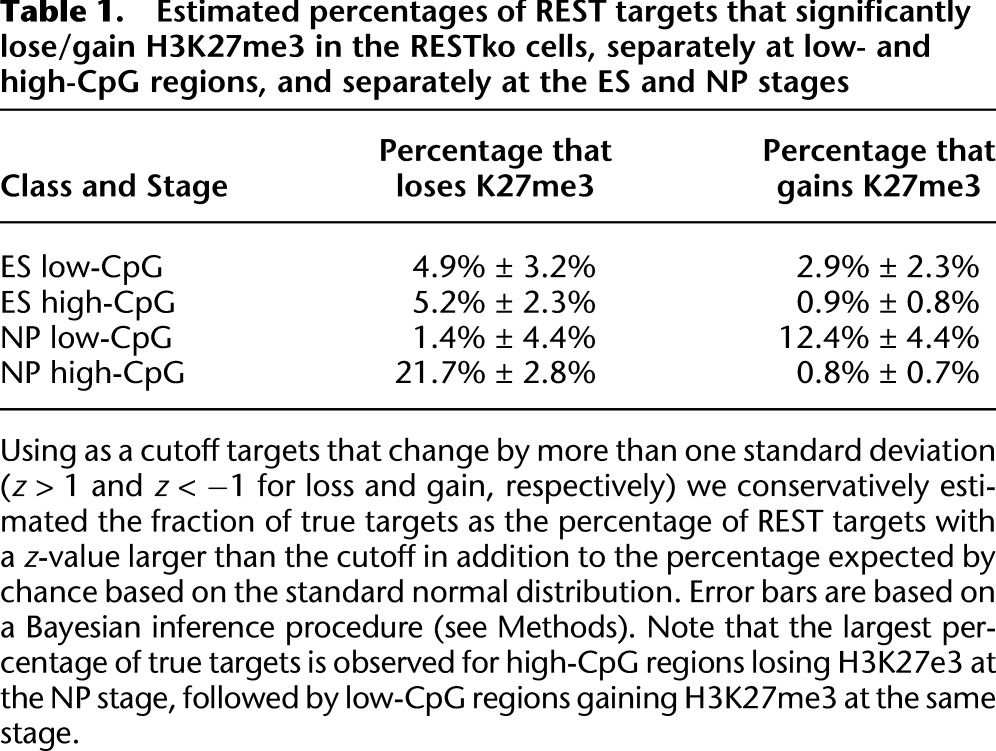
Figure 4.

REST is required for H3K27me3 dynamics in NP cells. (A) ChIP-Seq signal for H3K27me3 and REST in representative genomic regions. Shown are H3K27me3 signal in ES cells, NPs of wild-type (WT) and RESTko cells, as well as REST signal in NPs. The top panel exemplifies selective loss of H3K27me3 at the REST binding site of the Xkr7 locus, whereas neighboring regions (BC020535) remain unaffected. The lower panel shows similar loss of H3K27me3 at the Stmn2 locus. Both the Xkr7 and Stmn2 loci are examples of promoter-proximal high-CpG regions. Shown are normalized read densities. The red bars at the REST peaks indicate the regions cloned for transgenic experiments. (B) Global comparison of H3K27me3 levels between wild-type and RESTko cells. Shown are the normalized distributions (see Methods) of the ratio between H3K27me3 in wild type versus RESTko for nontarget regions (black lines) and for either low-CpG (blue lines) or high-CpG (red lines) regions that are REST targets at the ES (left panel) and NP (right panel) stage. (Insets) Estimated fractions of REST targets that significantly lose or gain H3K27me3 in the RESTko at high-CpG (red) and low-CpG regions (blue). There are few significantly changing targets at the ES stage. At the NP stage a significant fraction of high-CpG targets lose H3K27me3 and a smaller but still significant fraction of low-CpG targets gain H3K27me3 in the RESTko cells.
REST affects H3K27me3 and expression independently at many target genes
Since REST is an established repressor of gene activity, it is conceivable that loss of H3K27me3 at proximal REST targets is a direct consequence of transcriptional up-regulation. This would imply that all genes with REST-dependent loss of H3K27me3 are transcriptionally up-regulated in RESTko cells. Although, as expected from a known repressive mark, there is a positive correlation between H3K27me3 loss and gene expression, this correlation is rather weak (r = 0.28 in ES and r = 0.44 in NP, Supplemental Fig. 10A). Most importantly, one-third of the regions that lose H3K27me3 at the NP stage are not significantly transcriptionally up-regulated (Supplemental Fig. 10). We thus conclude that the crosstalk between REST and the Polycomb pathway is independent of transcriptional changes at a substantial number of REST targets.
Promoter fragments containing REST or SNAIL binding sites locally recruit methylation of H3K27
Having established that absence of REST protein leads to a decrease of H3K27me3 at high-CpG binding sites, we wanted to further ask whether fragments of high-CpG promoter regions containing a REST site can recruit H3K27me3, and whether the REST binding site contributes to this recruitment. To this end we generated reporter constructs consisting of 1.2–2-kb promoter fragments containing a REST site, and mutant versions in which the REST site had been deleted. To ensure comparable chromatin organization we placed these sequence variants in wild-type cells into the same chromosomal locus using a Cre-recombinase based targeting system (Feng et al. 1999; Lienert et al. 2011). This site-specific targeting further enables us to control for genomic environment and thus to directly compare wild-type and mutant sequences (Fig. 5A). Importantly, the chosen “test site” is positioned within a genomic region that harbors no H3K27me3 and no REST binding (Lienert et al. 2011; Stadler et al. 2011). Thus, any REST or H3K27me3 signal should primarily reflect the recruitment abilities of the inserted sequence fragments. We inserted wild-type and mutated (ΔREST) promoter fragments (Fig. 5B) of the following genes: Stmn2, Xkr7, Bdnf, and Pgbd5. After targeted insertion and differentiation into NPs we detected strong REST binding by ChIP to the wild type, but no or weak binding in the four REST mutant sequences, showing that the REST site is required for REST binding to the reporter constructs (Supplemental Fig. 11). Importantly, H3K27me3 is observed at all promoter fragments containing the REST site at the progenitor stage, whereas the mutant sequences show significant loss of H3K27me3 (Fig. 5C). In the case of the stathmin-like 2 (Stmn2) promoter, presence of the REST site results in a more than threefold increase of H3K27me3 signal. Notably, the endogenous Stmn2 promoter shows no transcriptional response in RESTko cells. Of all four tested promoter fragments the Pgbd5 fragment shows the weakest loss of H3K27me3. Notably, the corresponding loss of REST binding at this promoter is also the weakest (Supplemental Fig. 11), suggesting that a cryptic binding site may still remain at this fragment. Together with the observed changes in H3K27me3 levels at genome-wide REST targets in the RESTko cells these results firmly establish that REST binding mediates Polycomb targeting and contributes to local levels of H3K27 methylation.
Figure 5.

TFBS are required for H3K27me3 recruitment at the NP stage. (A) Strategy to insert promoter regions into a defined genetic site (beta globin locus) via RMCE. The two marker genes inserted into the beta globin locus confer resistance against hygromycin (Hy) and sensitivity against ganciclovir (Tk), respectively, and are flanked by two inverted lox sites (black triangles). Targeted insertion of a given transgene is achieved by Cre-mediated recombination and negative selection. (B) The RMCE approach was used to insert several REST target promoter fragments with either wild-type sequence (WT) or REST site mutation (ΔREST) into the beta globin locus. Correctly targeted ES cells were differentiated to the NP stage, where H3K27me3 and REST were measured at the inserted fragments. (C) For each of the four inserts H3K27me3 levels were measured in cells bearing the WT fragment (red bars) and in cells bearing the ΔREST fragment (green bars). Levels were measured at, from left to right in each panel, the inserted region, the corresponding endogenous locus, a positive control, and a negative control region. Note that different promoter regions are used as positive controls in the different panels. All inserted WT fragments show significant recruitment of H3K27me3 and loss in H3K27me3 for the ΔREST fragments. (D) Either wild-type (WT) or mutated (MUT) promoter regions containing predicted SNAIL sites were inserted via RMCE. The SNAIL sites were mutated by changing the first and last nucleotide of the motif to a Thymidine. Correctly targeted ES cells were differentiated to the NP stage. (E) For each of the three inserts H3K27me3 levels were measured in cells bearing the WT promoter (red bars) and in cells bearing promoters with mutated SNAIL sites (green bars). Note that the Cdh1, Usp43, and Esam promoter regions have three, two, and one predicted/mutated SNAIL site, respectively. Levels were measured at, from left to right in each panel, the inserted region, the corresponding endogenous locus, a positive control, and a negative control region. All H3K27me3 levels are scaled to that of the endogenous region and error bars show the standard error of three biological replicates. A P-value is shown and calculated for each insert using unpaired one-tailed t-test statistics.
Besides REST, several motifs that Epi-MARA predicted to play a role in H3K27me3 dynamics are recognized by a family of TFs. This makes loss of function approaches at the protein level very demanding. Our transgenic approach, however, can be used to assess the contribution of binding motifs to Polycomb recruitment irrespective of which TF from a family is binding. We thus extended our analysis to study the effect of the SNAIL binding site, another motif predicted to recruit H3K27me3 at the NP stage (Fig. 1). We inserted a total of six regulatory regions containing wild-type or mutated SNAIL sites (Fig. 5D) and tested for presence of H3K27 trimethylation. As seen with regulatory regions containing REST sites, we observe that all constructs containing SNAIL sites are sufficient to recruit H3K27me3. Deletion of the SNAIL sites leads to significant reduction of H3K27me3 for two of the three constructs tested (Fig. 5E). Notably, the construct that showed no significant response was the only one that contained only a single predicted SNAIL site, suggesting that the effect on H3K27me3 increases with the number of sites.
In summary, we conclude that promoter fragments containing bindings sites for SNAIL and REST TFs are sufficient to recruit H3K27me3 and, in line with the predictions, that these binding sites contribute in cis to H3K27me3 levels.
Discussion
Recent genome-wide analyses of chromatin have established unexpected dynamics of the epigenome, which reflect cellular and developmental states. The analysis of such data has predominantly focused on characterizing the different kinds of chromatin domains that exist and associating these domains with functional features such as active or inactive promoters or distal regulatory elements (Suzuki and Bird 2008; Meissner 2010; Ernst et al. 2011; Zhou et al. 2011). With the exception of chromatin modifications that are set by the process of transcription itself, such as H3K36 methylation, our understanding of how dynamic changes in chromatin are regulated remains limited. This likely reflects the complexity of the underlying targeting as different recruitment mechanisms for chromatin modifiers have been identified, including TFs, noncoding RNAs, as well as higher order nuclear organization (Schuettengruber and Cavalli 2009; Simon and Kingston 2009; Beisel and Paro 2011).
Here, we have tested the hypothesis that TFs contribute to dynamic changes in chromatin during cellular differentiation. We combined mapping of epigenetic marks at consecutive stages with computational modeling (Epi-MARA) to predict TFs involved in recruiting specific chromatin changes ab initio. We started from a data set of murine ES cells undergoing neurogenesis, in which levels of H3K27me3 were measured at three consecutive cellular states during the differentiation. Application of Epi-MARA to this data identified several TFs as potential regulators of Polycomb dynamics during differentiation. Using several lines of evidence, we experimentally validate the prediction that REST is involved in transiently recruiting H3K27me3 to promoter regions at the NP stage: (1) Genetic deletion reveals that REST is necessary in trans for increased H3K27me3 levels at REST targets at the NP stage, specifically at high-CpG target regions, which includes almost all promoter-proximal target regions. (2) Absence of REST causes loss of the PRC2 component SUZ12, mirroring the loss H3K27me3 at high-CpG regions. (3) Promoter fragments containing a REST binding site are sufficient in cis to recruit H3K27me3, whereas identical regions with mutated REST binding sites showed reduced recruitment. These findings support a model whereby local REST binding recruits Polycomb at the induction of in vitro neurogenesis.
Previous studies have already noted increased H3K27me3 signal at REST-bound promoters and enrichment of REST binding sites at CpG-islands bound by PRC2 (Ku et al. 2008; Zheng et al. 2009), while a more recent study in human cells showed that the noncoding RNA HOTAIR can bind to PRC2 and the LSD1/CoREST/REST complex in vitro (Tsai et al. 2010). However, the function of HOTAIR appears not to be conserved in mouse as its genetic deletion has no phenotypic consequences (Schorderet and Duboule 2011). During the preparation of this manuscript two studies reported biochemical interaction between REST and members of the PRC1 and PRC2 complexes (Ren and Kerppola 2011; Dietrich et al. 2012). Importantly, however, these correlative observations at single-cell states did not identify the dynamic and context-dependent role of REST on H3K27 trimethylation that we predict based on chromatin dynamics and further validate experimentally. Notably, we show that absence of REST in stem cells has only subtle effects on H3K27me3 levels at target regions, suggesting that this previously noted co-occurrence of REST and H3K27me3 in stem cells has limited functional relevance. Importantly, and as predicted by our computational model, REST has more pronounced effects for H3K27me3 levels of target regions in NPs (Fig. 4B).
While the detailed mechanisms of Polycomb targeting remain to be determined, our study suggests that, rather than a single dominant factor, it likely involves multiple TFs as we found several regulatory motifs associated with the increase of H3K27me3 at the NP stage. Of these, ZEB1 and the family of SNAIL factors bind to similar motifs and are important transcriptional repressors during epithelial-to-mesenchymal transition (Cano et al. 2000; Liu et al. 2008), which is compatible with a proposed function in Polycomb recruitment (Herranz et al. 2008). Here we experimentally confirm the role of SNAIL sites in regulating H3K27me3 levels using our transgenic approach (Fig. 5). Since SP1 sites are among the most commonly occurring regulatory sites within CpG-islands, it is difficult to interpret whether the predicted role of SP1 in H3K27me3 dynamics is specific to SP1 or more generally associated with CpG-islands, which have been suggested to recruit PRC2 (Mendenhall et al. 2010). It is noteworthy, however, that SP1-like sites are a component of Polycomb Responsive Elements (PRE) in Drosophila (Brown and Kassis 2010). In contrast, YY1, the mammalian ortholog of PHO, which is the most established TF with a function in Polycomb recruitment in Drosophila melanogaster, is unlikely to have that role in mammals (Ku et al. 2008; Mendenhall et al. 2010), at least in stem cells.
Based on recent work in Drosophila (Enderle et al. 2011) and mouse stem cells (Landeira et al. 2010; Brookes et al. 2012), it has been suggested that Polycomb might repress by stalling polymerases. Our observation that the REST, Snail, and ZEB1 binding sites tend to be positioned immediately downstream from TSS (Supplemental Fig. 12) is compatible with this model. However, this observation does not generally apply to the top nine predicted motifs (Supplemental Fig. 12). We further show that the dynamics of H3K27me3 are different for high-CpG and low-CpG regions in line with a proposed model that local CpG richness influences Polycomb recruitment (Mendenhall et al. 2010; Lynch et al. 2011). However, the precise role of CpG dinucleotides in Polycomb recruitment has not been uncovered. The different behavior of low- and high-CpG regions might be explained by different cofactors that associate with REST in a CpG-dependent manner that could affect recruitment versus inhibition of the Polycomb machinery such that different complexes with distinct activities are formed at high-CpG versus low-CpG regions. Our data suggest that this is connected to individual TF activity since REST has the strongest effect on H3K27me3 levels at high-CpG regions and a weaker opposite effect at low-CpG regions (Fig. 4B). This opposite behavior at high-CpG and low-CpG motifs does not generalize to all TFs (Supplemental Table 5).
Our results are compatible with a role for cell-type specific cofactors since the effect of REST on H3K27me3 are by far strongest at the NP stage, whereas REST binding decreases from the ES to the NP stage. Nevertheless, the needed regulatory information can be highly localized as tested promoter fragments were sufficient to recruit H3K27me3 when inserted into a defined genomic region. While it remains to be seen if these elements fulfill the definition of a PRE, i.e., whether they repress genes in cis in a Polycomb-dependent fashion, our results suggest that both REST and SNAIL sites could contribute to such function. Clearly, REST and SNAIL provide convincing examples for DNA binding motifs that enhance local Polycomb states in the mammalian genome.
Epi-MARA provides a general methodology for inferring the stage-specific activities of TFs associated with chromatin dynamics that we foresee will be useful for the study of epigenome maps particularly in light of the multitude of data sets that are being generated as part of large epigenome initiatives (Satterlee et al. 2010; Abbott 2011). The approach makes use of sophisticated comparative genomic TFBS predictions and linear modeling, which accounts for the contributions of all regulatory motifs at once. We note that there is only a partial overlap between the most significant motifs identified by Epi-MARA and those identified by finding the motifs most enriched at regions bearing a particular chromatin mark at each stage, because Epi-MARA models the relative chromatin mark across a time course and the effects of all motifs are incorporated at once (Supplemental Table 6).
The ability to predict TFs involved in regulating chromatin dynamics from epigenome data sets provides a powerful tool in this context, as predicted TFs can be immediately subjected to follow-up experiments. The identification of the context-dependent function of REST and the role of the SNAIL sites illustrate its utility. Epi-MARA is directly accessible by our web server implementation (http://ismara.unibas.ch).
Importantly, our findings have direct implications for regulatory models of chromatin regulation. In our neurogenesis system, a linear model in terms of predicted binding sites explains roughly the same fraction of variance in H3K27me3 at promoters as it explains variance in transcript levels (Supplemental Table 7). This result suggests that, like regulation of transcription, chromatin dynamics of H3K27me3 are regulated to a significant extent by local DNA sequence motifs that are recognized by trans-acting factors.
Methods
Epi-MARA
We here describe the main methods employed in the Epi-MARA analysis. Further details are supplied in the Supplemental Methods. Supplemental Figure 13 provides a guide to the reader as it gives an overview of the different steps of the analysis. Epi-MARA models the dynamics of epigenetic marks in terms of predicted TFBSs in regulatory regions genome-wide, building on the motif activity response analysis that we developed previously (FANTOM Consortium and Riken Omics Science Center 2009). Briefly, for each promoter we constructed multiple alignments using orthologous sequences from mouse, human, rhesus macaque, dog, cow, horse, and opossum, of the proximal promoter region consisting of 500 bp both upstream of and downstream from the cluster of TSSs that defines the promoter (Balwierz et al. 2009). Using databases of experimentally determined binding sites (Wingender et al. 1996; Vlieghe et al. 2006), we collected a set of 207 mammalian regulatory motifs (position specific weight matrices) representing the binding specificities of ∼350 mammalian TFs. Then, using a Bayesian probabilistic method that explicitly models the evolution of TFBSs, we predict binding sites for all regulatory motifs in all proximal promoter regions (van Nimwegen 2007). We summarize the binding site predictions by a matrix with components Npm, denoting the sum of the posterior probabilities of all binding sites for motif m in promoter p, which we also refer to as the “number” of binding sites for motif m in promoter p. The second key ingredient of Epi-MARA is the quantification of epigenetic mark levels across the time course at genomic regions of interest. For the analysis of the ChIP-chip data, which measured H3K27me3 levels at all promoters genome-wide, we quantified the H3K7me3 at a given promoter and time point by the average log-intensity of the probes that lie within the promoter. For the ChIP-seq analysis we determined H3K27me3 enriched regions (see below) and found that the majority of H3K27me3 enriched regions are between 3 and 5 kb in length. For the analysis of ChIP-seq H3K27me3 levels at promoters we quantify the occurrence of H3K27me3 by the log-fraction of ChIP-seq reads in a 4-kb region centered on the promoter. For the Epi-MARA analysis of genome-wide H3K27me3 enriched regions we use the log-fraction of ChIP-seq reads in each region. Note that, because Epi-MARA fits the changes of H3K27me3 levels across the time course, Epi-MARA results are invariant to an overall rescaling of H3K27me3 levels at each promoter. Finally, to avoid spurious fluctuations in relative H3K27me3 levels at promoters with low absolute levels, a pseudo read-count corresponding to the average read-count in the background sample is added to the read-count in each promoter region.
We denote the amount of the epigenetic mark M in promoter p at time point t by Mpt and assume the following linear model:
where cp is the basal level of the chromatin mark at promoter p, and Amt is the unknown activity of motif m at time point t. Using a Bayesian probabilistic framework, we then calculate a joint posterior probability distribution for all motif activities. To this end, we assume that the deviation between model and measured level Mpt (i.e., the “noise” term in the above formula) is Gaussian distributed at each promoter and at each time point. In addition, to avoid over-fitting, we use a Gaussian prior on the activities Amt, and we determine the variance of this prior by a cross-validation procedure. Finally, we infer both the maximal posterior activities  and their standard errors σmt. To rank motifs, we measure the importance of a motif in explaining expression variations by a score similar to a z-statistic. The z-score zm of motif m is quantified as an average squared z-value of the activity across conditions, i.e.
 |
where T is the number of time points. Note that our z-scores are meant to rank the importance of motifs and cannot be used to assess the statistical significance of motif activities. To assess statistical significance of the motif activities that we observed, we performed the following permutation test: We randomly permuted the association between binding site predictions and promoters and reran Epi-MARA 1000 times, reporting the z-scores of the inferred motif activities for all 207 motifs in each run. Since in the 1000 permutations there was only one motif in one run with a z-score >2.52, we infer that the probability of obtaining a z-score as high as z = 2.52 (the z-score of the REST motif on the ChIP-chip data) is approximately P = 5 × 10⁻⁶.
To run Epi-MARA on all H3K27me3 enriched regions genome-wide, we predicted TFBSs across the entire 4-kb sequence of each H3K27me3 region using the same procedure as used for predicting sites in proximal promoters. For each H3K27me3 region we then determined the 1-kb window that contains the highest number of predicted binding sites (pooling all motifs) and we used the predicted sites within this 1-kb region for the entries in the site-count matrix Npm for the corresponding H3K27me3 region. To infer motif activities separately for high- and low-CpG regions we treat, for each motif m, sites within low-CpG regions and sites within high-CpG regions as if they derived from two separate motifs, effectively doubling the number of motifs for which we infer activities.
Cell culture
Wild-type mouse ES cells were derived from blastocysts (3.5 PC) of mixed 129-C57Bl/6 background and cultivated on feeder cells (37°C, 7% CO2). REST knockout and corresponding wild-type cells were obtained from Helle Jørgensen (Chen et al. 1998; Jorgensen et al. 2009). Differentiation of cells was performed as described previously (Bibel et al. 2007; Mohn et al. 2008).
Western blot analysis
For detection of REST protein levels during differentiation the total cell lysates of wild-type and REST knockout cells were used for Western blot analysis. The membrane was probed with mouse anti-REST (12C11, gift from David Anderson) and rat anti-tubulin (tissue culture supernatant, cell line YL1/2, ECACC) in combination with appropriate secondary antibodies coupled to HRP.
Immunocytochemistry
Cells were fixed with 2% paraformaldehyde, either 3 h or 10 d after plating, and probed with mouse anti-PAX6 (chick PAX6 aa 1–223, DSHB), rabbit anti-NESTIN (Sigma N5413), and mouse anti-TUJ1 (MMS-435P, Covance). Proteins were detected by an appropriate secondary antibody conjugated to Alexa Flour.
Chromatin-IP
Cells were cross-linked in medium containing 1% formaldehyde for 10 min at room temperature. ChIP was carried out as previously described (Koch et al. 2007; Weber et al. 2007) with slight modifications. Antibodies used were α-H3K27me3 (Millipore, #07-449), α-SUZ12 (Cell Signaling Technology, #3737S), and α-REST (Santa Cruz, #H-290). Chromatin was sonicated for 15 (stem cells) or 18 cycles (NPs) of 30 sec using a Diagenode Bioruptor. Precipitated DNA was either analyzed by quantitative real time PCR or subjected to next-generation sequencing.
Quantitative real time PCR
Real time PCR was performed using SYBR green chemistry (ABI). One-fortieth of ChIP sample or 40 ng of input chromatin were used per PCR reaction. Primer sequences are available upon request. All data are shown with standard error from three biological replicates. Significances were calculated using unpaired one-tailed student's t-test statistics.
Next-generation sequencing
Five to 10 ng of precipitated DNA was prepared for Solexa Sequencing as described (Mikkelsen et al. 2007). Briefly, ChIP DNA was ligated to adapters and ligation products of ∼250 bp were gel-purified on 1.5% agarose to remove unligated adaptors. DNA was amplified by 18 PCR cycles. DNA sequencing was carried out using the Illumina/Solexa Genome Analyzer II (GA2) sequencing system.
Genomic coordinates
The July 2007 Mus musculus genome assembly (NCBI37/mm9) provided by NCBI (http://www.ncbi.nlm.nih.gov/genome/guide/mouse/) and the Mouse Genome Sequencing Consortium (http://www.sanger.ac.uk/Projects/M_musculus/) was used as a basis for all analyses. Annotation of known RefSeq transcripts was obtained from UCSC (http://hgdownload.cse.ucsc.edu/goldenPath/mm9/database/refGene.txt.gz).
Read filtering, alignment, and weighting
Low-complexity reads were filtered out based on their dinucleotide entropy as follows: For each read, the dinucleotide entropy was calculated according to the formula H = −∑i fi log(fi), where fi is the frequency of dinucleotide i in the read and the sum is over all dinucleotides (i from 1 to 16). The read was filtered out if its H was less than half the dinucleotide entropy of the genome, typically removing <0.5% of the reads in a given sample. Alignments to the mouse genome were performed by the software bowtie (version 0.9.9.1) (Langmead et al. 2009) with parameters -v 2 -a -m 100, tracking up to 100 best alignment positions per query and allowing at most two mismatches. Each alignment was weighted by the inverse of the number of hits. All quantifications were based on weighted alignments. For generation of wiggle files samples were normalized for library size first and files were generated with a window size of 100 bp.
Analysis of sequencing data
In order to detect REST peaks from the ChIP-seq data we slide a window of 1000 bp in length along the genome and calculate, for each window, the fraction fIP of all ChIP-seq reads from the REST IP and the fraction fbg of all reads from a background sample (input DNA) that map to the window (since background counts are generally smaller, we use a window of 2000 bp centered at the same position to obtain more robust background frequencies). Inspecting the reverse-cumulative distribution of background counts across the genome, we observed that a small subset of windows showed aberrantly high background frequencies fbg (Supplemental Fig. 14B) and these windows were removed from further consideration (these windows typically correspond to regions with repeats that presumably occur more frequently in the genome of the cells from which our DNA was taken than in the mm9 genome assembly). We assume that the noise in the estimated fIP and fbg follows Poisson distributions and calculate, for each window, a z-statistic:  , where NIP and Nbg are the total numbers of reads in the IP and background sample, respectively. Inspecting the reverse-cumulative distribution of z-statistics across the genome, we observe a long tail of highly enriched regions to the right of z = 3.1 (Supplemental Fig. 14A) and we denote all regions with consecutive windows with z-values >3.1 as REST binding regions. To determine the false discovery rate of binding region prediction at this cutoff we made use of the fact that we measured the background distribution in duplicate and performed binding region prediction in the exact same way, treating one of the background samples as a “foreground” sample. From this we find that, by chance, a fraction 1.2 × 10⁻⁴ windows genome-wide have a z-value >3.1, leading to a total of 289 falsely discovered binding regions genome-wide, which should be compared with the 1624 REST binding regions determined from the REST IP sample. Any REST binding region whose center is <2 kb from a known TSS (from the RefSeq collection of transcripts) is considered proximal. All other REST binding regions are considered distal.
To predict REST binding sites for all REST binding regions we again produced multiple alignments of orthologous regions from mouse, human, rhesus macaque, dog, cow, horse, and opossum, and ran the MotEvo algorithm (van Nimwegen 2007) on each multiple alignment. We also searched for noncanonical sites of arbitrary spacing between the two half-sites of the REST motif. In contrast to previous work (Johnson et al. 2007) which found only noncanonical sites with a spacer of 6 bp, we find noncanonical sites with spacers of both 6 and 7 bp. Linear regression between the total number of predicted REST binding sites (i.e., the sum of posteriors of all predicted sites) at each REST binding region and the binding z-statistic of the region shows a correlation of r = 0.48 (P-value 2.9 × 10−53). We compared our predicted REST binding regions with those of Johnson et al. (2008) by collecting all regions they report and, for each region, calculating a REST fold-change enrichment of ChIP-seq reads. We then calculated the overlap of the predicted binding regions for a fold-change enrichment of 2 (Supplemental Fig. 4).
To obtain positional profiles with respect to TSS for the predicted binding sites of REST and other regulatory motifs, we summed the posteriors of all predicted binding sites at promoters at each position relative to TSS. To obtain positional profiles for the REST binding data and H3K27me3 signals we simply summed all reads from the corresponding IP samples at each position relative to TSS. To obtain positional profiles of H3K27me3 and SUZ12 relative to REST sites we selected all genomic regions that were enriched for H3K27me3 and overlapped a REST binding peak. For each of these we located the position of the highest scoring predicted REST binding site within the peak and then calculated the relative frequencies of reads, separately for SUZ12 and H3K27me3, in the 3 kb of sequence upstream of and downstream from the REST site's position. We finally averaged these relative frequency profiles over all REST peaks within H3K27me3 enriched regions.
To perform Epi-MARA analysis with the REST binding data replacing REST binding site predictions we replace the predicted binding site counts NpREST with results of the REST binding assay at each promoter p. Since the z-statistics of REST binding at promoters have a very different distribution of values from those of the site counts Npm, it is necessary to normalize the matrix Npm such that binding site predictions and binding data can be quantitatively combined. We therefore replaced the matrix Npm with a binary matrix Bpm in which Bpm = 1 whenever Npm > 0.2 and Bpm = 0 otherwise. Finally, we replaced the column BpREST with one based on the REST binding data, i.e., where BpREST = 1 whenever there was a REST binding peak within 2 kb of the corresponding promoter, and zero otherwise.
For the analysis of the H3K27me3 data (NCBI Gene Expression Omnibus [GEO] [http://www.ncbi.nlm.nih.gov/geo/] accession number GSE25533) we slide a 2-kb window along the genome and calculate a z-statistic for each window quantifying the enrichment of the signal in the IP over the background sample by a z-statistic as above, pooling the data from the replicates and from the different stages. As for the REST binding data, we observe a long tail of high z-values which occurs for the H3K27me3 data to the right of z = 4.0 (Supplemental Fig. 14C) and we defined H3K27me3 enriched regions as consecutive windows that all have a z-statistic >4.0. Using again the two background samples (Supplemental Fig. 14D) to determine a false discovery rate we find that, by chance, a fraction of 2.8 × 10⁻⁴ of windows have a z-value >4.0, leading to 427 false predicted H3K27me3 regions genome-wide, which should be compared with the 18,293 regions predicted from the H3K27me3 IP samples. The H3K27me3 enriched regions are divided into different classes using a number of criteria. Regions that overlapped a proximal promoter, i.e., a promoter ±500 bp, were considered proximal and all others were considered distal. Similarly, regions that overlap a REST binding peak were considered REST targets and all others nontargets. For each region enriched in H3K27me3 we slide a 1-kb window over the region and calculated the CpG dinucleotide frequency within each window. We defined the CpG content of a region as the highest CpG frequency of a 1-kb window within it. Inspection of the distribution of log-CpG content across H3K27me3 enriched regions shows two classes, and we fitted the distribution of log-CpG content by a mixture of two Gaussians (Fig. 3A). After fitting of the Gaussian mixture, posterior probabilities for each region to belong to the high-CpG or low-CpG class were calculated in the standard Bayesian way. In subsequent analyses, distributions for low-CpG and high-CpG regions were obtained by weighing each region with the posterior probability that it belongs to the corresponding class.
For each region that was enriched for H3K27me3 at any of the stages, we calculated log-fold changes between ES and NP and between NP and TN stages by calculating the log-ratios of the fractions of reads from the corresponding IP samples mapping to each of the regions.
To compare H3K27me3 levels between wild-type (WT) and RESTko mutant (KO) cells we collected all regions that were enriched for H3K27me3 in the wild-type cells at any of the stages. For each region we calculated the fractions fWT and fKO of all IP reads that mapped to that region in WT and KO and calculated both the absolute intensity  (summed over all replicates) as well as the log-ratio:
  (averaged over the replicates). Supplemental Figure 15 shows, as a function of absolute intensity X, the average and standard error of Y for all regions that are non-REST targets (black dots with error bars) for both high-CpG and low-CpG regions at both the ES and NP stages. As these figures make clear, there are some systematic differences in the overall distribution of H3K27me3 signals between wild-type and the RESTko cells. Therefore, in order to properly compare H3K27me3 signals between wild type and RESTko, we adopted a normalization procedure similar to LOESS normalization. For each stage, we sorted all nontarget regions by their absolute intensity X (averaging wild-type and RESTko intensities). For each region we then collected the 50 regions with values of X immediately below, and the 50 regions with values of X immediately above, and calculated the mean μ and standard deviation σ. In this way we estimated the expected mean μ and standard deviation σ of nontargets, as a function of their absolute H3K27me3 levels. For each REST target we determined both its fold-change Y and absolute H3K27me3 level X and calculated a z-value = (Y − μ)/σ using the expected mean and standard deviation of nontargets with absolute levels of H3K27me3 of X. To suppress fluctuations we averaged the z-statistics with a Gaussian kernel. Note that, per definition, the z-values of nontarget regions follow a Gaussian distribution of mean zero and standard deviation one. To estimate the fraction ρ of REST targets that significantly change H3K27me3 we compared the fraction of REST targets that show z-values more than one standard deviation away from the mean (i.e., z > 1 when considering targets losing H3K27me3 and z < −1 when considering targets gaining H3K27me3) with the fraction expected by chance using a Bayesian procedure. Let q denote the probability to obtain a z-value >1 by chance according to the standard Gaussian. Conservatively assuming that all true targets must have a z-value >1, the probability for a randomly chosen target to have a z-value >1 is P = ρ + (1 − ρ)q. Given that there are N REST targets in total, of which n have a z-value >1 we use Bayes' theorem to calculate a posterior probability distribution over ρ and estimate its mean and standard deviation. We similarly estimate the fraction of targets that significantly gain H3K27me3, separately for each stage, and separately for high- and low-CpG target regions. To compare SUZ12 levels in wild-type and RESTko NPs we first, for each H3K27me3 enriched region, determined the 1-kb region that had the highest overall read-count from the SUZ12 ChIP-seqs. We then determined wild-type and knockout SUZ12 levels from these 1-kb regions. The z-statistics for the change in SUZ12 levels were then calculated in the exact same way, i.e., comparing the log fold-change in SUZ12 of each REST target with those of the 100 nontarget regions with the nearest absolute level in SUZ12 from the same CpG class.
RNA preparation and expression analysis
Total RNA was prepared using TRIzol (Invitrogen). mRNA expression data were generated using Mouse Gene 1.0 ST and Mouse Genome 430 2.0 arrays. Microarrays were RMA-normalized using R/Bioconductor (Gentleman et al. 2004) and the oligo package version 1.14.0 (Carvalho and Irizarry 2010). To determine transcriptional regulation of REST target genes in the RESTko we selected a twofold change as cutoff for significant up-regulation.
Recombinase mediated cassette exchange (RMCE)
One- to two-kilobase promoter fragments of REST targets and predicted SNAIL targets were cloned and stably integrated into stem cells via RMCE as described (Feng et al. 1999; Lienert et al. 2011). ΔREST binding site mutants were generated by removing 15–20 bp of the REST consensus sequence. SNAIL mutant sites were created by changing the first and last nucleotide of the site to a T nucleotide. Primer sequences are available upon request.
Data access
All generated data sets are available for download at the NCBI Gene Expression Omnibus (GEO) (http://www.ncbi.nlm.nih.gov/geo/) under accession numbers GSE27148 and GSE27114.
Acknowledgments
We thank Robert Ivanek, Lukas Burger, and Nacho Molina for advice; Nicolas Thomä, Susan Gasser, and members of the Schübeler and van Nimwegen labs for comments on the manuscript; and the Laboratory for Quantitative Genomics of the ETH Zürich in Basel for next-generation sequencing. We also thank David Anderson for providing one of the used REST antibodies. Research in the laboratory of D.S. is supported by the Novartis Research Foundation, by the European Union (NoE “EpiGeneSys” FP7-HEALTH-2010-257082, LSHG-CT-2006-037415), the European Research Council (ERC-204264), the Swiss National Science Foundation (Sinergia program), and the EMBO Young Investigator program. E.v.N. acknowledges support by the Swiss National Science Foundation and the Swiss Institute of Bioinformatics. D.S. and E.v.N. are both supported by the Swiss Systems Biology Initiative SystemsX.ch within the network “Cellplasticity.”
Author contributions: P.A., M.P., P.J.B., and E.v.N. designed and carried out the motif activity response analysis. Experiments were designed and conducted by A.S. and D.S.. H.J. contributed reagents. ChIP-seq data analysis was performed by P.A., A.S., M.B.S., and E.v.N. Bioinformatic and statistical analyses were conducted by P.A., P.J.B., M.P., and E.v.N. The manuscript was prepared by P.A., A.S., E.v.N., and D.S.
Footnotes
[Supplemental material is available for this article.]
Article published online before print. Article, supplemental material, and publication date are at http://www.genome.org/cgi/doi/10.1101/gr.142661.112.
Freely available online through the Genome Research Open Access option.
References
- Abbott A 2011. Europe to map the human epigenome. Nature 477: 518 doi: 10.1038/477518a [DOI] [PubMed] [Google Scholar]
- Arnold P, Erb I, Pachkov M, Molina N, van Nimwegen E 2012. MotEvo: Integrated Bayesian probabilistic methods for inferring regulatory sites and motifs on multiple alignments of DNA sequences. Bioinformatics 28: 487–494 [DOI] [PubMed] [Google Scholar]
- Balwierz PJ, Carninci P, Daub CO, Kawai J, Hayashizaki Y, Van Belle W, Beisel C, van Nimwegen E 2009. Methods for analyzing deep sequencing expression data: Constructing the human and mouse promoterome with deepCAGE data. Genome Biol 10: R79 doi: 10.1186/gb-2009-10-7-r79 [DOI] [PMC free article] [PubMed] [Google Scholar]
- Barrera LO, Ren B 2006. The transcriptional regulatory code of eukaryotic cells—insights from genome-wide analysis of chromatin organization and transcription factor binding. Curr Opin Cell Biol 18: 291–298 [DOI] [PubMed] [Google Scholar]
- Beer MA, Tavazoie S 2004. Predicting gene expression from sequence. Cell 117: 185–198 [DOI] [PubMed] [Google Scholar]
- Beisel C, Paro R 2011. Silencing chromatin: Comparing modes and mechanisms. Nat Rev Genet 12: 123–135 [DOI] [PubMed] [Google Scholar]
- Bibel M, Richter J, Schrenk K, Tucker KL, Staiger V, Korte M, Goetz M, Barde YA 2004. Differentiation of mouse embryonic stem cells into a defined neuronal lineage. Nat Neurosci 7: 1003–1009 [DOI] [PubMed] [Google Scholar]
- Bibel M, Richter J, Lacroix E, Barde YA 2007. Generation of a defined and uniform population of CNS progenitors and neurons from mouse embryonic stem cells. Nat Protoc 2: 1034–1043 [DOI] [PubMed] [Google Scholar]
- Bird AP 1986. CpG-rich islands and the function of DNA methylation. Nature 321: 209–213 [DOI] [PubMed] [Google Scholar]
- Bouwman P, Philipsen S 2002. Regulation of the activity of Sp1-related transcription factors. Mol Cell Endocrinol 195: 27–38 [DOI] [PubMed] [Google Scholar]
- Boyer LA, Plath K, Zeitlinger J, Brambrink T, Medeiros LA, Lee TI, Levine SS, Wernig M, Tajonar A, Ray MK, et al. 2006. Polycomb complexes repress developmental regulators in murine embryonic stem cells. Nature 441: 349–353 [DOI] [PubMed] [Google Scholar]
- Bracken AP, Dietrich N, Pasini D, Hansen KH, Helin K 2006. Genome-wide mapping of Polycomb target genes unravels their roles in cell fate transitions. Genes Dev 20: 1123–1136 [DOI] [PMC free article] [PubMed] [Google Scholar]
- Brookes E, de Santiago I, Hebenstreit D, Morris KJ, Carroll T, Xie SQ, Stock JK, Heidemann M, Eick D, Nozaki N, et al. 2012. Polycomb associates genome-wide with a specific RNA Polymerase II variant, and regulates metabolic genes in ESCs. Cell Stem Cell 10: 157–170 [DOI] [PMC free article] [PubMed] [Google Scholar]
- Brown JL, Kassis JA 2010. Spps, a Drosophila Sp1/KLF family member, binds to PREs and is required for PRE activity late in development. Development 137: 2597–2602 [DOI] [PMC free article] [PubMed] [Google Scholar]
- Cano A, Perez-Moreno MA, Rodrigo I, Locascio A, Blanco MJ, del Barrio MG, Portillo F, Nieto MA 2000. The transcription factor snail controls epithelial-mesenchymal transitions by repressing E-cadherin expression. Nat Cell Biol 2: 76–83 [DOI] [PubMed] [Google Scholar]
- Carninci P, Sandelin A, Lenhard B, Katayama S, Shimokawa K, Ponjavic J, Semple CA, Taylor MS, Engstrom PG, Frith MC, et al. 2006. Genome-wide analysis of mammalian promoter architecture and evolution. Nat Genet 38: 626–635 [DOI] [PubMed] [Google Scholar]
- Carvalho BS, Irizarry RA 2010. A framework for oligonucleotide microarray preprocessing. Bioinformatics 26: 2363–2367 [DOI] [PMC free article] [PubMed] [Google Scholar]
- Chan HM, La Thangue NB 2001. p300/CBP proteins: HATs for transcriptional bridges and scaffolds. J Cell Sci 114: 2363–2373 [DOI] [PubMed] [Google Scholar]
- Chen ZF, Paquette AJ, Anderson DJ 1998. NRSF/REST is required in vivo for repression of multiple neuronal target genes during embryogenesis. Nat Genet 20: 136–142 [DOI] [PubMed] [Google Scholar]
- Czermin B, Melfi R, McCabe D, Seitz V, Imhof A, Pirrotta V 2002. Drosophila enhancer of Zeste/ESC complexes have a histone H3 methyltransferase activity that marks chromosomal Polycomb sites. Cell 111: 185–196 [DOI] [PubMed] [Google Scholar]
- Das D, Nahle Z, Zhang MQ 2006. Adaptively inferring human transcriptional subnetworks. Mol Syst Biol 2 doi: 10.1038/msb4100067 [DOI] [PMC free article] [PubMed] [Google Scholar]
- de Hoon M, Hayashizaki Y 2008. Deep cap analysis gene expression (CAGE): Genome-wide identification of promoters, quantification of their expression, and network inference. Biotechniques 44: 627–628, 630, 632 [DOI] [PubMed] [Google Scholar]
- Dietrich N, Lerdrup M, Landt E, Agrawal-Singh S, Bak M, Tommerup N, Rappsilber J, Sodersten E, Hansen K 2012. REST-mediated recruitment of polycomb repressor complexes in mammalian cells. PLoS Genet 8: e1002494 doi: 10.1371/journal.pgen.1002494 [DOI] [PMC free article] [PubMed] [Google Scholar]
- Enderle D, Beisel C, Stadler MB, Gerstung M, Athri P, Paro R 2011. Polycomb preferentially targets stalled promoters of coding and non-coding transcripts. Genome Res 21: 216–226 [DOI] [PMC free article] [PubMed] [Google Scholar]
- Ernst J, Kheradpour P, Mikkelsen TS, Shoresh N, Ward LD, Epstein CB, Zhang X, Wang L, Issner R, Coyne M, et al. 2011. Mapping and analysis of chromatin state dynamics in nine human cell types. Nature 473: 43–49 [DOI] [PMC free article] [PubMed] [Google Scholar]
- FANTOM Consortium and Riken Omics Science Center. 2009. The transcriptional network that controls growth arrest and differentiation in a human myeloid leukemia cell line. Nat Genet 41: 553–562 [DOI] [PMC free article] [PubMed] [Google Scholar]
- Feng YQ, Seibler J, Alami R, Eisen A, Westerman KA, Leboulch P, Fiering S, Bouhassira EE 1999. Site-specific chromosomal integration in mammalian cells: Highly efficient CRE recombinase-mediated cassette exchange. J Mol Biol 292: 779–785 [DOI] [PubMed] [Google Scholar]
- Gao F, Foat BC, Bussemaker HJ 2004. Defining transcriptional networks through integrative modeling of mRNA expression and transcription factor binding data. BMC Bioinformatics 5: 31 doi: 10.1186/1471-2105-5-31 [DOI] [PMC free article] [PubMed] [Google Scholar]
- Gentleman RC, Carey VJ, Bates DM, Bolstad B, Dettling M, Dudoit S, Ellis B, Gautier L, Ge Y, Gentry J, et al. 2004. Bioconductor: Open software development for computational biology and bioinformatics. Genome Biol 5: R80 doi: 10.1186/gb-2004-5-10-r80 [DOI] [PMC free article] [PubMed] [Google Scholar]
- Harbers M, Carninci P 2005. Tag-based approaches for transcriptome research and genome annotation. Nat Methods 2: 495–502 [DOI] [PubMed] [Google Scholar]
- Herranz N, Pasini D, Diaz VM, Franci C, Gutierrez A, Dave N, Escriva M, Hernandez-Munoz I, Di Croce L, Helin K, et al. 2008. Polycomb complex 2 is required for E-cadherin repression by the Snail1 transcription factor. Mol Cell Biol 28: 4772–4781 [DOI] [PMC free article] [PubMed] [Google Scholar]
- Johnson DS, Mortazavi A, Myers RM, Wold B 2007. Genome-wide mapping of in vivo protein-DNA interactions. Science 316: 1497–1502 [DOI] [PubMed] [Google Scholar]
- Johnson R, Teh CH, Kunarso G, Wong KY, Srinivasan G, Cooper ML, Volta M, Chan SS, Lipovich L, Pollard SM, et al. 2008. REST regulates distinct transcriptional networks in embryonic and neural stem cells. PLoS Biol 6: e256 doi: 10.1371/journal.pbio.0060256 [DOI] [PMC free article] [PubMed] [Google Scholar]
- Jorgensen HF, Chen ZF, Merkenschlager M, Fisher AG 2009. Is REST required for ESC pluripotency?. Nature 457: E4–E5 discussion E7 [DOI] [PubMed] [Google Scholar]
- Koch CM, Andrews RM, Flicek P, Dillon SC, Karaoz U, Clelland GK, Wilcox S, Beare DM, Fowler JC, Couttet P, et al. 2007. The landscape of histone modifications across 1% of the human genome in five human cell lines. Genome Res 17: 691–707 [DOI] [PMC free article] [PubMed] [Google Scholar]
- Kouzarides T 2007. Chromatin modifications and their function. Cell 128: 693–705 [DOI] [PubMed] [Google Scholar]
- Ku M, Koche RP, Rheinbay E, Mendenhall EM, Endoh M, Mikkelsen TS, Presser A, Nusbaum C, Xie X, Chi AS, et al. 2008. Genomewide analysis of PRC1 and PRC2 occupancy identifies two classes of bivalent domains. PLoS Genet 4: e1000242 doi: 10.1371/journal.pgen.1000242 [DOI] [PMC free article] [PubMed] [Google Scholar]
- Landeira D, Sauer S, Poot R, Dvorkina M, Mazzarella L, Jorgensen HF, Pereira CF, Leleu M, Piccolo FM, Spivakov M, et al. 2010. Jarid2 is a PRC2 component in embryonic stem cells required for multi-lineage differentiation and recruitment of PRC1 and RNA Polymerase II to developmental regulators. Nat Cell Biol 12: 618–624 [DOI] [PMC free article] [PubMed] [Google Scholar]
- Langmead B, Trapnell C, Pop M, Salzberg SL 2009. Ultrafast and memory-efficient alignment of short DNA sequences to the human genome. Genome Biol 10: R25 doi: 10.1186/gb-2009-10-3-r25 [DOI] [PMC free article] [PubMed] [Google Scholar]
- Lee MG, Wynder C, Cooch N, Shiekhattar R 2005. An essential role for CoREST in nucleosomal histone 3 lysine 4 demethylation. Nature 437: 432–435 [DOI] [PubMed] [Google Scholar]
- Lienert F, Wirbelauer C, Som I, Dean A, Mohn F, Schübeler D 2011. Identification of genetic elements that autonomously determine DNA methylation states. Nat Genet 43: 1091–1097 [DOI] [PubMed] [Google Scholar]
- Liu Y, El-Naggar S, Darling DS, Higashi Y, Dean DC 2008. Zeb1 links epithelial-mesenchymal transition and cellular senescence. Development 135: 579–588 [DOI] [PMC free article] [PubMed] [Google Scholar]
- Liu Y, Shao Z, Yuan GC 2010. Prediction of Polycomb target genes in mouse embryonic stem cells. Genomics 96: 17–26 [DOI] [PubMed] [Google Scholar]
- Lynch MD, Smith AJ, De Gobbi M, Flenley M, Hughes JR, Vernimmen D, Ayyub H, Sharpe JA, Sloane-Stanley JA, Sutherland L, et al. 2011. An interspecies analysis reveals a key role for unmethylated CpG dinucleotides in vertebrate Polycomb complex recruitment. EMBO J 31: 317–329 [DOI] [PMC free article] [PubMed] [Google Scholar]
- Margueron R, Reinberg D 2011. The Polycomb complex PRC2 and its mark in life. Nature 469: 343–349 [DOI] [PMC free article] [PubMed] [Google Scholar]
- Meissner A 2010. Epigenetic modifications in pluripotent and differentiated cells. Nat Biotechnol 28: 1079–1088 [DOI] [PubMed] [Google Scholar]
- Meissner A, Mikkelsen TS, Gu H, Wernig M, Hanna J, Sivachenko A, Zhang X, Bernstein BE, Nusbaum C, Jaffe DB, et al. 2008. Genome-scale DNA methylation maps of pluripotent and differentiated cells. Nature 454: 766–770 [DOI] [PMC free article] [PubMed] [Google Scholar]
- Mendenhall EM, Koche RP, Truong T, Zhou VW, Issac B, Chi AS, Ku M, Bernstein BE 2010. GC-rich sequence elements recruit PRC2 in mammalian ES cells. PLoS Genet 6: e1001244 doi: 10.1371/journal.pgen.1001244 [DOI] [PMC free article] [PubMed] [Google Scholar]
- Mikkelsen TS, Ku M, Jaffe DB, Issac B, Lieberman E, Giannoukos G, Alvarez P, Brockman W, Kim TK, Koche RP, et al. 2007. Genome-wide maps of chromatin state in pluripotent and lineage-committed cells. Nature 448: 553–560 [DOI] [PMC free article] [PubMed] [Google Scholar]
- Mohn F, Weber M, Rebhan M, Roloff TC, Richter J, Stadler MB, Bibel M, Schübeler D 2008. Lineage-specific polycomb targets and de novo DNA methylation define restriction and potential of neuronal progenitors. Mol Cell 30: 755–766 [DOI] [PubMed] [Google Scholar]
- Muller J, Hart CM, Francis NJ, Vargas ML, Sengupta A, Wild B, Miller EL, O'Connor MB, Kingston RE, Simon JA 2002. Histone methyltransferase activity of a Drosophila Polycomb group repressor complex. Cell 111: 197–208 [DOI] [PubMed] [Google Scholar]
- Nieto MA 2002. The snail superfamily of zinc-finger transcription factors. Nat Rev Mol Cell Biol 3: 155–166 [DOI] [PubMed] [Google Scholar]
- O'Carroll D, Erhardt S, Pagani M, Barton SC, Surani MA, Jenuwein T 2001. The polycomb-group gene Ezh2 is required for early mouse development. Mol Cell Biol 21: 4330–4336 [DOI] [PMC free article] [PubMed] [Google Scholar]
- Pasini D, Cloos PA, Walfridsson J, Olsson L, Bukowski JP, Johansen JV, Bak M, Tommerup N, Rappsilber J, Helin K 2010. JARID2 regulates binding of the Polycomb repressive complex 2 to target genes in ES cells. Nature 464: 306–310 [DOI] [PubMed] [Google Scholar]
- Pereira CF, Piccolo FM, Tsubouchi T, Sauer S, Ryan NK, Bruno L, Landeira D, Santos J, Banito A, Gil J, et al. 2010. ESCs require PRC2 to direct the successful reprogramming of differentiated cells toward pluripotency. Cell Stem Cell 6: 547–556 [DOI] [PubMed] [Google Scholar]
- Plachta N, Bibel M, Tucker KL, Barde YA 2004. Developmental potential of defined neural progenitors derived from mouse embryonic stem cells. Development 131: 5449–5456 [DOI] [PubMed] [Google Scholar]
- Postigo AA, Dean DC 2000. Differential expression and function of members of the zfh-1 family of zinc finger/homeodomain repressors. Proc Natl Acad Sci 97: 6391–6396 [DOI] [PMC free article] [PubMed] [Google Scholar]
- Ren X, Kerppola TK 2011. REST interacts with Cbx proteins and regulates polycomb repressive complex 1 occupancy at RE1 elements. Mol Cell Biol 31: 2100–2110 [DOI] [PMC free article] [PubMed] [Google Scholar]
- Ringrose L, Paro R 2007. Polycomb/Trithorax response elements and epigenetic memory of cell identity. Development 134: 223–232 [DOI] [PubMed] [Google Scholar]
- Satterlee JS, Schübeler D, Ng HH 2010. Tackling the epigenome: Challenges and opportunities for collaboration. Nat Biotechnol 28: 1039–1044 [DOI] [PubMed] [Google Scholar]
- Schoenherr CJ, Anderson DJ 1995. The neuron-restrictive silencer factor (NRSF): A coordinate repressor of multiple neuron-specific genes. Science 267: 1360–1363 [DOI] [PubMed] [Google Scholar]
- Schorderet P, Duboule D 2011. Structural and functional differences in the long non-coding RNA hotair in mouse and human. PLoS Genet 7: e1002071 doi: 10.1371/journal.pgen.1002071 [DOI] [PMC free article] [PubMed] [Google Scholar]
- Schuettengruber B, Cavalli G 2009. Recruitment of polycomb group complexes and their role in the dynamic regulation of cell fate choice. Development 136: 3531–3542 [DOI] [PubMed] [Google Scholar]
- Schwartz YB, Pirrotta V 2008. Polycomb complexes and epigenetic states. Curr Opin Cell Biol 20: 266–273 [DOI] [PubMed] [Google Scholar]
- Simon JA, Kingston RE 2009. Mechanisms of polycomb gene silencing: Knowns and unknowns. Nat Rev Mol Cell Biol 10: 697–708 [DOI] [PubMed] [Google Scholar]
- Stadler MB, Murr R, Burger L, Ivanek R, Lienert F, Scholer A, Wirbelauer C, Oakeley EJ, Gaidatzis D, Tiwari VK, et al. 2011. DNA-binding factors shape the mouse methylome at distal regulatory regions. Nature 480: 490–495 [DOI] [PubMed] [Google Scholar]
- Sun YM, Greenway DJ, Johnson R, Street M, Belyaev ND, Deuchars J, Bee T, Wilde S, Buckley NJ 2005. Distinct profiles of REST interactions with its target genes at different stages of neuronal development. Mol Biol Cell 16: 5630–5638 [DOI] [PMC free article] [PubMed] [Google Scholar]
- Suzuki MM, Bird A 2008. DNA methylation landscapes: Provocative insights from epigenomics. Nat Rev Genet 9: 465–476 [DOI] [PubMed] [Google Scholar]
- Tao Y, Kassatly RF, Cress WD, Horowitz JM 1997. Subunit composition determines E2F DNA-binding site specificity. Mol Cell Biol 17: 6994–7007 [DOI] [PMC free article] [PubMed] [Google Scholar]
- Tsai MC, Manor O, Wan Y, Mosammaparast N, Wang JK, Lan F, Shi Y, Segal E, Chang HY 2010. Long noncoding RNA as modular scaffold of histone modification complexes. Science 329: 689–693 [DOI] [PMC free article] [PubMed] [Google Scholar]
- van Nimwegen E 2007. Finding regulatory elements and regulatory motifs: A general probabilistic framework. BMC Bioinformatics (Suppl 6) 8: S4 doi: 10.1186/1471-2105-8-S6-S4 [DOI] [PMC free article] [PubMed] [Google Scholar]
- Vaquerizas JM, Kummerfeld SK, Teichmann SA, Luscombe NM 2009. A census of human transcription factors: Function, expression and evolution. Nat Rev Genet 10: 252–263 [DOI] [PubMed] [Google Scholar]
- Vlieghe D, Sandelin A, De Bleser PJ, Vleminckx K, Wasserman WW, van Roy F, Lenhard B 2006. A new generation of JASPAR, the open-access repository for transcription factor binding site profiles. Nucleic Acids Res 34: D95–D97 [DOI] [PMC free article] [PubMed] [Google Scholar]
- Wasserman WW, Sandelin A 2004. Applied bioinformatics for the identification of regulatory elements. Nat Rev Genet 5: 276–287 [DOI] [PubMed] [Google Scholar]
- Weber M, Hellmann I, Stadler MB, Ramos L, Paabo S, Rebhan M, Schübeler D 2007. Distribution, silencing potential and evolutionary impact of promoter DNA methylation in the human genome. Nat Genet 39: 457–466 [DOI] [PubMed] [Google Scholar]
- Wingender E, Dietze P, Karas H, Knuppel R 1996. TRANSFAC: A database on transcription factors and their DNA binding sites. Nucleic Acids Res 24: 238–241 [DOI] [PMC free article] [PubMed] [Google Scholar]
- Yamada Y, Aoki H, Kunisada T, Hara A 2010. Rest promotes the early differentiation of mouse ESCs but is not required for their maintenance. Cell Stem Cell 6: 10–15 [DOI] [PubMed] [Google Scholar]
- Zhang C, Xuan Z, Otto S, Hover JR, McCorkle SR, Mandel G, Zhang MQ 2006. A clustering property of highly-degenerate transcription factor binding sites in the mammalian genome. Nucleic Acids Res 34: 2238–2246 [DOI] [PMC free article] [PubMed] [Google Scholar]
- Zheng D, Zhao K, Mehler MF 2009. Profiling RE1/REST-mediated histone modifications in the human genome. Genome Biol 10: R9 doi: 10.1186/gb-2009-10-1-r9 [DOI] [PMC free article] [PubMed] [Google Scholar]
- Zhou VW, Goren A, Bernstein BE 2011. Charting histone modifications and the functional organization of mammalian genomes. Nat Rev Genet 12: 7–18 [DOI] [PubMed] [Google Scholar]