

SUMMARY
Brain networks are commonly defined using correlations between blood oxygen level-dependent (BOLD) signals in different brain areas. Although evidence suggests that gamma band (30–100 Hz) neural activity contributes to local BOLD signals, the neural basis of inter-areal BOLD correlations is unclear. We first defined a visual network in monkeys based on converging evidence from inter-areal BOLD correlations during a fixation task, task-free state and anesthesia, and then simultaneously recorded local field potentials (LFPs) from the same four network areas in the task-free state. Low frequency oscillations (< 20 Hz), and not gamma activity, predominantly contributed to inter-areal BOLD correlations. The low frequency oscillations also influenced local processing by modulating gamma activity within individual areas. We suggest that such cross-frequency coupling links local BOLD signals to BOLD correlations across distributed networks.
Keywords: Multiple electrode recordings, Neural oscillations, Cross-frequency coupling, Functional connectivity, Resting state FMRI
INTRODUCTION
There is currently a limited understanding of the neurophysiological basis of functional magnetic resonance imaging (FMRI) signals despite the prevalence of FMRI in neuroscience research. Arguably most progress has been made towards finding local neural signatures of blood-oxygen-level-dependent (BOLD) activity in individual brain areas. A number of studies have demonstrated a tight coupling between BOLD responses to sensory stimuli and power in the gamma band (30–100 Hz) of local field potential (LFP) signals (Goense and Logothetis, 2008; Logothetis et al., 2001; Mukamel et al., 2005; Niessing et al., 2005; Shmuel et al., 2006). A prominent role for gamma frequencies is not limited to evoked BOLD responses, but extends to BOLD activity during resting state. This task-free state has been related to spontaneous, slow (i.e., < 0.1 Hz) fluctuations in BOLD signals (Fox and Raichle, 2007). Recent evidence suggests that slow changes in the power of neural gamma oscillations make a significant contribution to the spontaneous local fluctuations of the resting state BOLD signals in the human (He et al., 2008; Nir et al., 2007; Nir et al., 2008) and monkey (Scholvinck et al., 2010). The close relationship between gamma oscillations and BOLD activity in individual brain areas supports the notion that gamma processing reflects local neural computations (Canolty and Knight, 2010; Siegel et al., 2012).
Functional interactions between distributed brain areas, known as functional connectivity, give rise to coherent patterns of BOLD signals within specific neural networks during resting state as well as behavioral tasks. Covariant relations of spontaneous BOLD signals in resting state have been reported in the awake human (Biswal et al., 1995; Damoiseaux et al., 2006; Dosenbach, 2010; Fox et al., 2005; Seeley et al., 2007; Wang et al., 2010; Yeo et al., 2011) and monkey (Moeller et al., 2009) as well as the anesthetized monkey (Vincent et al., 2007) and rat (Lu et al., 2012; Lu et al., 2007). Resting state connectivity studies have proven useful for characterizing network architectures and for exploring pathological alterations in neurological and psychiatric diseases (Greicius, 2008; Matthews et al., 2006; Zhang and Raichle, 2010). Although there has been a rapid increase in the number of resting state connectivity studies and in the use of functional connectivity measures in general, there have been few studies of the neural basis of BOLD connectivity. This is at least partly due to the technical difficulty of obtaining simultaneous recordings from multiple network sites using depth electrodes in awake humans or animals. The only such study to date reported that gamma oscillations most strongly correlated with BOLD connectivity between auditory cortices in epilepsy patients (Nir et al., 2008), similar to the relationship previously reported between gamma oscillations and local BOLD signals. However, it is not clear if the link between gamma oscillations and BOLD connectivity generalizes to other circuits. It is important to test how sensitive BOLD connectivity is to oscillatory frequencies lower than gamma because it is not necessary for local computation and large-scale communication to recruit the same frequencies of oscillatory activity. Rather, low frequencies may be advantageous and commonly used for interactions between distant brain areas (Fujisawa and Buzsaki, 2011; Siegel et al., 2012).
A number of electrophysiological studies has demonstrated that brain oscillations show statistically nested coupling, with low frequencies modulating high frequencies (Buzsaki and Wang, 2012; Jensen and Colgin, 2007; Schroeder and Lakatos, 2009). Given that different oscillations are associated with different spatiotemporal scales (Buzsaki and Draguhn, 2004; von Stein and Sarnthein, 2000), cross-frequency coupling might integrate information transmission over a large-scale network with local cortical processing (Canolty and Knight, 2010). We thus hypothesized that (i) BOLD functional connectivity predominantly reflects low frequency neural interactions between remote brain areas (e.g., alpha 8–13 Hz; theta, 4–8 Hz), (ii) low frequencies modulate local high frequency activity (e.g., gamma), which predominantly reflects BOLD signals from an individual area, and (iii) such cross-frequency coupling links BOLD correlations in distributed network nodes to local BOLD activations.
RESULTS
To test our hypotheses, we first mapped out thalamo-cortical networks (i.e., network defined as a set of interconnected brain regions) derived from BOLD signals acquired from macaque monkeys. Given that task-free FMRI studies have involved various experimental conditions in humans (free gaze, eyes closed, fixation) and monkeys (free gaze, anesthesia), our study incorporated three experimental conditions to allow generalization and ready comparison with the literature: a task-free, free-gaze condition, defined as resting state here; a fixation task; and anesthesia. We focused on a thalamo-cortical visual network constituted by the lateral intraparietal area (LIP), the temporal occipital area (TEO), area V4 and the pulvinar, which has been well-studied in terms of its anatomical connectivity (e.g., Felleman and Van Essen, 1991; Saalmann et al., 2012; Shipp, 2003; Ungerleider et al., 2008). After verifying BOLD correlations across our visual network, we performed simultaneous electrophysiological recordings from the same four network areas and measured their functional connectivity based on LFPs. We included a thalamic nucleus, the pulvinar, in our study because the limited evidence available suggests that the thalamus makes an important contribution to cortical oscillations (Hughes et al., 2004; Saalmann et al., 2012; Steriade and Llinas, 1988).
Robust FMRI Functional Connectivity across Different Behavioral States
We used a combination of FMRI retinotopic mapping (Arcaro et al., 2011) and high-resolution structural MRI scans, to target the four interconnected visual areas (Shipp, 2003; Ungerleider et al., 2008). Because inaccurate ROIs have a detrimental effect on connectivity estimates (Smith et al., 2011), the retinotopic mapping ensured that the spatial ROIs we used to extract average time series matched functional areal boundaries. The brain activation pattern evoked by the retinotopic mapping task was projected to the corresponding structural surface (Figure S1A and B) to accurately delineate the border of cortical regions LIP, TEO and V4 (Figure 1). The subcortical region, the pulvinar, was manually delineated based on anatomical criteria using high-resolution structural images (Figure 1).
Figure 1.
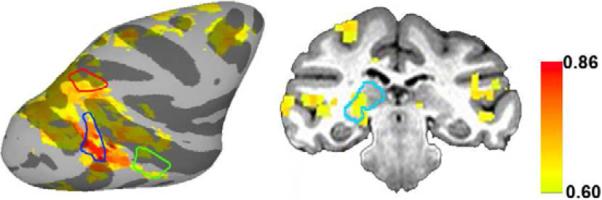
Robust resting-state FMRI functional connectivity across a visual thalamo-cortical network. Correlation map showing the connectivity of a right V4 seed with the rest of the brain of monkey BS. V4 was significantly connected with the LIP, TEO and pulvinar, among other regions. ROI boundaries are color coded: red, LIP; blue, V4; green, TEO; cyan, pulvinar.
We first aimed to show FMRI networks consistent with previous macaque studies (Moeller et al., 2009; Vincent et al., 2007), by calculating intrinsic voxel-wise functional connectivity during anesthesia, resting state and a fixation task. For the anesthesia condition, we used the right LIP as the seed region to allow direct comparison with previous work (Moeller et al., 2009; Vincent et al., 2007). We calculated the correlation between the average time series from the right LIP and the time series from all other brain voxels, with the confounding variables regressed out. The right LIP showed significant connectivity (p < 0.001, corrected using Monte Carlo simulation) with the left LIP and the frontal eye field bilaterally (Figure S1C), as previously shown (Moeller et al., 2009; Vincent et al., 2007). This connectivity pattern was consistent across all six monkeys.
To establish functional connectivity across the visual thalamo-cortical network in resting state, we performed the correlation analysis for our four ROIs, seeding LIP, V4, TEO and the pulvinar in turn, during the awake conditions. There was robust connectivity between each seed region and the other ROIs. Figure 1 shows the right V4 seed significantly correlated (p < 0.001, corrected using Monte Carlo simulation) with the ipsilateral LIP, TEO and the pulvinar (the same was true for the left V4 seed). Because the resting state and fixation conditions showed a consistent functional connectivity pattern (Figure S1D), we combined the two conditions to increase the statistical power of the ROI-based analyses. These findings suggest that the architecture of spontaneous functional connectivity is robust across different resting state conditions and can be replicated across animals.
To allow subsequent comparison with the electrophysiological results, we next evaluated ROI-based BOLD functional connectivity between LIP, TEO, V4 and the pulvinar in the right hemisphere for the resting state and fixation task. The average time series from each ROI was extracted for each run in the native space, and Pearson's correlation coefficients between those time series were calculated for the epochs (437 ± 241 s) that were not contaminated by head movement. There was a significant correlation between each pair of regions (one sample t test, p < 0.001; Figure S2). To control for the effect of eye movements, we also calculated Pearson's correlation between the BOLD activities corresponding to each stable-eye epoch (≥ 6.4 s) and observed a significant correlation between the ROIs (p < 0.01; Figure 2). Having established a robust resting-state FMRI network between V4, TEO, LIP and the pulvinar, we next probed the electrophysiological basis of this BOLD connectivity.
Figure 2.
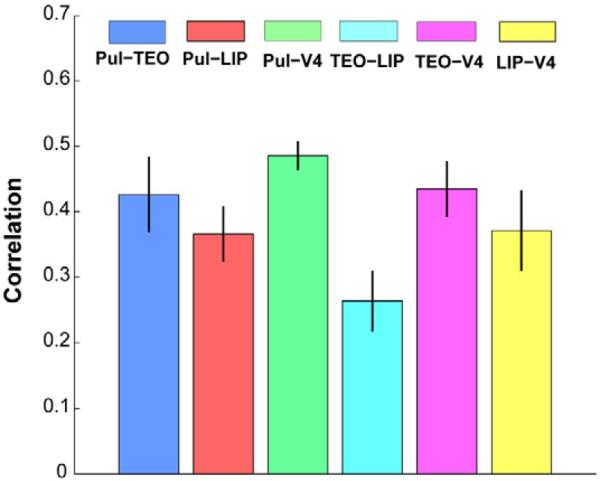
FMRI functional connectivity between pulvino-cortical ROIs. There were significant correlations between all ROIs during epochs without eye movements. Bars show mean functional connectivity +/− standard error of the mean.
Slow Fluctuations of Low Frequency, and Not Gamma, Power Predominantly Contributed to BOLD Connectivity
We derived power time series from the magnitude of the Hilbert transform for different frequency bands (Figure 3) from the LFPs simultaneously recorded in the pulvinar, LIP, TEO and V4 (58 sessions from two monkeys, one of which was also scanned under anesthesia; see Figure S3 for finer frequency band divisions). These power time series were then band-pass filtered to 0.01–0.1 Hz, to correspond to the main frequencies constituting the BOLD signal (Fox and Raichle, 2007). We performed correlation analyses on long and short epochs of the power time series: the long epochs included eye movements, as commonly used in resting state studies, thereby allowing comparison with published results; whereas the short epochs only included stable eye positions (no eye movements; see Supplemental Experimental Procedures for eye movement controls). The correlation analyses on long epochs (184 ± 84 s) showed significant correlations of power time series between ROIs for all frequency bands (one sample t tests, p < 0.001).
Figure 3.
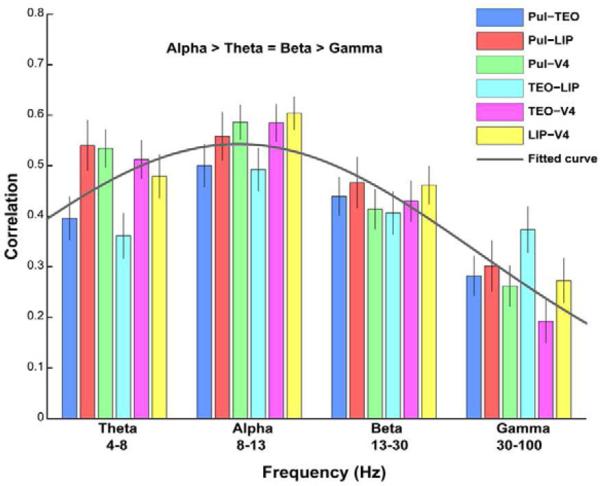
Slow fluctuations in the power of low frequencies, not gamma, contributed most to functional connectivity. There were significantly higher correlations in slow-waves of alpha power between ROIs compared with slow-waves of theta, beta, and gamma power (p < 0.001). We found the lowest correlations for gamma power. Bars show mean functional connectivity +/− standard error of the mean. Mean connectivity of ROI pairs across frequency bands fits a Gaussian function, ffitted(x) = 0.54 × e(−1)×((x−1.92)/2.51)2, with a peak at the alpha band (R2 = 0.989).
However, the low frequency bands (theta, alpha and beta) showed significantly higher correlation values than the gamma band (paired sample t tests, p < 0.001, theta/alpha/beta vs. gamma). Among the low frequency bands, there were moderately but significantly higher correlation values for the alpha band compared with the theta and beta bands (p < 0.001, alpha vs. theta/beta; p > 0.05, theta vs. beta). Similarly, for stable eye epochs, significant correlations were found in the power time series derived from all frequency bands (one sample t tests, p < 0.001) (Figures 3 and S3); but the low frequency bands had significantly higher correlation values than the gamma band (paired sample t tests, p < 0.001, theta/alpha/beta vs. gamma), with the alpha band moderately but significantly higher than the theta and beta bands (p < 0.001, alpha vs. theta/beta; p > 0.05, theta vs. beta). Overall, these results indicate that slow fluctuations in the power of low frequency oscillations contributed most to the connectivity. To verify that power correlations predominantly resulted from slow oscillations (< 0.1 Hz), we also applied the correlation analyses to the signals derived from band-pass filtering the power time series in two higher frequency bands (0.1–1 Hz and > 1 Hz). There were significantly higher correlation values for the 0.01–0.1 Hz band compared with both the 0.1–1 Hz band and the greater than 1 Hz band (paired sample t tests, p < 0.001). The major contribution of frequencies less than 0.1 Hz is consistent with a recent study of bilateral primary auditory cortex (Nir et al., 2008). However, our findings suggest that in contrast to the current view on the predominant contribution from gamma activity, low frequency oscillations are a major contributor to large-scale network connectivity.
Low Frequency Coherence Predicts BOLD Connectivity
Slow oscillations (< 0.1Hz) are commonly thought to signal general changes in network excitability (Hughes et al., 2011; Monto et al., 2008), whereas oscillations on a faster time scale (> 1Hz) may be better suited to more specific information exchange between areas. To measure interactions between network areas on a faster time scale, we calculated the coherence between the “raw” LFP signals (cf. power time series in previous section) in each pair of network areas. The coherence measures the linear association between the LFPs, as a function of oscillation frequency. For each recording session, we used multi-taper methods (3 tapers and ± 4 Hz bandwidth) to estimate the coherence in every 500 ms time window for which there was no eye movement (excluding 0–200ms after any preceding eye movement). The population mean coherence spectrum for each ROI pair showed the peak coherence at low frequencies (< 20 Hz; Figure 4). Within a specified frequency band, we counted the number of sessions showing significant coherence for each pair of ROIs (jackknife variance estimates, p < 0.001). There was significant coherence in the 4–20 Hz range for 41 to 55 sessions (range across the six pairs of ROIs) out of the total of 58 sessions, whereas only 9 to 29 out of 58 sessions showed significant coherence in the 30–100 Hz range. Notably, the rank of connection strengths based on mean alpha coherence was similar to that seen in BOLD connectivity (Figure 2). For example, alpha coherence and BOLD connectivity both showed the strongest connection between the pulvinar and V4 and the weakest connection between the TEO and LIP. With respect to the greater effects at low versus high frequencies, these coherence results were consistent with that observed in the slow-wave power correlations. Thus, the coherence of neural activities on a fast timescale may give rise to the power correlation of band-limited neural activities at the slow FMRI timescale. Specifically, low frequency oscillations (< 20 Hz) may predominantly contribute to resting-state functional connectivity.
Figure 4.
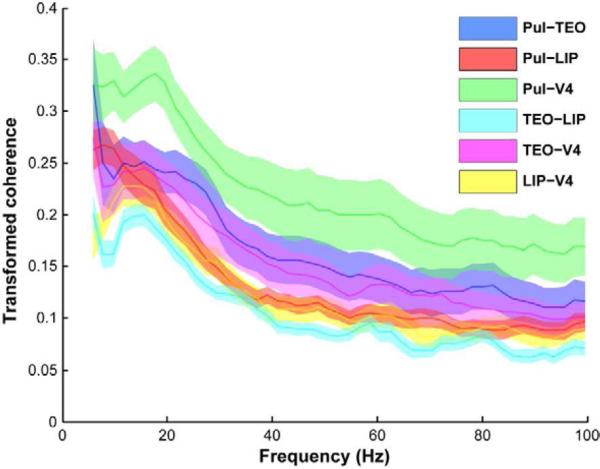
Fast-wave coherence at low frequencies best predicts BOLD connectivity. Population mean LFP-LFP coherence (+/− standard error of the mean) calculated for all ROI pairs during stable eye epochs of 500 ms duration. The peak coherence occurred at low frequencies below 20 Hz.
Cross Frequency Coupling Between Low Frequencies and Gamma
Different frequencies of neural oscillations may be useful for different temporal and spatial scales: high frequencies like gamma for local computation, and lower frequencies like alpha for large-scale interactions. Because low frequency oscillations have been shown to modulate high frequency activity (Buzsaki and Wang, 2012; Canolty and Knight, 2010; Jensen and Colgin, 2007; Schroeder and Lakatos, 2009), such cross-frequency coupling may integrate functions across multiple spatiotemporal scales. We hypothesized that low frequencies may contribute to fluctuation of the power in the gamma band, through a cross-frequency coupling mechanism. To measure cross-frequency coupling, we used the synchronization index (Cohen, 2008), which supposes that high frequency power should fluctuate according to the phase of the low frequency oscillation, if the low frequency oscillation modulates the high frequency activity. For each recording session, the synchronization index was computed for theta-gamma, alpha-gamma and beta-gamma coupling and then normalized to a Z score. We found that theta, alpha and low beta (13–20 Hz) frequencies significantly coupled with gamma between 40–80 Hz for each ROI (Figure 5, right column), indicating that low frequency rhythms (< 20 Hz) modulated gamma rhythms (permutation tests, p < 0.001). The strongest cross-frequency coupling occurred between the alpha and gamma bands (Figure S4; paired sample t tests, p < 0.001, alpha-gamma coupling vs. theta/low beta/high beta coupling with gamma). This coupling was highly consistent across recording sessions (Figure 5, left column). Although previous studies of the electrophysiological signatures of BOLD have emphasized gamma frequencies, our cross-frequency coupling result suggests that lower frequencies like alpha may ultimately shape gamma activity and BOLD signals.
Figure 5.

Cross frequency coupling between neural oscillations in the alpha and gamma frequency bands. (Left column) Normalized synchronization index (SI) between the alpha frequency band (8–13 Hz) and higher frequencies across each of the 58 sessions, for the pulvinar, TEO, LIP and V4. The color bar (bottom) shows the SI range. The SI was highly consistent across sessions for each ROI. (Right column) Population average SI (+/− standard error of the mean) shows high coupling between alpha and the gamma frequency band (predominantly 40–80 Hz) for all four ROIs.
DISCUSSION
Our simultaneous LFP recordings from four distributed network sites show that low frequency neural oscillations (< 20 Hz) predominantly contributed to resting-state BOLD connectivity, providing first evidence of the electrophysiological basis of thalamo-cortical functional connectivity in FMRI. The important role for low frequency oscillations suggested by our findings contrasts with the current view that BOLD signals (whether evoked responses or resting-state signals) reflect neural oscillations in the gamma frequency band (Logothetis et al., 2001; Niessing et al., 2005; Nir et al., 2007). However, our finding of the prominent role of low frequency oscillations and the notion that gamma oscillations play a prominent role can be integrated by considering cross-frequency coupling mechanisms. We found that the phase of low frequency oscillations modulated the amplitude of gamma oscillations, suggesting that cross-frequency coupling integrates long-range neural interactions mediated by low frequency rhythms (e.g., theta/alpha) with local computations mediated by high frequencies (i.e., gamma).
Cross-Frequency Coupling Contributions to BOLD
Different rhythms are commonly associated with different spatiotemporal scales. Low frequency oscillations have long time windows for information processing, which are useful for synchronizing distant network areas with large conductions delays between areas. In contrast, high frequency oscillations have short time windows for information processing, which are useful for selectively synchronizing small groups of neurons (Buzsaki and Draguhn, 2004; Canolty and Knight, 2010; Schroeder and Lakatos, 2009; Siegel et al., 2012; von Stein and Sarnthein, 2000). Thus, cross-frequency coupling might serve to coordinate multiple nodes of fast, local cortical processing, necessary for specialized computations, across a large-scale network, necessary for effective behavioral responses. Interestingly, recent studies showed that low frequency activity, such as the alpha band, carried information about BOLD signals largely complementary to that carried by gamma power (Hermes et al., 2012; Magri et al., 2012). In our study, we conducted cross-frequency coupling analysis in each brain area to demonstrate that low frequency oscillations synchronize with high frequency activity. This suggests that gamma power correlations between brain areas, in our and previous studies, may be induced by the combination of inter-areal synchronization of low frequency oscillations and cross-frequency coupling between these low frequencies and the gamma band. Taking into account our coherence results showing high synchronization between low frequency oscillations in different areas, the cross-frequency coupling may indicate temporal coordination of local computations (Siegel et al., 2012).
Probing the Neural Basis of BOLD Connectivity
Previous animal studies of the neural basis of the BOLD signal have generally relied on recordings from a single brain area (Logothetis et al., 2001; Niessing et al., 2005). The neural data from one brain area were then compared with BOLD activity, whether recorded simultaneously (Goense and Logothetis, 2008; Logothetis et al., 2001; Niessing et al., 2005; Scholvinck et al., 2010) or in different sessions (Leopold et al., 2003; Lu et al., 2007; Nir et al., 2007). This approach offers insight into localized neural processes contributing to the BOLD signal. Because our main objective was to better understand distributed processing, as measured with functional connectivity approaches, we naturally attempted to acquire simultaneous recordings from distal, but interconnected, sites and measure their interactions. However, it is technically challenging to obtain simultaneous recordings from multiple brain areas, which currently precludes the simultaneous acquisition of BOLD signals. Thus, we acquired electrophysiological and FMRI data in different sessions under similar experimental conditions, as has been done in human studies (Mukamel et al., 2005; Nir et al., 2007; Nir et al., 2008). Rather than directly comparing the LFPs to BOLD signals across sessions to probe localized neurovascular coupling, we compared the functional connectivity derived from LFPs within-session to the connectivity derived from BOLD signals within-session to probe the large-scale neural interactions underlying correlations of BOLD signals across networks. We did perform both LFP and BOLD recordings (in different sessions) in one monkey, and the results from this monkey are consistent with the results from the different groups of monkeys used in the electrophysiology and FMRI experiments.
Comparison with Previous Studies of the Neural Basis of BOLD Connectivity
Previous human electrocorticography (ECoG) studies reported that inter-areal correlations in the power of gamma oscillations are a major contributor to BOLD connectivity (He et al., 2008; Nir et al., 2008). Electrodes on the cortical surface in these ECoG studies may prominently reflect processing in supra-granular and granular cortical layers (Fukushima et al., 2012; Kajikawa and Schroeder, 2011). In comparison, intracerebral LFP recordings with higher-impedance electrodes in monkeys have higher spatial resolution (e.g., Katzner et al., 2009) and can reflect superficial or deep cortical layers (or a subcortical area) depending on electrode depth. There is evidence that neurons in different cortical layers may predominantly operate in different frequency bands. For example, gamma oscillations have been associated with superficial layers, while lower frequency oscillations have been found in deep layers (Buffalo et al., 2011; Maier et al., 2010; but see Lakatos et al., 2005; Lakatos et al., 2008). Thus, compared with methods used in animal studies, human electrophysiological techniques may not be as sensitive to low frequency oscillations in deep cortical layers, although the effects of volume conduction and cortical folding complicate the interpretation of cortical surface recordings. Nir et al. (2008) also performed depth electrode recordings from auditory cortex in both hemispheres and showed a predominant contribution of gamma oscillations to BOLD connectivity. This predominance of gamma over lower frequencies may be due to auditory networks operating at different frequencies to visual networks, their intracranial recordings targeting particular cortical layers, or the possibility of cross-hemispheric interactions between homologous areas being more likely to involve gamma oscillations than intra-hemispheric interactions (Engel et al., 1991; Sil'kis and Bogdanova, 1998). Although these ECoG studies reported strongest inter-areal correlations in gamma power, there were significant correlations in the power of lower frequency oscillations (1–25 Hz) between areas. Given this synchronization of low-frequency oscillations between brain areas, cross-frequency coupling between the low and gamma frequencies in the individual areas may have contributed to the reported inter-areal correlations in gamma power.
There is evidence for prominent low-frequency oscillatory contributions to BOLD connectivity in a recent electroencephalography study using electrodes on the intact dura of anesthetized rats (Lu et al., 2007). This study demonstrated that delta oscillations (1–4 Hz) contributed to BOLD connectivity between bilateral primary somatosensory cortices during anesthesia. However, it is not clear how much delta oscillations normally contribute to BOLD connectivity, because anesthetic agents generally alter neural activity and hemodynamics, including shifts in relative power from higher-frequency neural activity to delta oscillations (Franks, 2008; Williams et al., 2010). Delta oscillations have been reported to have an organizing influence on sensory processing in behaving monkeys through hierarchical coupling (Lakatos et al., 2008; Lakatos et al., 2005), but our band-pass of 3–300 Hz for LFP recordings did not allow us to test the role of delta oscillations in resting state. Further support for a role of low frequency oscillations derives from a macaque resting state study which showed cross-correlations between LFP power at one cortical site (either in frontal, parietal, or visual cortex) and simultaneously-acquired BOLD signals at distant sites (Scholvinck et al., 2010). Although gamma-frequency contributions were emphasized, theta- and alpha-frequency oscillations at times showed the strongest correlation with BOLD signals, consistent with our study. Because different functional networks can recruit distinct frequency bands (Siegel et al., 2012), the particular low frequencies of neural oscillations that predominantly contribute to BOLD connectivity across the brain may be network-dependent.
Dissecting Contributions of Different Circuit Paths to BOLD Signals
It has been suggested that the biophysical properties of neural circuits determines the frequencies of network interactions (Siegel et al., 2012; Wang, 2010). For example, conduction delays between distant network nodes may be one important factor contributing to the frequency range of cortical network interactions (Kopell et al., 2000; von Stein and Sarnthein, 2000). Long conduction delays between distant brain regions may limit the frequency of large-scale network oscillations to a low frequency band, accounting for the low frequency oscillations observed during our multi-site recordings. Evidence suggests that low frequency oscillations (e.g., theta and alpha) can be generated locally in thalamic nuclei (Hughes and Crunelli, 2005; Lorincz et al., 2008) or the deep layers of high-order visual cortex (Bollimunta et al., 2008; Bollimunta et al., 2011; Lopes da Silva, 1991; Lopes da Silva and Storm Van Leeuwen, 1977) and propagated to other network nodes. Because previous studies of the neural basis of BOLD connectivity (He et al., 2008; Nir et al., 2008) focused mainly on the primary sensory cortices (which reportedly have different oscillation-generating mechanisms; Bollimunta et al., 2008; Mo et al., 2011), rather than on these generators, low-frequency contributions of oscillations to the BOLD signal may have been more difficult to detect.
Different oscillatory frequency bands may also be associated with different functional properties. It has been suggested that different frequencies reflect different directions of cortical information transmission (Buffalo et al., 2011; Buschman and Miller, 2007; von Stein et al., 2000): specifically, gamma-band coherence for feedforward processing, and lower-frequency coherence for feedback processing. In our study (similar to other resting-state studies), the absence of visual stimulation in a completely dark room possibly reduced gamma activity in bottom-up processing and relatively increased the contribution from lower frequency oscillations. However, an alternative interpretation of the finding of prominent alpha oscillations in deep cortical layers (Buffalo et al., 2011) is that the low frequency oscillations play a role in feedforward (and feedback) processing via extensive cortico-thalamo-cortical pathways (Saalmann et al., 2012), which originate in the deep cortical layers (Sherman and Guillery, 2006), instead of giving rise to cortico-cortical feedback, which originates in the deep cortical layers as well. Since it is probable that there was largely spontaneous activity in our visual network in the absence of visual stimulation, interactions between areas may well have been bi-directional.
Functional Role of Alpha Oscillations
Although EEG and MEG studies have proposed a suppressive role for alpha oscillations on sensory processing (Jensen and Mazaheri, 2010; Klimesch et al., 2007), recent evidence suggests it is the phase of alpha oscillations that is important for regulating information transmission (Busch et al., 2009; Jensen et al., 2012; Mathewson et al., 2009). Thus, phase synchronization between alpha oscillations in different brain areas allows for effective network communications (Palva and Palva, 2011; Saalmann et al., 2012; von Stein et al., 2000). Alpha oscillations can be recorded in sensory areas and fronto-parietal cortex, but are typically prominent in occipital areas. Because we recorded from a visual network, it might be expected that alpha frequencies sizably contributed to the low-frequency interactions between network areas. It may well be that different brain networks predominantly operate in different low frequency bands for inter-areal communication, for instance, theta frequencies in medial temporal networks and beta frequencies in motor networks (Siegel et al., 2012).
Subcortical Contributions to Resting-State Connectivity
Partly because of methodological issues associated with imaging subcortical areas and partly because of current views of cognitive functions being confined to the cortex, there have been few studies of thalamic contributions to functional connectivity measured using FMRI. The thalamus and cerebral cortex are extensively and reciprocally connected (Jones, 2007; Sherman and Guillery, 2006), with the thalamus well-positioned to regulate information transmitted to the cortex and between cortical areas. A recent human study (Zhang et al. 2008) and our monkey study suggest that this closely coupled thalamocortical system produces robust resting-state FMRI networks incorporating the thalamus. Thalamocortical interactions, supported by recurrent thalamocortical loops (McCormick and Bal, 1997; Steriade and Llinas, 1988; Steriade et al., 1993), are important for generating brain oscillations. In particular, low frequency neural oscillations (e.g., alpha) in the cortex are highly dependent on the thalamus (whereas cortical gamma oscillations are highly dependent on inhibitory interneurons; Buzsaki and Wang, 2012). Simultaneous neural recordings from thalamo-cortical sites have shown strong coherence between alpha rhythms in the thalamus and cortex (Chatila et al., 1993; Lopes da Silva et al., 1980). Evidence suggests that the alpha oscillations can be generated in thalamic nuclei (Hughes and Crunelli, 2005; Hughes et al., 2004; Lorincz et al., 2008) and thalamic lesions have been reported to suppress cortical alpha activity (Ohmoto et al., 1978). We have recently demonstrated that the pulvinar regulates the degree of alpha-band synchrony between visual cortical areas based on behavioral demands (Saalmann et al., 2012). This suggests that the thalamus may be a vital node for supporting resting-state networks.
Resolving Connectivity on Slow Versus Fast Time Scales
Previous studies have indicated that spontaneous BOLD connectivity best correlates with slow (< 0.1 Hz) cortical potentials (Nir et al., 2008). Consistent with these previous cortico-cortical studies, we showed highest correlations between power time series on a slow timescale (< 0.1 Hz) in our thalamocortical network. Such slow changes in LFP power match the main frequencies (< 0.1 Hz) contributing to the BOLD signal. However, we also showed significant coherence between “raw” time series on a fast timescale. Both these effects on slow and fast time scales were associated with the same range of low frequency oscillations (e.g., alpha power on a slow time scale and alpha coherence on a fast time scale). Computational modeling studies have proposed that inter-areal coupling on slow time scales can emerge from neural synchrony on fast time scales (Cabral et al., 2011; Honey et al., 2007). Our study provides an empirical demonstration that slow power fluctuations could reflect the faster coherent oscillations, linking the FMRI measure to neural interactions occurring on a time scale better suited to more detailed information processing.
Conclusion
In summary, our findings suggest the following neural processes support BOLD connectivity: (1) phase-locking of low frequency oscillations for effective information transmission between remote brain areas; (2) these low frequency oscillations modulating the higher frequency activity of local information processing; and (3) the slow fluctuations in oscillatory power changes correlating with BOLD connectivity across distinct brain areas.
EXPERIMENTAL PROCEDURES
Functional MRI Studies
Experimental Design
Anesthesia condition
Macaque monkeys (BU, BS, CA, HO, MC, PH) were anesthetized with Telazol (tiletamine/zolazepam, 10 mg/kg, i.m., administered at regular intervals as needed to maintain anesthesia) and held securely in an all-plastic MR-compatible stereotaxic apparatus. Two to four FMRI time series (1,125 measurements each series) were acquired from each monkey during anesthesia (two sessions collected from monkey BU). The monkey's eyes were closed, and the experiments were performed in darkness. We monitored respiration rate and pulse rate during scan sessions using an MR-compatible respiratory belt and a pulse oximeter (Siemens). FMRI data were acquired from monkey CA prior to implanting the recording chamber.
Resting State
Monkeys BU and BS each participated in three scan sessions, in which there were no behavioral requirements and they were free to move their eyes. We placed the monkey in an MR-compatible primate chair in a sphinx-like position, with his head fixed using the implanted head bolt and inflated pillows around the body minimizing movement (Pinsk et al., 2005). Three to four FMRI time series (1,125 measurements each series) were acquired in each scan session, during which the monkey rested in the dark (lights off in scanner and console room). The monkey's eye position at the MRI scanner was monitored using a 60 Hz long-range optics system (Model LRO, Applied Science Laboratories), to determine the periods when the eyes were stable. At the end of the awake FMRI scans, we anesthetized the animals (ketamine, 2–10 mg/kg, i.m.) to collect the field map and structural images.
Fixation Task
Monkey BU participated in a third FMRI experiment that required him to fixate on a central fixation point. A single FMRI time series was acquired (2,250 measurements) per scan session while the monkey performed a simple fixation task. Juice reward was provided at regular two-second intervals as long as the monkey fixated a central fixation point (0.50° diameter) within an invisible 4° square window (Pinsk et al., 2005). This small grey fixation point on a black background was projected from a single-lamp three-chip LCD projector (Christie LX650, Christie Digital Systems) outside the scanner room onto a translucent screen located at the end of the scanner bore at a ~60 cm viewing distance. We synchronized the display, eye position recordings, reward delivery, and the beginning of each scan via a computer running Presentation software (Neurobehavioral Systems). A total of five FMRI time series was acquired over five scan sessions.
Data Acquisition
We acquired structural and functional MRI images at a 3 T head-dedicated scanner (Magnetom Allegra; Siemens), using a 12-cm transmit-receive surface coil (Model NMSC-023; Nova Medical Inc.). Functional MRI images for the anesthesia condition, resting state and fixation task scanning sessions were acquired with a gradient echo, echo planar sequence [FOV = 95 × 95 mm; matrix = 64 × 64; no. of slices = 24; slice orientation = transverse; slice thickness = 1.5 mm; inter-slice gap = 0.5 mm; TR = 1,600 ms; TE = 26 ms; flip angle = 66°; in-plane resolution = 1.5 mm2]. Matching in-plane gradient echo field map and magnitude images were acquired to perform geometric unwarping of the EPI images [TR = 500 ms, TE = 4.17/6.63 ms, flip angle = 55°] as well as T1-weighted structural images for co-registration of the FMRI data [Magnetization-Prepared Rapid Gradient-Echo (MPRAGE); FOV = 128 × 128 mm; matrix = 256 × 256; no. of slices = 160; slice thickness = 1.0 mm; TR = 2,500 ms; TE = 4.38 ms; flip angle = 8°; TI = 1,100 ms; in-plane resolution = 0.5 mm2]. Details of imaging parameters for retinotopic mapping sessions are described in Arcaro et al. (2011).
Data Analysis
FMRI Data Preprocessing
The first six EPI volumes from each scan series were excluded from further analysis to avoid artifacts caused by signal saturation effects. The remaining volumes underwent slice timing correction, and rigid motion correction to the first volume of the first run (Cox and Jesmanowicz, 1999). After the motion correction, we geometrically unwarped the images using a field map and magnitude image acquired in the same session (Jenkinson, 2001; Jezzard and Balaban, 1995). Briefly, the magnitude image was skull-stripped, forward-warped using FMRIB's FUGUE utility, and rigidly registered to a skull-stripped reference EPI volume with FMRIB's Linear Image Registration Tool (FLIRT; Jenkinson and Smith, 2001). The resulting transformation matrix was applied to the field map image (scaled to rad/s and regularized by a 2-mm 3D Gaussian kernel), which was subsequently used to unwarp all FMRI images with the FUGUE utility. In preparation for functional connectivity analysis, several additional preprocessing steps were performed on the unwarped images: (1) removal of “spikes” from EPI volumes; (2) linear and quadratic detrending; (3) spatial smoothing using a 3 mm full width at half maximum Gaussian blur; (4) temporal filtering retaining frequencies in the 0.01–0.1 Hz band; and (5) removal by regression of several sources of variance: (i) the six motion parameter estimates and their temporal derivatives, (ii) the signal from a ventricular region, and (iii) the signal from a white matter region.
Voxel-wise Correlation Analysis
The first step in all connectivity analyses was to extract BOLD time courses from each ROI, by averaging over voxels within each ROI. To compute functional connectivity maps corresponding to the selected seed ROI, LIP, we correlated the regional time course with all other voxels in the brain (Biswal et al., 1995). We used AFNI's AlphaSim program (1,000 Monte Carlo simulations) to correct for multiple comparisons. For awake monkeys, we regressed out the influence of head movements. As an additional control, we performed the linear correlation analysis within the longest period of stable head position, defined as within the range of the mean ± 3 s.d.. In the case of an outlier > 3 s.d., we excluded the outlying volume and the surrounding ± 30 volumes.
ROI-based Correlation Analysis
We performed correlation analyses between ROIs only for the awake states. Stable eye epochs were identified based on the criteria of fixation within a four degree window (i.e., epochs between eye movements) and a duration of at least 6.4 s (4TRs). To minimize the effect of any evoked response to eye movements, we excluded the first 6.4 s of each stable eye epoch (considering the effect of eye movements on the first few volumes due to the slow characteristics of the hemodynamic function) and used the volumes during the subsequent 4.8 s (i.e., 3TRs). For each ROI, we averaged the BOLD signal over these three volumes (TRs 5–7 of the stable eye epoch) to generate one sample point in a discontinuous time series; repeating this procedure for every eye stable epoch generated the full time series (Kerns et al., 2004). The inter-regional functional connectivity was obtained by computing Pearson correlation coefficients for all possible pairs of ROIs. We computed statistical tests on all correlations after applying the Fisher Z-transform, which yields variates that are approximately normally distributed.
Electrophysiology Studies
Resting-State Data Collection
The monkey sat in a customized primate chair, alone in a completely dark room to avoid visual stimulation and minimize eye movements (Martinez-Conde et al., 2004). We acclimatized the monkey to this resting-state condition prior to recordings. The monkey had no behavioral requirements and was free to move his eyes (however, we analyzed epochs in which the eyes were stable; except for the correlation analyses on long data epochs, to allow comparison with the literature). We monitored eye movements using a stationary eye tracking system (Applied Science Laboratories) with an infrared camera operating at 120 Hz. The LFP from each electrode was amplified and band-pass filtered (3–300 Hz; precluding assessment of delta band oscillations) using a preamplifier (PBX3/16sp-r-G1000/16fp-G1000, with a high input impedance headstage; Plexon Inc.) and Plexon Multichannel Acquisition Processor controlled by RASPUTIN software. The signals were digitized at a rate of 1,000 Hz. In total, 58 resting-state sessions (on separate days) were acquired from two monkeys (CA, 39 sessions; LE, 19 sessions).
Data Analysis
Analysis of Local Field Potentials
We performed data analyses in Matlab using the Chronux toolbox (Bokil et al., 2010). Preprocessing steps included the exclusion of artifacts from any body movements and the removal of 60 Hz power line noise and its harmonics using a notch filter (± 1 Hz). We identified stable-eye epochs of at least 700 ms duration, during which the monkey's eyes did not deviate by more than two degrees. We calculated band-limited power correlations and coherence in 500 ms windows within each stable-eye epoch after excluding (a) the first 200 ms of stable-eye epochs to remove any evoked responses, and (b) the 210 ± 141 ms (mean ± s.d.) before the next eye movement to remove any possible motor-related signals; if the stable-eye epoch spanned multiples of 500 ms (after excluding the first 200ms of the epoch), each of these 500 ms data segments contributed to the analyses.
Band-limited Power (BLP) and Correlation Analysis
To examine BLP modulation in different frequency bands, we applied zero phase-shift bandpass filtering to the raw LFP signals to produce the following frequency bands: theta, 4–8 Hz; alpha, 8–13 Hz; beta, 13–30 Hz; gamma, 30–100 Hz (we also probed effects at a higher frequency resolution in the following bands: 4–8 Hz, 8–13 Hz, 13–20 Hz, 20–30 Hz, 30–40 Hz, 40–50 Hz, 50–60 Hz, 60–70 Hz, 70–80 Hz, 80–90 Hz, 90–100 Hz). To normalize the resulting band-limited signals, we subtracted the mean power and divided by the standard deviation for that frequency band. We full-wave rectified the normalized band-limited signals by taking their absolute value, and convolved these signals with a Gaussian of full width at half maximum equal to 100 ms. Note that this procedure extracts the time-varying envelope amplitude of each bandpass-filtered signal. Next, the BLP signals were further filtered into slow (< 0.1 Hz) fluctuations (two other frequency bands (0.1–1 Hz) and (> 1 Hz) were also computed for comparison) using a second-order, zero-phase Butterworth band-pass filter. We calculated Pearson's correlation coefficients between all possible pairs of ROIs (i) over the entire time course of the filtered BLP signals (`long epochs') and (ii) over the stable-eye epochs (`short epochs'; 135 ± 69 epochs per recording session; a total of 58 sessions). The significance of correlations was assessed using one sample t tests on Fisher Z-transformed coefficients.
Coherence Analysis
We used multitaper methods (3 Slepian tapers, providing an effective taper smoothing of ± 4 Hz) (Mitra and Pesaran, 1999) to calculate the coherence Cxy(f):
, where Sx(f) and Sy(f) are the spectra of LFP time series, and Sxy(f) is the cross-spectrum. Coherence values range from zero to one, where zero coherence means the LFPs are unrelated and a coherence of one means that the LFPs have a constant phase relationship. We Fisher-transformed coherence values and accounted for the different number of stable-eye epochs in each resting-state session according to:
where Cxy_t is the transformed coherence, and m is the product of K and the number of stable-eye epochs (Bokil et al., 2007). We rejected the null hypothesis of no significant coherence between two ROIs only when the coherence was above zero (based on jackknife estimates of the variance) across a frequency range greater than the bandwidth (i.e., 8 Hz), to account for multiple comparisons (Bokil et al., 2007).
Cross Frequency Coupling
We measured cross-frequency coupling between low frequency oscillations and gamma power using the synchronization index (Cohen, 2008). There were two reasons for using this measure: (1) the synchronization index can be reliably computed on the short stable eye epochs examined in our study; and (2) the synchronization index can capture dynamic changes in cross-frequency coupling. We employed three processing steps to calculate the SI: First, we extracted gamma power time series for given frequency bands, whose central frequency ranged from 30 to 100 Hz, stepped in 5 Hz increments, with a bandwidth of ± 5 Hz. Second, for each of the theta, alpha, low beta (13–20 Hz) and high beta (20–30 Hz) bands, we identified the low frequency that the gamma power time series might synchronize. (The aim here was to identify the dominant frequency at which the gamma power time series oscillated.) Third, we identified the peak of the power of the gamma frequency envelope time series; and (iii) we extracted the phase time series from both the gamma and low frequency bands (low frequency bandwidth ± 1.5 Hz) and calculated the phase coherence (synchronization index, SI) for the epoch k (k = 1, …, N):
where T is the number of time points in an epoch; Ølt is the phase value of the low frequency time series, and Øht is the phase value of the gamma frequency power time series at time point t. The magnitude of SI, SIkm, reflects the degree to which the phases are synchronized. The SIkm measure ranges from zero to one: an SIkm equal to zero means the phase values are entirely desynchronized; and an SIkm equal to one means the phases are entirely synchronized. We calculated theta-gamma, alpha-gamma and beta-gamma coupling in 1,000, 500 and 300 ms windows, respectively (to obtain 1,000 ms time windows, we identified stable eye epochs (2 degree fixation window) of at least 1,200 ms duration and removed the first 0–200 ms of these epochs to avoid any eye movement-related activity), so that analysis time windows contained at least four cycles of the low frequency oscillation (we also calculated cross-frequency coupling using the same window length for each frequency band and obtained similar results). Next, we used a bootstrapping technique to transform SIkm values to Z scores by comparing the distance of SIkm to the distribution of SIkmb values obtained by shuffling data 200 times:
where SIkZ is the normalized synchronization index for the epoch k. For each recording session, we averaged SIkZ values over all stable-eye epochs to obtain SIZ, and applied parametric statistical tests on the SIZ values from all sessions.
Supplementary Material
HIGHLIGHTS
Simultaneous multiple-electrode recordings from a thalamo-cortical network.
Low-frequency neural oscillations contributed to inter-areal BOLD correlations.
Low-frequency oscillations modulated local gamma-frequency neural activity.
Cross-frequency coupling linked local BOLD activations to BOLD connectivity.
ACKNOWLEDGMENTS
We thank Xin Li for assisting with electrophysiology experiments and Drs. Adriano Tort, Michael X. Cohen, and Christopher J. Honey for helpful discussion. This work is supported by grants NEI RO1 EY017699, NEI R21 EY021078 and NSF BCS-1025149.
Footnotes
Publisher's Disclaimer: This is a PDF file of an unedited manuscript that has been accepted for publication. As a service to our customers we are providing this early version of the manuscript. The manuscript will undergo copyediting, typesetting, and review of the resulting proof before it is published in its final citable form. Please note that during the production process errors may be discovered which could affect the content, and all legal disclaimers that apply to the journal pertain.
REFERENCES
- Arcaro MJ, Pinsk MA, Li X, Kastner S. Visuotopic organization of macaque posterior parietal cortex: a functional magnetic resonance imaging study. J Neurosci. 2011;31:2064–2078. doi: 10.1523/JNEUROSCI.3334-10.2011. [DOI] [PMC free article] [PubMed] [Google Scholar]
- Biswal B, Yetkin FZ, Haughton VM, Hyde JS. Functional connectivity in the motor cortex of resting human brain using echo-planar MRI. Magn Reson Med. 1995;34:537–541. doi: 10.1002/mrm.1910340409. [DOI] [PubMed] [Google Scholar]
- Bokil H, Andrews P, Kulkarni JE, Mehta S, Mitra PP. Chronux: a platform for analyzing neural signals. J Neurosci Methods. 2010;192:146–151. doi: 10.1016/j.jneumeth.2010.06.020. [DOI] [PMC free article] [PubMed] [Google Scholar]
- Bokil H, Purpura K, Schoffelen JM, Thomson D, Mitra P. Comparing spectra and coherences for groups of unequal size. J Neurosci Methods. 2007;159:337–345. doi: 10.1016/j.jneumeth.2006.07.011. [DOI] [PubMed] [Google Scholar]
- Bollimunta A, Chen YH, Schroeder CE, Ding M. Neuronal mechanisms of cortical alpha oscillations in awake-behaving macaques. Journal of Neuroscience. 2008;28:9976–9988. doi: 10.1523/JNEUROSCI.2699-08.2008. [DOI] [PMC free article] [PubMed] [Google Scholar]
- Bollimunta A, Mo J, Schroeder CE, Ding M. Neuronal mechanisms and attentional modulation of corticothalamic alpha oscillations. J Neurosci. 2011;31:4935–4943. doi: 10.1523/JNEUROSCI.5580-10.2011. [DOI] [PMC free article] [PubMed] [Google Scholar]
- Buffalo EA, Fries P, Landman R, Buschman TJ, Desimone R. Laminar differences in gamma and alpha coherence in the ventral stream. Proc Natl Acad Sci U S A. 2011;108:11262–11267. doi: 10.1073/pnas.1011284108. [DOI] [PMC free article] [PubMed] [Google Scholar]
- Busch NA, Dubois J, VanRullen R. The phase of ongoing EEG oscillations predicts visual perception. J Neurosci. 2009;29:7869–7876. doi: 10.1523/JNEUROSCI.0113-09.2009. [DOI] [PMC free article] [PubMed] [Google Scholar]
- Buschman TJ, Miller EK. Top-down versus bottom-up control of attention in the prefrontal and posterior parietal cortices. Science. 2007;315:1860–1862. doi: 10.1126/science.1138071. [DOI] [PubMed] [Google Scholar]
- Buzsaki G, Draguhn A. Neuronal oscillations in cortical networks. Science. 2004;304:1926–1929. doi: 10.1126/science.1099745. [DOI] [PubMed] [Google Scholar]
- Buzsaki G, Wang XJ. Mechanisms of gamma oscillations. Annu Rev Neurosci. 2012;35:203–225. doi: 10.1146/annurev-neuro-062111-150444. [DOI] [PMC free article] [PubMed] [Google Scholar]
- Cabral J, Hugues E, Sporns O, Deco G. Role of local network oscillations in resting-state functional connectivity. Neuroimage. 2011;57:130–139. doi: 10.1016/j.neuroimage.2011.04.010. [DOI] [PubMed] [Google Scholar]
- Canolty RT, Knight RT. The functional role of cross-frequency coupling. Trends Cogn Sci. 2010;14:506–515. doi: 10.1016/j.tics.2010.09.001. [DOI] [PMC free article] [PubMed] [Google Scholar]
- Chatila M, Milleret C, Rougeul A, Buser P. Alpha rhythm in the cat thalamus. C R Acad Sci III. 1993;316:51–58. [PubMed] [Google Scholar]
- Cohen MX. Assessing transient cross-frequency coupling in EEG data. J Neurosci Meth. 2008;168:494–499. doi: 10.1016/j.jneumeth.2007.10.012. [DOI] [PubMed] [Google Scholar]
- Cox RW, Jesmanowicz A. Real-time 3D image registration for functional MRI. Magn Reson Med. 1999;42:1014–1018. doi: 10.1002/(sici)1522-2594(199912)42:6<1014::aid-mrm4>3.0.co;2-f. [DOI] [PubMed] [Google Scholar]
- Damoiseaux JS, Rombouts SA, Barkhof F, Scheltens P, Stam CJ, Smith SM, Beckmann CF. Consistent resting-state networks across healthy subjects. Proc Natl Acad Sci U S A. 2006;103:13848–13853. doi: 10.1073/pnas.0601417103. [DOI] [PMC free article] [PubMed] [Google Scholar]
- Dosenbach NUF. Prediction of individual brain maturity using fMRI (vol 329, pg 1358, 2010) Science. 2010;330 doi: 10.1126/science.1194144. [DOI] [PMC free article] [PubMed] [Google Scholar]
- Engel A, Konig P, Kreiter A, Singer W. Interhemispheric synchronization of oscillatory neuronal responses in cat visual cortex. Science. 1991;252:1177–1179. doi: 10.1126/science.252.5009.1177. [DOI] [PubMed] [Google Scholar]
- Felleman DJ, Van Essen DC. Distributed hierarchical processing in the primate cerebral cortex. Cereb Cortex. 1991;1:1–47. doi: 10.1093/cercor/1.1.1-a. [DOI] [PubMed] [Google Scholar]
- Fox MD, Raichle ME. Spontaneous fluctuations in brain activity observed with functional magnetic resonance imaging. Nat Rev Neurosci. 2007;8:700–711. doi: 10.1038/nrn2201. [DOI] [PubMed] [Google Scholar]
- Fox MD, Snyder AZ, Vincent JL, Corbetta M, Van Essen DC, Raichle ME. The human brain is intrinsically organized into dynamic, anticorrelated functional networks. Proc Natl Acad Sci U S A. 2005;102:9673–9678. doi: 10.1073/pnas.0504136102. [DOI] [PMC free article] [PubMed] [Google Scholar]
- Franks NP. General anaesthesia: from molecular targets to neuronal pathways of sleep and arousal. Nat Rev Neurosci. 2008;9:370–386. doi: 10.1038/nrn2372. [DOI] [PubMed] [Google Scholar]
- Fujisawa S, Buzsaki G. A 4 Hz oscillation adaptively synchronizes prefrontal, VTA, and hippocampal activities. Neuron. 2011;72:153–165. doi: 10.1016/j.neuron.2011.08.018. [DOI] [PMC free article] [PubMed] [Google Scholar]
- Fukushima M, Saunders RC, Leopold DA, Mishkin M, Averbeck BB. Spontaneous high-gamma band activity reflects functional organization of auditory cortex in the awake macaque. Neuron. 2012;74:899–910. doi: 10.1016/j.neuron.2012.04.014. [DOI] [PMC free article] [PubMed] [Google Scholar]
- Goense JB, Logothetis NK. Neurophysiology of the BOLD fMRI signal in awake monkeys. Curr Biol. 2008;18:631–640. doi: 10.1016/j.cub.2008.03.054. [DOI] [PubMed] [Google Scholar]
- Greicius M. Resting-state functional connectivity in neuropsychiatric disorders. Curr Opin Neurol. 2008;21:424–430. doi: 10.1097/WCO.0b013e328306f2c5. [DOI] [PubMed] [Google Scholar]
- He BYJ, Snyder AZ, Zempel JM, Smyth MD, Raichle ME. Electrophysiological correlates of the brain's intrinsic large-scale functional architecture. P Natl Acad Sci USA. 2008;105:16039–16044. doi: 10.1073/pnas.0807010105. [DOI] [PMC free article] [PubMed] [Google Scholar]
- Hermes D, Miller KJ, Vansteensel MJ, Aarnoutse EJ, Leijten FS, Ramsey NF. Neurophysiologic correlates of fMRI in human motor cortex. Hum Brain Mapp. 2012;33:1689–1699. doi: 10.1002/hbm.21314. [DOI] [PMC free article] [PubMed] [Google Scholar]
- Honey CJ, Kotter R, Breakspear M, Sporns O. Network structure of cerebral cortex shapes functional connectivity on multiple time scales. Proc Natl Acad Sci U S A. 2007;104:10240–10245. doi: 10.1073/pnas.0701519104. [DOI] [PMC free article] [PubMed] [Google Scholar]
- Hughes SW, Crunelli V. Thalamic mechanisms of EEG alpha rhythms and their pathological implications. Neuroscientist. 2005;11:357–372. doi: 10.1177/1073858405277450. [DOI] [PubMed] [Google Scholar]
- Hughes SW, Lorincz M, Cope DW, Blethyn KL, Kekesi KA, Parri HR, Juhasz G, Crunelli V. Synchronized oscillations at alpha and theta frequencies in the lateral geniculate nucleus. Neuron. 2004;42:253–268. doi: 10.1016/s0896-6273(04)00191-6. [DOI] [PubMed] [Google Scholar]
- Hughes SW, Lorincz ML, Parri HR, Crunelli V. Infraslow (<0.1 Hz) oscillations in thalamic relay nuclei basic mechanisms and significance to health and disease states. Prog Brain Res. 2011;193:145–162. doi: 10.1016/B978-0-444-53839-0.00010-7. [DOI] [PMC free article] [PubMed] [Google Scholar]
- Jenkinson M. Improved unwarping of EPI images using regularised B0 maps. NeuroImage. 2001;13:S165. [Google Scholar]
- Jenkinson M, Smith S. A global optimisation method for robust affine registration of brain images. Med Image Anal. 2001;5:143–156. doi: 10.1016/s1361-8415(01)00036-6. [DOI] [PubMed] [Google Scholar]
- Jensen O, Bonnefond M, VanRullen R. An oscillatory mechanism for prioritizing salient unattended stimuli. Trends Cogn Sci. 2012;16:200–206. doi: 10.1016/j.tics.2012.03.002. [DOI] [PubMed] [Google Scholar]
- Jensen O, Colgin LL. Cross-frequency coupling between neuronal oscillations. Trends Cogn Sci. 2007;11:267–269. doi: 10.1016/j.tics.2007.05.003. [DOI] [PubMed] [Google Scholar]
- Jensen O, Mazaheri A. Shaping functional architecture by oscillatory alpha activity: gating by inhibition. Front Hum Neurosci. 2010;4:186. doi: 10.3389/fnhum.2010.00186. [DOI] [PMC free article] [PubMed] [Google Scholar]
- Jezzard P, Balaban RS. Correction for geometric distortion in echo planar images from B0 field variations. Magn Reson Med. 1995;34:65–73. doi: 10.1002/mrm.1910340111. [DOI] [PubMed] [Google Scholar]
- Jones EG. The Thalamus. Second Edition Cambridge University Press; New York: 2007. [Google Scholar]
- Kajikawa Y, Schroeder CE. How Local Is the Local Field Potential? Neuron. 2011;72:847–858. doi: 10.1016/j.neuron.2011.09.029. [DOI] [PMC free article] [PubMed] [Google Scholar]
- Katzner S, Nauhaus I, Benucci A, Bonin V, Ringach DL, Carandini M. Local origin of field potentials in visual cortex. Neuron. 2009;61:35–41. doi: 10.1016/j.neuron.2008.11.016. [DOI] [PMC free article] [PubMed] [Google Scholar]
- Kerns JG, Cohen JD, MacDonald AW, 3rd, Cho RY, Stenger VA, Carter CS. Anterior cingulate conflict monitoring and adjustments in control. Science. 2004;303:1023–1026. doi: 10.1126/science.1089910. [DOI] [PubMed] [Google Scholar]
- Klimesch W, Sauseng P, Hanslmayr S. EEG alpha oscillations: the inhibition-timing hypothesis. Brain Res Rev. 2007;53:63–88. doi: 10.1016/j.brainresrev.2006.06.003. [DOI] [PubMed] [Google Scholar]
- Kopell N, Ermentrout GB, Whittington MA, Traub RD. Gamma rhythms and beta rhythms have different synchronization properties. P Natl Acad Sci USA. 2000;97:1867–1872. doi: 10.1073/pnas.97.4.1867. [DOI] [PMC free article] [PubMed] [Google Scholar]
- Lakatos P, Karmos G, Mehta AD, Ulbert I, Schroeder CE. Entrainment of neuronal oscillations as a mechanism of attentional selection. Science. 2008;320:110–113. doi: 10.1126/science.1154735. [DOI] [PubMed] [Google Scholar]
- Lakatos P, Shah AS, Knuth KH, Ulbert I, Karmos G, Schroeder CE. An oscillatory hierarchy controlling neuronal excitability and stimulus processing in the auditory cortex. J Neurophysiol. 2005;94:1904–1911. doi: 10.1152/jn.00263.2005. [DOI] [PubMed] [Google Scholar]
- Leopold DA, Murayama Y, Logothetis NK. Very slow activity fluctuations in monkey visual cortex: Implications for functional brain imaging. Cereb Cortex. 2003;13:422–433. doi: 10.1093/cercor/13.4.422. [DOI] [PubMed] [Google Scholar]
- Logothetis NK, Pauls J, Augath M, Trinath T, Oeltermann A. Neurophysiological investigation of the basis of the fMRI signal. Nature. 2001;412:150–157. doi: 10.1038/35084005. [DOI] [PubMed] [Google Scholar]
- Lopes da Silva FH. Neural Mechanisms Underlying Brain Waves - from Neural Membranes to Networks. Electroen Clin Neuro. 1991;79:81–93. doi: 10.1016/0013-4694(91)90044-5. [DOI] [PubMed] [Google Scholar]
- Lopes da Silva FH, Storm Van Leeuwen W. The cortical source of the alpha rhythm. Neurosci Lett. 1977;6:237–241. doi: 10.1016/0304-3940(77)90024-6. [DOI] [PubMed] [Google Scholar]
- Lopes da Silva FH, Vos JE, Mooibroek J, Van Rotterdam A. Relative contributions of intracortical and thalamo-cortical processes in the generation of alpha rhythms, revealed by partial coherence analysis. Electroencephalogr Clin Neurophysiol. 1980;50:449–456. doi: 10.1016/0013-4694(80)90011-5. [DOI] [PubMed] [Google Scholar]
- Lorincz ML, Crunelli V, Hughes SW. Cellular dynamics of cholinergically induced alpha (8–13 Hz) rhythms in sensory thalamic nuclei in vitro. J Neurosci. 2008;28:660–671. doi: 10.1523/JNEUROSCI.4468-07.2008. [DOI] [PMC free article] [PubMed] [Google Scholar]
- Lu H, Zou Q, Gu H, Raichle ME, Stein EA, Yang Y. Rat brains also have a default mode network. Proceedings of the National Academy of Sciences. 2012 doi: 10.1073/pnas.1200506109. [DOI] [PMC free article] [PubMed] [Google Scholar]
- Lu H, Zuo Y, Gu H, Waltz JA, Zhan W, Scholl CA, Rea W, Yang Y, Stein EA. Synchronized delta oscillations correlate with the resting-state functional MRI signal. Proc Natl Acad Sci U S A. 2007;104:18265–18269. doi: 10.1073/pnas.0705791104. [DOI] [PMC free article] [PubMed] [Google Scholar]
- Magri C, Schridde U, Murayama Y, Panzeri S, Logothetis NK. The Amplitude and Timing of the BOLD Signal Reflects the Relationship between Local Field Potential Power at Different Frequencies. Journal of Neuroscience. 2012;32:1395–1407. doi: 10.1523/JNEUROSCI.3985-11.2012. [DOI] [PMC free article] [PubMed] [Google Scholar]
- Maier A, Adams GK, Aura C, Leopold DA. Distinct superficial and deep laminar domains of activity in the visual cortex during rest and stimulation. Front Syst Neurosci. 2010;4 doi: 10.3389/fnsys.2010.00031. [DOI] [PMC free article] [PubMed] [Google Scholar]
- Martinez-Conde S, Macknik SL, Hubel DH. The role of fixational eye movements in visual perception. Nature Reviews Neuroscience. 2004;5:229–240. doi: 10.1038/nrn1348. [DOI] [PubMed] [Google Scholar]
- Mathewson KE, Gratton G, Fabiani M, Beck DM, Ro T. To See or Not to See: Prestimulus α Phase Predicts Visual Awareness. J Neurosci. 2009;29:2725–2732. doi: 10.1523/JNEUROSCI.3963-08.2009. [DOI] [PMC free article] [PubMed] [Google Scholar]
- Matthews PM, Honey GD, Bullmore ET. Applications of fMRI in translational medicine and clinical practice. Nat Rev Neurosci. 2006;7:732–744. doi: 10.1038/nrn1929. [DOI] [PubMed] [Google Scholar]
- McCormick DA, Bal T. Sleep and arousal: thalamocortical mechanisms. Annu Rev Neurosci. 1997;20:185–215. doi: 10.1146/annurev.neuro.20.1.185. [DOI] [PubMed] [Google Scholar]
- Mitra PP, Pesaran B. Analysis of dynamic brain imaging data. Biophys J. 1999;76:691–708. doi: 10.1016/S0006-3495(99)77236-X. [DOI] [PMC free article] [PubMed] [Google Scholar]
- Mo J, Schroeder CE, Ding MZ. Attentional Modulation of Alpha Oscillations in Macaque Inferotemporal Cortex. Journal of Neuroscience. 2011;31:878–882. doi: 10.1523/JNEUROSCI.5295-10.2011. [DOI] [PMC free article] [PubMed] [Google Scholar]
- Moeller S, Nallasamy N, Tsao DY, Freiwald WA. Functional connectivity of the macaque brain across stimulus and arousal states. J Neurosci. 2009;29:5897–5909. doi: 10.1523/JNEUROSCI.0220-09.2009. [DOI] [PMC free article] [PubMed] [Google Scholar]
- Monto S, Palva S, Voipio J, Palva JM. Very slow EEG fluctuations predict the dynamics of stimulus detection and oscillation amplitudes in humans. Journal of Neuroscience. 2008;28:8268–8272. doi: 10.1523/JNEUROSCI.1910-08.2008. [DOI] [PMC free article] [PubMed] [Google Scholar]
- Mukamel R, Gelbard H, Arieli A, Hasson U, Fried I, Malach R. Coupling between neuronal firing, field potentials, and fMR1 in human auditory cortex. Science. 2005;309:951–954. doi: 10.1126/science.1110913. [DOI] [PubMed] [Google Scholar]
- Niessing J, Ebisch B, Schmidt KE, Niessing M, Singer W, Galuske RA. Hemodynamic signals correlate tightly with synchronized gamma oscillations. Science. 2005;309:948–951. doi: 10.1126/science.1110948. [DOI] [PubMed] [Google Scholar]
- Nir Y, Fisch L, Mukamel R, Gelbard-Sagiv H, Arieli A, Fried I, Malach R. Coupling between neuronal firing rate, gamma LFP, and BOLD fMRI is related to interneuronal correlations. Curr Biol. 2007;17:1275–1285. doi: 10.1016/j.cub.2007.06.066. [DOI] [PubMed] [Google Scholar]
- Nir Y, Mukamel R, Dinstein I, Privman E, Harel M, Fisch L, Gelbard-Sagiv H, Kipervasser S, Andelman F, Neufeld MY, et al. Interhemispheric correlations of slow spontaneous neuronal fluctuations revealed in human sensory cortex. Nat Neurosci. 2008;11:1100–1108. doi: 10.1038/nn.2177. [DOI] [PMC free article] [PubMed] [Google Scholar]
- Ohmoto T, Mimura Y, Baba Y, Miyamoto T, Matsumoto Y, Nishimoto A, Matsumoto K. Thalamic control of spontaneous alpha-rhythm and evoked responses. Appl Neurophysiol. 1978;41:188–192. doi: 10.1159/000102415. [DOI] [PubMed] [Google Scholar]
- Palva S, Palva JM. Functional roles of alpha-band phase synchronization in local and large-scale cortical networks. Front Psychol. 2011;2:204. doi: 10.3389/fpsyg.2011.00204. [DOI] [PMC free article] [PubMed] [Google Scholar]
- Pinsk MA, Moore T, Richter MC, Gross CG, Kastner S. Methods for functional magnetic resonance imaging in normal and lesioned behaving monkeys. J Neurosci Methods. 2005;143:179–195. doi: 10.1016/j.jneumeth.2004.10.003. [DOI] [PubMed] [Google Scholar]
- Saalmann YB, Pinsk MA, Wang L, Li X, Kastner S. The Pulvinar Regulates Information Transmission Between Cortical Areas Based on Attention Demands. Science. 2012;337:753–756. doi: 10.1126/science.1223082. [DOI] [PMC free article] [PubMed] [Google Scholar]
- Scholvinck ML, Maier A, Ye FQ, Duyn JH, Leopold DA. Neural basis of global resting-state fMRI activity. Proc Natl Acad Sci U S A. 2010;107:10238–10243. doi: 10.1073/pnas.0913110107. [DOI] [PMC free article] [PubMed] [Google Scholar]
- Schroeder CE, Lakatos P. Low-frequency neuronal oscillations as instruments of sensory selection. Trends Neurosci. 2009;32:9–18. doi: 10.1016/j.tins.2008.09.012. [DOI] [PMC free article] [PubMed] [Google Scholar]
- Seeley WW, Menon V, Schatzberg AF, Keller J, Glover GH, Kenna H, Reiss AL, Greicius MD. Dissociable intrinsic connectivity networks for salience processing and executive control. Journal of Neuroscience. 2007;27:2349–2356. doi: 10.1523/JNEUROSCI.5587-06.2007. [DOI] [PMC free article] [PubMed] [Google Scholar]
- Sherman SM, Guillery RW. Exploring the thalamus and its role in cortical function. Second Edition MIT Press; Cambridge, Mass: 2006. [Google Scholar]
- Shipp S. The functional logic of cortico-pulvinar connections. Philos Trans R Soc Lond B Biol Sci. 2003;358:1605–1624. doi: 10.1098/rstb.2002.1213. [DOI] [PMC free article] [PubMed] [Google Scholar]
- Shmuel A, Augath M, Oeltermann A, Logothetis NK. Negative functional MRI response correlates with decreases in neuronal activity in monkey visual area V1. Nat Neurosci. 2006;9:569–577. doi: 10.1038/nn1675. [DOI] [PubMed] [Google Scholar]
- Siegel M, Donner TH, Engel AK. Spectral fingerprints of large-scale neuronal interactions. Nat Rev Neurosci. 2012;13:121–134. doi: 10.1038/nrn3137. [DOI] [PubMed] [Google Scholar]
- Sil'kis IG, Bogdanova OG. Background gamma-oscillations in neuronal networks with interhemisphere connections. Neurosci Behav Physiol. 1998;28:645–659. doi: 10.1007/BF02462986. [DOI] [PubMed] [Google Scholar]
- Smith SM, Miller KL, Salimi-Khorshidi G, Webster M, Beckmann CF, Nichols TE, Ramsey JD, Woolrich MW. Network modelling methods for FMRI. Neuroimage. 2011;54:875–891. doi: 10.1016/j.neuroimage.2010.08.063. [DOI] [PubMed] [Google Scholar]
- Steriade M, Llinas RR. The Functional-States of the Thalamus and the Associated Neuronal Interplay. Physiological Reviews. 1988;68:649–742. doi: 10.1152/physrev.1988.68.3.649. [DOI] [PubMed] [Google Scholar]
- Steriade M, McCormick DA, Sejnowski TJ. Thalamocortical oscillations in the sleeping and aroused brain. Science. 1993;262:679–685. doi: 10.1126/science.8235588. [DOI] [PubMed] [Google Scholar]
- Ungerleider LG, Galkin TW, Desimone R, Gattass R. Cortical connections of area V4 in the macaque. Cereb Cortex. 2008;18:477–499. doi: 10.1093/cercor/bhm061. [DOI] [PubMed] [Google Scholar]
- Vincent JL, Patel GH, Fox MD, Snyder AZ, Baker JT, Van Essen DC, Zempel JM, Snyder LH, Corbetta M, Raichle ME. Intrinsic functional architecture in the anaesthetized monkey brain. Nature. 2007;447:83–86. doi: 10.1038/nature05758. [DOI] [PubMed] [Google Scholar]
- von Stein A, Chiang C, Konig P. Top-down processing mediated by interareal synchronization. Proc Natl Acad Sci U S A. 2000;97:14748–14753. doi: 10.1073/pnas.97.26.14748. [DOI] [PMC free article] [PubMed] [Google Scholar]
- von Stein A, Sarnthein J. Different frequencies for different scales of cortical integration: from local gamma to long range alpha/theta synchronization. Int J Psychophysiol. 2000;38:301–313. doi: 10.1016/s0167-8760(00)00172-0. [DOI] [PubMed] [Google Scholar]
- Wang L, Yu C, Chen H, Qin W, He Y, Fan F, Zhang Y, Wang M, Li K, Zang Y, et al. Dynamic functional reorganization of the motor execution network after stroke. Brain. 2010;133:1224–1238. doi: 10.1093/brain/awq043. [DOI] [PubMed] [Google Scholar]
- Wang XJ. Neurophysiological and computational principles of cortical rhythms in cognition. Physiol Rev. 2010;90:1195–1268. doi: 10.1152/physrev.00035.2008. [DOI] [PMC free article] [PubMed] [Google Scholar]
- Williams KA, Magnuson M, Majeed W, LaConte SM, Peltier SJ, Hu X, Keilholz SD. Comparison of alpha-chloralose, medetomidine and isoflurane anesthesia for functional connectivity mapping in the rat. Magn Reson Imaging. 2010;28:995–1003. doi: 10.1016/j.mri.2010.03.007. [DOI] [PMC free article] [PubMed] [Google Scholar]
- Yeo BT, Krienen FM, Sepulcre J, Sabuncu MR, Lashkari D, Hollinshead M, Roffman JL, Smoller JW, Zollei L, Polimeni JR, et al. The organization of the human cerebral cortex estimated by intrinsic functional connectivity. J Neurophysiol. 2011;106:1125–1165. doi: 10.1152/jn.00338.2011. [DOI] [PMC free article] [PubMed] [Google Scholar]
- Zhang D, Raichle ME. Disease and the brain's dark energy. Nat Rev Neurol. 2010;6:15–28. doi: 10.1038/nrneurol.2009.198. [DOI] [PubMed] [Google Scholar]
- Zhang DY, Snyder AZ, Fox MD, Sansbury MW, Shimony JS, Raichle ME. Intrinsic functional relations between human cerebral cortex and thalamus. J Neurophysiol. 2008;100:1740–1748. doi: 10.1152/jn.90463.2008. [DOI] [PMC free article] [PubMed] [Google Scholar]
Associated Data
This section collects any data citations, data availability statements, or supplementary materials included in this article.