

Abstract
The high osmolarity glycerol (HOG) pathway in yeast serves as a prototype signalling system for eukaryotes. We used an unprecedented amount of data to parameterise 192 models capturing different hypotheses about molecular mechanisms underlying osmo-adaptation and selected a best approximating model. This model implied novel mechanisms regulating osmo-adaptation in yeast. The model suggested that (i) the main mechanism for osmo-adaptation is a fast and transient non-transcriptional Hog1-mediated activation of glycerol production, (ii) the transcriptional response serves to maintain an increased steady-state glycerol production with low steady-state Hog1 activity, and (iii) fast negative feedbacks of activated Hog1 on upstream signalling branches serves to stabilise adaptation response. The best approximating model also indicated that homoeostatic adaptive systems with two parallel redundant signalling branches show a more robust and faster response than single-branch systems. We corroborated this notion to a large extent by dedicated measurements of volume recovery in single cells. Our study also demonstrates that systematically testing a model ensemble against data has the potential to achieve a better and unbiased understanding of molecular mechanisms.
Keywords: adaptation, ensemble modeling, Hopf bifurcation, model discrimination, osmotic stress
Introduction
The high osmolarity glycerol (HOG) pathway in the yeast Saccharomyces cerevisiae is one of the best-studied mitogen-activated protein kinase (MAPK) pathways and serves as a prototype signalling system for eukaryotes. This pathway is necessary and sufficient to adapt to high external osmolarity. A key component of this pathway is the stress-activated protein kinase (SAPK) Hog1, which is rapidly phosphorylated by the SAPK kinase Pbs2 upon hyper-osmotic shock, and which is the terminal kinase of two parallel signalling pathways, subsequently called the Sho1 branch and the Sln1 branch, respectively. Either of these branches is necessary for adaptation (Hohmann, 2002) and they converge on Pbs2. In the Sln1 branch, Pbs2 acts in a classical three-tiered stress or MAPK pathway, where the MAPK kinase kinases Ssk2 and Ssk22 are activated by an upstream phospho-relay system controlled by the sensor Sln1 (Posas et al, 1996). In the Sho1 branch, Pbs2 acts as a scaffold, involving membrane-associated Sho1 and the MAPK kinase kinase Ste11 (Tatebayashi et al, 2003, 2007; Yamamoto et al, 2010). Why two parallel redundant pathways have been conserved through evolution remains elusive, even more so because components of the Sho1 branch are also involved in two other MAPK pathways and crosstalk seems to be actively prevented (O’Rourke and Herskowitz, 1998; Nelson et al, 2004; Schwartz and Madhani, 2004; Yamamoto et al, 2010).
It is generally agreed that the main mechanism of short-term adaptation to osmotic shock in yeast is through the accumulation of the osmolyte glycerol (Nevoigt and Stahl, 1997; Rep et al, 1999; Hohmann, 2002; O’Rourke et al, 2002; Klipp et al, 2005; Muzzey et al, 2009), which balances the internal and external water potential differences and therefore re-establishes pre-stress volume (Schaber and Klipp, 2008; Schaber et al, 2010), effectively terminating the signal. However, it is debated which are the main processes regulating glycerol accumulation. Some argue in favour of glycerol production (Rep et al, 1999; Dihazi et al, 2004; Muzzey et al, 2009), whereas others also see an important role in glycerol retention by closing the glyceroporin Fps1 (Luyten et al, 1994; Tamas et al, 1999; Klipp et al, 2005; Mettetal et al, 2008). In addition, the important mechanisms regulating those two main processes of glycerol accumulation remain poorly understood. Increase in glycerol production is classically viewed to be a function of the abundance of the glycerol-3-phosphate dehydrogenases Gpd1 and Gpd2, which in turn are regulated at the transcriptional level by Hog1 (Albertyn et al, 1994; Rep et al, 1999; Hohmann, 2002). However, there is also evidence that activated Hog1 might directly or indirectly redirect the glycolytic flux from ethanol towards glycerol, possibly at the post-transcriptional level (Dihazi et al, 2004). Loss of glycerol through Fps1 is at least partly controlled by Hog1, either by direct or indirect interaction or both (Tamas et al, 2003; Beese et al, 2009). There is also evidence for a Hog1-independent mechanism regulating closure of Fps1, possibly activated directly by a reduction in the cell’s volume and/or its turgor pressure (Tamas et al, 2000; Reiser et al, 2003; Schaber et al, 2010).
Glycerol accumulation may be viewed as an integral feedback control mechanism, which integrates the difference between the desired steady-state and the actual state of the system, measured by Hog1 activation, over time (Mettetal et al, 2008). However, it remains unclear what the feedback acts upon. Again, it seems to be related to volume and/or turgor pressure (Tamas et al, 2000; Reiser et al, 2003; Schaber et al, 2010). Apart from this general integral feedback control mechanism, which undoubtedly is the main determinant of osmo-adaptation in yeast, other transient feedback mechanisms mediated by activated Hog1 have been proposed to act on the signal transduction pathway.
In the Sho1 branch, Hao et al (2007) showed that Hog1 binds and phosphorylates the membrane protein Sho1. They proposed that this phosphorylation acts as a rapid transient negative feedback responsible for the rapid attenuation of the Hog1 activity. However, a recent model discrimination analysis suggested that the experimental data in Hao et al. (2007) did rather support a model with an integral feedback through glycerol accumulation, rendering the role of the suggested transient feedback unclear (Schaber et al, 2011). It was also shown that Hog1 phosphorylates Ste50 (Hao et al, 2008; Yamamoto et al, 2010) and thereby shortens the duration of Hog1 activation (Yamamoto et al, 2010), which further supports the notion of a transient negative feedback within the Sho1 branch.
In the Sln1 branch, Macia et al (2009) proposed the existence of a fast transient negative feedback mechanism. They suggested that the role of this feedback regulation was to increase efficiency and reduce response time. However, the data in Macia et al. could also be explained by alternative mechanisms. It also seems likely that the importance of the various regulatory mechanisms may vary over the course of the response (Klipp et al, 2005; Klipp and Schaber, 2008) and probably with the intensity of the shock.
Therefore, we systematically addressed the question of which of the many possible regulation and feedback mechanisms or combinations thereof are best supported by the available data. To this end, we compiled an unprecedented amount of published and comparable dynamic data on the HOG pathway activation. We fitted an extensive set of parsimonious models representing different hypotheses about the underlying biological regulatory mechanisms to one part of the data. Another part of the data was used to test the predictive properties of the various models. Subsequently, models were ranked according to both their goodness of fit and their predictive properties. Then, the highest scoring models were used to generate new predictions, which were partly tested by dedicated additional experiments. In this way, we obtained a model that was well supported by the data and that provided new insights into the importance of several regulatory and feedback mechanisms acting during osmo-adaptation, which might be of general importance in adaptation mechanisms.
The model suggested that (a) the main adaptation mechanism is through the increase in glycerol production by fast transient post-translational mechanisms, rather than translational mechanisms or glycerol retention as previous studies had suggested; (b) glycerol retention is the second mechanism in importance, which is also fast and acts through closure of the glycerol channel; (c) the slow mechanism, via induction of gene expression, serves predominantly to reset the steady state of the system after adaptation to near pre-stress levels, replacing the short transient mechanisms by a slower but less Hog1-dependent and sustained process; and (d) we found that transient negative feedback mechanisms acting on the upstream signalling branches have only a minor role for adaptation. The models rather suggested that fast transient negative feedbacks serve to stabilise the integral feedback response in terms of preventing oscillatory behaviour, which may occur in systems with delayed negative feedback. The first three mechanisms directly act upon the accumulation of glycerol thereby modulating the integral feedback response, which terminates the signal and re-establishes homeostasis. Therefore, in the following, we refer to such mechanisms as homeostatic feedbacks.
The model also provided an explanation for why there are two redundant parallel signalling pathways. Simulation studies suggested that the mean adaptation time for the wild-type yeast is faster and more robust to variations in initial state and parameters than for the single-branch mutants, especially for weak stress. By dedicated experiments, we could corroborate the prediction that wild-type yeast adapts faster than single-branch mutants. The notion that adaptation in wild-type yeast is also more robust could only be corroborated for low osmotic stress, which might be more relevant in the natural environment.
Results
The best approximating models have excellent explanatory as well as predictive properties
We constructed an ensemble of 192 models, their differences reflecting uncertainties about molecular mechanisms underlying osmo-adaptation and representing different hypotheses thereof (Figure 1, Supplementary Tables S1–S7 and see Materials and methods section for details on model construction). The free kinetic parameters of the models were fitted to an unprecedented amount of dynamic data (Figure 2), including time series for Hog1 phosphorylation, mRNA, protein, glycerol and volume for a range of different conditions and mutants. In addition, the predictive properties of the models were tested with another data set (Figure 3A and B), that was not used to parameterise the models. Models were ranked according to goodness of both fit and predictive properties using the Akaike Information Criterion (AIC) (see Materials and methods section and Supplementary Tables S8–S10). Both with and without taking into account predictions (Figure 3A and B), the same model was consistently selected as best approximating model (Model Nr. 22, Supplementary Tables S9 and S10). However, there were three models with an Akaike weight (AICw)>0.05 (see Materials and methods section) considering both ranking methods (Model Nr. 22, 30 and 78, Supplementary Tables S9 and S10). These three best approximating models exhibited only marginal differences in both fits and predictions (see SSRs in Supplementary Tables S9 and S10). These models differed in the way they modelled the total amount of Fps1. Model Nr. 30 and Model Nr. 78 included Fps1 production and degradation reactions (reactions v17 and v18 in Figure 1), the latter modified by activated Hog1 and protein, respectively. However, Fps1 degradation was negligible, because the fitted degradation rates were very small. Therefore, in the following, we show only results for the best approximating model Nr. 22, even though most results also hold for the other two models. Model Nr. 22 had 20 free parameters, which constitutes to our knowledge the lowest ratio of parameters to data points of all published HOG models. In Figure 1, the best approximating model (Nr. 22) is indicated by solid and dashed lines. An implementation of Model Nr. 22 in COPASI format (Hoops et al, 2006) and SBML format (Hucka et al, 2003) together with the data used for fitting and prediction can be found in the online Supplementary Material. COPASI is a free and open source software available from www.copasi.org. The SBML model can also be downloaded from the Biomodels database (accession number MODEL1209110001).
Figure 1.

All components and reactions considered in the model ensemble in SBGN format. Optional reaction and modifying influences are marked with dashed and dotted lines. Dashed black lines represent modifiers, which are present in the best approximating model (model Nr. 22, Supplementary Tables S1–S7).
Figure 2.
Data (dots with error bars) used for model parameterisation and corresponding model fits (lines) of the best approximating model. (A) Hog1 phosphorylation of Sln1 branch mutant (ste50Δ) for different osmotic shocks. (B) Hog1 phosphorylation of Sho1 branch mutant (ssk2Δ ssk22Δ) for several osmotic shocks. (C) mRNA, Gpd1 and glycerol time series for 0.5 M NaCl. (D) Hog1 phosphorylation of Sho1 and Sln1 branch mutants of Hog1as strain upon addition of 5 μM Hog1 inhibitor SPP86. (E) Hog1 phosphorylation of wild-type and Fps1Δ1 mutant for 0.4 M NaCl, whereas only the Fps1Δ1 was used for fitting; the wild-type data are shown here only for comparison. A,B,D and E from Macia et al (2009). (F) Derived volume time curves for 0.1 and 0.2 M NaCl. Shades show interquartile range of corresponding measured single-cell volume after the indicated osmotic shock (see main text and Figures 10 and 11). Error bars indicate s.d.’s from at least three independent experiments. C contains data from (Klipp et al, 2005). Data in F were derived by assuming that volume mirrors Hog1 profile and minimal volumes from (Schaber et al, 2010). Not all data points used for fitting are shown. For each time series, we repeated the first data point six times for technical reasons, these are not shown. The simulations for cellular components are corrected for volume change. All Hog1 phosphorylation data are comparable by their relative levels and are scaled to the amount of the ste50Δ mutant at 10 min. Source data is available for this figure in the Supplementary Information.

Figure 3.
Data and model predictions for the best approximating model. Data sets in panels (A, B) were included in the ranking procedure. (A) Hog1 phosphorylation of wild-type W303 for different osmotic shocks. (B) Hog1 phosphorylation of Hog1as wild type upon addition of 5 μM Hog1 inhibitor SPP86. (C) Hog1 phosphorylation of a Pbs2as mutant at 0.2 M NaCl and various inhibitor concentrations. The wild-type simulation (green line) is covered by the 1 μM SPP86 simulation (light red line). (D) Hog1 phosphorylation of Hog1as in a Fps1Δ1 mutant upon addition of 5 μM Hog1 inhibitor SPP86 (brown line) and Hog1 phosphorylation of Hog1as wild type upon addition of 5 μM Hog1 inhibitor SPP86 and 3 μg/ml thiolutin (blue line). All data from Macia et al (2009). The simulations for cellular components are corrected for volume change. All Hog1 phosphorylation data are comparable by their relative level and are scaled to the amount of the ste50Δ mutant at 10 min (Figure 2A). Source data is available for this figure in the Supplementary Information.

In general, the selected models exhibited an excellent parsimonious data representation, especially for the fitted single-branch Hog1 phosphorylation time series for different conditions (Figure 2A, B and D) and wild-type Fps1Δ1 mutant (Figure 2E). Also wild-type mRNA, Gpd1 and glycerol data (Figure 2C) could be well fitted. Only the artificial volume data (see Materials and methods) for 0.2 M NaCl shock could not be well fitted, showing an accelerated simulated volume recovery (Figure 2F, green line). However, the best approximating models excelled at predicting wild-type Hog1 phosphorylation time series for different conditions (Figure 3A and B), even though we mostly used the single-branch mutants to parameterise the models (Figures 2A, B and D). These predictions were also used for the model selection procedure.
We further tested the predictive properties of the models with three additional experiments from Macia et al. (2009) (Figure 3C and D) that were not used for model selection. The models were able to predict well Hog1 phosphorylation time series when (a) Pbs2 kinase activity is inhibited, assuming that an inhibitor concentration of 1, 3 or 5 μM corresponds to a decrease in Pbs2 phosphorylation activity (reactions v5 and v7 in Figure 1) of 0%, 75% or 99%, respectively (Figure 3C), (b) Hog1 kinase activity is inhibited in the Fps1Δ1 mutant (Figure 3D, brown line) and (c) Hog1 kinase activity is inhibited and simultaneously transcription is blocked by thiolutin (Figure 3D, blue line).
The HOG pathway was shown to act as a low-pass filter regarding the frequency of salt shocks (Hersen et al, 2008). We simulated the response of the best approximating model Nr. 22 to square-wave stimuli of 0.2 M NaCl with periods ranging from P0=2 min to P0=64 min (Supplementary Figure S1). Using Fourier analysis, we approximated the simulations by sine wave oscillations with a period of P0=2π/ω and calculated frequency-dependent output amplitude A(ω), which is represented in a Bode plot (Supplementary Figure S3) as in Mettetal et al (2008). We also compared our simulated frequency-dependent amplitude A(ω) with re-analysed data from Mettetal et al. (2008) (Supplementary Figure S2). The model simulations show an increasing frequency-dependent amplitude A(ω) with decreasing frequency ω, like both the results from Hersen et al (2008) and the re-analysed data from Mettetal et al (2008). Thus, the best approximating model can well reproduce the reported low-pass filter characteristics of the HOG pathway (for details refer to the Supplementary Material).
A sensitivity analysis of the adaptation time (assessed as the time to recover pre-stress volume) showed that the model is in general robust to changes in both kinetic parameters and initial conditions. All absolute sensitivities were <1, except for the rate constant of reaction v13 (glycerol production) and initial turgor pressure, both having a maximal absolute sensitivity of 2.4 (Supplementary Table S13). A sensitivity of 1 indicates a direct proportional change of adaptation time with respect to a certain parameter (see Supplementary Material).
In the course of model analysis, reaction v13, that is, Hog1-modified glycerol production (Figure 1), turned out to be important for our conclusions (see below). As Hog1 modification of glycerol production was modelled by a simple heuristic approach owing to the lack of a detailed mechanism, we also tested other possible kinetic rate laws for reaction v13 in the three best approximating models Nr. 22, Nr. 78 and Nr. 30 that had an AICw >0.05 (see Materials and methods section, Supplementary Tables S11 and S12). The kinetic rate law for reaction v13 used in the original model formulation was best supported by the data and, thus, the ranking of at least the three best approximating models was robust to changes in this kinetic rate law. The large difference in the performance between the original and the other tested kinetics suggests that this result is also valid for the other models (Supplementary Table S12).
Seven out of 20 parameters were not identifiable within the tested range, especially concerning the upper confidence limit, as revealed by an identifiability analysis calculating one-dimensional likelihood profiles (Raue et al, 2009; Schaber 2012) (Supplementary Figure S4). This is due to lack of data, especially shortly after shock, a time when the system is highly dynamic. However, all fitted parameters were at a local minimum and more than half of them were identifiable (Supplementary Figure S4).
The model correctly predicts effect of wild-type and single-branch inhibition
Hao et al (2007) proposed a transient negative feedback mechanism in the Sho1 branch, showing that Hog1 directly interacts with and phosphorylates Sho1, and that this phosphorylation attenuates Hog1 activation. We mimicked their experiments in a simulation with or without feedback, and with a Hog1-independent constitutive feedback on the Sho1 branch. Despite the simplistic model formulation, the best approximating model (Nr. 22) shows the same dynamic behaviour as measured by Hao et al (2007) (see Figure 5B therein), where blocking the feedback increases Hog1 phosphorylation levels and a constitutive feedback decreases Hog1 phosphorylation levels upon osmotic shock (Supplementary Figure S6).
Thus, the best approximating model is not only able to recapitulate a large amount of data, but it is also able to predict an unprecedented range of mutants and experimental conditions both qualitatively and quantitatively. This gave us confidence that the model captures the main mechanism of osmo-adaptation in yeast and that we could use it to further study these mechanisms.
Direct non-transcriptional modification of glycerol production by Hog1 is the main mechanism responsible for Hog1 phosphorylation upon inhibition of Hog1 activity
Macia et al (2009) observed an increase in phosphorylation of Hog1 following chemical inhibition of its kinase activity, even under non-stressed conditions (Figures 2D and 3B). They attributed this behaviour to a rapid and transient negative feedback of Hog1 on the signalling branch activated by the Sln1 branch, as the Sho1 branch mutant did not show this behaviour (Figure 2D, green line). They discarded two homeostatic negative feedbacks (closure of Fps1 and induction of Gpd1 expression) by showing that a mutant with a constitutively open Fps1 channel or with blocked transcriptional activity still exhibited the same increase in Hog1 phosphorylation after its inhibition (Figure 3D). However, we were not satisfied with their conclusions, because they disregarded the possibility of other Hog1-mediated homeostatic feedback mechanisms.
Thus, we decided to further investigate the importance of the individual mechanisms responsible for the measurements done by Macia et al using our best approximating model (Nr. 22), which could reproduce and predict well all these data (Figures 2D, 3B and D). To this end, we again simulated Hog1 phosphorylation time series during a Hog1 kinase inhibition experiment as shown in Figures 2D, 3B and D. However, this time instead of removing (setting the appropriate parameters to zero) all modifying influences of activated Hog1, which would mimic complete inhibition of the kinase, we removed all but one of these modifying influences at a time. This way, we could selectively test which of the proposed feedback mechanisms is responsible for the observed Hog1 phosphorylation upon kinase inhibition, because if the responsible feedback would still be active despite of other feedbacks being blocked, no Hog1 activation should be observed. Specifically, we tested situations where all Hog1-mediated feedbacks we deleted except one of the following four: (a) upstream signalling branch feedback (branch FB only), (b) Hog1-mediated induction of transcription (transcriptional FB only), (c) direct activation of glycerol production (Hog1–glycerol FB only) or (d) closure of Fps1 channel (Fps1 FB only). The results are shown in Figure 4.
Figure 4.

Simulated Hog1 phosphorylation and corresponding intracellular glycerol concentrations. Shown are simulation scenarios, where all except one Hog1-mediated feedbacks (FBs) are blocked at time 0 by addition of 5 μM SPP86 kinase inhibitor in the absence of osmotic shock. Blue line: all FBs are blocked in the respective branch (see also Figure 2D). Red line: only Hog1 feedback on upstream signalling is kept active. Grey line: only Hog1 feedback on Fps1 closure is kept active. Green line: only Hog1-mediated transcription is kept active. Orange line: only Hog1-mediated glycerol production is kept active. (A) Hog1 phosphorylation time series for the Sln1 branch. (B) Hog1 phosphorylation time series for the Sho1 branch. (C) Glycerol time series for the Sln1 branch. (D) Glycerol time series for the Sho1 branch. In panels (B–D) the mutant simulation (blue line) is covered by the respective ‘branch FB only’-simulation (red line).
Sln1 branch mutant (disabled Sho1 branch)
When only the Hog1 feedback on upstream signalling remains functional (reactions v1 and v3 in Figure 1, ‘branch FB only’), after addition of Hog1 kinase inhibitor, Hog1 still becomes phosphorylated, though to a lesser extent than in the simulation with all feedbacks blocked (all FBs off) (Figure 4A, compare blue and red lines). A similar simulation output is observed when Hog1 activity remains functional only towards Fps1 closure (reaction v16 in Figure 1, Figure 4A, ‘Fps1 FB only’, grey line). When only Hog1-dependent induction of gene expression remains enabled in the model, we see initially the same behaviour as if all feedbacks were blocked, but at later times Hog1 phosphorylation decreases again, reflecting increasing protein production and subsequent increased glycerol production (Figure 4A, ‘transcriptional FB only, green line). Thus, our model indicates that the above mentioned feedbacks can only partly explain the observed behaviour. In contrast, there is almost no simulated Hog1 phosphorylation when the direct Hog1-mediated modification of glycerol production is the only remaining functional feedback upon kinase inhibition (Figure 4A, ‘Hog1 glycerol FB only’, orange line). This demonstrates that in our model, and for the Sln1 branch, the main mechanism leading to Hog1 phosphorylation upon addition of inhibitor is inhibition of direct (non-transcriptional) Hog1-mediated glycerol production. Accordingly, simulations of the dynamics of intracellular glycerol concentration and corresponding branch activation (Figure 4C, Supplementary Figure S7) further support this mechanism, as inhibition of Hog1 activity leads to a rapid downregulation of steady-state glycerol production, leading to a decrease in the simulated internal glycerol. This reduction leads to an osmotic stress, which in turn leads to pathway activation.
Sho1 branch mutant (disabled Sln1 branch)
For the Sho1 branch mutant, the model shows almost no Hog1 phosphorylation for the simulated scenarios (Figure 4B). This is what Macia et al (2009) observed experimentally (Figure 2D). They interpreted this result as evidence for a lack of feedback of Hog1 on the Sho1 branch. Here, our model suggests that the reason is not the lack of such feedback, which was experimentally confirmed to exist (Hao et al, 2007; Yamamoto et al, 2010), but the low sensitivity of the Sho1 branch to mild osmotic stresses. In this mutant, the drop in internal glycerol caused by inhibition of Hog1 is comparable to that in the Sln1 branch mutant (Figure 4D), but it is insufficient to activate the Sho1 branch (Supplementary Figure S7).
Direct non-transcriptional modification of glycerol production by Hog1 is the main adaption mechanism to osmotic stress
Our modelling analysis of the mechanisms leading to Hog1 phosphorylation after inhibition of its kinase activity suggests that rapid non-transcriptional modification of glycerol production by Hog1 is the main mechanism of adaptation. This notion is further supported by an analysis of activated Hog1 and volume time series under osmotic stress conditions (Figure 5).
Figure 5.

Simulated Hog1 phosphorylation and volume dynamics for 0.4 M NaCl osmotic shock for cases where several feedback mechanisms are selectively shut off. W/o denotes ‘without’. FB denotes feedback. Blue line: wild type. Brown line: without Hog1-mediated feedback on both upstream signalling branches. Orange line: without Hog1-mediated feedback on the Sho1 branch. Light orange line: without Hog1-mediated feedback on the Sln1 branch. Dark grey line: without Fps1 closure. Grey line: without Hog1-mediated Fps1 closure. Light grey line: without turgor-mediated Fps1 closure. Green line: without transcription. Red line: without Hog1-mediated glycerol production.
Abrogating direct non-transcriptional Hog1-mediated activation of glycerol production substantially prolongs adaption to 0.4 M NaCl osmotic shock (Hog1-PP modification of v13 in Figure 1, red lines in Figure 5) compared with the wild type (blue lines in Figure 5) both in terms of Hog1 phosphorylation and volume recovery. Disabling other mechanisms having a direct role in glycerol accumulation (Fps1 channel closure, i.e., Hog1-PP and turgor modifications of reaction v15 and v16 in Figure 1, grey lines in Figure 5) and transcription/translation (Hog1-PP modification of v9 in Figure 1, green line in Figure 5) do not prolong Hog1 phosphorylation and volume recovery as strongly as disabling the non-transcriptional Hog1-glycerol feedback. Concerning Fps1 channel closure, the effects of activated Hog1 and turgor are additive, where turgor has a more pronounced role in channel closure. Interestingly, the effect of disabling transcription is an increase in the final steady-state level of activated Hog1 rather than prolonged adaptation time (see green lines for volume and Hog1-PP in Figure 5). Disabling the direct feedback of Hog1 to the Sln1 and the Sho1 branch (Hog1-PP modification reaction v1 and v3 in Figure 3, orange lines in Figure 5) increased the maximal Hog1 phosphorylation level and had almost no effect on the timing of volume recovery.
Taken together, the analyses of the best approximating model suggest that the main mechanism for Hog1 and volume adaptation is a fast and transient non-transcriptional Hog1-PP-mediated activation of glycerol production. The transcriptional response rather serves to maintain an increased steady-state glycerol production with low steady-state Hog1 activity after adaptation. Fps1 channel closure also has a substantial role in adaptation, whereas the influence of the transient feedbacks on the signalling cascade is small.
Transcriptional modification of glycerol production by Hog1 serves to sustain adaptation and prepares for subsequent shocks
The analysis above suggests that the role of the transcriptional feedback is to control the steady-state level post adaptation rather than adaptation dynamics. Indeed, when protein levels related to glycerol production stay constant in our model instead of being upregulated upon osmotic shock, Hog1 steady-state activation is elevated after adaptation relative to normal conditions (Figure 5). Moreover, upon simulation of consecutive increases of the external osmolarity the cell is less able to adapt in terms of both volume and Hog1 activity (Figure 6A), whereas under normal transcriptional activity, the response remains the same upon each consecutive shock. For the case of three consecutive shocks, this has been observed experimentally (Schaber et al, 2011).
Figure 6.

Simulations for multiple consecutive osmotic shocks (A, left panels) and multiple hyper–hypo-osmotic shocks (B, right panels). The upper panels show the respective input osmotic shocks [M NaCl]. The lower panels show the respective simulations. The full and light-coloured lines show the corresponding model simulations with and without transcriptional feedback, respectively.
We observe a similar behaviour upon simulating multiple hyper–hypo-osmolarity shock cycles (Figure 6B). When Hog1-mediated gene expression is functional, after each hyper–hypo-osmolarity shock pair of the same strength, the simulated cell needs less and less time to adapt to the following hyper–hypo shock and the volume changes less and less, as well. This is because of the increasing internal glycerol production capacity. Accordingly, Hog1 phosphorylation amplitude decreases (see also Supplementary Figure S1). When the increase in glycerol production capacity is disabled, cells are less able to prepare to a subsequent shock and need correspondingly more time to adapt. Such a behaviour has been reported before (Mettetal et al, 2008), which further supports our model. However, this result should be taken with care, because the hypo-shock response, which activates the cell wall integrity pathway, might interfere with the hyper-shock response regulated by the HOG pathway.
Rapid feedback on signalling branches stabilises adaptation response
We observed that disabling the Hog1-PP-mediated feedback on the upstream signalling branches did not have a marked effect on adaptation dynamics (orange lines in Figure 5). In fact, without these feedbacks, Hog1 activation levels returned even faster to steady-state levels than with feedback, because of the higher maximal Hog1 activation and the corresponding boost of glycerol production. This prompted the question as to why the best approximating model included these feedbacks at all and, the related question, as to what they are good for. First, we observed that the best approximating model without the branch feedbacks displayed slightly damped oscillations (orange lines in Figure 5). Second, as mentioned in the Materials and methods section, we excluded models that showed oscillatory behaviour after adaptation from the model selection procedure (Supplementary Table S8). This is because we assumed that the real system does not exhibit this behaviour, as even careful single-cell analyses did not reveal oscillatory behaviour (Mettetal et al, 2008; Muzzey et al, 2009). We analysed the percentage of models with oscillatory behaviour among models with or without transient feedbacks on the signalling branches and with or without non-transcriptional Hog1-PP-mediated glycerol production. We noticed that including either of these feedbacks reduced the percentage of oscillating models in the respective category (Figure 7). Thus, models including transient feedbacks had a higher chance of being part of the discrimination procedure, because they were less prone to oscillatory behaviour.
Figure 7.

Percentage of oscillating models in four different model categories. Gpd1+<2BFBs: transcriptional feedback (Gpd1) with less than two Hog1-mediated upstream signalling branch feedbacks (2BFBs). Gpd1+2BFBs: transcriptional feedback (Gpd1) with both Hog1-mediated upstream signalling branch feedbacks (2BFBs). Gpd1+Hog1+<2BFBs: transcriptional feedback (Gpd1) with Hog1-mediated glycerol production (Hog1) and less than two Hog1-mediated upstream signalling branch feedbacks (2BFBs). Gpd1+Hog1+2BFBs: transcriptional feedback (Gpd1) with Hog1-mediated glycerol production (Hog1) and both Hog1-mediated upstream signalling branch feedbacks (2BFBs).
More than 70% of models with only transcriptional feedback (Figure 7, Gpd1) and less than two feedbacks on the signalling branches (Figure 7, <2 BFB) showed oscillatory behaviour. Including both transient feedbacks on the signalling branches (2 BFB in Figure 7) or the rapid (non-transcriptional) Hog1-PP-mediated glycerol production (Hog1 in Figure 7) decreased the percentage of oscillating models (Figure 7). Finally, only 25% of models including the three fast mechanisms (both branch feedbacks and the rapid Hog1 control on glycerol production) showed oscillatory behaviour. Taken together, it seems that transient feedbacks stabilise the adaptation response in terms of avoiding or making it less prone to oscillatory behaviour, at least for our parameterised models.
We hypothesised that this might be a more general feature of delayed negative feedback systems, including fast transient feedbacks. To further investigate this hypothesis, we developed a simple and more general model (Figure 8A). This generic model consisted only of four components and included the main features and feedback mechanisms of the complete model, that is, a non-zero steady state, Hog1 activation, transcription, translation, glycerol production, an integral feedback control via glycerol accumulation, and two fast transient Hog1-PP-mediated feedbacks: one on Hog1 activation itself and one on glycerol production. The model had only three kinetic parameters (see Supplementary Material for a detailed description). With arbitrary parameters and initial conditions, the model exhibited general adaptation behaviour upon osmotic shock (Figure 8B); however, without either of the two transient feedbacks (dashed lines in Figure 8A), the model showed stable oscillations after adaptation (Figure 8C).
Figure 8.

Generic HOG model. (A) Wiring scheme. Optional feedbacks are dashed. For details on the implementation refer to the Supplementary Material (B) Simulation with both transient feedbacks, that is, dashed lines in (A and C): simulation without transient feedbacks, that is, dashed lines in (A). Shown are simulations for NaCl (dotted line), activated Hog1 (grey line) and glycerol (black line). Simulation were done with T0=0.02, [Hog1]0=0.05, [RNA]0=0.01, [Protein]0=0.03, E0=[Glycerol]=0.3, Ht=1, k=0.1, [NaCl]=0.5, Ki=0.1, n=2.
Using this model, we systematically studied the stability of the steady state after adaptation as a function of the base signal T0 and the input signal NaCl (Figure 9). Assuming mass-action kinetics and the same reaction parameters for reactions v1, v3, v5 and v7, there were only one to three free kinetic parameters, depending on the model, which had only minor influence on the stability behaviour (see Supplementary Material). In Figure 9, we plot the sign of the real part of the maximum eigenvalue of the linearised system at steady state. If negative, that is, white squares in Figure 9, the steady state is stable and no sustained oscillations are possible. A computational analysis revealed that when the real part of the maximum eigenvalue changes from negative to positive, that is, grey squares in Figure 9, there is a single pair of complex conjugated eigenvalues crossing the imaginary axis and the remaining two eigenvalues remain negative. This is the hallmark of a Hopf bifurcation giving rise to, in our case, stable oscillations. We illustrate this by bifurcation diagrams of Hog1PP equilibria as a function of T0 for selected values of NaCl (see Supplementary Figure S5). We observed that including one or both of the transient feedbacks drastically reduced the region in the T0-NaCl plane where the steady state was unstable and oscillations occurred, rendering the model including both transient feedbacks stable for the whole range of tested input conditions (Figure 9).
Figure 9.

Real parts of the maximum eigenvalues of the Jacobian matrix of the simplified HOG model from Figure 8 at steady state including different feedback mechanisms. Grey squares indicates maximum eigenvalues >0, that is, unstable steady states, white squares indicate maximum eigenvalues <0, that is, stable-steady states. Unstable steady states coincide with stable oscillations owing to a Hopf bifurcation, which was checked by a computational bifurcation analysis (see Supplementary Material and Supplementary Figure S5).
In combination with our observation from the model fits of the complete models, this provides support to the hypothesis that a potential biological role of those proposed transient feedbacks is the stabilisation of the adaptation response by avoiding oscillatory behaviour, which can occur in delayed negative feedback systems (Kholodenko, 2000).
Both branches synergistically elicit a swifter and more robust osmo-adaptation than a single branch alone
One of the purposes of this study was to address the question of why yeast maintained two redundant signalling pathways in the course of evolution. We addressed this question using our model. Specifically, we tested a hypothesis inspired by recent work stating that it is extremely costly for cells to increase noise suppression in signalling networks owing to molecular fluctuations (Lestas et al, 2010). One possible way to improve noise suppression is to evolve parallel signalling systems, because each signalling pathway contributes independent information about the upstream state (Lestas et al, 2010). We reasoned that the adaptation time is one of the main components that cells optimised throughout evolution, because it brings a selective advantage. Cells that are able to adapt faster and more robustly may resume normal growth and cell division faster and out-compete cells that recover more slowly. Therefore, we tested robustness of the adaptation time for single-branch mutants and the wild type by a Monte–Carlo simulation approach. This stochastic approach mimics the natural cell to cell variability observed in a population (Colman-Lerner et al, 2005, Gaudet et al, 2012). We simultaneously perturbed free parameters and initial conditions within a window of 25% plus or minus of their original value and calculated the time the system needs to regain 98% or 95% of their original volume after an external shock.
For all simulated conditions, the wild-type model had a significantly shorter mean and median adaptation time than each branch alone (P<0.01, using two robust tests for location, i.e., U-test and Kolmogoroff–Smirnov test) (Tables I and II and Supplementary Table S14). This effect was especially pronounced for low and intermediate osmotic shocks (0.1 and 0.2 M NaCl), and it is a consequence of the partly additive effects of the two branches during the response to low stress (Supplementary Figures S8 and S9). Moreover, the wild type was significantly more robust than the single-branch mutants to changes in parameters and initial conditions (P<0.01, using two robust tests for scale, i.e., Siegel–Tukey test and Conover test), which was evidenced by its smaller interquartile ranges and s.d.’s (Tables I and II and Supplementary Table S14).
Table 1. Adaptation time(min) for 0.1 M NaCl.
| Simulated (99%) |
Measured (100%) |
|||||
|---|---|---|---|---|---|---|
| Wt | Sln1 | Sho1 | Wt | Sln1 | Sho1 | |
| Mean | 9.3 | 11.1 | 22.3 | 6.9 | 9.7 | 10.4 |
| Median | 9.0 | 10.3 | 21.1 | 5.6 | 10.1 | 9.6 |
| IRQ | 3.0 | 4.4 | 9.1 | 3.9 | 5.7 | 7.1 |
| U-test | *** | *** | *** | — | *** | *** |
| K–S test | *** | *** | *** | *** | *** | *** |
| S–T test | *** | *** | *** | * | *** | *** |
| C test | *** | *** | *** | — | *** | *** |
| N | 500 | 500 | 500 | 192 | 277 | 242 |
Abbreviations: IRQ, inter-quartile range; N, number of cells; K–S, Kolmogoroff–Smirnov; S–T, Siegel–Tukey; C, Conover.
—, P>0.1; *, P<0.1; **, P<0.05; ***, P<0.01. Significance wt, test between Sln1 and Sho1; significance Sln1, test between Sln1 and wt; significance Sho1, test between Sho1 and wt.
Table 2. Adaptation time (min) for 0.2 M NaCl.
| Simulated (95%) |
Measured (100%) |
|||||
|---|---|---|---|---|---|---|
| Wt | Sln1 | Sho1 | Wt | Sln1 | Sho1 | |
| Mean | 9.6 | 10.7 | 14.4 | 10.8 | 13.0 | 15.2 |
| Median | 9.4 | 10.2 | 13.5 | 10.9 | 12.9 | 15.0 |
| IRQ | 2.6 | 3.1 | 4.8 | 4.5 | 4.4 | 2.6 |
| U-test | *** | *** | *** | *** | *** | *** |
| K–S test | *** | *** | *** | *** | *** | *** |
| S–T test | *** | *** | *** | *** | — | *** |
| C test | *** | *** | *** | *** | — | *** |
| N | 500 | 500 | 500 | 464 | 279 | 292 |
Abbreviations: IRQ, inter-quartile range; N, number of cells; K–S, Kolmogoroff–Smirnov; S–T: Siegel–Tukey; C, Conover.
—, P>0.1; *, P<0.1; **, P<0.05; ***, P<0.01. Significance wt, test between Sln1 and Sho1; significance Sln1, test between Sln1 and wt; significance Sho1, test between Sho1 and wt.
We sought to corroborate these simulations by dedicated measurements (Figures 10 and 11, Tables I and II). In order to do so, we needed not only to measure average volume recovery times for wild-type and branch mutants but also single-cell information to assess cell to cell variability in the response. As cells are expected to be in different states at the time of the shock, low cell to cell variation in volume recovery time would imply high robustness of the HOG pathway to those differences. Thus, we followed single cells of wild-type, Sln1 branch (sho1Δ) or Sho1 branch (ssk1Δ) yeast by time-lapse microscopy during their response to 0.1 and 0.2 M NaCl. Then, we measured from the acquired images the volume of individual cells over time. As predicted by our model, wild-type cells recovered significantly faster than single-branch mutants (P<0.01, Tables I and II).
Figure 10.
Volume adaptation simulations and measurements after 0.1 M NaCl osmotic shock. For the time series, shaded coloured regions indicate respective interquartile ranges. We show measured volume curves of one representative experiment, whereas adaptation times are pooled over four independent experiments (Table I). In the box plot, solid lines are median, dashed lines mean, boxes indicate the interquartile range, whiskers minimum and maximum, and point are outliers beyond upper quartile +1.5*interquartile range. Source data is available for this figure in the Supplementary Information.

Figure 11.
Volume adaptation simulations and measurements after 0.2 M NaCl osmotic shock. For the time series, shaded coloured regions indicate respective interquartile ranges. We show measured volume curves of one representative experiment, whereas adaptation times are pooled over five independent experiments (Table II). In the box plot, solid lines are median, dashed lines mean, boxes indicate the interquartile range, whiskers minimum and maximum, and point are outliers beyond upper quartile +1.5*interquartile range. Source data is available for this figure in the Supplementary Information.

In terms of interquartile ranges, a robust measure of population variability, we observed that for an osmotic shock of 0.1 M NaCl the wild-type exhibits significantly less variability (P<0.01) than the single-branch mutants (Table I). For an osmotic shock of 0.2 M NaCl, however, the Sho1 branch showed least variability (P<0.01), whereas the variability between wild type and Sln1 branch was not significantly different (Table II).
Our Monte–Carlo analysis of adaptation times using the parameterised model support the hypothesis that a major consequence of maintaining two redundant signalling pathways is that they provide an advantage in recovery from hyper-osmotic shock, both in terms of speed and robustness. The advantage in speed was corroborated by our measurements, whereas the advantage in robustness was only supported for low osmotic shock (0.1 M NaCl).
Discussion
The HOG pathway in yeast is one of the best-studied signalling pathways and, therefore, serves as a prototype for eukaryotic stress response MAP kinase pathways. Nevertheless, there is still substantial uncertainty about the relative importance of different regulation and feedback mechanisms and their interaction in time. Moreover, it is still unclear why yeast has maintained two redundant signalling pathways.
In order to answer which of the many hypothesised regulation and feedback mechanisms are best supported by the available data, and what are two parallel redundant signalling branches good for, we systematically tested an extensive set of different hypotheses against an unprecedented amount of available data that mostly have not yet been used for modelling. By a rigorous model discrimination approach, we identified a parsimonious model that was best supported by the data. To our knowledge, there was no model proposed yet with a lower ratio of number of parameters to number of fitted data points (20/390). Comparable models based on biological knowledge and fitted to data had ratios of, for example, 70/33 (Klipp et al, 2005) and 10/41 (Gennemark et al, 2006). Most of the parameters of the best approximating model were identifiable and the model showed excellent explanatory, as well as predictive, properties over a wide range of mutants and conditions. Owing to the excellent interpolating as well as extrapolating properties of the model, we are confident that we have captured a formal well-parameterised description of the most important mechanisms underlying osmo-adaption in yeast under the studied conditions.
Addressing the above questions with this model yielded various novel insights into osmo-adaption, which might also be important for other homeostatic adaptive systems in eukaryotes. First, the model suggested that the main adaptation mechanism is not via a feedback involving transcription of glycerol-producing enzymes, but rather a fast, possibly post-translational, Hog1-mediated feedback on the glycerol production machinery. This is in contrast to previous studies, which also proposed a fast non-transcriptional Hog1-mediated feedback having an important role for short-term osmo-adaptation, but speculated that it is rather mediated via fast Fps1-channel closure and resulting glycerol retention (Klipp et al, 2005; Mettetal et al, 2008). Such a mechanism had a less pronounced role in our model. The feedback acting on glycerol production proposed by our model can act by, for example, redirecting the glycolytic flux from ethanol to glycerol (Dihazi et al, 2004) or by increasing the glycolytic flux in general by stopping the cell cycle progression and growth (Adrover et al, 2011). The transcriptional feedback takes over at later time and servers to reset the basal level of Hog1 by replacing the transient Hog1-mediated increase in glycerol production by a more sustainable increase in Gpd1-mediated glycerol production. Resetting a low steady state of Hog1 activity is important in order to be able to quickly respond to possible future shocks, which was suggested by our simulation results (Figure 6). Given that Hog1 activation leads to cell cycle arrest (Adrover et al, 2011), low steady-state Hog1 activity after adaptation may also be important to allow normal cell cycle progression, a feature that was not considered in the model.
The concept of signalling and glycerol production homeostasis under non-stress conditions is important in order to come to a new understanding of osmo-adaptation. This concept has not been sufficiently appreciated by earlier models (Klipp et al, 2005; Macia et al, 2009). It has been noted before that there is a constitutive signal maintaining a low Hog1 activity under non-stress conditions (Wurgler-Murphy et al, 1997; Macia et al, 2009). However, that low constant Hog1 activity may also serve to maintain a constitutive enzyme and glycerol production was not rigorously appreciated. It is exactly this notion that provides a new explanation for the data from Macia et al, that is, that Hog1 activation upon inhibition of Hog1 kinase activity is not due to releasing a negative feedback on upstream signalling, but rather due to an osmotic stress, induced by a drop in steady-state intracellular glycerol levels that can no longer be maintained.
Several recent studies support the notion that there are post-translational Hog1-mediated rapid negative feedback mechanisms within the signalling branches of the HOG pathway. Two studies demonstrated experimentally that phosphorylated Hog1 negatively regulates the Sho1 branch at different sites (Hao et al, 2007; Yamamoto et al, 2010), and Macia et al (2009) proposed a rapid Hog1-mediated negative feedback within the Sln1 branch, which was indirectly supported by experimental data, but whose physical nature remains elusive. It should be noted that all three cited studies used different strains, and Macia et al (2009), whose data we used to parameterise our models, did not propose a transient negative feedback in the Sho1 branch. Thus, it is still unclear whether there are Hog1-mediated post-translational feedbacks within both branches of the HOG pathway in the strain our data refers to (W303). Nevertheless, our model discrimination analysis shows that the data support the existence of such feedbacks. Opposed to Macia et al (2009), we suggest that these transient feedbacks have only a minor role for adaptation per se, but rather serve to stabilise the response in terms of avoiding oscillatory behaviour, which may occur in delayed negative feedback systems. A similar effect was described before for models without transcriptional feedback (Tsai et al, 2008). Basically, fast transient feedbacks decrease the delay in the systems and thereby avoid oscillatory behaviour. The stabilisation effect in our model, however, seems to be stronger for the transient Hog1-mediated feedback on the glycerol production rather than for transient feedbacks on the signalling branches.
In contrast to the perfect adaptation in Hog1 nuclear localisation reported by Muzzey et al (2009), Macia et al (2009) reported elevated Hog1 activity after adaptation (Figures 2A and B, and 3A). As the model was fitted to the Macia et al. data and could explain these data well, it also implies a role for model components that were not observed during adaptation response. Thereby, the model provides a more complete picture of the system in case of imperfect adaptation. In the model, elevated Hog1 activity leads to higher steady-state glycerol production, which serves to maintain an increased glycerol gradient, which has to be actively maintained, at least in part, because Fps1 reopens after adaptation (Supplementary Figure S10).
Having, for the first time, a well-parameterised model that includes the two branches at hand, we pursued the hypothesis that the two branches render the system more robust to internal variations in cellular states and to molecular noise (Lestas et al, 2010). Indeed, a Monte–Carlo analysis using the best approximating model showed that the wild-type elicits a faster and more robust response to changes in parameters and initial conditions than the single-branch mutants. We could confirm by dedicated experiments that the wild-type cells indeed recover significantly faster than the single-branch mutants for low and intermediate osmotic shocks (0.1, 0.2 M NaCl). In addition, as evidenced by the interquartile ranges of the adaptation times, we could show that the single-branch mutants showed a significantly higher variability than the wild-type for the low osmotic shock of 0.1 M NaCl. For intermediate osmotic shock, the Sho1 branch seems to be more robust than both wild-type and Sln1 branch mutant, indicating other possible roles of Sho1 branch under this condition and the existence of additional processes, which are not considered by our model.
There are technical limitations to the precision with which the small changes in volume that occur in mild osmotic shocks can be measured. However, recovery of the wild type was up to 5 minutes faster than in the single-branch mutants, which constitutes more than 5% of the cell cycle time under good growth conditions. This advantage might be sufficient to evolutionary conserve two parallel redundant signalling branches. Besides the hypothesis that parallel signalling pathways have evolved to improve noise suppression, which is partly supported by this study, there are, of course, other possible explanations, which we did not investigate here. It is known that, for example, the Sho1 branch is also involved in the activation of the Fus3 and Kss1 MAP kinases, which regulate the response to pheromone and starvation, respectively. Therefore, it seems clear that possible noise suppression is not the sole reason for the existence of the Sho1 branch.
There are other reports on parallel signalling pathways that are activated by a single stimulus in eukaryotic systems. One example is the Erk MAP kinase cascade, which is activated at high doses of epidermal growth factor by both a phosphoinositide 3-kinase (PI3K)-dependent and a PI3K-independent pathway (Sampaio et al, 2008). Another example is NF-κB activation upon genotoxic stress. In this case, at least two partially redundant parallel signalling pathways, one PIASy dependent and another ATM dependent, converge on NEMO/IKK activation (McCool and Miyamoto, 2012). In these examples, stabilisation or acceleration of response time might be important. However, as in the HOG system, parallel signalling pathways probably serve additional purposes, for example, crosstalk to other connected signalling pathways.
This study also demonstrates the potential of an ensemble modelling approach in discriminating rivalling hypotheses. It may lead to biased conclusions, when only one favourite hypothesis is investigated. The inherent uncertainty about the molecular mechanisms underlying biological phenomena inevitably leads to alternative mathematical model formulations, which should all be challenged with available data (Schaber et al, 2009). In combination with a model discrimination analysis, this is a comprehensible way to find the hypothesis that is best supported by data. A model that is selected by this approach has more credibility than fitting and analysing one single model.
Materials and methods
Data
We made extensive use of published data to parameterise dynamic models of the HOG pathway. The core dataset used for model parameterisation and discrimination was taken from Macia et al (2009), which was kindly provided by Sergi Regot in a digital version. This data set consists of time series of phosphorylated Hog1 under several hyper-osmotic shock conditions, for wild-type and different mutant yeast, for up to 2 h after hyper-osmotic shock (Figures 2A and B, and 3). Only the Sln1 branch data for stimulation with 0.1, 0.4 and 0.6 M NaCl have been used before to parameterise mathematical models (Macia et al, 2009) (Figure 2A). The data in Figures 2D and E, and 3B, C and D were also taken from Macia et al (2009), but digitised from the original figures therein. In addition, we used time series of mRNA, Gpd1 and glycerol published in Klipp et al. (2005) (Figure 2C). These data sets, although coming from different sources, were comparable, because they were produced using the same genetic background and under the same culture conditions. Initially, we did not have volume recovery data for these strains and conditions. Therefore, we generated artificial volume data using the observation that change in volume over time during adaptation to a hyper-osmotic shock mirrors Hog1 activation profile in wild-type yeast (Muzzey et al, 2009). We combined this idea with measured minimal volumes (the minimal volume to that a cell can shrink) for different conditions (Schaber et al, 2010) (Figure 2F). Retrospectively, this approach is justified, because at a later stage of the project we did measure volume recovery for single cells for the same strain and under similar conditions (see Figures 10 and 11 and Supplementary Material). The artificial volume data lie within the interquartile range of the measured volumes for the initial phase of adaptation (there was no measurement for the shrinkage phase after shock). As the model does not include growth, the artificial and simulated volumes level off below 100% of the initial volume, whereas the measured volume surpasses the initial volume. Therefore, and in the light of the excellent predictive properties, we refrained from refitting all models including the measured volumes.
Model development and candidate models
Model development was guided by the principle of parsimony. In most published models of the HOG pathway that we are aware of and that have been fitted to data, the number of parameters exceeds the number of data points used to fit those parameters (Kuhn and Klipp, 2012). This leads to over-parameterised models with non-identifiable parameters. Over-parameterised models tend to show spurious effects and artefacts and may lead to wrong conclusions, especially concerning quantitative aspects (Burnham and Anderson, 2002; Schaber et al, 2011). Therefore, we aimed at a model that had substantially less parameters than data points for parameterisation. Given an appropriate experimental design this increases the possibility of obtaining at least some identifiable parameters (Raue et al, 2009; Schaber and Klipp, 2011).
There are no data available on the dynamics of pathway components upstream of Hog1. This part of the model was, therefore, kept as simple as possible, basically only consisting of two different possibilities of how the MAPK kinase Pbs2 can be activated. First, it can be activated by direct phosphorylation through a volume-dependent signal, representing the Sln1 branch activation (v1 in Figure 1), and, second, by volume-dependent binding to Sho1, representing scaffolding properties of the Sho1 branch (v3 in Figure 1). Both the phosphorylated form of Pbs2 as well as the Sho1–Pbs2 complex are capable of double phosphorylating Hog1 independently of each other (v5 and v7 in Figure 1). For characterising processes downstream of Hog1, there were data available for mRNA, Gpd1 and glycerol, which were explicitly included in the model. The data for Gpd1 were also considered as a proxy for other Hog1-regulated proteins. Fps1 closure (by phosphorylation) was optionally dependent on volume, turgor or active Hog1 (v15 and v16 in Figure 1). As there was a report on Fps1 degradation and/or internalisation (Mollapour and Piper, 2007), we included two possible degradation mechanisms, one dependent on activated Hog1 and one dependent on some hypothetical protein induced by activated Hog1. A balancing reaction producing Fps1 was included as well (reactions v17 and v18 in Figure 1), because the model was assumed to be in steady state before stimulation. Internal and external osmotic pressures, turgor and volume dynamics were described with an established parameterised biophysical model (Klipp et al, 2005; Schaber and Klipp, 2008; Schaber et al, 2010).
According to our guiding principle of parsimony, not only the structure of the model but also the kinetic rate law formulations were kept as simple as possible, but as complex as necessary. In almost all rate laws, the most simple rate law, that is, mass-action kinetics, was sufficient. However, in the course of model development, we realised that assuming simple mass-action kinetics for reactions v9 and v13 could not explain the data well, making a more complex kinetic necessary. In these two reactions, we used a simple saturation kinetic, which gave good results, implying that saturation seems to be an important feature of these reactions. In the Supplementary Material, we describe a detailed derivation of such saturation kinetics (Alon, 2007). Owing to the lack of knowledge about a mechanism of how Hog1 may potentially modify glycerol synthesis, we used a simple heuristic approach. As this modifying influence of Hog1 turned out to be important for our results, we also tested several possible rate law formulations for reactions v13 for the three best approximating models (see Result section and Supplementary Tables S11 and S12). See Supplementary Tables S1–S8 for a detailed list of all reactions, their respective rationale and parameters. Figure 1 gives an overview of all reactions considered in the candidate models.
Several reactions and modifying influences in the model were left optional, reflecting uncertainty about the biological processes and representing different hypotheses. These are marked with dashed and dotted lines in Figure 1. Specifically, there were (i) four options for the transient feedback of Hog1-PP on the two branches (v1 and v3): without, with both or with either one of the feedbacks; (ii) two options for glycerol production: only protein (Gpd1, 2) dependent or with additional stimulation by phosphorylated Hog1; (iii) two options for Fps1 closure (v15, putative phosphorylation): stimulated by a volume-dependent function (Fps1 activation) or inhibited by turgor; (iv) four options for Fps1 opening (v16): without regulation (constitutive), inhibited by Hog1, stimulated by turgor or both; and (v) three options for degradation/internalisation of open Fps1 (v17, v18): stimulated by phosphorylated Hog1, protein-stimulated or without. The combination of these alternative model formulations resulted in 4*2*2*4*3=192 different models.
We used a steady-state assumption valid before osmo-stress in order to reduce the number of free parameters. Starting point was the observation that Hog1 shows a basal (non-zero) steady-state activation (Figures 2A and B, and 3A). Therefore, at steady state, activation reactions (v5 and v7) have to be balanced by de-activating reactions (v6 and v8), respectively. In fact, if there is a non-zero steady state, every reaction has to be balanced by another reaction and, thus, one rate constant of each pair of activating–deactivating reactions may be expressed by the remaining rate constants and non-zero steady-state initial concentrations of the involved components (See Supplementary Table S5 for a list of all derived rate constants). The free rate constants were the only fitted parameters. Initial conditions were derived using measured molecules numbers (http://yeastgfp.yeastgenome.org) and assuming a cellular volume of 50 fl. In addition, we made extensive use of reported values of other parameters, which were held constant. See Supplementary Tables S5–S7 for a detailed list of all parameters, their values and references.
Model fitting, ranking and selecting
The core data set was split into two distinct sets. The first set comprised the Hog1 phosphorylation data of the two branches, as well as the mRNA, Gpd1, glycerol and volume data for the wild-type and Hog1 phosphorylation levels for the Fsp1Δ1 mutant (Figure 2). The second set comprised the wild-type data for Hog1 phosphorylation for several mutants and various conditions (Figure 3A and B). The first data set was used to parameterise the models and the second data set was used to validate the models (test whether the models could predict correctly the results of the experiments in the data set). The models were implemented and fitted with the free software COPASI (Version 4.7, Build 34) (Hoops et al, 2006). We used the Evolutionary Programming algorithm to fit the models, where the population size was set to 10 times the number of parameters and the number of generations was limited to 10 times the number of parameters. Subsequently, the models were additionally fitted with the Hookes and Jeeves algorithm with standard parameter settings from COPASI. When estimated parameters hit parameter boundaries, the boundaries were relaxed and the model refitted until the fit converged within defined parameter boundaries. Model ranking was performed using modelMaGe (Flottmann et al, 2008; Schaber et al, 2011).
We observed that several models exhibited oscillatory behaviour after adaptation to osmotic shock (see Supplementary Table S8), either damped or sustained. Oscillatory behaviour in the HOG pathway has not been reported, neither in population-based measurements nor in single-cell measurements. Therefore, we considered oscillations to be an artefact of the model and its parameterisation. These models were excluded from the ranking procedure. For model ranking, we calculated the AIC corrected for small sample sizes (AICc) (Burnham and Anderson, 2002) for each candidate model:
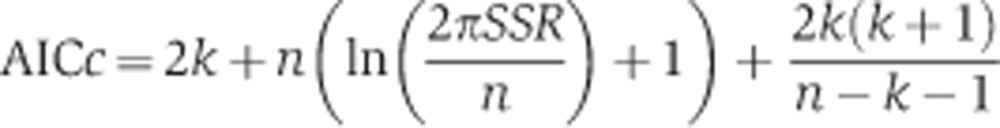 |
where SSR is the sum of squared residuals of the fit, k the number of parameters and n the number of data points. The AICc is an information theory-based measure of parsimonious data representation that incorporates the goodness of the fit (SSR) as well as the complexity of the model (k), thereby giving an objective measure for model selection and discrimination.
Using the AICc, the models were ranked according their data approximation (Supplementary Table S9). In addition, we ranked the models using both the SSR of the fitted data (Figure 2, 390 data points, Supplementary Table S9) as well as the predicted data (Figure 3A and B, 515 data points, Supplementary Table S10). This way, the models were ranked according to both their data approximation and their predictive properties.
In order to select and compare the best approximating model(s), we calculated the Akaike weights (AICw) (Burnham and Anderson, 2002).
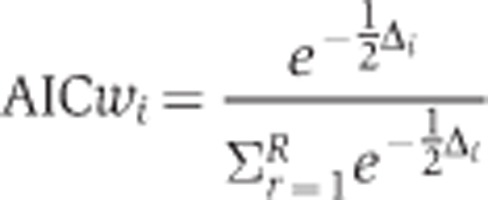 |
where Δi=AICi−AICmin, with i being the model index i=1, …, R according to ranking and QUOTE the minimal AICc. The AICw’s can be considered as the weight of evidence in favour of a model given as a number between 0 and 1, that is, the higher the weight, the closer the model is to the hypothetical true model (Burnham and Anderson, 2002). We considered those models as best approximating that had an AICw>0.05 (Supplementary Tables S8–S10).
Experimental methods
We performed general molecular biology procedures, yeast strain manipulation and construction according to previously established methods (Guthrie and Fink, 1991; Ausubel et al, 1987).
Strains
Strains are detailed in Table III. We used ACL379 as the parental strain, which is a Δbar1 strain derived from YAS245-5C (can1::HO-CAN1 ho::HO-ADE2 ura3 ade2 leu2 trp1 his3) and is a W303a derivative (Colman-Lerner et al, 2005).
Table 3. Strains.
| Strain | Relevant genotype | Reference |
|---|---|---|
| LD3342 | MATa bar1Δ prm1::Pprm1-mRFP:hygB Pstl1::Pstl1-YFP::URA3 Pbmh2::Pbmh2::CFP::TRP1 | Baltanas et al (in preparation) |
| RB3703 | MATa sho1Δ::kanMX, bar1Δ prm1::Pprm1-mRFP:hygB Pstl1::Pstl1-YFP::URA3 Pbmh2::Pbmh2::CFP::TRP1 | Baltanas et al (in preparation) |
| RB3782a | MATa ssk1Δ::kanMX, bar1Δ prm1::Pprm1-mRFP:hygB Pstl1::Pstl1-YFP::URA3 Pbmh2::Pbmh2::CFP::TRP1 | Baltanas et al (in preparation) |
We used LD3342 strain as the parental strain to make most of the deletion mutants in this work. These deletions were performed by homologous recombination using PCR products amplified from the appropriate strain from the deletion collection using primers separated ∼200 base pairs from the antibiotic resistance cassette.
Culture and cell manipulation
We maintained cultures in exponential growth for at least 15 h. To this end, we typically start two or three cultures of different dilutions in the medium appropriate for each particular experiment, so that after 15 h, one of the cultures has grown to an OD between 0.05–0.1.
For the volume recovery experiments, we sonicated the culture to disperse clumps and added 100 μl of cell suspension (roughly 106 cells) to 96-well glass bottom plates that had been precoated with conA (concanavalin A type V, Sigma-Aldrich). To coat with conA, we added to the well 100 μl of a 100 μg/ml solution of conA in water. We incubated the plate for 1 h at RT and then washed three times with water. After pipetting the cells, we centrifuged the plate at 3000, r.p.m. for 30 s. This procedure improves the attachment of the cells to the bottom of the wells. We then removed the medium by aspiration and added 200 μl of the same fresh medium.
Image acquisition
For imaging, we used a 60X PlanApo objective (NA=1.4) under oil immersion using an Olympus IX81 microscope (Colman-Lerner et al, 2005; Gordon et al, 2007; Chernomoretz et al, 2008). We automatically imaged multiple wells over time using MetaMorph 7.5 software (Universal Imaging Corporation, Downingtown, PA).
Briefly, we focused cells manually (focus will slowly drift hereafter). Then, we acquired a Z-stack of eight slices 0.4 μm thick covering 2 μm on either side of the focal plane. First, we imaged for 10 min to quantify the volume of the cells before the shock in each well. Then, we stimulated the cells waited for 30 s and resumed z-stack acquisition. We continued imaging for 60 min.
Image processing with CellID and data analysis with Rcell
To extract quantitative information from the images, we processed them with VCell-ID as previously described (Gordon et al, 2007; Chernomoretz et al, 2008) using the parameters max_dist_over_waist=4.00, max_pixels_per_cell=2000, min_pixels_per_cell=400, background_reject_factor=1.10 and standard parameters otherwise.
In order to select the image from the stack where cells are slightly out of focus, we used a simple observation. We noticed that the image corresponding to the in-focus slice had the minimum total pixel intensity of all slices in the stack. Therefore, we selected for VCell-ID processing the images that were three and four slices below the image with minimum pixel intensity. We analysed single-cell data extracted from VCell-ID using R (http://www.r-project.org) with Cell-ID-specific analysis package Rcell (http://cran.r-project.org/web/packages/Rcell/index.html). After quantification, we removed irregular shaped spurious cells, outliers and cell that were present in <80% of all time points, as described in Chernomoretz et al. For each cell and slice volumes were normalised to the median volume of the three time points before shock. As final volume measurement, we used the average over the two selected slices of the normalised volumes.
Adaptation times for the measured single-cell volume time courses was calculated from a linear interpolation of the time and volume before and after recovery of 100% of the initial volume before the osmotic shock.
Supplementary Material
Supplementary Tables S1–14, Supplementary Figures S1–10
Copasi and SBML model file with data used in the Copasi file for fitting and ranking.
Acknowledgments
We thank Sergi Regot and Francesc Posas for supplying digital versions of the data in Figures 2A, B, D and . We also thank Soheil Rastgou Talemi for digitising the data used in Supplementary Figure S2. This study was supported by the European Commission (QUASI (Contract No. 503230), CELLCOMPUT (Contract No. 043310) to EK), UniCellSys (Contract No. 201142) to EK), the German Ministry of Science and Education (BMBF projects 0135779 and 01DN12003 to JS), and the Argentine Ministry of Science and Productive Innovation (MYNCYT project AL/10/02 and ANPCyT project PICT2007-847 to AC-L).
Author contribution: JS designed and conducted the research, data analysis and modelling; RB and AB did single-cell volume measurements and conducted volume data analysis; and EK and ACL designed the research. JS, EK and AC-L wrote the paper.
Footnotes
The authors declare that they have no conflict of interest.
References
- Adrover MA, Zi Z, Duch A, Schaber J, González-Novo A, Jimenez J, Nadal-Ribelles M, Clotet J, Klipp E, Posas F (2011) Time-dependent quantitative multicomponent control of the G-S network by the stress-activated protein kinase Hog1 upon osmostress. Sci Signal 4: ra63 [DOI] [PubMed] [Google Scholar]
- Albertyn J, Hohmann S, Thevelein JM, Prior BA (1994) GPD1, which encodes glycerol-3-phosphate dehydrogenase, is essential for growth under osmotic stress in Saccharomyces cerevisiae, and its expression is regulated by the high-osmolarity glycerol response pathway. Mol Cell Biol 14: 4135–4144 [DOI] [PMC free article] [PubMed] [Google Scholar]
- Alon U (2007) An Introduction to Systems Biology . Mathematical and Computational Biology Series Boca Raton: Chapman and Hall/CRC, [Google Scholar]
- Ausubel FM et al. (1987–2006) Current Protocols in Molecular Biology New York, NY: John Wiley & Sons, Inc., [Google Scholar]
- Beese SE, Negishi T, Levin DE (2009) Identification of positive regulators of the yeast fps1 glycerol channel. PLoS Genet 5: e1000738. [DOI] [PMC free article] [PubMed] [Google Scholar]
- Burnham KP, Anderson DR (2002) Model Selection and Multi-Model Inference: A Practical Information-theoretic Approach. New York, NY: Springer [Google Scholar]
- Chernomoretz A, Bush A, Yu R, Gordon A, Colman-Lerner A (2008) Using Cell-ID 1.4 with R for microscope-based cytometry. Curr Protoc Mol Biol Chapter 14, Unit 14–18 [DOI] [PMC free article] [PubMed] [Google Scholar]
- Colman-Lerner A, Gordon A, Serra E, Chin T, Resnekov O, Endy D, Pesce CG, Brent R (2005) Regulated cell-to-cell variation in a cell-fate decision system. Nature 437: 699–706 [DOI] [PubMed] [Google Scholar]
- Dihazi H, Kessler R, Eschrich K (2004) High osmolarity glycerol (HOG) pathway-induced phosphorylation and activation of 6-phosphofructo-2-kinase are essential for glycerol accumulation and yeast cell proliferation under hyperosmotic stress. J Biol Chem 279: 23961–23968 [DOI] [PubMed] [Google Scholar]
- Flottmann M, Schaber J, Hoops S, Klipp E, Mendes P (2008) ModelMage: a tool for automatic model generation, selection and management. Genome Inform 20: 52–63 [PubMed] [Google Scholar]
- Gaudet S, Spencer SL, Chen WW, Sorger PK (2012) Exploring the contextual sensitivity of factors that determine cell-to-cell variability in receptor-mediated apoptosis.. PLoS Comput Biol 8: e1002482. [DOI] [PMC free article] [PubMed] [Google Scholar]
- Gennemark P, Nordlander B, Hohmann S, Wedelin D (2006) A simple mathematical model of adaptation to high osmolarity in yeast. In Silico Biol 6: 193–214 [PubMed] [Google Scholar]
- Gordon A, Colman-Lerner A, Chin TE, Benjamin KR, Yu RC, Brent R (2007) Single-cell quantification of molecules and rates using open-source microscope-based cytometry. Nat Methods 4: 175–181 [DOI] [PubMed] [Google Scholar]
- Guthrie C, Fink GR (1991) Methods in Enzymology, Guide to Yeast Genetics and Molecular Biology San Diego, California: Academic Press, 92101 [Google Scholar]
- Hao N, Behar M, Parnell SC, Torres MP, Borchers CH, Elston TC, Dohlman HG (2007) A systems-biology analysis of feedback inhibition in the Sho1 osmotic-stress-response pathway. Curr Biol 17: 659–667 [DOI] [PubMed] [Google Scholar]
- Hao N, Zeng Y, Elston TC, Dohlman HG (2008) Control of MAPK specificity by feedback phosphorylation of shared adaptor protein Ste50. J Biol Chem 283: 33798–33802 [DOI] [PMC free article] [PubMed] [Google Scholar]
- Hersen P, McClean MN, Mahadevan L, Ramanathan S (2008) Signal processing by the HOG MAP kinase pathway. Proc Natl Acad Sci USA 105: 7165–7170 [DOI] [PMC free article] [PubMed] [Google Scholar]
- Hohmann S (2002) Osmotic adaptation in yeast--control of the yeast osmolyte system. Int Rev Cytol 215: 149–187 [DOI] [PubMed] [Google Scholar]
- Hohmann S (2002) Osmotic stress signaling and osmoadaptation in yeasts. Microbiol Mol Biol Rev 66: 300–372 [DOI] [PMC free article] [PubMed] [Google Scholar]
- Hoops S, Sahle S, Gauges R, Lee C, Pahle J, Simus N, Singhal M, Xu L, Mendes P, Kummer U (2006) COPASI--a COmplex PAthway SImulator. Bioinformatics 22: 3067–3074 [DOI] [PubMed] [Google Scholar]
- Hucka M, Finney A, Sauro HM, Bolouri H, Doyle JC, Kitano H, Arkin AP, Bornstein BJ, Bray D, Cornish-Bowden A, Cuellar AA, Dronov S, Gilles ED, Ginkel M, Gor V, Goryanin II, Hedley WJ, Hodgman TC, Hofmeyr JH, Hunter PJ et al. (2003) The systems biology markup language (SBML): a medium for representation and exchange of biochemical network models. Bioinformatics 19: 524–531 [DOI] [PubMed] [Google Scholar]
- Kholodenko BN (2000) Negative feedback and ultrasensitivity can bring about oscillations in the mitogen-activated protein kinase cascades. Eur J Biochem 267: 1583–1588 [DOI] [PubMed] [Google Scholar]
- Klipp E, Nordlander B, Krüger R, Gennemark P, Hohmann S (2005) Integrative model of the response of yeast to osmotic shock. Nat Biotechnol 23: 975–982 [DOI] [PubMed] [Google Scholar]
- Klipp E, Schaber J (2008) Modeling the dynamics of stress activated protein kinases (SAPK) in cellular stress response. Top Curr Genet 205–224 [Google Scholar]
- Kuhn C, Klipp E (2012) Zooming in on yeast osmoadaptation. Adv Exp Med Biol 736: 293–310 [DOI] [PubMed] [Google Scholar]
- Lestas I, Vinnicombe G, Paulsson J (2010) Fundamental limits on the suppression of molecular fluctuations. Nature 467: 174–178 [DOI] [PMC free article] [PubMed] [Google Scholar]
- Luyten K, Albertyn J, Skibbe F, Prior BA, Ramos J, Thevelein JM, Hohmann S (1994) The FPS1 gene product functions as a glycerol facilitator in the yeast Saccharomyces cerevisiae. Folia Microbiol (Praha) 39: 534–536 [DOI] [PubMed] [Google Scholar]
- Macia J, Regot S, Peeters T, Conde N, Solé R, Posas F (2009) Dynamic signaling in the Hog1 MAPK pathway relies on high basal signal transduction. Sci Signal 2: ra13 [DOI] [PubMed] [Google Scholar]
- McCool KW, Miyamoto S (2012) DNA damage-dependent NF-kappaB activation: NEMO turns nuclear signaling inside out. Immunol Rev 246: 311–326 [DOI] [PMC free article] [PubMed] [Google Scholar]
- Mettetal JT, Muzzey D, Gómez-Uribe C, van Oudenaarden A (2008) The frequency dependence of osmo-adaptation in Saccharomyces cerevisiae. Science 319: 482–484 [DOI] [PMC free article] [PubMed] [Google Scholar]
- Mollapour M, Piper PW (2007) Hog1 mitogen-activated protein kinase phosphorylation targets the yeast Fps1 aquaglyceroporin for endocytosis, thereby rendering cells resistant to acetic acid. Mol Cell Biol 27: 6446–6456 [DOI] [PMC free article] [PubMed] [Google Scholar]
- Muzzey D, Gómez-Uribe CA, Mettetal JT, van Oudenaarden A (2009) A systems-level analysis of perfect adaptation in yeast osmoregulation. Cell 138: 160–171 [DOI] [PMC free article] [PubMed] [Google Scholar]
- Nelson B, Parsons AB, Evangelista M, Schaefer K, Kennedy K, Ritchie S, Petryshen TL, Boone C (2004) Fus1p interacts with components of the Hog1p mitogen-activated protein kinase and Cdc42p morphogenesis signaling pathways to control cell fusion during yeast mating. Genetics 166: 67–77 [DOI] [PMC free article] [PubMed] [Google Scholar]
- Nevoigt E, Stahl U (1997) Osmoregulation and glycerol metabolism in the yeast Saccharomyces cerevisiae. FEMS Microbiol Rev 21: 231–241 [DOI] [PubMed] [Google Scholar]
- O’Rourke SM, Herskowitz I (1998) The Hog1 MAPK prevents cross talk between the HOG and pheromone response MAPK pathways in Saccharomyces cerevisiae. Genes Dev 12: 2874–2886 [DOI] [PMC free article] [PubMed] [Google Scholar]
- O’Rourke SM, Herskowitz I, O’Shea EK (2002) Yeast go the whole HOG for the hyperosmotic response. Trends Genet 18: 405–412 [DOI] [PubMed] [Google Scholar]
- Posas F, Wurgler-Murphy SM, Maeda T, Witten EA, Thai TC, Saito H (1996) Yeast HOG1 MAP kinase cascade is regulated by a multistep phosphorelay mechanism in the SLN1-YPD1-SSK1 “two-component” osmosensor. Cell 86: 865–875 [DOI] [PubMed] [Google Scholar]
- Raue A, Kreutz C, Maiwald T, Bachmann J, Schilling M, Klingmüller U, Timmer J (2009) Structural and practical identifiability analysis of partially observed dynamical models by exploiting the profile likelihood. Bioinformatics 25: 1923–1929 [DOI] [PubMed] [Google Scholar]
- Reiser V, Raitt DC, Saito H (2003) Yeast osmosensor Sln1 and plant cytokinin receptor Cre1 respond to changes in turgor pressure. J Cell Biol 161: 1035–1040 [DOI] [PMC free article] [PubMed] [Google Scholar]
- Rep M, Albertyn J, Thevelein JM, Prior BA, Hohmann S (1999) Different signalling pathways contribute to the control of GPD1 gene expression by osmotic stress in Saccharomyces cerevisiae. Microbiology 145: 715–727 [DOI] [PubMed] [Google Scholar]
- Sampaio C, Dance M, Montagner A, Edouard T, Malet N, Perret B, Yart A, Salles JP, Raynal P (2008) Signal strength dictates phosphoinositide 3-kinase contribution to Ras/extracellular signal-regulated kinase 1 and 2 activation via differential Gab1/Shp2 recruitment: consequences for resistance to epidermal growth factor receptor inhibition. Mol Cell Biol 28: 587–600 [DOI] [PMC free article] [PubMed] [Google Scholar]
- Schaber J (2012) Easy parameter identifiability analysis with COPASI. Biosystems ( 10.1016/j.biosystems.2012.09.003) [DOI] [PubMed]
- Schaber J, Adrover MA, Eriksson E, Pelet S, Petelenz-Kurdziel E, Klein D, Posas F, Goksör M, Peter M, Hohmann S, Klipp E (2010) Biophysical properties of Saccharomyces cerevisiae and their relationship with HOG pathway activation. Eur Biophys J 39: 1547–1556 [DOI] [PMC free article] [PubMed] [Google Scholar]
- Schaber J, Flöttmann M, Li J, Tiger CF, Hohmann S, Klipp E (2011) Automated ensemble modeling with modelMaGe: analyzing feedback mechanisms in the Sho1 branch of the HOG pathway. PLoS One 6: e14791. [DOI] [PMC free article] [PubMed] [Google Scholar]
- Schaber J, Klipp E (2008) Short-term volume and turgor regulation in yeast. Essays Biochem 45: 147–159 [DOI] [PubMed] [Google Scholar]
- Schaber J, Klipp E (2011) Model-based inference of biochemical parameters and dynamic properties of microbial signal transduction networks. Curr Opin Biotechnol 22: 109–116 [DOI] [PubMed] [Google Scholar]
- Schaber J, Liebermeister W, Klipp E (2009) Nested uncertainties in biochemical models. IET Syst Biol 3: 1–9 [DOI] [PubMed] [Google Scholar]
- Schwartz MA, Madhani HD (2004) Principles of MAP kinase signaling specificity in Saccharomyces cerevisiae. Annu Rev Genet 38: 725–748 [DOI] [PubMed] [Google Scholar]
- Tamas MJ, Karlgren S, Bill RM, Hedfalk K, Allegri L, Ferreira M, Thevelein JM, Rydström J, Mullins JG, Hohmann S (2003) A short regulatory domain restricts glycerol transport through yeast Fps1p. J Biol Chem 278: 6337–6345 [DOI] [PubMed] [Google Scholar]
- Tamas MJ, Luyten K, Sutherland FC, Hernandez A, Albertyn J, Valadi H, Li H, Prior BA, Kilian SG, Ramos J, Gustafsson L, Thevelein JM, Hohmann S (1999) Fps1p controls the accumulation and release of the compatible solute glycerol in yeast osmoregulation. Mol Microbiol 31: 1087–1104 [DOI] [PubMed] [Google Scholar]
- Tamas MJ, Rep M, Thevelein JM, Hohmann S (2000) Stimulation of the yeast high osmolarity glycerol (HOG) pathway: evidence for a signal generated by a change in turgor rather than by water stress. FEBS Lett 472: 159–165 [DOI] [PubMed] [Google Scholar]
- Tatebayashi K, Takekawa M, Saito H (2003) A docking site determining specificity of Pbs2 MAPKK for Ssk2/Ssk22 MAPKKKs in the yeast HOG pathway. Embo J 22: 3624–3634 [DOI] [PMC free article] [PubMed] [Google Scholar]
- Tatebayashi K, Tanaka K, Yang HY, Yamamoto K, Matsushita Y, Tomida T, Imai M, Saito H (2007) Transmembrane mucins Hkr1 and Msb2 are putative osmosensors in the SHO1 branch of yeast HOG pathway. EMBO J 26: 3521–3533 [DOI] [PMC free article] [PubMed] [Google Scholar]
- Tsai TY, Choi YS, Ma W, Pomerening JR, Tang C, Ferrell JE Jr (2008) Robust, tunable biological oscillations from interlinked positive and negative feedback loops. Science 321: 126–129 [DOI] [PMC free article] [PubMed] [Google Scholar]
- Wurgler-Murphy SM, Maeda T, Witten EA, Saito H (1997) Regulation of the Saccharomyces cerevisiae HOG1 mitogen-activated protein kinase by the PTP2 and PTP3 protein tyrosine phosphatases. Mol Cell Biol 17: 1289–1297 [DOI] [PMC free article] [PubMed] [Google Scholar]
- Yamamoto K, Tatebayashi K, Tanaka K, Saito H (2010) Dynamic control of yeast MAP kinase network by induced association and dissociation between the Ste50 scaffold and the Opy2 membrane anchor. Mol Cell 40: 87–98 [DOI] [PubMed] [Google Scholar]
- Yu RC, Pesce CG, Colman-Lerner A, Lok L, Pincus D, Serra E, Holl M, Benjamin K, Gordon A, Brent R (2008) Negative feedback that improves information transmission in yeast signalling. Nature 456: 755–761 [DOI] [PMC free article] [PubMed] [Google Scholar]
Associated Data
This section collects any data citations, data availability statements, or supplementary materials included in this article.
Supplementary Materials
Supplementary Tables S1–14, Supplementary Figures S1–10
Copasi and SBML model file with data used in the Copasi file for fitting and ranking.