Abstract
To study the evolution of recombination rates in apes, we developed methodology to construct a fine-scale genetic map from high throughput sequence data from ten Western chimpanzees, Pan troglodytes verus. Compared to the human genetic map, broad-scale recombination rates tend to be conserved, but with exceptions, particularly in regions of chromosomal rearrangements and around the site of ancestral fusion in human chromosome 2. At fine-scales, chimpanzee recombination is dominated by hotspots, which show no overlap with humans even though rates are similarly elevated around CpG islands and decreased within genes. The hotspot-specifying protein PRDM9 shows extensive variation among Western chimpanzees and there is little evidence that any sequence motifs are enriched in hotspots. The contrasting locations of hotspots provide a natural experiment, which demonstrates the impact of recombination on base composition.
Multiple factors are likely to influence recombination rate from the scales of individual hotspots to entire chromosomes. Evidence as to the nature and importance of such factors can potentially be obtained by studying the evolution of recombination rates at different scales (1). For example, previous studies of localised regions suggest that recombination hotspots are typically not shared between humans and chimpanzees (2–6), likely due to the function of the zinc-finger protein PRDM9 (2, 7–8), which binds motifs associated with hotspot activity (7, 9) and is highly diverged between the human and chimpanzee reference genomes (2, 10). In humans, sequence variation within the PRDM9 zinc-finger array leads to differential activity at both allelic and non-allelic cross-over hotspots (7, 11–12) and alleles found only in individuals of African ancestry lead to population-specific hotspots in patterns of both linkage disequilibrium (LD) and admixture (13).
However, to assess whether different classes of hotspot evolve in different ways, or to study recombination rate evolution over broader scales requires genome-wide fine-scale genetic maps, which have only been generated for humans (13–16) and several distantly-related model species including mice (17) and yeast (18–19). Experimental techniques for identifying recombination events require either extensive pedigree data (15) or molecular characterisation of meiotic cells (17–19), which are impractical for many species of interest. Methods for estimating recombination-rates from SNP data (20–21) have been validated at both broad- and fine-scale scales (14, 20) but there remains a gap for species without SNP arrays (i.e. most species). Hence we set out to develop approaches based on sequence data, which, if successful, potentially open the possibility of producing genetic maps for many species.
Constructing a fine-scale chimpanzee genetic map from population sequencing
The genomes of ten unrelated Western Chimpanzees, Pan troglodytes verus, were sequenced (average 9.1× coverage; Table S1). Variants and haplotypes were inferred in a manner similar to the 1000 Genomes Project (22–23). Across the autosomes, we identified 5.3 million SNPs with a false discovery rate of less than 3% (Tables S2, S3 and Fig. S1). With 85% power to detect variant alleles present more than once in the sample (Fig. S2) and over 97% genotype accuracy (23), these data enable the construction of a high-resolution genetic map.
A major challenge in estimating genetic maps from sequence data is that erroneous, mis-assembled or incorrectly genotyped genetic variants may mimic the effects of recombination. Initial maps estimated from variation data using existing methods (20) were dominated by large and artefactual increases in genetic distance (Fig. S3) caused by clusters of false positive SNP calls, often in large repeats that are systematically under-represented in the chimpanzee reference genome (Fig. S4). Most of these SNPs do not fail standard filters, hence we developed regional filtering strategies (23). To validate the protocol and to estimate the sampling variance we performed the same analyses on ten human samples each from populations of European (CEU) and African (YRI) ancestry from the 1000 Genomes Project (22–23). Genetic maps estimated for the human data sets showed strong correlations to previously-generated LD-based maps, enabling us to quantify map quality (Tables S4, S5 and Fig. S5) (16, 23). Hotspots estimated in the human data are concordant with previously-described peaks in recombination rate (Fig. S6). Moreover, we found a strong correlation between rates estimated in this study and from limited genomic regions in a larger sample of Western Chimpanzees (5) (r = 0.67 at 20kb; Fig. S7). We conclude that sequencing data from only ten individuals gives sufficient power to identify hotspots and estimate recombination rates at broad and even fine scales. For comparative analysis, we aligned genetic maps from human and chimpanzee over 2.5 Gb of synteny, 90% of the assembled genomes (Fig. S8).
Broad-scale recombination rates
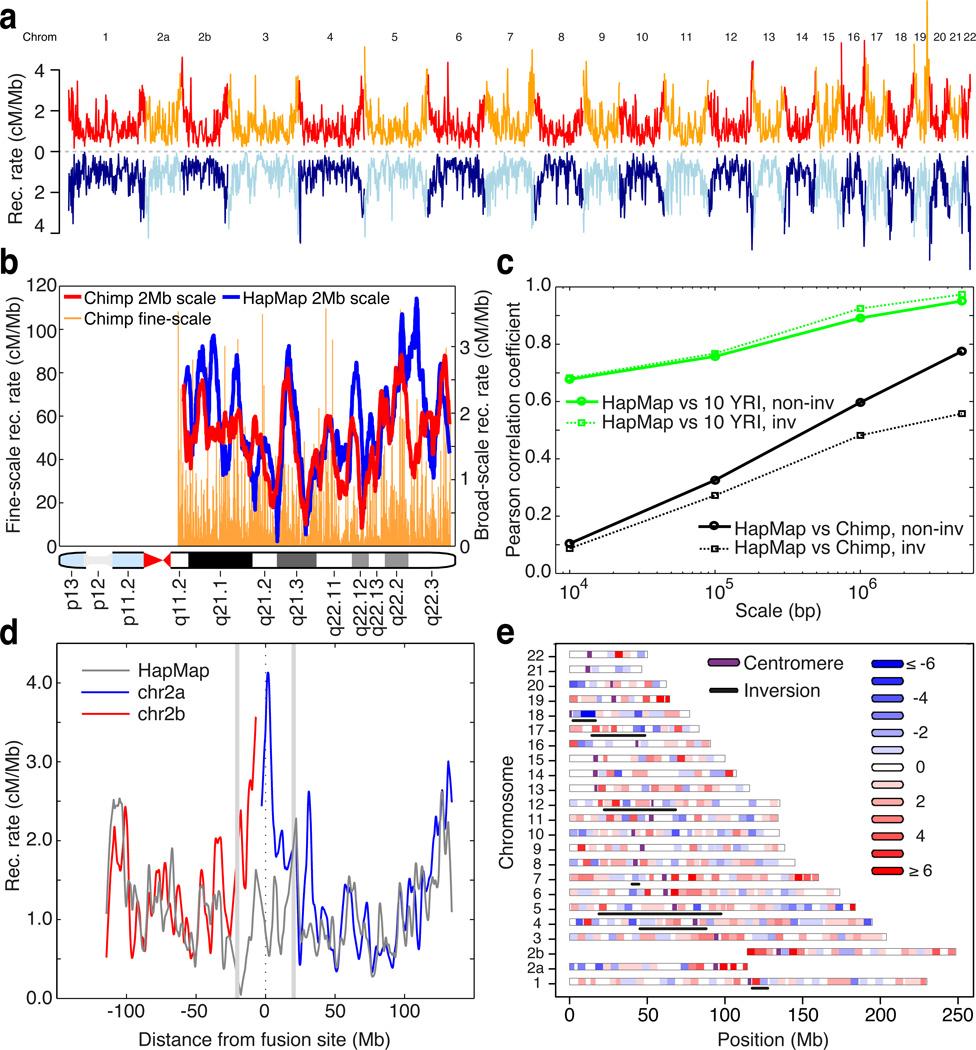
At the level of entire chromosomes, recombination rates were found to be very similar in humans and chimpanzees (Fig. S9), with the exception of chromosome 2, discussed below. Even at the megabase scale, strong similarities emerge between human and chimpanzee rates, particularly driven by sub-telomeric rate increase in both species (Fig. 1a). Yet we also found regions with substantial divergence (Fig. 1b). Notably, inverted regions showed a lower correlation in rate than non-inverted regions (Figs 1c and S10), despite causing no systematic change in mean rate, indicating that chromosomal rearrangements often result in broad-scale changes in recombination rate. Change in distance to the telomere is a major significant factor (Table S6; p = 4×10⁻⁹), with regions that move closer to the telomere increasing in rate. All except one of the inverted regions are pericentric, hence the effect is not due to changes in proximity to the centromere.
Figure 1.
Evolution of recombination rates between humans and chimpanzees. (a) Genome-wide comparison of recombination rates for chimpanzee (red / orange) and human (light / dark blue); averaged over 1 Mb windows in regions of synteny. Unless otherwise stated, human rates are from the population-averaged HapMap genetic map (16). (b) Recombination rates estimated in human (blue) and chimpanzee (red) along chromosome 21q, averaged over 2Mb intervals; fine-scale rates shown behind. (c) Pearson correlation coefficients at different scales, estimated between the recombination rates of chimpanzee and HapMap YRI (black), and between chimpanzee and ten 1000 Genomes YRI samples (green). Non-inverted regions: solid lines, inverted regions: dotted lines). (d) Recombination rates in 2Mb syntenic windows along chimpanzee chromosomes 2a and 2b (blue, red) and the corresponding syntenic region of human chromosome 2 (grey) derived from an ancient telomeric fusion. (e) Differences between chimpanzee and human recombination rates in 5Mb syntenic windows across the genome. Regions involved in inversions are underlined.
The most dramatic change in broad scale recombination rate is between the short arms of chimpanzee chromosome 2a and 2b and the orthologous regions in human chromosome 2, which originated from a telomeric fusion event in the human ancestral lineage (24) and which provides a natural experiment to explore the effect of chromosomal organisation on recombination (Fig. 1d). We found that while the sub-telomeric regions of chromosome 2a and 2b in chimpanzee show high recombination rates, the rate over the syntenic region in humans is suppressed nearly three-fold and overall the genetic map length of the fused chromosome is reduced by 20%. The degree to which recombination events are concentrated within the fused region is no different than in the unfused regions (Fig. S11), indicating that the change in broad-scale rates was not accomplished by specifically eliminating cross-over events at hotspots.
Although less dramatic, regions within structurally-conserved chromosomes can also show large changes in rate between species (Fig. 1e; 1 Mb correlation between human and chimpanzee maps in conserved regions is 0.60). Using a linear model, we found that the strongest determinant of rate divergence in non-inverted regions was base composition, such that while there is a substantial correlation between GC fraction and recombination rate in humans (partial r = 0.51 at 1Mb scale, with substantial variation between chromosomes, Fig. S12), the correlation is much weaker in chimpanzees (partial r = 0.11; Fig. S12). One consequence is that in low GC regions (GC fraction < 35%) the recombination rate in chimpanzees is over 50% higher than in humans.
Fine-scale recombination rates
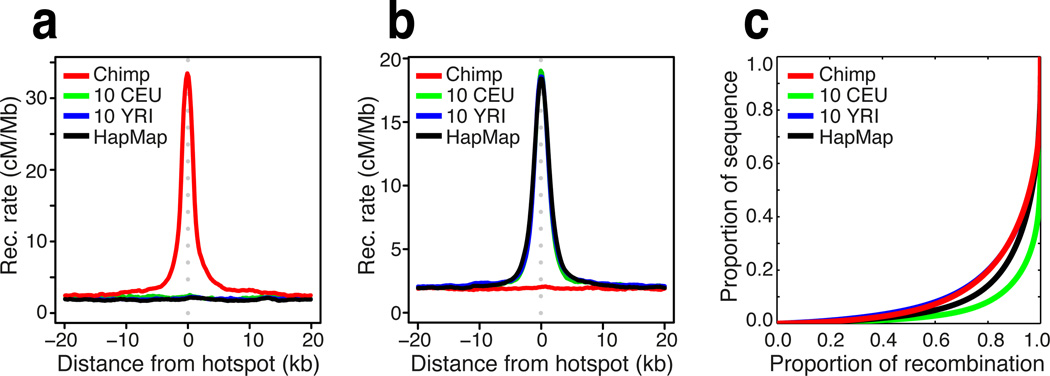
In humans, the PRDM9-bound 13 bp motif is only clearly detected in a minority of hotspots (25), although activity at some hotspots with no clear match is PRDM9-dependent (7, 11). Nevertheless, there could exist different classes of hotspot in humans, some of which are PRDM9-independent and hence potentially shared between species. However, we found no evidence of sharing of recombination hotspots between species (Figs 2a, b and S13), even for human hotspots with no match to the PRDM9 motif (Fig. S13).
Figure 2.
(a) Recombination rates around hotspots identified in chimpanzee (red) at syntenic regions in CEU (green), YRI (blue), and HapMap (black). (b) As for (a) but around sites identified as recombination hotspots in 10 YRI; see also Figure S4. (c) The concentration of recombination rate in fine-scale genetic maps estimated from the chimpanzee and equivalent data from human populations of European (CEU) and African (YRI) ancestry (23). The higher degree of concentration see in African relative to European populations likely reflects the greater diversity of PRDM9 alleles in the population (11).
Interestingly, in spite of the absence of hotspot sharing, the landscape of recombination in the chimpanzee population is dominated by recombination hotspots to a similar degree as African populations (Figs 2c; though note that European populations show greater concentration of recombination). Moreover, the average fine-scale recombination rate profiles around genes and CpG islands are similar between species. Recombination increases on average by about 20% around transcription start and end sites and decreases on average by about 30% within the transcribed region (Fig. 3a). Such concordance suggests that features affecting chromatin state, for example nucleosome occupancy, which is destabilised around CpG islands and promoters (26), may similarly shape the propensity for recombination at these sites in humans and chimpanzees (17, 19, 27). Possibly reflecting a similar effect, we found recombination to be elevated around CpG islands in both species (Fig. 3b), although the effect is stronger in chimpanzees (increase of nearly 50% in rate relative to background compared to 15% in humans). Interestingly, the rate elevation around promoters in humans was found to be driven by genes that have a high rate of CpG methylation in sperm, but in chimpanzees it occurs around genes with low rates of sperm CpG methylation (Fig. S14).
Figure 3.
The fine-scale profile of recombination rate variation around genomic features in chimpanzees and humans. (a) Average recombination rate as a function of distance to nearest transcription start site (TSS) and transcription end site (TES) in chimpanzee (red), YRI (blue), CEU (green), and HapMap (black). (b) Average recombination rate as a function of distance to nearest CpG island; colours as for panel (a). Dashed lines indicate start and end of elements, estimates smoothed using running average with a 7.5kb window.
Extensive structural and sequence diversity in chimpanzee PRDM9
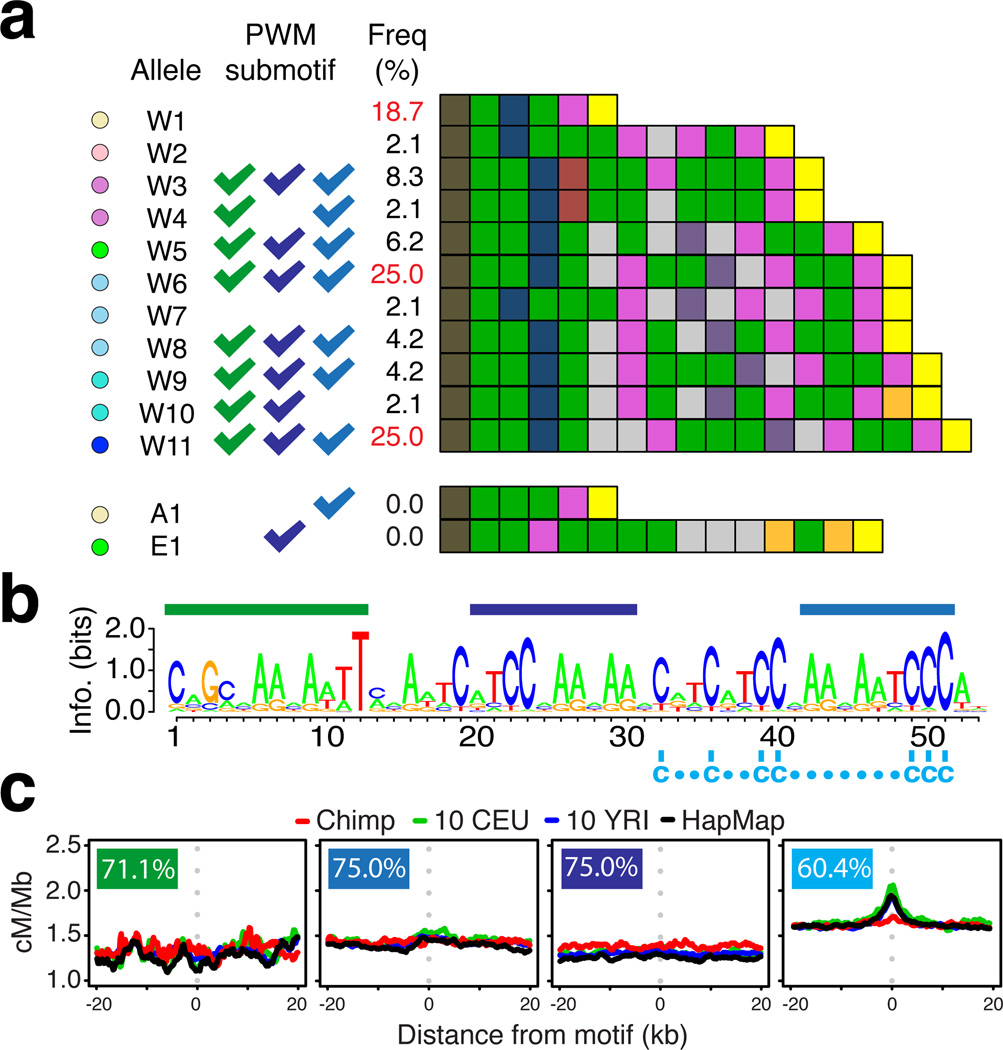
We sequenced 48 PRDM9 alleles from Western chimpanzees, including alleles from the 10 individuals for whom genome-wide data were collected. We found extensive variation in the number of zinc fingers and the identity of the DNA contacting residues, with three common alleles of 6, 16 and 18 zinc fingers (Fig. 4a), a level of diversity greater than in human populations (Figs 4a and S15). Sequences from three Bonobo and one Eastern Chimpanzee revealed a shared and hence potentially ancestral six zinc-finger PRDM9 variant (Fig. 4a) not found in the Western samples, suggesting that Western allelic diversity may have arisen since the separation of the subspecies approximately 0.51 Mya (28). Moreover, patterns of polymorphism among zinc-fingers pointed to recurrent adaptive evolution of DNA-contacting residues, as seen in other mammalian species (10, 23).
Figure 4.
Sequence and structural variation in chimpanzee PRDM9 and implications for hotspot motifs. (a) Schematic representations of the zinc-finger arrays found in chimpanzee PRDM9 alleles with colours representing unique combinations of DNA-contacting amino acids within zinc fingers. Western chimpanzee alleles are labelled W1 through W11. Also shown is the putatively ancestral allele shared between Bonobo and Eastern chimpanzee (A1), and the remaining detected Eastern chimpanzee allele (E1). Tick marks indicate binding specificity to motifs indicated in panel (c). Allele frequencies estimated from 48 Western chimpanzees alleles. (b) Predicted binding motif for the chimpanzee reference PRDM9 allele (W6) showing positions of shared sub-motifs referred to in parts (a) and (c) and a shared set of C residues (below sequence). (c) Recombination rates around shared predicted sub-motifs for chimpanzee PRDM9 alleles in non-repeat DNA (percent of alleles predicted to bind indicated).
In humans, using the same number of hotspots as detected in chimpanzees, we are able to identify the known motifs associated with hotspot activity (Fig. S16). In Western chimpanzees, computationally predicted (23, 29) DNA-binding motifs for the different PRDM9 variants showed considerable overlap of sub-motifs (Fig. S17). However, we found no evidence for local increases in recombination rate around any of the shared sub-motifs (Fig. 4c) or best matches to the predicted binding targets across the genome (23).
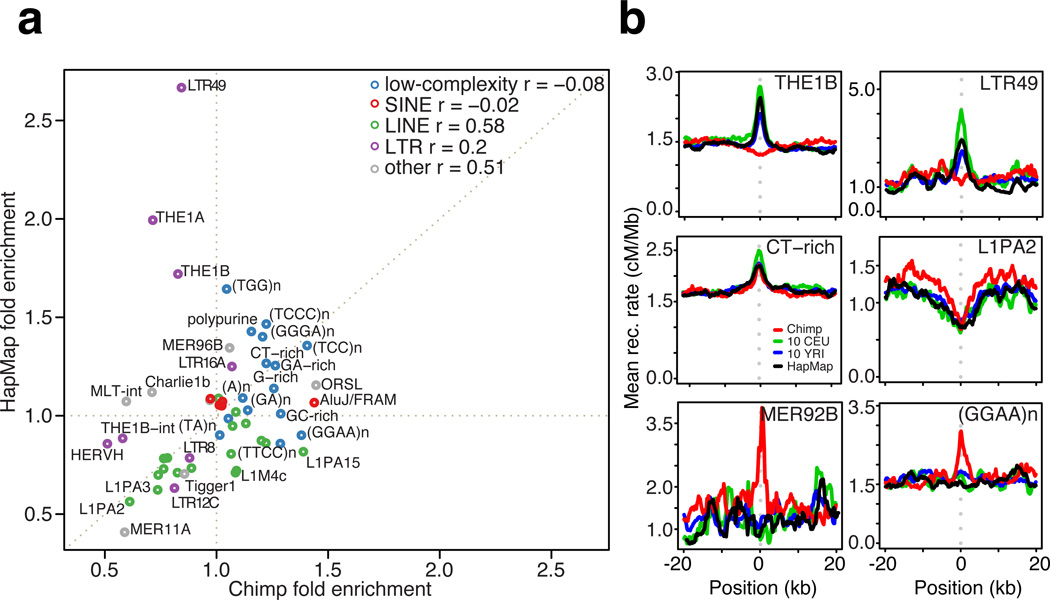
Moreover, a systematic analysis of repeat element families showed no overall correlation in recombination-localising activity between humans and chimpanzees (Fig. 5a). The strongest activating repeats in humans (LTR49, THE1A, and THE1B), which all contain the human PRDM9 A-allele 13 bp binding motif CCTCCCTNNCCAC, suppress recombination in chimpanzees (Fig. 5b top). A second class of elements, typically low-complexity (CT-rich, GA-rich, and G-rich) was found to be weakly activating in both species (Fig. 5b), whereas a few elements (e.g. L1PA2) suppress recombination in both species (Fig. 5b middle right). Only a few elements (notably GGAAn and MER92B elements) showed activation only in chimpanzees (Fig. 5b bottom and Fig. S18). Among these and other repeats, we found that motifs with high GC fraction and CpG dinucleotide content lead to local rate increases in chimpanzees (Table S7). For example, on Alu elements the motif CGGGCGC showed significant hotspot enrichment (pcorrected = 2×10⁻⁴, RR = 1.2), but the effect was better explained by CpG content (Fig. S19).
Figure 5.
Recombination rates around DNA repeat elements in chimpanzees and humans. (a) Recombination-influencing activity of repeat element families in chimpanzees and humans (HapMap). The value reported is the ratio of the peak rate to background rate, as estimated from the robust genetic map after fitting a Gaussian profile using maximum likelihood. Selected repeat elements are labelled. (b) Recombination rate profiles around selected repeat elements, as estimated in the robust map. Top: two elements (THE1B and LTR49) that are recombination-promoting in humans only. Middle: Elements that are recombination-promoting (CT-rich repeats) or recombination suppressing (L1PA2) in both humans and chimpanzees. Bottom: Two elements (GGAAn and MER92B) that are recombination-promoting in chimpanzees only.
We also carried out an exhaustive search for short DNA motifs enriched in non-repeat DNA recombination hotspots relative to cold-spots, which identifies the known motifs CCTCCCT and CCCCACCCC and related sequences in the samples of ten humans (14) (RR = 1.16 and 1.28 respectively; p<1e-10 after Bonferroni correction). In chimpanzees, the same approach only identifies two motifs, CGCG and CCCGGC, that are significantly enriched in chimpanzee hotspots after Bonferroni correction (corrected p=0.0024, RR = 1.28 and p=0.015, RR = 1.31 respectively; Table S8). Both motifs are typical of CpG islands. Overall, we could not identify any motif that was consistently activating in chimpanzees across multiple backgrounds (Fig. S20).
The influence of recombination on sequence evolution
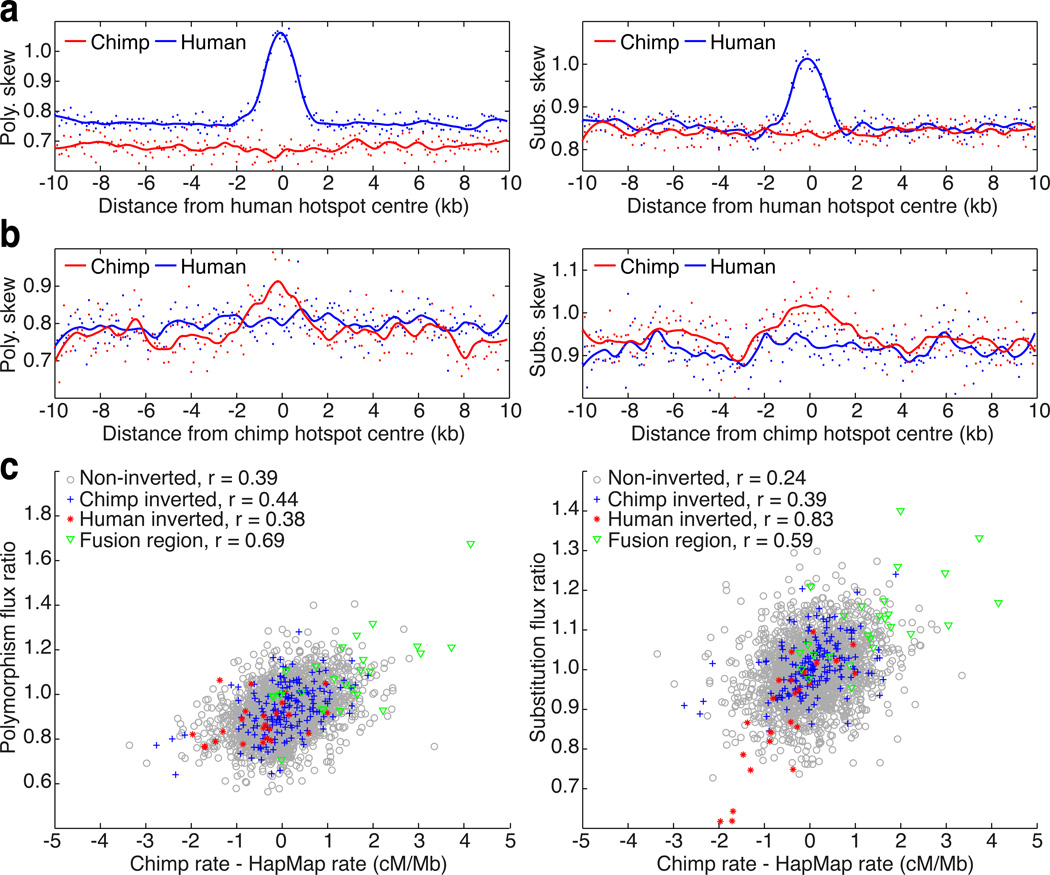
Shifts in both local and broad-scale patterns of recombination between humans and chimpanzees act as natural experiments that reveal the effect of recombination on patterns of molecular evolution while other factors, for example, gene density, remain similar. In particular, we can assess the ability of recombination to drive local increases in GC content through a preference for GC bases during mismatch repair within gene conversion tracts (30–31). Around human hotspots, we observed strong GC-skew in both patterns of polymorphism (40% increase in GC-skew at the hotspot centre) and substitution (20% increase in GC-skew), but only for mutations on the human lineage (Figs 6a and S21). In chimpanzees, we observed much weaker signals of GC-bias (18% increase in GC-skew at the hotspot centre for polymorphisms compared to 10% increase for substitutions; Fig. 6b), despite comparable density and intensity for chimpanzee and human hotspots. These observations are consistent with a recent origin for hotspot locations in both species, and a more recent origin in chimpanzees.
Figure 6.
The influence of broad and fine-scale changes in recombination rate on GC-promoting mutations. (a) GC-skew (defined as the ratio of the number of GC increasing changes compared to GC decreasing changes; see Supplementary Material) in both polymorphism (left) and substitutions (right). Estimates from mutations on the human lineage are indicated in blue, whereas those on the chimpanzee lineage are in red. Smoothed lines estimated using loess. The observed increase in skew in human is completely absent in chimpanzee. (b) As for (a), but around hotspots detected in chimpanzee. While the pattern of skew in chimpanzee is considerably weaker than for (a), no corresponding skew is observed in human. (c) Broad-scale (1Mb) effects of changes in recombination rate between chimpanzees and humans on patterns of GC-skew in polymorphism (left) and substitution (right). Flux ratio is defined as the ratio of the GC skews in chimpanzee compared to human. Chimpanzee recombination rate estimates from the robust genetic map. Colours indicate different parts of the genome, with Pearson correlation coefficient indicated.
At the megabase scale, we found that changes in the rate of recombination between species correlate with changes in GC-bias in both substitutions and polymorphisms (Fig. 6c). The correlation was stronger in polymorphism (r = 0.39 in non-rearranged regions) than substitution (r = 0.25), consistent with the changes in broad-scale recombination being evolutionarily recent. We see stronger correlations in regions that have experienced chromosomal rearrangements, where the changes in recombination rate have typically been greater. The most striking changes are seen in the chromosome 2 fusion region, where the suppression of recombination in the regions syntenic to the short arms of chimpanzee chromosomes 2a and 2b has led to a large reduction in GC-skew over megabase scales (32).
Discussion
Our study demonstrates how fine-scale genetic maps can be obtained by the analysis of patterns of genetic variation obtained from population sequencing. Studying humans and Western Chimpanzees, we found no hotspot sharing between the two species, consistent with earlier reports based on limited data (2–6). The complete lack of hotspot sharing is consistent with the hypothesis that in humans PRDM9 plays a critical role in localising cross-over activity at all hotspots, not just those that contain clear matches to previously-identified motifs bound by PRDM9. In spite of the dramatic shift in hotspot locations between the two species, we found that some fine-scale patterns, particularly the average profile of recombination rate around genes and CpG islands, remain similar, pointing to the importance of chromatin state in influencing where double strand breaks occur (19) or to additional levels of control acting on broader scales (19, 33).
A notable difference between the species is that in chimpanzees no repeat elements, simple DNA motifs or predicted PRDM9 binding sites are strongly or consistently associated with hotspot locations. There are three possible explanations. First, PRDM9 may have lost its role in specifying hotspot locations in chimpanzees, as has occurred in dogs, although we find no evidence for inactivating mutations (34). Second, PRDM9 alleles may each have similar specificity to target DNA sequences, but the substantial allelic diversity and their possibly recent origin may obscure signals for individual alleles. However, this hypothesis cannot explain why, when the density and strength of hotspots at the population level are similar in African populations and Western Chimpanzees (Fig. 2c), we can recover known PRDM9-binding motifs in humans but no comparable motif in chimpanzees. Third, PRDM9 may play the same role as in humans and mice, but individual PRDM9 alleles may bind to a much greater variety of target sequences than do the predominant human alleles. If so, hotspot localisation in chimpanzees may be more strongly driven by other factors, such as chromatin state. Whichever hypothesis is correct, one consequence is that, across the genome, no motif in chimpanzees will be strongly targeted for depletion by the inherent self-destructive drive of hotspots (though specific instances may be).
Our results also reveal the different processes that operate at fine and broad scales. At broad-scales, we find substantial correlation in recombination rate between the species, which is disrupted by chromosomal rearrangement. However, even among conserved regions, less than 40% of the variance in chimpanzee recombination rate at 1Mb can be explained by the human rate. Determining the factors that shape stasis and change in broad-scale recombination rates presents a key challenge in the study of recombination. A population sequencing approach, such as the one taken here, should enable further informative studies of recombination across a wide range of species.
Supplementary Material
Acknowledgements
Funded from the NIH grants R01 GM83098 to MP and T32 GM007197 to EL, Wellcome Trust grants 076113/E/04/Z to PD, 086084/Z/08/Z to GM and 090532/Z/09/Z contribution to Core Facility. PD was supported in part by a Wolfson-Royal Society Merit Award. MP is supported by the Howard Hughes Medical Institute. OV is funded by Wellcome Trust studentship (086786/Z/08/Z). We thank G. Sella, G. McVicker, members of the PPS labs and reviewers for their comments and H. Thorogood and W. Czyz for assistance with PRDM9 sequencing. Part of this work has been supported by EUPRIM-Net under the EU contract RII3-026155 of the 6th Framework Programme. Data are available from http://panmap.uchicago.edu.
References
- 1.Coop G, Przeworski M. Nat Rev Genet. 2007 Jan;8:23. doi: 10.1038/nrg1947. [DOI] [PubMed] [Google Scholar]
- 2.Myers S, et al. Science. 2010 Feb 12;327:876. [Google Scholar]
- 3.Ptak SE, et al. Nat Genet. 2005 Apr;37:429. doi: 10.1038/ng1529. [DOI] [PubMed] [Google Scholar]
- 4.Ptak SE, et al. PLoS Biol. 2004 Jun;2:e155. doi: 10.1371/journal.pbio.0020155. [DOI] [PMC free article] [PubMed] [Google Scholar]
- 5.Winckler W, et al. Science. 2005 Apr 1;308:107. [Google Scholar]
- 6.Wall JD, Frisse LA, Hudson RR, Di Rienzo A. Am J Hum Genet. 2003 Dec;73:1330. doi: 10.1086/380311. [DOI] [PMC free article] [PubMed] [Google Scholar]
- 7.Baudat F, et al. Science. 2010 Feb 12;327:836. doi: 10.1126/science.1183439. [DOI] [PMC free article] [PubMed] [Google Scholar]
- 8.Parvanov ED, Petkov PM, Paigen K. Science. 2010 Feb 12;327:835. doi: 10.1126/science.1181495. [DOI] [PMC free article] [PubMed] [Google Scholar]
- 9.Grey C, et al. PLoS Biol. 2011 Oct;9 doi: 10.1371/journal.pbio.1001176. e1001176. [DOI] [PMC free article] [PubMed] [Google Scholar]
- 10.Oliver PL, et al. PLoS Genet. 2009 Dec;5 doi: 10.1371/journal.pgen.1000617. e1000753. [DOI] [PMC free article] [PubMed] [Google Scholar]
- 11.Berg IL, et al. Nat Genet. 2010 Oct;42:859. doi: 10.1038/ng.658. [DOI] [PMC free article] [PubMed] [Google Scholar]
- 12.Berg IL, et al. Proc Natl Acad Sci U S A. 2011 Jul 26;108:12378. doi: 10.1073/pnas.1109531108. [DOI] [PMC free article] [PubMed] [Google Scholar]
- 13.Hinch AG, et al. Nature. 2011 Aug 11;476:170. [Google Scholar]
- 14.Myers S, Bottolo L, Freeman C, McVean G, Donnelly P. Science. 2005 Oct 14;310:321. doi: 10.1126/science.1117196. [DOI] [PubMed] [Google Scholar]
- 15.Kong A, et al. Nature. 2010 Oct 28;467:1099. [Google Scholar]
- 16.The International HapMap Consortium. Nature. 2007 Oct 18;449:851. [Google Scholar]
- 17.Smagulova F, et al. Nature. 2011 Apr 21;472:375. doi: 10.1038/nature09869. [DOI] [PMC free article] [PubMed] [Google Scholar]
- 18.Mancera E, Bourgon R, Brozzi A, Huber W, Steinmetz LM. Nature. 2008 Jul 24;454:479. doi: 10.1038/nature07135. [DOI] [PMC free article] [PubMed] [Google Scholar]
- 19.Pan J, et al. Cell. 2011 Mar;4144:719. [Google Scholar]
- 20.McVean GA, et al. Science. 2004 Apr 23;304:581. doi: 10.1126/science.1092500. [DOI] [PubMed] [Google Scholar]
- 21.Stumpf MP, McVean GA. Nat Rev Genet. 2003 Dec;4:959. doi: 10.1038/nrg1227. [DOI] [PubMed] [Google Scholar]
- 22.The 1000 Genomes Project Consortium. Nature. 2010 Oct 28;467:1061. [Google Scholar]
- 23.Detailed information on methods and analyses can be found in the supplementary material available online.
- 24.IJdo JW, Baldini A, Ward DC, Reeders ST, Wells RA. P Natl Acad Sci USA. 1991 Oct 15;88:9051. doi: 10.1073/pnas.88.20.9051. [DOI] [PMC free article] [PubMed] [Google Scholar]
- 25.Myers S, Freeman C, Auton A, Donnelly P, McVean G. Nat Genet. 2008 Sep;40:1124. doi: 10.1038/ng.213. [DOI] [PubMed] [Google Scholar]
- 26.Ramirez-Carrozzi VR, et al. Cell. 2009 Jul 10;138:114. doi: 10.1016/j.cell.2009.04.020. [DOI] [PMC free article] [PubMed] [Google Scholar]
- 27.Petes TD. Nat Rev Genet. 2001 May;2:360. doi: 10.1038/35072078. [DOI] [PubMed] [Google Scholar]
- 28.Caswell JL, et al. PLoS genetics. 2008 Apr;4 doi: 10.1371/journal.pgen.1000057. e1000057. [DOI] [PMC free article] [PubMed] [Google Scholar]
- 29.Persikov AV, Singh M. Physical biology. 2011 Jun;8 doi: 10.1088/1478-3975/8/3/035010. 035010. [DOI] [PMC free article] [PubMed] [Google Scholar]
- 30.Spencer CC, et al. PLoS Genet. 2006 Sep 22;2:e148. doi: 10.1371/journal.pgen.0020148. [DOI] [PMC free article] [PubMed] [Google Scholar]
- 31.Katzman S, Capra JA, Haussler D, Pollard KS. Genome biology and evolution. 2011;3:614. doi: 10.1093/gbe/evr058. [DOI] [PMC free article] [PubMed] [Google Scholar]
- 32.Dreszer TR, Wall GD, Haussler D, Pollard KS. Genome Res. 2007 Oct;17:1420. doi: 10.1101/gr.6395807. [DOI] [PMC free article] [PubMed] [Google Scholar]
- 33.Paigen K, Petkov P. Nat Rev Genet. 2010 Mar;11:221. doi: 10.1038/nrg2712. [DOI] [PMC free article] [PubMed] [Google Scholar]
- 34.Axelsson E, Webster MT, Ratnakumar A, Ponting CP, Lindblad-Toh K. Genome Res. 2012 Jan;22:51. doi: 10.1101/gr.124123.111. [DOI] [PMC free article] [PubMed] [Google Scholar]
Associated Data
This section collects any data citations, data availability statements, or supplementary materials included in this article.


