Abstract
Iterative image reconstruction algorithms for optoacoustic tomography (OAT), also known as photoacoustic tomography, have the ability to improve image quality over analytic algorithms due to their ability to incorporate accurate models of the imaging physics, instrument response, and measurement noise. However, to date, there have been few reported attempts to employ advanced iterative image reconstruction algorithms for improving image quality in three-dimensional (3D) OAT. In this work, we implement and investigate two iterative image reconstruction methods for use with a 3D OAT small animal imager: namely, a penalized least-squares (PLS) method employing a quadratic smoothness penalty and a PLS method employing a total variation norm penalty. The reconstruction algorithms employ accurate models of the ultrasonic transducer impulse responses. Experimental data sets are employed to compare the performances of the iterative reconstruction algorithms to that of a 3D filtered backprojection (FBP) algorithm. By use of quantitative measures of image quality, we demonstrate that the iterative reconstruction algorithms can mitigate image artifacts and preserve spatial resolution more effectively than FBP algorithms. These features suggest that the use of advanced image reconstruction algorithms can improve the effectiveness of 3D OAT while reducing the amount of data required for biomedical applications.
1. INTRODUCTION
Optoacoustic tomography (OAT), also known as photoacoustic tomography, is a rapidly emerging imaging modality that has great potential for a wide range of biomedical imaging applications (Oraevsky & Karabutov, 2003; Wang, 2008; Kruger, et al., 1999; Cox, et al., 2006). OAT is a hybrid imaging method in which biological tissues are illuminated with short laser pulses, which results in the generation of internal acoustic wavefields via the thermoacoustic effect. The initial amplitudes of the induced acoustic wavefields are proportional to the spatially variant absorbed optical energy density in the tissue. The propagated acoustic wavefields are detected by use of a collection of wide-band ultrasonic transducers that are located outside the object. From knowledge of these acoustic data, an image reconstruction algorithm is employed to estimate the absorbed optical energy density within the tissue.
A variety of analytic image reconstruction algorithms for three-dimensional (3D) OAT have been developed (Kunyansky, 2007; Finch, et al., 2004; Xu & Wang, 2005; Xu, et al., 2002). These algorithms are of filtered backprojection forms and assume that the underlying model that relates the object function to measured data is a spherical Radon transform. Analytic image reconstruction algorithms generally possess several limitations that impair their performance. For example, analytic algorithms are often based on discretization of a continuous reconstruction formula and require the measured data to be densely sampled on an aperture that encloses the object. This is problematic for 3D OAT, in which acquiring densely sampled acoustic measurements on a two-dimensional (2D) surface can require expensive transducer arrays and/or long data-acquisition times if a mechanical scanning is employed. Moreover, the simplified forward models, such as the spherical Radon transform, upon which analytic image reconstruction algorithms are based, do not comprehensively describe the imaging physics or response of the detection system (Wang, et al., 2011a). Finally, analytic methods ignore measurement noise and will generally yield images that have suboptimal trade-offs between image variances and spatial resolution. The use of iterative image reconstruction algorithms (Fessler, 1994; Anastasio, et al., 2005; Wernick M. N. & Aarsvold, 2004; Pan, et al., 2009) can circumvent all of these shortcomings.
When coupled with suitable OAT imager designs, iterative image reconstruction algorithms can improve image quality and permit reductions in data-acquistion times as compared with those yielded by use of analytic reconstruction algorithms. Because of this, the development and investigation of iterative image reconstruction algorithms for OAT (Paltauf, et al., 2002) is an important research topic of current interest. Recent studies have sought to develop improved discrete imaging models (Yuan & Jiang, 2007; Ephrat, et al., 2008; Buehler, et al., 2011; Wang et al., 2011a) as well as advanced reconstruction algorithms (Provost & Lesage, 2009; Guo, et al., 2010; Wang, et al., 2011b). The majority of these studies utilize approximate 2D imaging models and measurement geometries in which focused transducers are employed to suppress out-of-plane acoustic signals and/or a thin object embedded in an acoustically homogeneous background is employed. Because image reconstruction of extended objects in OAT is inherently a 3D problem, 2D image reconstruction approaches may not yield accurate values of the absorbed optical energy density even when the measurement data are densely sampled. This is due to the fact that simplified 2D imaging models cannot accurately describe transducer focusing and out-of-plane acoustic scattering effects; this results in inconsistencies between the imaging model and the measured data that can result in artifacts and loss of accuracy in the reconstructed images.
Several 3D OAT imaging systems have been constructed and investigated (Kruger, et al., 2010; Ephrat et al., 2008; Brecht, et al., 2009b). These systems employ unfocused ultrasonic transducers and analytic 3D image reconstruction algorithms. Only limited studies of the use of iterative 3D algorithms for reconstructing extended objects have been conducted; and these studies employed simple phantom objects (Paltauf et al., 2002; Wang et al., 2011b; Wang, et al., 2012; Ephrat et al., 2008). Moreover, iterative image reconstruction in 3D OAT can be extremely computationally burdensome, which can require the use of high performance computing platforms. Graphics processing units (GPUs) can now be employed to accelerate 3D iterative image reconstruction algorithms to the point where they are feasible. However, there remains an important need for the development of accurate discrete imaging models and image reconstruction algorithms for 3D OAT and an investigation of their ability to mitigate different types of measurement errors found in real-world implementations.
In this work, we implement and investigate two 3D iterative image reconstruction methods for use with a small animal OAT imager. Both reconstruction algorithms compensate for the ultrasonic transducer responses but employ different regularization strategies. We compare the different regularization strategies by use of quantitative measures of image quality. Unlike previous studies, we apply the 3D image reconstruction algorithms not only to experimental phantom data but also to the data from a mouse whole-body imaging experiment. The aim of this study is to demonstrate the feasibility and efficacy of iterative image reconstruction in 3D OAT and to identify current limitations in its performance.
The remainder of the article is organized as follows: In Section 2, we derive the numerical imaging model that is employed by the iterative image reconstruction algorithms and briefly review the three image reconstruction algorithms. Section 3 describes the experimental studies including the data acquisition, implementation details, and approaches for image quality assessment. The numerical results are presented in Section 4, and a discussion of our findings is presented in Section 5.
2. Background: imaging models and reconstruction algorithms for 3D OAT
Iterative image reconstruction algorithms commonly employ a discrete imaging model that relates the measured data to an estimate of the sought-after object function. We previously proposed a general procedure for constructing discrete OAT imaging models that incorporate the spatial and acousto-electric impulse responses of an ultrasonic transducer (Wang et al., 2011a). We review the salient features of this procedure in Section 2.1. For use in the studies presented in this work, in Section 2.2 we reformulate the discrete imaging model in the temporal-frequency space for the case of flat rectangular ultrasonic transducers.
2.1. Discrete imaging model in the time-domain
A canonical OAT imaging model in its continuous form is expressed as (Wang & Wu, 2007; Oraevsky & Karabutov, 2003; Wang et al., 2011a):
| (1) |
where p(r’, t) denotes the acoustic pressure measured at location r’ and time t, A(r) denotes the sought-after absorbed optical energy density, I(t) describes the normalized temporal profile of the illumination pulse, δ(t) is the Dirac delta function, V denotes the object’s support volume, *t denotes 1D temporal convolution, and β, c0, and Cp denote the thermal coefficient of volume expansion, (constant) speed-of-sound, and the specific heat capacity of the medium at constant pressure, respectively. Because many OAT applications employ a laser pulse of nano-seconds in duration, we assume I(t) ≈ δ(t) in this study. In accordance, we drop the last temporal convolution in (1) hereafter. This model assumes an idealized data-acquisition process and neglects finite sampling effects.
In practice, the acoustic pressure is converted to a voltage signal by use of ultrasonic transducers that is subsequently sampled and recorded. Consider that the ultrasonic transducers collect data at Q locations that are specified by the index q = 0,…, Q − 1 and K temporal samples, specified by the index k = 0,…, K − 1, are acquired at each location with a sampling interval ΔT . A continuous-to-discrete (C-D) imaging model (Barrett & Myers, 2004; Wang & Anastasio, 2011) for OAT can be generally expressed as (Wang et al., 2011a):
| (2) |
where uq(t) is the pre-sampled electric voltage signal corresponding to location index q, the surface integral is over the detecting area of the q-th transducer denoted by Οq, and he(t) denotes the acousto-electric impulse response (EIR) of transducers. The QK × 1 vector u denotes a lexiographically ordered version of the sampled data. The notation [u]qK+k is employed to denote the (qK + k)-th element of u. The pressure data function p(r’, t) is determined by A(r) via (1). Accordingly, the C-D mapping given by (2) maps the function A(r) to the measurement vector u.
To obtain a discrete-to-discrete (D-D) imaging model for use with iterative image reconstruction algorithms, a finite-dimensional approximate representation of the object function A(r) can be introduced. We have previously employed (Wang et al., 2011a) the representation
| (3) |
where the superscript a indicates that Aa(r) is an approximation of A(r) and are expansion functions defined as
| (4) |
Here, rn= (xn, yn, zn)T specifies the coordinate of the n-th grid point of a uniform Cartesian lattice and ε is the half spacing between lattice points. The n-th component of the coefficient vector θ is defined as
| (5) |
where Vcube and Vsph are the volumes of a cubic voxel of dimension 2ε and of a spherical voxel of radius ε respectively.
Let denote the pre-sampled voltage signal that would be produced by the absorbed optical energy density Aa(r). Note that is an approximation of uq(t), which would be produced by A(r). By use of (1)-(3), it can be verified that
 |
(6) |
where H(t) is Heaviside step function, p0(t) is the ‘N’-shape pressure profile produced by a uniform sphere of radius ε, and denotes the spatial impulse response (SIR) of the q-th transducer. By temporally sampling (6) and employing the approximation , one can establish (Wang et al., 2011a) a D-D imaging model as
| (7) |
where the system matrix Ht maps the coefficient vector θ, which determines Aa(r), to the measured temporal samples of the voltage signals.
2.2. Temporal frequency-domain version of the discrete imaging model
Because a transducer’s EIR he(t) must typically be measured, it generally cannot be described by a simple analytic expression. Accordingly, the two temporal convolutions in (6) must be approximated by use of discrete time convolution operations. However, both p0(t) and are very narrow functions of time, and therefore temporal sampling can result in strong aliasing artifacts unless very large sampling rates are employed. As described below, to circumvent this we reformulated the D-D imaging model in the temporal frequency domain.
Consider (6) expressed in the temporal frequency domain:
| (8) |
where f is the temporal frequency variable conjugate to t and a ‘ ~ ’ above a function denotes the Fourier transform of that function defined as:
| (9) |
For f ≠ 0, the temporal Fourier transform of p0(t) is given by
| (10) |
When the transducer has a flat and rectangular detecting surface of area a × b, under the far-field assumption, the temporal Fourier transform of the SIR is given by (Stepanishen, 1971):
| (11) |
where and specify the transverse coordinates in a local coordinate system that is centered at the q-th transducer, as depicted in Figure 1, corresponding to the location of a point source described by a 3D Dirac delta function. The SIR does not depend on the third coordinate (ztr) specifying the point-source location due to the far-field assumption. Given the voxel location rn = (xn, yn, zn) and transducer location , expressed in spherical coordinates as shown in Figure 1, the corresponding values of the local coordinates can be computed as:
| (12) |
| (13) |
Figure 1.
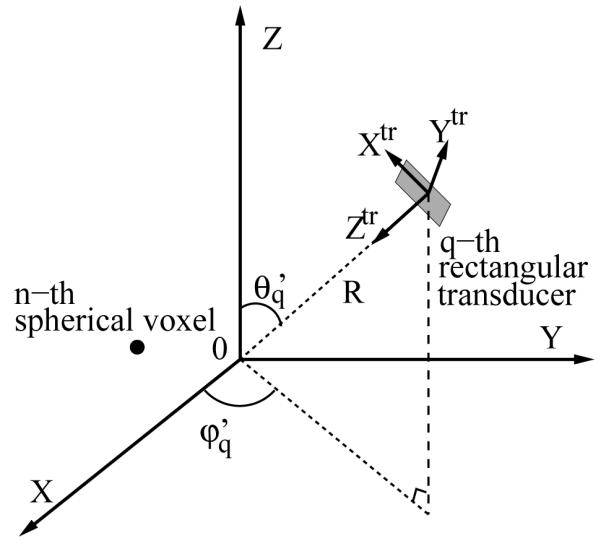
Schematic of the local coordinate system for the q-th transducer where the ztr-axis points to the origin of the global coordinate system, the xtr and ytr-axes are along the two edges of the rectangular transducer respectivley.
Equation (8) can be discretized by considering L temporal frequency samples specified by a sampling interval Δf that are referenced by the index l = 0, 1,…, L − 1. Utilizing the approximation yields the D-D imaging model:
| (14) |
where H is the system matrix of dimension QL × N, whose elements are defined by
| (15) |
The imaging model in (14) will form the basis for the iterative image reconstruction studies described in the remainder of the article.
2.3. Reconstruction algorithms
We investigated a 3D filtered backprojection algorithm (FBP) and two iterative reconstruction algorithms that employed different forms of regularization.
Filtered backprojection
A variety of FBP type OAT image reconstruction algorithms have been developed based on the continuous imaging model described by (1) (Kunyansky, 2007; Finch et al., 2004; Xu & Wang, 2005; Xu et al., 2002). If sampling effects are not considered and a closed measurement surface is employed, these algorithms provide a mathematically exact mapping from the acoustic pressure function p(r’, t) to the obsorbed energy density function A(r). Since we only have direct access to electric signals in practice, in order to apply FBP algorithms, we need to first estimate the sampled values of the acoustic pressure data from the measured electric signals. In this study, we considered a spherical scanning geometry. When the object is near the center of the measurement sphere, the surface integral over Οq in (2), i.e., SIR effect, is negligible. The remaining EIR effect is described by a temporal convolution. We employed linear regularized Fourier deconvolution (Kruger et al., 1999) to estimate the pressure data, expressed in temporal frequency domain as:
| (16) |
where is a window function for noise suppression. In this study, we adopted the Hann window function defined as:
| (17) |
where fc is the cutoff frequency. We implemented the following FBP reconstruction formula for a spherical measurement geometry (Finch et al., 2004):
| (18) |
where Rs and S denote the radius and surface area of the measurement sphere respectively. Note that the value of the cutoff frequency fc controls the degree of noise suppression during the deconvolution, thus indirectly regularizing the FBP algorithm.
Penalized least-squares with quadratic penalty
PLS reconstruction methods seek to minimize a cost-function of the form as:
| (19) |
where R(θ) is a regularizing penalty term whose impact is controlled by the regularization parameter α. We employed the conventional quadratic smoothness Laplacian penalty given by (Fessler, 1994):
| (20) |
where kx1 and kx2 were the indices of the two neighbor voxels before and after the n-th voxel along x-axis. Similarly, ky1, ky2 and kz1, kz2 were the indices of the neighbor voxels along y- and z-axis respectively. The reconstruction algorithm for solving (19) was based on the Fletcher Reeves version of conjugate gradient (CG) method (Wernick M. N. & Aarsvold, 2004), and will be referred to as the PLS-Q algorithm.
Penalized least-squares with total variation norm penalty
We also investigated the PLS algorithm regularized by a TV-norm penalty. This method seeks to minimize a cost-function of the form as:
| (21) |
where β is the regularization parameter, and a non-negativity constraint is employed. The TV-norm is defined as
| (22) |
We implemented the fast iterative shrinkage/thresholding algorithm (FISTA) to solve (21) (Beck & Teboulle, 2009), which will be referred to as PLS-TV algorithm.
3. Descriptions of numerical studies
3.1. Experimental data acquisition
Scanning geometry
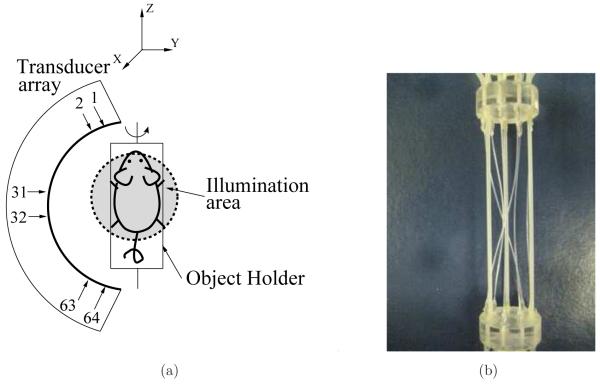
The small animal OAT imager employed in our studies has been described in previous publications (Ermilov, et al., 2009; Brecht, et al., 2009a; Brecht et al., 2009b). As illustrated in Figure 2-(a), the arc-shaped probe consisted of 64 transducers that spanned 152 degrees over a circle of radius 65-mm. Each transducer possessed a square detecting area of size 2 × 2-mm2. The laser illuminated the object from rectangular illumination bars in orthogonal mode. During scanning, the object was mounted on the object holder and rotated over the full 360 degrees while the probe and light illumination stayed stationary. Scans were set to sample at 20MHz over 1536 samples with an amplification of 60dB and 64 averages per acquisition.
Figure 2.
(a) Schematic of the 3D OAT scanning geometry; (b) Photograph of the six-tube phantom.
Six-tube phantom
A physical phantom was created that contained three pairs of polytetrafluoroethylene thin walled tubing of 0.81-mm in diameter that were filled with different concentrations of nickel sulfate solution having absorption coefficient values of 5.681-cm−1, 6.18-cm−1, and 6.555cm−1. The tubes were held within a frame of two acrylic discs of 1#x201D; diameter that were separated at a height of 3.25#x201D; and kept attached by three garolite rods symmetrically spaced 120° apart. The tubing was such that each pair would contain a tube that would follow along the outside of the phantom and the second would be diagonally inside. A photograph of the phantom is shown in Fig. 2-(b). The entire phantom was encased inside a thin latex membrane that was filled with skim milk to create an optically scattering medium. A titanium sapphire laser with a peak at 765-nm and a pulse width of 16ns (Quanta Systems) were employed to irradiate the phantom. The temperature of the water bath was kept at approximately 29.5°C with a water pump and heater. A complete tomographic data set was acquired by rotating the object about 360° in 0.5° steps. Accordingly, data were recorded by each transducer on the probe at 720 tomographic view angles about the vertical axis.
Mouse whole-body imaging
A 6 to 7 week old athymic Nude-Foxn1nu live mouse (Harlan, Indianapolis, Indiana) was imaged with a similar setup to the phantom scan with a customized holder that provided air to the mouse when it was submerged in water. The holder was essentially comprised of three parts: 1) a hollow acrylic cylinder for breathing, 2) an acrylic disc with hole for mouse tail and an apparatus to attach the legs, and 3) pre-tensioned fiber glass rods to connect the two acrylic pieces. The mouse was given pure oxygen with a flow rate of 2L/min with an additional 2% isoflurane concentration for initial anesthesia. During scanning the isoflurane was lowered to be around 1.5%. The temperature of water was held constant at 34.7°C with the use of a PID temperature controller connected to heat pads (Watlow Inc., Columbia, MO) underneath the water tank. A bifurcated optical fiber was attached to a ND:YAG laser (Brilliant, Quantel, Bozeman, MT) operating at 1064-nm wavelength with a energy pulse of about 100-mJ during scans and a pulse duration of 15-ns. The optical fiber outputs were circular beams of approximately 8-cm at the target with an estimated 25-mJ directly out of each fiber. Illumination was done in orthogonal mode along the sides of the water tank with in width of 16”. A complete tomographic data set was acquired by rotating the object about 360° in 2° steps. Accordingly, data were recorded by each transducer on the probe at 180 tomographic view angles about the vertical axis. More details regarding the data acquisition procedure can be found in (Brecht et al., 2009a; Brecht et al., 2009b).
3.2. Implementation of reconstruction algorithms
Six-tube phantom
The region to-be-reconstructed was of size 19.8 × 19.8 × 50.0-mm3 and centered at (−1 0, 0, −3.0)-mm. The FBP algorithm was employed to determine estimates of A(r) that were sampled on a 3D Cartesian grid with spacing 0.1-mm by use of a discretized form of (18). The iterative reconstruction algorithms employed spherical voxels of 0.1-mm in diameter inscribed in the cuboids of the Cartesian grid. Accordingly, the reconstructed image matrices for all three algorithms were of size 198 × 198 × 500. The speed-of-sound was set at c0= 1.47-mm/μs. We selected the Grüneisen coefficient as Γ=βc2/Cp = 2, 000 of arbitrary units for all implementations. Since the top and bottom transducers received mainly noise for elongated structures that were aligned along z-axis, we utilized only the data that were acquired by the central 54 transducers.
Mouse whole-body imaging
The region to-be-reconstructed was of size 29.4 × 29.4 × 61.6-mm3 and centered at (0.49, 2.17, −2.73)-mm. The FBP algorithm was employed to determine estimates of A(r) that were sampled on a 3D Cartesian grid with spacing 0.14-mm by use of (18). The iterative reconstruction algorithms adopted spherical voxels of 0.14-mm in diameter inscribed in the cuboids of the Cartesian grid. Accordingly, the reconstructed image matrices for all three algorithms were of size 210 × 210 × 440. The speed-of-sound was chosen as c0 = 1.54-mm/μs. We selected the Grüneisen coefficient as Γ = βc2/Cp = 2, 000 of arbitrary units for all implementations. We utilized only the data that were acquired by the central 54 transducers.
Parallel programming by CUDA GPU computing
Three-dimensional iterative image reconstruction is computationally burdensome in general. It demands even more computation when utilizing the system matrix defined by (15), as opposed to the conventional spherical Radon transform model, mainly because the former accumulates contributions from more voxels to compute a single data sample. In addition, calculation of the SIR defined by (11) introduces extra computation. It can take weeks to accomplish a single iteration by sequential programming using a single CPU, which is infeasible for practical applications. Because the calculation of SIR for each pair of transducer and voxel is mutually independent, we parallelized the SIR calculation by use of GPU computing with CUDA (Stone, et al., 2008; Chou, et al., 2011) such that multiple SIR samples were computed simultaneously, dramatically reducing the computational time. The six-tube phantom data were processed by use of 3 NVIDIA Tesla C2050 GPU cards, taking 4.52-hours for one iteration from the data set containing 144 tomographic views, while the mouse-imaging data were processed by use of 6 NVIDIA Tesla C1060 GPU cards, taking 5.73-hours for one iteration from the data set containing 180 tomographic views. Though for testing we let the reconstruction algorithms iterate for over 100 iterations, both PLS-Q and PLS-TV usually converged within 20 iterations.
3.3. Image quality assessment
Visual inspection
We examined both the 3D images and 2D sectional images. To avoid misinterpretations due to display colormap, we compared grayscale images. Also, for each comparison, we varied the grayscale window to ensure the observations are minimally dependent on the display methods. For each algorithm we reconstructed a series of images corresponding to different values of regularization parameter over a wide range. To understand how image intensities are affected by the choice of regularization parameter, each 2D sectional image was displayed in the grayscale window that spanned from the minimum to the maximum of the determined image intensities.
It is more challenging to fairly compare 3D images by visual inspection. Hence we intended not to draw conclusions on which algorithm was superior, but instead to reveal the similarities among algorithms when data were densely sampled. Although for each reconstruction algorithm we reconstructed a series of images corresponding to the values of regularization parameter over a wide range, the main structures within the images appeared very similar in general. Thus we selected a representitive 3D image for each reconstruction algorithms. These representative images correspond to the regularization parameters whose values were near the center of the full ranges and have a very close range of image intensities. We displayed these images in the same grayscale window. For a prechosen grayscale window [θlow, θup], the reconstructed images were truncated as:
| (23) |
The truncated data were linearly projected to the range [0, 255] as 8-bit unsigned integers:
| (24) |
The 3D image data θint8 were visualized by computing maximum intensity projection (MIP) images by use of the Osirix software (Rosset, et al., 2004).
Quantitative metrics
Because the six-tube phantom contained nickel sulfate solution as the only optical absorber, the tubes were interpreted as signals in the reconstructed images, which were contaminated by random noise, e.g., the electronic noise. Since the tubes were immersed in nearly pure scattering media, the reconstructed images were expected to have zero-mean background. In contrary, the mouse whole-body imaging possessed a nonzero-mean background because the absorbing capillaries within blood-rich structures were beyond the 0.5-mm resolution limit (Brecht et al., 2009b) of the imaging system, resulting a diffuse background. Consequently, we interpreted the arteries and veins as signals, which were immersed in nonzero-mean background plus random noise.
Image resolution
Because both the tubes and blood vessels were fine threadlike objects, we quantified the spatial resolution by their thickness. To estimate the thickness of a threadlike object lying along z-axis at certain height, we first selected the 2D sectional image at that height. Subsequently, we truncated the 2D image into dimension of (2Nr + 1)-by-(2Nr + 1) pixels; and adjusted the location of the truncated image such that only a continuous group of pixels corresponding to the structure of interest, or hot spot, was present at the center. We then fitted the 2D sectional image to a 2D Gaussian function given by:
| (25) |
where n1 and n2 denoted the indices of pixels in the 2D digital image with n1, n2 = −Nr, −Nr + 1,…, Nr in units of pixel size, G[0, 0] was the peak value of the Gaussian function located in the center, and σr was the standard deviation of the Gaussian function to be estimated. We let Nr = 15 and Nr = 10 for the six-tube phantom and the mouse imaging respectively. Finally, the estimated σr was converted to full width at half maximum (FWHM) as the spatial resolution measure, i.e.,
| (26) |
Contrast-to-noise ratio (CNR)
For a prechosen structure, a series of adjacent 2D sectional images were selected along the structure (i.e, along z-axis) as described above. We collected the central voxel of each 2D image, forming the signal region-of-interest (s-ROI). The signal intensity was calculated as:
| (27) |
where Ns denoted the total number of voxels within the s-ROI. For the six-tube phantom, the s-ROI for each tube contained Ns = 200 voxels that extended from z = −10.4-mm to z = 9.6-mm, while for the mouse-imaging study, the s-ROI for the vessel under study contained Ns = 20 voxels that extended from z = 7.0-mm to z = 9.8-mm. For each s-ROI, we defined a background region-of-interest (b-ROI) that has the same dimension along z-axis as the s-ROI. For the six-tube phantom, we randomly selected 50 voxels at every height that were within a circle of radius 5-mm centered at the hot spot of the signal. Similarly, for the mouse-imaging study, we randomly selected 15 voxels at every height that were within a circle of radius 2.1-mm centered at the hot spot of the signal. Correspondingly, the b-ROI contained Nb = 10, 000 and Nb = 300 voxels for the six-tube phantom and the mouse-imaging study, respectively. The background intensity was calculated by:
| (28) |
Also, the background standard deviation was calculated by:
| (29) |
Because the reconstructed image is not a realization of an ergodic random process, the value of σb estimated from a single reconstructed image is not equivalent to the standard deviation of the ensemble of images reconstructed by use of a certain reconstruction algorithm. Nevertheless, the σb can be employed as a summary measure of the noise level in the reconstructed images. Consequently, the contrast-to-noise ratio (CNR) was calculated by:
| (30) |
Plot of resolution against standard deviation
All three reconstruction algorithms possess regularization parameters that control the trade-offs among multiple aspects of image quality. A plot of resolution against standard deviation evaluates how much spatial resolution is degraded by a regularization method during its noise suppression. To obtain this plot for each reconstruction algorithm, we swept the value of the regularization parameter. For each value, we reconstructed 3D images and quantified the spatial resolution and noise level by use of (26) and (29) respectively. The FWHM values calculated along the structure of interest were averaged as a summary measure of resolution, denoted by . The average was conducted over 20-mm and 2.8-mm for the six-tube phantom and the mouse imaging respectively. The was plotted against the standard deviation (σb).
Plot of signal intensity against standard deviation
In addition to the trade-off between resolution and standard deviation, regularization parameters also control the trade-off between bias and standard deviation. In general, stronger regularization may introduce higher bias while more effectiviely reducing the variance of the reconstructed image. Because the true values of absorbed energy density were unavailable, we plotted the signal intensity against the image standard variation that were calculated by use of (27) and (29). From this plot, we compared the noise level of the reconstructed images with comparable image intensities and hence with comparable biases.
4. Experimental results
The data for the six-tube phantom and mouse whole-body imaging were collected at 720 and 180 view angles respectively, referred to as full data sets. In order to emulate the scans with reduced numbers of views, we undersampled the full data sets to subsets with different numbers of view angles that were evenly distributed over 2π. These subsets will be referred to as ‘N-view data’ sets, where N is the number of view angles.
4.1. Six-tube phantom
Visual inspection of reconstructed images from densely-sampled data sets
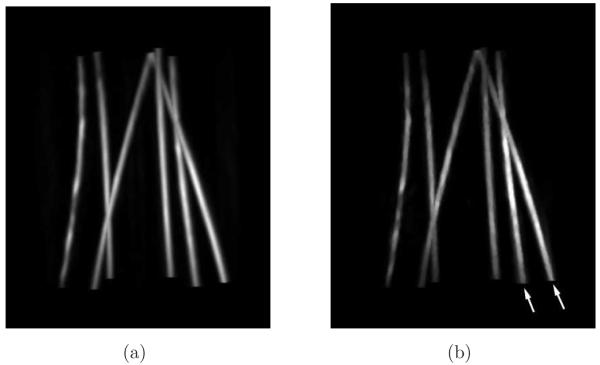
From densely-sampled data sets, the MIP images corresponding to the FBP and the PLS-TV algorithms appear to be very similar as shown in Figure 3. Note that the two images were reconstructed from different data sets: The image reconstructed by use of the FBP algorithm is from the full data set, i.e., the 720-view data set, while the one reconstructed by use of the PLS-TV algorithm is from the 144-view data set. We did not apply iterative reconstruction algorithms to the 720-view data set mainly because of the computational burden. Moreover, the images reconstructed from the 144-view data set by use of the PLS-TV algorithm already appear to be at least comparable with those reconstructed by use of the FBP algorithm from full data set. Certain features are shared by both images. For example, both images contain two tubes (indicated by white arrows) that are brighter than the others, which is consistent with the fact that these two tubes are filled with the solution of higher absorption coefficient (μa = 6.555cm−1). The similarities between the two images are not surprising for two reasons: Firstly, when the pressure function is densely sampled and the object is near the center of the measurement sphere, where the SIR can be neglected, we would expect all three algorithms to perform similarly because the imaging models they are based upon are equivalent in the continuous limit; Also the process of forming the MIP images strongly attenuates the background artifacts.
Figure 3.
MIP renderings of the six-tube phantom images reconstructed (a) from the 720-view data by use of the FBP algorithm with fc = 6-MHz; and (b) from the 144-view data by use of the PLS-TV algorithm with λ = 0.1. The grayscale window is [0,7.0]. Two arrows indicate the two tubes that were filled with the solution of the highest absorption coefficient 6.555-cm−1. (QuickTime)
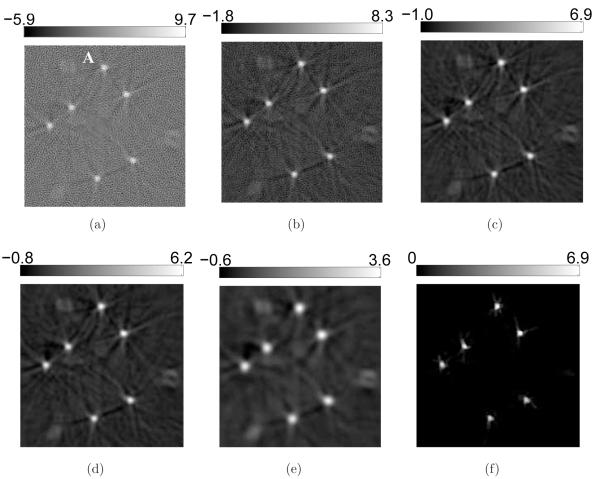
However, 2D sections of the 3D images reveal cerrtain favorable characteristics of the PLS-TV algorithm, as shown in Figure 4. Though we varied the cutoff frequency fc over a wide range for the FBP algorithm, none of these images has background as clean as the image reconstructed by the PLS-TV algorithm. We notice two types of artifacts in the images reconstructed by use of the FBP algorithm: the random noise and the radial streaks centered at the tubes. The former is caused by measurement noise while the latter is likely due to certain unmodeled system inconsistencies that are referred to as systematic artifacts and will be addressed in Section 5. The regularizing low-pass filter mitigates the random noise but also degrades the spatial resolution (Figure 4-b-e). The TV-norm regularization mitigates the background artifacts with minimal sacrifice in spatial resolution. The image reconstructed by use of the PLS-TV algorithm shown in Figure 4-(f) has at least comparable resolution as that of the FBP image with fc = 6-MHz (Figure 4-c).
Figure 4.
Slices corresponding to the plane z = −2.0-mm through the 3D images of the six-tube phantom reconstructed from (a) the 720-view data by use of the FBP algorithm with fc = 10-MHz; (b) the 720-view data by use of the FBP algorithm with fc = 8-MHz; (c) the 720-view data by use of the FBP algorithm with fc = 6-MHz; (d) the 720-view data by use of the FBP algorithm with fc = 4-MHz; (e) the 720-view data by use of the FBP algorithm with fc = 2-MHz; and (f) the 144-view data by use of the PLS-TV algorithm with β = 0.1. All images are of size 19.8 × 19.8-mm2. The ranges of the grayscale windows were determined by the minimum and the maximum values in each image.
Qualitative comparison of regularization methods
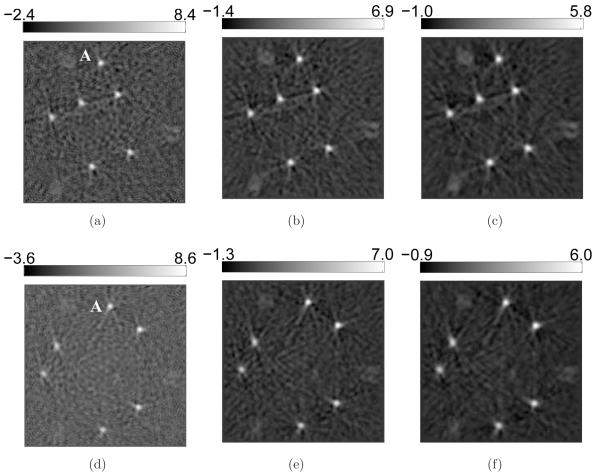
The three reconstruction algorithms are regularized by use of the low-pass filter, the ℓ2-norm smoothness penalty and the TV-norm penalty, respectively. The impacts of the low-pass filter are revealed in Figure 4. We observe that a slight regularization (i.e., a large value of fc) results in sharp but noisy images while a heavy regularization (i.e., a small value of fc) produces clean but blurry images. Also, the intensities of the tubes are lower for a smaller value of fc. Similar effects are observed for the PLS-Q algorithm with the ℓ2-norm smoothness penalty as shown in Figure 5. These observations agree with the conventional understandings of the impacts of regularization summarized as two trade-offs: resolution versus variance and bias versus variance (Fessler, 1994). The TV-norm regularization, however, mitigates the image variance with minimal sacrifice in image resolution as shown in Figure 6. Though the signal intensity is reduced at β = 0.1 (Figure 6-c and -f), the spatial resolution appears to be very close to that of the images corresponding to smaller values of β (Figure 6-a and -d). In addition, both the low-pass filter and the ℓ2-norm penalty have little effects on the systematic artifacts while the TV algorithm effectively mitigates both the systematic artifacts and the random measurement noise.
Figure 5.
Slices corresponding to the plane z = 6.0-mm (top row: a-c) and the plane z = 4.5-mm (bottom row: d-f) through the 3D-images of the six-tube phantom reconstructed from the 144-view data by use of the PLS-Q algorithm with varying regularization parameter α : (a), (d) α = 0; (b), (e) α = 1.0 × 10³; and (c), (f) α = 5.0 × 10³; All images are of size 19.8 × 19.8-mm2. The ranges of the grayscale windows were determined by the minimum and the maximum values in each image.
Figure 6.
Slices corresponding to the plane z = 6.0-mm (top row: a-c) and the plane z = 4.5-mm (bottom row: d-f) through the 3D-images of the six-tube phantom reconstructed from the 144-view data by use of the PLS-TV algorithm with varying regularization parameter β : (a), (d) β = 0.001; (b), (e) β = 0.05; and (c), (f) β = 0.1; All images are of size 19.8 × 19.8-mm2. The ranges of the grayscale windows were determined by the minimum and the maximum values in each image.
Tradeoff between signal intensity and noise level of reconstructed images
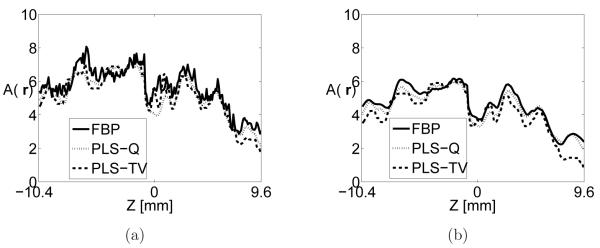
The image intensities in tube-A are plotted as a function of z, as shown in Figure 7 where the location of tube-A is indicated in the 2D image slices as shown in Figure 4-Figure 6. The profiles corresponding to the FBP algorithm were extracted from images reconstructed from the 720-view data set while the profiles corresponding to iterative algorithms were extracted from images reconstructed from the 144-view data set. For each reconstruction algorithm, two profiles are plotted that correspond to moderate and strong regularization as displayed in Figure 7-(a) and (b) respectively. As expected, the quantitative values are smaller when the algorithms are heavily regularized. More importantly, images reconstructed by use of iterative image reconstruction algorithms quantitatively match with those reconstructed by use of FBP algorithm from densely sampled data. In addition, the signal intensities vary gradually along z-axis because the laser was illuminated from the side resulting a higher energy distribution near the center of z-axis. These plots demonstrate the effectiveness of PLS-TV algorithm when the object is not piecewise constant.
Figure 7.
Image profiles along the z-axis through the center of Tube-A extracted from images reconstructed by use of (a) the FBP algorithm with fc = 10-MHz from the 720-view data (solid line) the PLS-Q algorithm with α = 1.0 × 10³ from the 144-view data (dotted line), and the PLS-TV algorithm with β = 0.05 from the 144-view data (dashed line). Subfigure (b) shows the corresponding profiles for the case where each algorithm employed stronger regularization specified by the parameters fc = 5-MHz, α = 5.0 × 10³, and β = 0.1, respectively.
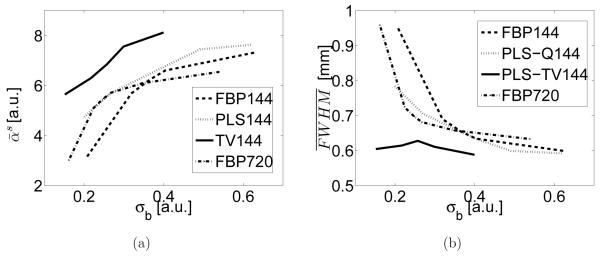
From the same data sets, the signal intensities are plotted against the image standard deviations in Figure 8-(a). This plot suggests that the images reconstructed by use of the PLS-TV algorithm have smaller standard deviation while sharing the same bias as those of images reconstructed by use of the FBP and the PLS-Q algorithms because the same signal intensity indicates the same bias. Note that these curves were obtained from densely sampled data. Visual inspections suggest the systematic artifacts contribute more to the background standard deviation measure than does the measurement random noise. Hence, to be more precise, this plot demonstrates the PLS-TV algorithm outperforms the FBP and the PLS-Q algorithms in the sense of balancing the tradeoff between bias and standard deviation when the signal is present in a uniform background.
Figure 8.
(a) Signal intensity vs. standard deviation curves and (b) image resolution vs. standard deviation curves for the images reconstructed by use of the FBP algorithm from the 144-view data (FBP144), the PLS-Q algorithm from the 144-view data (PLS-Q144), the PLS-TV algorithm from the 144-view data (PLS-TV144), and the FBP algorithm from the 720-view data (FBP720).
Tradeoff between resolution and noise level of reconstructed images
The plots of resolution () against background standard deviation measure (σb) are shown in Figure 8-(b). Clearly, the spatial resolution of the images reconstructed by use of the PLS-TV algorithm is higher than that of the images reconstructed by the FBP and the PLS-Q algorithms while the images having the same background standard deviation. In addition, the curve corresponding to the PLS-TV algorithm is flatter than those corresponding to the FBP and PLS-Q algorithm, suggesting that TV regularization mitigates image noise with minimal sacrifice in spatial resolution. This observation is consistent with our earlier visual inspections of the reconstructed images. It is also interesting to note that the curve corresponding to the PLS-Q algorithm intersects the one corresponding to the FBP algorithm, indicating that conventional iterative reconstruction algorithms may not always outperform the FBP algorithm.
Reconstructed images from sparsely-sampled data sets
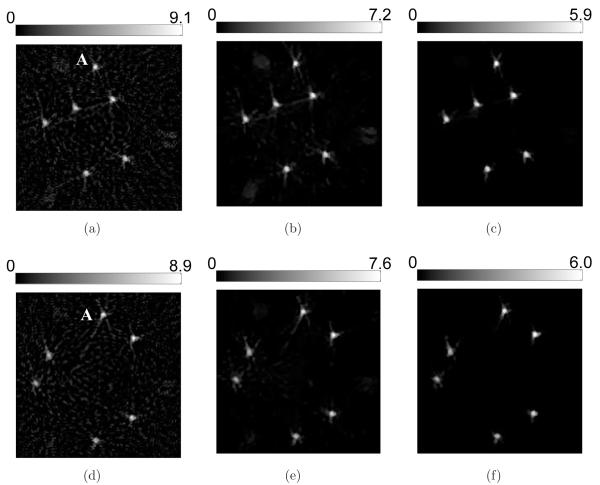
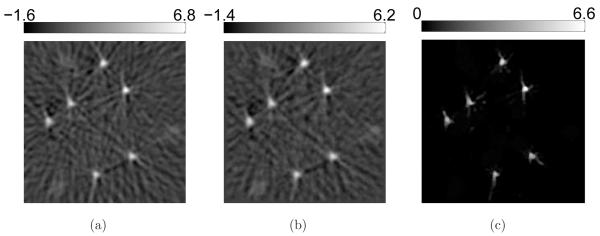
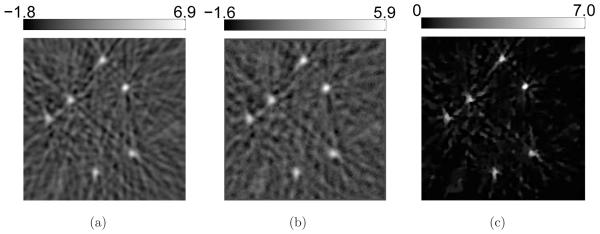
Images reconstructed from the 72-view data set and the 36-view data set are displayed in Figure 9 and Figure 10 respectively. The regularization parameters were selected such that the quantitative values of the images are within the similar range. As expected, from both data sets, the images reconstructed by use of PLS-TV algorithm appear to have higher spatial resolution as well as cleaner backgrounds, suggesting the PLS-TV algorithm can effectively mitigate data incompleteness in 3D OAT.
Figure 9.
Slices corresponding to the plane z = −2.0-mm through the 3D images of the six-tube phantom reconstructed from the 72-view data by use of (a) the FBP algorithm with fc = 3.7-MHz; (b) the PLS-Q algorithm with α = 1.0 × 10³; and (c) the PLS-TV algorithm with β = 0.07. All images are of size 19.8 × 19.8-mm2. The ranges of the grayscale windows were determined by the minimum and the maximum values in each image.
Figure 10.
Slices corresponding to the plane z = −2.0-mm through the 3D images of the six-tube phantom reconstructed from the 36-view data by use of (a) the FBP algorithm with fc = 3.3-MHz; (b) the PLS-Q algorithm with α = 7.0; and (c) the PLS-TV algorithm with β = 0.02; All images are of size 19.8 × 19.8-mm2. The ranges of the grayscale windows were determined by the minimum and the maximum values in each image.
4.2. Mouse whole-body imaging
Visual inspection of reconstructed images from densely-sampled data sets
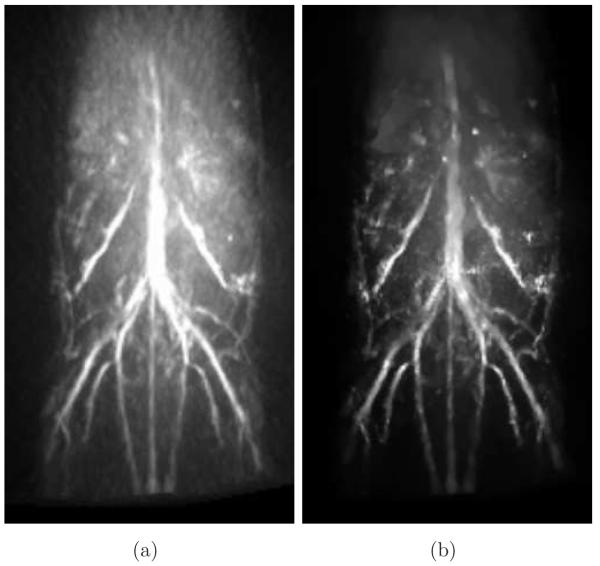
From the 180-view data set, the MIP images corresponding to the FBP and the PLS-TV algorithms appear to be very similar as shown in Figure 11. In contrast to the images of the six-tube phantom that have a uniform background, the mouse whole-body images have a diffuse background. The diffuse background is due to the measurement random noise as well as the capillaries that are beyond the resolution limit of the imaging system (Brecht et al., 2009b), thus carrying little information regarding the object. In general, the images reconstructed by the PLS-TV algorithm appear to have a cleaner background while revealing a sharper appearing body vascular tree. Besides, the left kidney in the images reconstructed by use of the PLS-TV algorithm appears to have a higher contrast than the image reconstructed by use of the FBP algorithm. In addition, comparing with the images reconstructed by use of direct backprojection from the raw data, (see figure 6 in (Brecht et al., 2009a)), both our algorithms appear to improve the continuity of blood vessels. We believe this is because our algorithms are based on an imaging model that incorporates the transducer SIR and EIR.
Figure 11.
MIP renderings of the 3D images of the mouse body reconstructed from the 180-view data by use of (a) the FBP algorithm with fc = 5-MHz; and (b) the PLS-TV algorithm with β = 0.05; The grayscale window is [0,12.0]. (QuickTime)
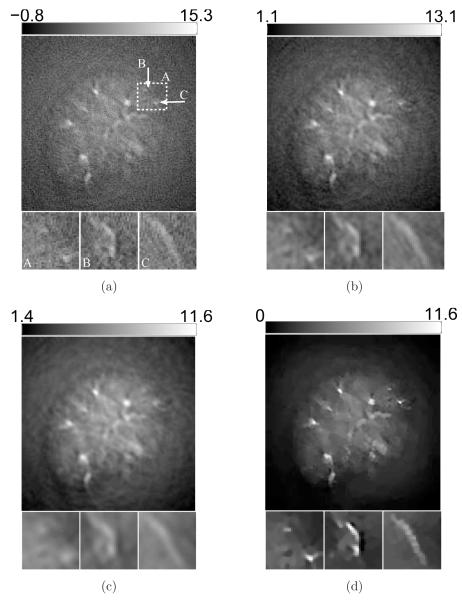
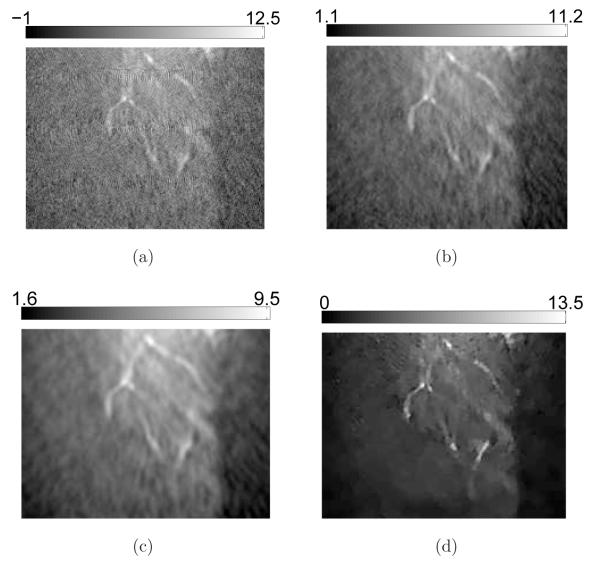
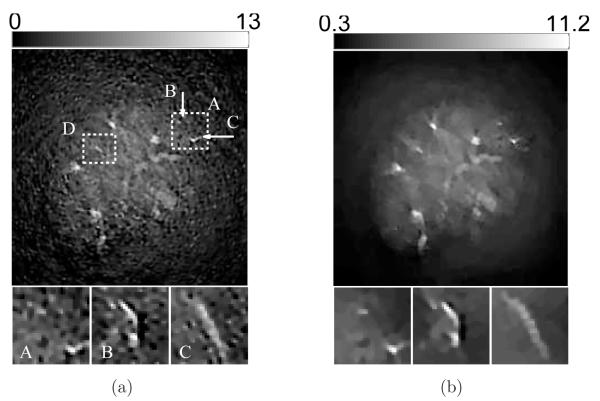
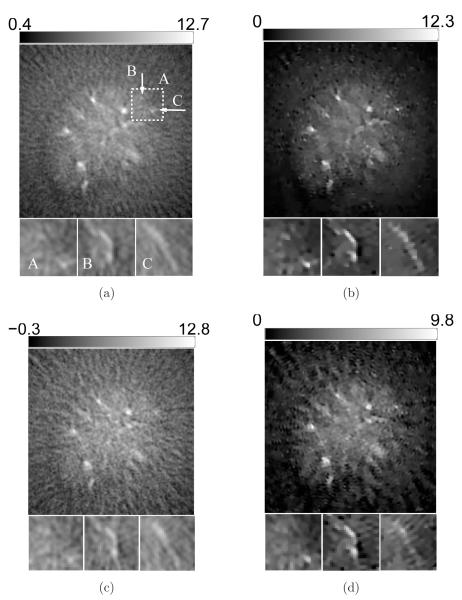
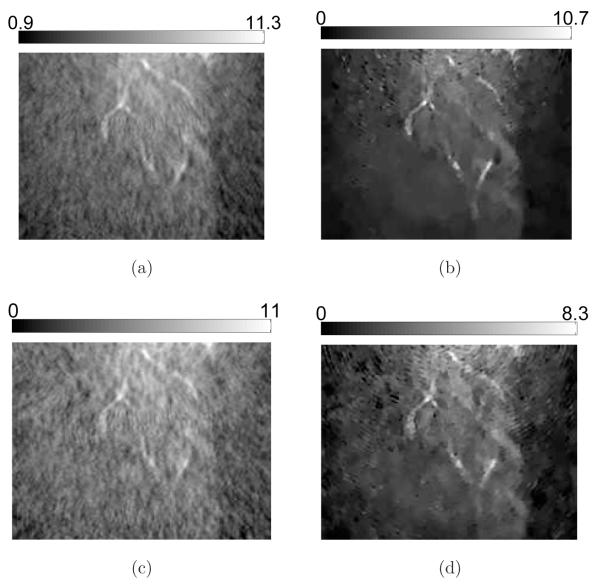
Additional details are revealed in the 2D sectional images as shown in Figure 12 and Figure 13. Obviously, the contrast of the blood vessels in the images reconstructed by use of the PLS-TV algorithm are higher than those reconstructed by use of the FBP algorithm. In particular, the PLS-TV algorithm significantly enhanced the appearance of peripheral blood vessels. For example, within the ROI A in Figure 12, two blood vessels B and C can be detected easily as two bright spots in zoomed-in image A. However, the two bright spots have much lower visual contrast in the images reconstructed by use the FBP algorithm. In addition, as shown in Figure 13, the PLS-TV algorithm effectively mitigates the foggy background as well as noise with minimal sacrifice in image resolution. However, none of the images reconstructed by use the FBP algorithm has a background as clean as the images reconstructed by the PLS-TV algorithm.
Figure 12.
Slices corresponding to the plane z = −8.47-mm through the 3D images of the mouse body reconstructed from the 180-view data by use of (a) the FBP algorithm with fc = 8-MHz; (b) the FBP algorithm with fc = 5-MHz; (c) the FBP algorithm with fc = 3-MHz; and (d) the PLS-TV algorithm with β = 0.05. The images are of size 29.4 × 29.4-mm2. The three zoomed-in images correspond to the ROIs of the dashed rectangle A, and the images on the orthogonal planes x = 8.47-mm (Intersection line is along the arrow B), and y = −3.29-mm (Intersection line is along the arrow C), respectively. All zoomed-in images are of size 4.34 × 4.34-mm2. The ranges of the grayscale windows were determined by the minimum and the maximum values in each image.
Figure 13.
Slices corresponding to the plane y = −3.57-mm through the 3D images of the mouse body reconstructed from the 180-view data by use of (a) the FBP algorithm with fc = 8-MHz; (b) the FBP algorithm with fc = 5-MHz; (c) the FBP algorithm with fc = 3-MHz; and (d) the PLS-TV algorithm with β = 0.05. The images are of size 22.4 × 29.4-mm2. The ranges of the grayscale windows were determined by the minimum and the maximum values in each image.
Qualitative comparison of regularization methods
Figure 12 and Figure 13 demonstrate how the low-pass filter regularizes the FBP algorithm. Similar to the observations from the six-tube phantom, a large value of fc results in high spatial resolution, large signal intensities, and high noise level. For the PLS-TV algorithm, besides the image corresponding to β = 0.05 shown in Figure 12-(d), images corresponding to β = 0.01 and β = 0.1 are displayed in Figure 14. Though the TV regularization also suppresses the background variance as well as the signal intensities when the regularization is enhanced, the TV regularization results in minimal sacrifice in spatial resolution.
Figure 14.
Slices corresponding to the plane z = −8.47-mm through the 3D images of the mouse body reconstructed from the 180-view data by use of the PLS-TV algorithm with (a) β = 0.01; and (b) β = 0.1. The images are of size 29.4 × 29.4-mm2. The three zoomed-in images correspond to the ROIs of the dashed rectangle A, and the images on the orthogonal planes x = 8.47-mm (Intersection line is along the arrow B), and y = −3.29-mm (Intersection line is along the arrow C), respectively. All zoomed-in images are of size 4.34 × 4.34-mm2. The ranges of the grayscale windows were determined by the minimum and the maximum values in each image.
Trade-off between signal intensity and noise level of reconstructed images
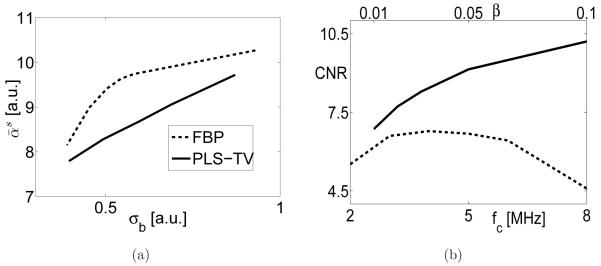
The s-ROI is defined to be voxels within a blood vessel that extends from z = −9.87-mm to z = −7.07-mm, including 20 voxels. At the plane of z = −8.74-mm, the blood vessel is centered at the white dashed box D shown in Figure 14-(a). The signal intensities are plotted against the image standard deviations in Figure 15-(a). This plot indicates that the signal intensity in the images reconstructed by use of the PLS-TV algorithm is lower than that of the FBP algorithm. This reveals that the PLS-TV algorithm can introduce image biases to achieve the same level of noise suppression. This observation is different than the previous observations from the six-tube phantom, perhaps because the PLS-TV algorithm somehow promotes discontinuities in the diffuse background. Nevertheless, the CNR’s of the images reconstructed by use of the PLS-TV algorithm are higher than those of the FBP algorithms for the regularization parameters spanning a wide range as shown in Figure 15-(b).
Figure 15.
(a) Signal intensity vs. standard deviation curves for the images reconstructed by use of the FBP (dashed line) and the PLS-TV (solid line) algorithms from the 180-view data; (b) CNR vs. the cutoff frequency curve for the FBP algorithm (dashed line) and CNR vs. the regularization parameter β curve for the PLS-TV algorithm (solid line) from the 180-view data.
Trade-off between image resolution and noise level of reconstructed images
The plots of resolution against background standard deviation are shown in Figure 16. Similar to our observations from the six-tube phantom imaging, the spatial resolution of the images reconstructed by use of the PLS-TV algorithm is higher than that of the images reconstructed by use of the FBP algorithm when the images have the same background standard deviation. Also, the curve corresponding to the PLS-TV algorithm is flatter than that of the FBP algorithm, confirming that the TV regularization mitigates image noise with minimal sacrifice in spatial resolution.
Figure 16.
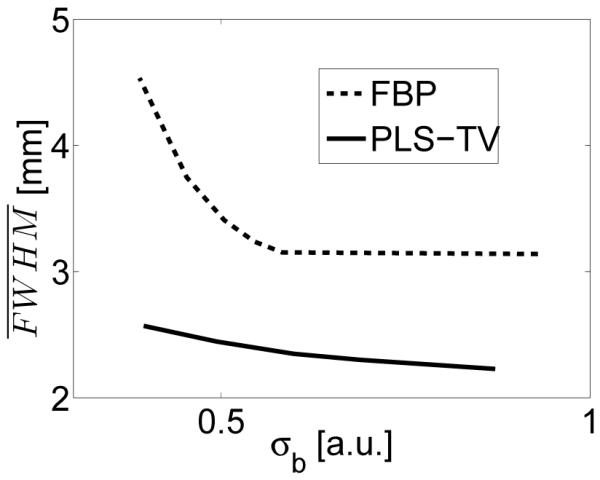
Image resolution vs. standard deviation curves for the images reconstructed by use of the FBP and PLS-TV algorithms from the 180-view data.
Reconstructed images from sparsely-sampled data sets
Figure 17 and Figure 18 show sectional images at different locations. Each figure contains subfigures reconstructed by use of the FBP and the PLS-TV algorithms from the 90-view data set and the 45-view data set. The observations are in general consistent with those corresponding to densely-sampled data sets; namely the images reconstructed by use of the PLS-TV algorithm appear to have higher spatial resolution, higher contrast, and cleaner backgrounds.
Figure 17.
Slices corresponding to the plane z = −8.47-mm through the 3D images of the mouse body reconstructed from the 90-view-data (top row: a, b) and the 45-view data (bottom row: c, d) by use of (a) the FBP algorithm with fc = 5-MHz; (b) the PLS-TV algorithm with β = 0.03; (c) the FBP algorithm with fc = 5-MHz; and (d) the PLS-TV algorithm with β = 0.01. The images are of size 29.4× 29.4-mm2. The three zoomed-in images correspond to the ROIs of the dashed rectangle A, and the images on the orthogonal planes x = 8.47-mm (Intersection line is along the arrow B) and y = −3.29-mm (Intersection line is along the arrow C), respectively. All zoomed-in images are of size 4.34 × 4.34-mm2. The ranges of the grayscale windows were determined by the minimum and the maximum valuse of each image.
Figure 18.
Slices corresponding to the plane y = −3.57-mm through the 3D images of the mouse body reconstructed from the 90-view data (top row: a, b) and the 45-view data (bottom row: c, d) by use of (a) the FBP algorithm with fc = 5-MHz; (b) the PLS-TV algorithm with β = 0.03; (c) the FBP algorithm with fc = 5-MHz; and (d) the PLS-TV algorithm with β = 0.01. The images are of size 22.4 × 29.4-mm2. The ranges of the grayscale windows were determined by the minimum and the maximum values in each image.
5. Discussion and summary
In this study, we investigated two iterative imaging reconstruction algorithms for 3D OAT: the penalized least-squares (PLS) with a quadratic smoothness penalty (PLS-Q) and the PLS with a TV-norm penalty (PLS-TV). To our knowledge, this was the first systematic investigation of 3D iterative image reconstruction for OAT animal imaging. Our results demonstrated the feasibility and advantages of 3D iterative image reconstruction algorithms for OAT. Specifically, the PLS-TV algorithm overall outperforms the FBP algorithm proposed by Finch et al. and the conventional iterative image reconstruction algorithm (e.g., PLS-Q) for reconstruction from incomplete data. Although not reported here, we observed this result to also hold true when other mathematically equivalent FBP algorithms were employed (Xu & Wang, 2005).
In OAT, the majority of studies of advanced image reconstruction algorithms have been based on 2D imaging models (Guo et al., 2010; Provost & Lesage, 2009; Buehler et al., 2011; Yao & Jiang, 2011). For a 2D imaging model to be valid in practice, it is necessary to assume the focused transducers only receive in-plane acoustic signals. The accuracy of this assumption is still under investigation (Rosenthal, et al., 2010). However, it is interesting to note that none of these studies compared the performances of 2D analytic reconstruction algorithms with those of the iterative algorithms, although the 2D analytic reconstruction algorithms have been proposed and proved to be mathematically exact (Finch, et al., 2007; Elbau, et al., 2012). In this work, our studies are based on a 3D imaging model that incorporates ultrasonic transducer characteristics (Wang et al., 2011a), avoiding heuristic assumptions regarding the transducer response. Although the FBP algorithm neglects the SIR effect, when the region-of-interest is close to the center of the measurement sphere, the images reconstructed by use of the FBP algorithm from densely-sampled data provide an accurate reference image that permits quantitative evaluation of images reconstructed by use of the PLS-Q and PLS-TV algorithms when data are incomplete. On the other hand, from densely-sampled data, the images reconstructed by use of different algorithms are quantitatively consistent, further validating our 3D imaging model.
The TV-norm regularization penalty has been intensively investigated within the context of mature imaging modalities including X-ray computed tomography (CT) (Pan et al., 2009; Han, et al., 2011). In a study of X-ray CT, the TV-norm regularized iterative reconstruction algorithm has been demonstrated to achieve the same image quality as those reconstructed by use of analytic reconstruction algorithms, while reducing the amount of data required to one sixth of that the latter requires (Han et al., 2011). However, our images reconstructed from sparsely-sampled data sets by use of the PLS-TV algorithm contain clear differences from those reconstructed from densely-sampled data by use of the FBP algorithm. Moreover, from densely-sampled data, the images reconstructed by use of the PLS-TV algorithm also appear to be different from those reconstructed by use of the FBP algorithm. Note the streaklike artifacts in the six-tube phantom images reconstructed by use of the FBP algorithm in Figure 4, which remain visible even when the number of tomographic views is increased to 720. These artifacts are likely due to the inconsistencies between the measured data and the numerical imaging model. Such inconsistencies can be caused by unmodeled heterogeneities in the medium (Huang, et al., 2012b; Huang, et al., 2012a; Schoonover & Anastasio, 2011), errors in the assumed transducer response, and uncharacterized noise sources (Xu, et al., 2010; Xu, et al., 2011). These inconsistencies can prevent OAT reconstruction algorithms from working as effectively as their counterparts in mature imaging modalities such as X-ray CT that are well-characterized.
There remain several important topics for future studies that may further improve image quality in 3D OAT. Such topics include the development and investigation of more accurate imaging models that model the effects of acoustic heterogeneities and attenuation. Also, in this study, we employed an unweighted least-squares data fidelity term, which is equivalent to the maximum likelihood estimator assuming that the randomness in the measured data is due to additive Gaussian white noise (Wernick M. N. & Aarsvold, 2004). However, additive Gaussian white noise may not be a good approximation in practice (Telenkov & Mandelis, 2010). Identification of the noise sources and characterization of their second order statistical properties will facilitate iterative reconstruction algorithms that may optimally reduce noise levels in the reconstructed images. Even though our reconstruction algorithms were implemented using GPUs, the reconstruction time were still on the order of hours, which is undesirable for future clinical imaging applications of 3D OAT. Therefore there remains a need for the development of accelerated reconstruction algorithms and their evaluation for specific diagnostic tasks.
Acknowledgments
M.A. Anastasio and K. Wang were supported in part by NIH award EB010049. The authors would like to thank Dr. E. Sidky and Dr. X. Pan for stimulating conversations regarding the use of TV regularization that inspired this work. K. Wang would also like to thank Mr. W. Qi for recommending the FISTA algorithm that improved the convergence of the PLS-TV algorithm.
Footnotes
PACS numbers: 87.57.nf, 42.30 wb
References
- Anastasio MA, et al. Half-time image reconstruction in thermoacoustic tomography. IEEE Transactions on Medical Imaging. 2005;24:199–210. doi: 10.1109/tmi.2004.839682. [DOI] [PubMed] [Google Scholar]
- Barrett H, Myers K. Foundations of Image Science. Wiley Series in Pure and Applied Optics. 2004 [Google Scholar]
- Beck A, Teboulle M. Fast Gradient-Based Algorithms for Constrained Total Variation Image Denoising and Deblurring Problems. Image Processing, IEEE Transactions on. 2009;18(11):2419–2434. doi: 10.1109/TIP.2009.2028250. [DOI] [PubMed] [Google Scholar]
- Brecht H-P, et al. Optoacoustic 3D whole-body tomography: experiments in nude mice. Vol. 7177. SPIE; 2009a. p. 71770E. http://link.aip.org/link/?PSI/7177/71770E/1. [Google Scholar]
- Brecht H-P, et al. Whole-body three-dimensional optoacoustic tomography system for small animals. Journal of Biomedical Optics. 2009b;14(6):064007. doi: 10.1117/1.3259361. http://link.aip.org/link/?JBO/14/064007/1. [DOI] [PMC free article] [PubMed] [Google Scholar]
- Buehler A, et al. Model-based optoacoustic inversions with incomplete projection data. Medical Physics. 2011;38(3):1694–1704. doi: 10.1118/1.3556916. http://link.aip.org/link/?MPH/38/1694/1. [DOI] [PubMed] [Google Scholar]
- Chou C-Y, et al. A fast forward projection using multithreads for multirays on GPUs in medical image reconstruction. Medical Physics. 2011;38(7):4052–4065. doi: 10.1118/1.3591994. http://link.aip.org/link/?MPH/38/4052/1. [DOI] [PubMed] [Google Scholar]
- Cox BT, et al. Two-dimensional quantitative photoacoustic image reconstruction of absorption distributions in scattering media by use of a simple iterative method. Appl. Opt. 2006;45(8):1866–1875. doi: 10.1364/ao.45.001866. http://ao.osa.org/abstract.cfm?URI=ao-45-8-1866. [DOI] [PubMed] [Google Scholar]
- Elbau P, et al. Reconstruction formulas for photoacoustic sectional imaging. Inverse Problems. 2012;28(4):045004. http://stacks.iop.org/0266-5611/28/i=4/a=045004. [Google Scholar]
- Ephrat P, et al. Three-dimensional photoacoustic imaging by sparse-array detection and iterative image reconstruction. Journal of Biomedical Optics. 2008;13(5):054052. doi: 10.1117/1.2992131. http://link.aip.org/link/?JBO/13/054052/1. [DOI] [PubMed] [Google Scholar]
- Ermilov SA, et al. Vol. 7177. SPIE; 2009. Development of laser optoacoustic and ultrasonic imaging system for breast cancer utilizing handheld array probes; p. 717703. http://link.aip.org/link/?PSI/7177/717703/1. [Google Scholar]
- Fessler JA. Penalized weighted least-squares reconstruction for positron emission tomography. IEEE Transactions on Medical Imaging. 1994;13:290–300. doi: 10.1109/42.293921. [DOI] [PubMed] [Google Scholar]
- Finch D, et al. Inversion of Spherical Means and the Wave Equation in Even Dimensions. SIAM Journal on Applied Mathematics. 2007;68(2):392–412. [Google Scholar]
- Finch D, et al. Determining a function from its mean values over a family of spheres. SIAM Journal of Mathematical Analysis. 2004;35:1213–1240. [Google Scholar]
- Guo Z, et al. Compressed sensing in photoacoustic tomography in vivo. Journal of Biomedical Optics. 2010;15(2):021311. doi: 10.1117/1.3381187. http://link.aip.org/link/?JBO/15/021311/1. [DOI] [PMC free article] [PubMed] [Google Scholar]
- Han X, et al. Algorithm-Enabled Low-Dose Micro-CT Imaging. Medical Imaging, IEEE Transactions on. 2011;30(3):606–620. doi: 10.1109/TMI.2010.2089695. [DOI] [PMC free article] [PubMed] [Google Scholar]
- Huang C, et al. Aberration correction for transcranial photoacoustic tomography of primates employing adjunct image data. Journal of Biomedical Optics. 2012a;17(6):066016. doi: 10.1117/1.JBO.17.6.066016. [DOI] [PMC free article] [PubMed] [Google Scholar]
- Huang C, et al. Photoacoustic computed tomography correcting for heterogeneity and attenuation. Journal of Biomedical Optics. 2012b;17(6):061211. doi: 10.1117/1.JBO.17.6.061211. [DOI] [PMC free article] [PubMed] [Google Scholar]
- Kruger R, et al. Thermoacoustic computed tomography-technical considerations. Medical Physics. 1999;26:1832–1837. doi: 10.1118/1.598688. [DOI] [PubMed] [Google Scholar]
- Kruger RA, et al. Photoacoustic angiography of the breast. Medical Physics. 2010;37(11):6096–6100. doi: 10.1118/1.3497677. http://link.aip.org/link/?MPH/37/6096/1. [DOI] [PMC free article] [PubMed] [Google Scholar]
- Kunyansky LA. Explicit inversion formulae for the spherical mean Radon transform. Inverse Problems. 2007;23:373–383. [Google Scholar]
- Oraevsky AA, Karabutov AA. Optoacoustic Tomography. In: Vo-Dinh T, editor. Biomedical Photonics Handbook. CRC Press LLC; 2003. [Google Scholar]
- Wernick MN, Aarsvold JN. Emission Tomography, the Fundamentals of PET and SPECT. Elsevier Academic Press; San Diego, California: 2004. [Google Scholar]
- Paltauf G, et al. Iterative reconstruction algorithm for optoacoustic imaging. The Journal of the Acoustical Society of America. 2002;112(4):1536–1544. doi: 10.1121/1.1501898. http://link.aip.org/link/?JAS/112/1536/1. [DOI] [PubMed] [Google Scholar]
- Pan X, et al. Why do commercial CT scanners still employ traditional, filtered back-projection for image reconstruction? Inverse Problems. 2009;25(12):123009. doi: 10.1088/0266-5611/25/12/123009. http://stacks.iop.org/0266-5611/25/i=12/a=123009. [DOI] [PMC free article] [PubMed] [Google Scholar]
- Provost J, Lesage F. The Application of Compressed Sensing for Photo-Acoustic Tomography. Medical Imaging, IEEE Transactions on. 2009;28(4):585–594. doi: 10.1109/TMI.2008.2007825. [DOI] [PubMed] [Google Scholar]
- Rosenthal A, et al. Fast Semi-Analytical Model-Based Acoustic Inversion for Quantitative Optoacoustic Tomography. Medical Imaging, IEEE Transactions on. 2010;29(6):1275–1285. doi: 10.1109/TMI.2010.2044584. [DOI] [PubMed] [Google Scholar]
- Rosset A, et al. OsiriX: An Open-Source Software for Navigating in Multidimensional DICOM Images. J. Digital Imaging. 2004;17(3):205–216. doi: 10.1007/s10278-004-1014-6. [DOI] [PMC free article] [PubMed] [Google Scholar]
- Schoonover RW, Anastasio MA. Compensation of shear waves in photoacoustic tomography with layered acoustic media. J. Opt. Soc. Am. A. 2011;28(10):2091–2099. doi: 10.1364/JOSAA.28.002091. [DOI] [PMC free article] [PubMed] [Google Scholar]
- Stepanishen PR. Transient Radiation from Pistons in an Infinite Planar Baffle. The Journal of the Acoustical Society of America. 1971;49(5B):1629–1638. http://link.aip.org/link/?JAS/49/1629/1. [Google Scholar]
- Stone S, et al. Accelerating advanced MRI reconstructions on GPUs. Journal of Parallel and Distributed Computing. 2008;68(10):1307–1318. doi: 10.1016/j.jpdc.2008.05.013. ¡ce:title¿General-Purpose Processing using Graphics Processing Units¡/ce:title¿. [DOI] [PMC free article] [PubMed] [Google Scholar]
- Telenkov S, Mandelis A. Signal-to-noise analysis of biomedical photoacoustic measurements in time and frequency domains. Review of Scientific Instruments. 2010;81(12):124901. doi: 10.1063/1.3505113. [DOI] [PubMed] [Google Scholar]
- Wang K, Anastasio MA. Photoacoustic and thermoacoustic tomography: image formation principles. In: Scherzer O, editor. Handbook of Mathematical Methods in Imaging. Springer; 2011. [Google Scholar]
- Wang K, et al. An Imaging Model Incorporating Ultrasonic Transducer Properties for Three-Dimensional Optoacoustic Tomography. Medical Imaging, IEEE Transactions on. 2011a;30(2):203–214. doi: 10.1109/TMI.2010.2072514. [DOI] [PMC free article] [PubMed] [Google Scholar]
- Wang K, et al. Limited data image reconstruction in optoacoustic tomography by constrained total variation minimization. Vol. 7899. SPIE; 2011b. p. 78993U. http://link.aip.org/link/?PSI/7899/78993U/1. [Google Scholar]
- Wang K, et al. Investigation of iterative image reconstruction in optoacoustic tomography. Vol. 8223. SPIE; 2012. p. 82231Y. http://link.aip.org/link/?PSI/8223/82231Y/1. [DOI] [PMC free article] [PubMed] [Google Scholar]
- Wang LV. Tutorial on Photoacoustic Microscopy and Computed Tomography. IEEE Journal of Selected Topics in Quantum Electronics. 2008;14:171–179. [Google Scholar]
- Wang LV, Wu H-I. Biomedical Optics, Principles and Imaging. Wiley; Hoboken, N.J: 2007. [Google Scholar]
- Xu Y, et al. Exact frequency-domain reconstruction for thermoacoustic tomography: I. Planar geometry. IEEE Transactions on Medical Imaging. 2002;21:823–828. doi: 10.1109/tmi.2002.801172. [DOI] [PubMed] [Google Scholar]
- Xu Y, Wang LV. Universal back-projection algorithm for photoacoustic computed tomography. Physical Review E. 2005;71(016706) doi: 10.1103/PhysRevE.71.016706. [DOI] [PubMed] [Google Scholar]
- Xu Z, et al. Photoacoustic tomography of water in phantoms and tissue. Journal of Biomedical Optics. 2010;15(3):036019. doi: 10.1117/1.3443793. http://link.aip.org/link/?JBO/15/036019/1. [DOI] [PMC free article] [PubMed] [Google Scholar]
- Xu Z, et al. In vivo photoacoustic tomography of mouse cerebral edema induced by cold injury. Journal of Biomedical Optics. 2011;16(6):066020. doi: 10.1117/1.3584847. [DOI] [PMC free article] [PubMed] [Google Scholar]
- Yao L, Jiang H. Enhancing finite element-based photoacoustic tomography using total variation minimization. Appl. Opt. 2011;50(25):5031–5041. http://ao.osa.org/abstract.cfm?URI=ao-50-25-5031. [Google Scholar]
- Yuan Z, Jiang H. Three-dimensional finite-element-based photoacoustic tomography: Reconstruction algorithm and simulations. Medical Physics. 2007;34(2):538–546. doi: 10.1118/1.2409234. http://link.aip.org/link/?MPH/34/538/1. [DOI] [PubMed] [Google Scholar]


