

Abstract
Trimethylamine N-oxide (TMAO) is a naturally occurring protecting osmolyte that stabilizes the folded state of proteins and also counteracts the destabilizing effect of urea on protein stability. Experimentally, it has been inferred that TMAO is preferentially excluded from the vicinity of protein surfaces. Here, we combine computer modeling and experimental measurements to gain an understanding of the mechanism of the protecting effect of TMAO on proteins. We have developed an all-atom molecular model for TMAO that captures the exclusion of TMAO from model compounds and protein surfaces, as a consequence of incorporating realistic TMAO-water interactions through osmotic pressure measurements. Osmotic pressure measurements also suggest no significant attraction between urea and TMAO molecules in solution. To obtain an accurate potential for molecular simulations of protein stability in TMAO solutions, we have explored different ways of parameterizing the protein/osmolyte and osmolyte/osmolyte interactions by scaling charges and the strength of Lennard-Jones interactions and carried out equilibrium folding experiments of Trp-cage miniprotein in presence of TMAO to guide the parameterization. Our calculations suggest a general principle for preferential interaction behavior of cosolvents with protein surfaces - preferentially excluded osmolytes have repulsive self-interaction given by osmotic coefficient φ > 1, while denaturants, in addition to having attractive interactions with the proteins, have favorable self-interaction given by osmotic coefficient φ < 1, to enable preferential accumulation in the vicinity of proteins.
Keywords: protein folding, molecular simulations, preferential interaction coefficient, force field, protein thermodynamics
Introduction
The folding equilibrium of proteins in solution can be altered by the addition of small organic compounds known as co-solvents.1 Co-solvents that shift the equilibrium towards the folded state are known as protecting osmolytes while those that favor the unfolded state are termed denaturants. Trimethylamine N-oxide (TMAO) is a protecting osmolyte that is found in the tissues of marine elasmobranchs, in which it also counteracts the deleterious effects of the denaturant, urea, on proteins2,3
Experimentally, the interaction of co-solvents with proteins or other biomolecules is studied by measuring the preferential interaction coefficient, defined as4
| (1) |
where μ is the chemical potential, m is the concentration and the subscripts 1,2,3 indicate water, protein and the cosolvent respectively. This quantity, measured using equilibrium dialysis5 or vapor pressure osmometry,6 represents the change in chemical potential of a protein in response to the additon of cosolvent. It can also be expressed as the change in the cosolvent concentration to maintain constant chemical potential when a protein is added to the solution. The latter description has been interpreted, using a two-domain model, as the difference in the cosolvent concentration in the local domain of the protein and the bulk solution,7,8 i.e.,
| (2) |
where N denotes the number of molecules. Denaturants show a positive value of Γ, implying an accumulation of the cosolvent in the vicinity of the protein due to a net favorable interaction. On the other hand, protecting osmolytes show negative values of Γ, i.e., they are excluded from the local domain of the protein due to net unfavorable interactions with the protein surface.1 The above expression can be used to calculate the preferential interaction directly from all-atom MD simulations.9,10
The molecular basis of protein denaturation by urea has been extensively studied in literature.11-14 It has been shown that urea preferentially accumulates in the vicinity of proteins due to favorable interactions with the protein backbone as well as the sidechain groups.15-18 The larger preferential interaction of urea with the unfolded ensemble of the protein provides the thermodynamic driving force for unfolding.
Much less is known about the molecular mechanism of the stabilization of proteins by TMAO and the compensatory effect of urea-TMAO mixtures on protein stability. Bolen and co-workers have demonstrated that TMAO can fold proteins that are thermodynamically unfolded to native like structures with significant functional activity.19,20 Based on this observation, urea-TMAO mixtures were used to measure stability of partly folded proteins and it was suggested that the m-value of urea denaturation is unaffected by the addition of TMAO.21 Linear increase of the free energy and the enthalpy of unfolding with increasing TMAO concentration have been reported.22,23 It has also been shown that the preferential interaction of the protein with urea was unchanged upon addition of TMAO.24 TMAO has been observed to stabilize proteins against pressure denaturation, consistent with its occurrence in deep sea animals.25 TMAO has also found application in design of protein resistant surfaces,26 and as a cryprotective agent in protein cyrstallography.27
Based on transfer free energy measurements, it has been proposed that co-solvents exert their influence on the protein through the peptide backbone, with the denaturants and protecting osmolytes having favorable and unfavorable interactions with the backbone respectively.3 In this model, the compensatory effect on protein stability in urea-TMAO solution arises from additivity of urea and TMAO interactions with the protein backbone.28 An entropic stabilization mechanism for TMAO has also been proposed, in which TMAO acts as crowding agent through excluded volume effects.29 From neutron scattering data, it has been suggested that the compensatory effect of TMAO is due to direct interaction between TMAO and urea itself, without any necessity of interaction of TMAO with the protein.30
In contrast to the case of urea, there have been relatively few simulation studies addressing the effects of TMAO and urea-TMAO mixtures in the literature.31-38 Most of the simulation studies of TMAO have employed the Kast Model for TMAO,39 developed using ab initio methods. However, we find that the Kast model does not show the expected preferential exclusion from protein surfaces and may act as a denaturant. To obtain the preferential exclusion behavior, the balance of interactions in the three component protein-TMAO-water system that matches experimental measurements of osmotic pressure must be addressed. Using the Kast model as a starting point, we have developed a new model for TMAO by incorporating realistic TMAO-water interactions based on osmotic pressure measurements of TMAO solutions, over a range of osmolyte concentration reported here. The new model, termed the Osmotic model, shows greater exclusion from protein surfaces than the Kast model as a consequence of matching the experimental osmotic data. Experimental osmotic data for urea-TMAO solutions shows that there is no significant attraction between urea and TMAO molecules in solution. To obtain an accurate potential for molecular dynamics simulations of protein stability in TMAO and urea-TMAO solutions, we have explored different ways of parameterizing the protein/osmolyte and osmolyte/osmolyte interactions by scaling charges and the strength of Lennard-Jones interactions. The dependence of the preferential interaction on these parameters provides insights into the mechanism of action of denaturants and osmolytes on proteins. Our results for TMAO suggest a general principle that explains the mechanism of the effect of protecting osmolytes and denaturants on proteins. This general principle posits that protective osmolytes must have repulsive self-interactions given by osmotic coefficient φ > 1 to be preferentially excluded from protein surfaces. On the other hand, denaturants, in addition to having attractive interactions with the proteins, must also have favorable self-interaction given by osmotic coefficient φ < 1 to enable its preferential accumulation in the vicinity of proteins.
Osmotic Pressure: Theory and Simulation
The phenomenon of osmosis is the spontaneous passage of a pure solvent into a solution separated from it by a semipermeable membrane that allows only solvent molecules to pass through. The osmotic pressure, Π, is the pressure that must be applied on the solution side to prevent the influx of the solvent and is given by the van’t Hoff equation, Π = [B]RT, where [B] is the molar concentration of the solute. The van’t Hoff equation is valid only for ideal, dilute solutions and deviation from ideality is accounted by the introduction of the osmotic coefficient, φ, defined as
| (3) |
The van’t Hoff equation can be treated as the first term of a virial like expansion, with additional terms accounting for solution non-ideality.
| (4) |
The term, B2, is known as the second osmotic virial coefficient. From the statistical mechanical theory of osmotic pressure, presented by Mayer and MacMillan,40 the virial coefficients of osmotic pressure expansion can be written as integrals over potentials of mean force of exactly nB solute particles in solvent A. For the case of n = 2, the osmotic virial coefficient is given by
| (5) |
In the above equation, is the potential of mean force between two B particles in solvent A and gBB(r) is the corresponding pair distribution function. The quantity, GBB, known as the Kirkwood-Buff integral,41 measures the excess or deficit of B particles in a spherical observation volume centered on a B particle. A positive value of GBB indicates an excess while negative values show a deficit of B in the observation volume, which can be interpreted as solvent-mediated attraction and repulsion among solute particles respectively.
Truncating the osmotic virial expansion at the second term provides physical insight into measurement of osmotic pressure in terms of molecular interactions. If φ > 1, then GBB is negative and indicates solvent-mediated repulsion among solute particles. Else, if φ < 1, then GBB is positive and indicates solvent-mediated attraction among solute particles.
The use of solution thermodynamic data to develop molecular models for solutes and cosolvents, pioneered by P. E. Smith and co-workers,42-44 is based on the inverse Kirkwood-Buff theory41 which relates experimental data to microscopic solution properties expressed as integrals of pair distribution functions. Instead, we calculate osmotic pressure directly from MD simulations using an intuitive approach proposed by Luo and Roux.45 The method is illustrated in Figure 1 A. An equilibriated solution of given osmolyte concentration is built along with systems of solvent (water) of identical size. These systems are then assembled together and the resulting system is simulated by applying a spatial confining potential only on solute particles to restrain them to occupy their original volume, while solvent molecules are free to diffuse throughout the system. The confining potential acts as a virtual semipermeable membrane while freely diffusing water mimics the constant solvent chemical potential. A half-harmonic potential on the central region boundaries in the z-direction is applied and the average force, 〈F〉, exerted on solute molecules by the confining potential in a simulation is calculated. The osmotic pressure is then calculated as Π = 〈F〉/A, where A is the cross-sectional (XY) area. Consistent with the thermodyanmic interpretation, net replusive interactions among solute particles leads to more collisions with the virtual walls and hence a greater osmotic pressure. The opposite holds true for net attractive interactions among solute particles. The osmotic pressure, thus calculated, is compared to experimental osmotic data obtained for TMAO and urea/TMAO solutions.
Figure 1.
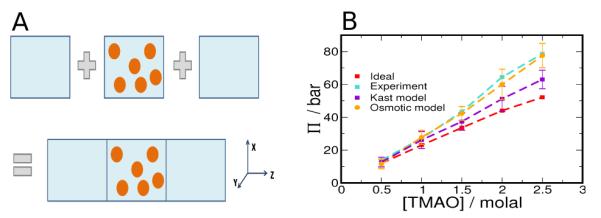
Osmotic Pressure of TMAO solutions. (A) The schematic illustrates the simulation method described in the text. Water, the primary solvent is shown as a blue background and the cosolvent molecules, shown as orange spheres, are confined to the central region using a restraining potential. (B) The osmotic pressure of TMAO using the new parameters (orange) is shown in contrast to the Kast model (indigo), ideal solution (red) and experimental (cyan) values.
In experiments, the osmotic pressure is reported in terms of osmolalities. The quantity, osmolal, denotes the apparent concentration of the solution, i.e, osm = φ[C], where φ is the osmotic coefficient and [C] is the concentration of the cosolvent in molality. Molalities must be converted to molarities using density data before the application of the van’t Hoff law.
Methods
Osmotic pressure measurements
Aqueous solutions of TMAO (Fluka-purum, > 99%) and urea used for water activity measurements were prepared gravimetrically. TMAO was dried against phosphorus pentoxide in an evacuated container for 2-3 days before use. Osmotic pressures were measured in triplicate using a Wescor vapor pressure osmometer model 5520 at room temperature, using the NaCl standards sent by Wescor.
Osmotic Pressure simulations
TMAO-water solutions of different molalities using GROMACS 4.0, by imposing TMAO-water number ratio in a cubic box of edge 4 nm. The concentrations correspond to experimental measurements, and the system details are given in Table 1. The systems were equilibriated for volume using the Berendsen pressure coupling. Water boxes of corresponding to the final equilibirated volume at each molality were built, and was added to the left and right sides of the original box along the z-direction. The new box was minimized and run at constant volume for 1 ns with position restraints for TMAO, thereby allowing waters at the boundary to equilibriate. The final configuration this run was used as the starting configuration for further simulations using NAMD.46
Table 1.
System Details
| molality | N TMAO | N Water | box length (nm) | molarity |
|---|---|---|---|---|
| 0.5 | 17 | 1847 | 3.89607 | 0.47 |
| 1.0 | 35 | 1956 | 3.97873 | 0.92 |
| 1.5 | 50 | 1859 | 3.94926 | 1.34 |
| 2.0 | 65 | 1799 | 3.94028 | 1.76 |
| 2.5 | 76 | 1737 | 3.92311 | 2.08 |
In the NAMD simulations, TMAO was constrained to its original volume by applying a half harmonic potential on its nitrogen atom (taken as its center of mass) in the z direction at the boundaries of the central region using the tclBC option. The stiffness constant of 10 kcal mol−1A−2 (4180 kJ mol −1 nm−2) was used, and it was verified that the osmotic pressure calculated does not depend on the particular value of the force constant used.
The coordinates are in units of Angstrom and the stiffness in units of kcal mol−1 A−2. The confining forces are calculated using a Tcl script by reading the coordinates of TMAO nitrogen and adding kδz to the z component of the force if z < zLo or z > zHi.
Each system was simulated initially with the Kast Model39 for TMAO and the TIP3P model for water.47 The equations of motion were integrated using a 2 fs time step. The Langevin thermostat was used to maintain the temperature in the simulation at 300 K. The cross-sectional area in XY plane was held constant and the system allowed to fluctuate in z-direction using the Langevin Piston barostat. All bond lengths were constrained using the SHAKE algorithm. The electrostatic interaction were treated using particle-mesh Ewald (PME) summation48 and long-range corrections to energy and pressure due to the truncation of Lennard-Jones potential were accounted for.
Each system was simulated for 15 ns with the application of the confining potential and the last 10 ns were used for analysis. The simulation was split in blocks of 1 ns and the average force on each of the left and right walls in a block was calculated. The average force measured in a block is the mean of the average forces calculated on the two walls in that block. The error is calculated from variation of the average force across blocks. The histogram of the forces across the two walls in the equilibrium ensemble are very similar and this is taken as indication of the convergence of the simulation.
The above protocol was also used to calculate the osmotic pressure of urea and urea-TMAO solutions. The compositions of these systems is given in Table 2. Note that urea-TMAO mixtures are built to maintain 2:1 urea-TMAO number ratio while keeping the box volumes nearly identical. Though this slightly increases molality in the mixtures dues to fewer water molecules, it allows direct comparison of the osmotic pressures of the mixture with the single component solutions.
Table 2.
Details for Urea and Urea-TMAO systems
| Molality | N TMAO | N Urea | N Water | box length (nm) |
|---|---|---|---|---|
| Urea | ||||
| 1.0 | 0 | 35 | 2014 | 3.99634 |
| 2.0 | 0 | 70 | 1893 | 3.98488 |
| TMAO:Urea | ||||
| 0.5:1.0 | 17 | 35 | 1944 | 3.99523 |
| 1.0:2.0 | 35 | 70 | 1695 | 3.93108 |
Calculations of preferential interaction
The preferential interaction of TMAO with polypeptides and proteins was calculated using Equation Eq. (2) from NVT simulations of these systems. The simulations were carried using Gromacs 4.0,49 using a 2 fs time step. The Nose-Hoover thermostat50,51 was used to maintain the temperature at 300 K, and the bond lengths were imposed using the LINCS algorithm.52 The PME method was used to calculate the electrostatic interactions, and long-range corrections to energy and pressure due to LJ truncation were accounted. The Amber99sb forcefield53 was used to describe the polypeptide and protein interactions. The system details are given in Table 3. The polypeptide systems were simulated for 50 ns and the last 40 ns used for analysis. For the protein systems, the last 60 ns out of total 80 ns of simulation was used for analysis. Counterions were added to neutralize the system, where required.
Table 3.
Polypeptide and protein systems
| system | N TMAO | N Water |
Xbox nm |
Ybox, Zbox nm |
molarity |
|---|---|---|---|---|---|
| polygly | 70 | 1537 | 3.6 | 4.0 | 2.0 |
| polyphe | 70 | 1485 | 3.6 | 4.0 | 2.0 |
| polyasn | 70 | 1528 | 3.6 | 4.0 | 2.0 |
| polyasp | 70 | 1509 | 3.6 | 4.0 | 2.0 |
| Trpcage | 70 | 1656 | 3.93071 | 3.93071 | 1.8 |
| Ubiquitin | 260 | 5361 | 5.82292 | 5.82292 | 2.18 |
| Lysozyme | 300 | 7992 | 6.60542 | 6.60542 | 1.73 |
Measurements of Trpcage stability
Trimethylamine N-oxide dihyrate (TMAO) was purchased from Sigma. It was purified by recrystallization from pure methanol, followed by the treatment with activated charcoal.54-56 Concentration of TMAO was calculated from a refractive index as suggested.3 The Trp-cage peptide was chemically synthesized and purified as previously described.57,58 The peptide concentration was determined spectrophotometrically using an extinction coefficient of ε280nm,0.1 = 3.24. 57,58
CD measurements were performed on a Jasco J-715 spectropolarimeter. All measurements were carried in a 1 mm cylindrical cell with the temperature controlled by an external, circulating water bath. Melting profiles were monitored at 230 nm (to reduce the contribution of high concentrations of TMAO to the CD signal) and from 4 to 100 °C, in 1 °C increments. The actual temperature inside the cell was measured using an Omega HH24 internal temperature probe. A peptide stock solution was dialyzed into 20 mM Na-phosphate pH 7.5 and diluted to 10 mM in the same buffer, containing different concentrations of TMAO. Concentration of TMAO was calculated from a refractive index as suggested.3 Measured values of ellipticity, Θwere converted to mean molar residue ellipticity [Θ] using the following expression:
| (6) |
where Mr is the mean molecular mass per residue, l is the path-length in cm and c is the concentration in mg/ml. Experiments were performed in triplicate and averaged CD melting profiles at each TMAO concentration were analyzed as described previously.57,58
Results
Osmotic pressure for TMAO solutions
We have measured the osmotic pressure for TMAO solutions as a function of TMAO concentration, reported in Table 4. Using previously reported densities for TMAO solutions,59 we see in Figure 1B that the experimental osmotic pressures are larger than the ideal value, implying a net repulsive interaction between TMAO molecules in solution. The osmotic pressure calculated for TMAO using the Kast model shows a net repulsive interaction as the TMAO concentration is increased, though not to the extent suggested by experiment at larger concentrations. Therefore, we seek to modify the Kast model to obtain agreement with experiment over the entire concentration range.
Table 4.
Osmotic Pressure for TMAO Solutions (in units of bar)
| molal | φ | Ideal | Experiment | Kast Model | Osmotic Model |
|---|---|---|---|---|---|
| 0.5 | 1.16 | 11.90 | 13.80 | 12.68 ± 2.95 | 11.54 ± 2.91 |
| 1.0 | 1.18 | 23.01 | 27.15 | 26.12 ± 5.12 | 27.76 ± 4.31 |
| 1.5 | 1.29 | 33.61 | 43.36 | 37.37 ± 5.31 | 42.31 ± 4.24 |
| 2.0 | 1.465 | 44.00 | 64.46 | 51.18 ± 7.62 | 60.01 ± 9.28 |
| 2.5 | 1.508 | 52.12 | 78.60 | 63.01 ± 5.65 | 77.53 ± 7.39 |
The non-bonded interactions among molecules in a classical MD potential are represented by atoms interacting through Lennard-Jones (LJ) and Coulomb interactions. For each atom in TMAO, we have three parameters - partial charge q, well-depth of LJ potential ε, and the hard-core radius σ. To explore the effect of these parameters on osmotic pressure, we employed scaling moves independently on partial charges, LJ ε’s, and σ’s. For simplicity, we use a constant scaling factor for all atoms in the TMAO molecule. For each proposed modification, we carried out osmotic pressure calculation for concentrations that show largest deviation from experimental behavior viz. 2 m and 2.5 m.
In charge scaling moves, the partial charges on all atoms in TMAO are scaled by a common factor α such that and . Scaling by factor α > 1 makes the TMAO molecule more hydrophilic. The increased interaction with water effectively increases the repulsion among TMAO molecules, leading to more collisions with the virtual walls and therefore a larger osmotic pressure. The opposite behavior is expected when TMAO is made more hydrophobic by scaling charges by α < 1. Similarly, the σ and ε of all TMAO atoms were scaled by a constant factor separately in LJ modification moves. The parameter σ controls the distance of closest approach between molecules and indirectly controls the Coulomb interaction. By reducing or increasing σ, TMAO-water interactions can be strengthened or weakened respectively. The parameter ε in LJ potential is a measure of the strength of attraction between two molecules due to dispersion interactions and can be similarly scaled up or down for all atoms in TMAO. It should be noted that parameters σ and ε are associated with a certain atom type in MD forcefields and LJ interaction parameters between dissimilar atom types are specified using combination rules. We employ the Lorentz-Berthelot combination rule, i.e., and σij = (σi+ σj)/2.
Osmotic pressures obtained by scaling any one of q, σ, and ε, by factors in range 0.75 to 1.25, do not adequately capture the experimental trend over the entire concentration range. Based on these preliminary results, we carried out simulations by scaling up q and simultaneously varying either σ or ε on a grid. The best match with experiment over the entire concentration range was obtained by making the following two changes (i) scaling up the original charges by factor α = 1.2 , i.e, strengthen the interaction of TMAO with water and (ii) changing the combination rule forTMAO-TMAO LJ interactions to and σij = (σi+σj)/2, where i and j are TMAO atom types, i.e, by making dispersion interactions between TMAO molecules less favorable. Note that the TMAO-water LJ potential is unchanged from the original Kast potential. The osmotic pressure obtained with this potential, termed the ‘Osmotic Model’, is shown in Figure 1 B and in Table 4.
The Osmotic model has been parameterized to show larger net repulsive TMAO-TMAO interactions than the Kast model such that the higher experimental osmotic pressure can be captured. This must be reflected in the equilibrium structure of the solution as measured by radial distribution function, g(r), a measure of local packing of molecules in solution, which we calculate from MD simulations of 2 molal TMAO solution. In Figure 2 A and B, we calculate the g(r) for TMAO nitrogen, NTM, with itself and the water oxygen, OW using the Kast and Osmotic models while Figure 2 C and D show similar calculations for TMAO oxygen, OTM. The repulsion among TMAO molecules can be seen clearly by comparing the NTM-NTM g(r) in Figure 2 A and B. The first peak present at ~ 0.5 nm in the Kast model is significantly diminished in the Osmotic Model, implying a reduction in local density of TMAO molecules around a given TMAO molecule. The increase in direct interaction of TMAO with water in the Osmotic model can be discerned from examining the g(r) between TMAO and water oxygens in Figure 2 C and D. We see that the first peak for OTM-OW g(r) has increased considerably in the Osmotic model. We find that that OW-OW g(r) is not effected by change in TMAO parameters (data not shown).
Figure 2.
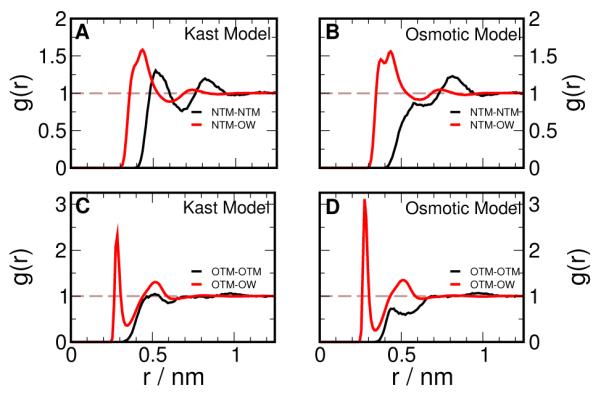
Radial distribution functions in 2 molal TMAO solution. Distributions of TMAO nitrogen (NTM) and water oxygen (OW) around TMAO nitrogen shown for (A) Kast Model and (B) Osmotic Model. Distributions of TMAO oxygen (OTM) and water oxygen (OW) around TMAO oxygen shown for (C) Kast Model and (D) Osmotic Model.
Osmotic pressure for urea-TMAO solutions
The experimental data for osmotic pressures of urea, TMAO and urea-TMAO solutions are given in Table 5 in terms of osmolalties. The quantity, osmolal, denotes the apparent concentration of the solution, i.e, osm = φ[C], where [C] is the concentration of the cosolvent in molal. The range of concentration studied is limited by the measurement limit of ~ 4 osm for the experimental apparatus. Table 5 reports the osmolalities of the individual cosolvent solutions, the sum of the individual osmolalities, and the experimental osmolality of the urea-TMAO solution of the given concentration. It is seen that the osmotic pressures of the mixtures are additive, i.e., the measured osmotic pressure of the mixtures are nearly equal to the sum of the osmotic pressures of the single component solutions. Our data is in good agreement with recently published activity coefficient data for urea-TMAO mixtures.60 This can be interpreted as a lack of net repulsive or attractive interactions between TMAO and urea in the solution in the range of concentration studied, suggesting that the counteracting effect of urea-TMAO mixtures is not due to sequestration of urea molecules by TMAO.
Table 5.
Osmotic pressure of urea-TMAO mixtures: Experiment
| [TMAO] molal |
[Urea] molal |
[TMAO] osmolal |
[Urea] osmolal |
Sum osmolal |
Expt osmolal |
|---|---|---|---|---|---|
| 0.5 | 0.5 | 0.560 | 0.484 | 1.044 | 1.033 |
| 0.5 | 1.0 | 0.560 | 0.952 | 1.512 | 1.492 |
| 0.75 | 0.75 | 0.864 | 0.718 | 1.582 | 1.575 |
| 0.75 | 1.5 | 0.864 | 1.427 | 2.291 | 2.256 |
| 1.0 | 1.0 | 1.180 | 0.952 | 2.132 | 2.151 |
| 1.0 | 2.0 | 1.180 | 1.882 | 3.062 | 3.075 |
We report the osmotic pressure obtained from simulations for single component as well as the mixture solutions in Table 6. The Osmotic model for TMAO and the KBFF model for urea42 were employed to model the solutes, with the LJ interactions between urea and TMAO given by the default Lorentz-Berthelot combination rule. Using the osmolal data from Table 5 with Πideal from Table 4, we see that the KBFF model for urea shows good agreement with the experimental osmotic pressure for the concentrations considered. From Table 6, the osmotic pressures for the mixtures can be considered additive, within error, for the concentrations studied, showing that the choice of models for TMAO and urea is appropriate for simulations of urea-TMAO mixtures.
Table 6.
Osmotic pressure of urea-TMAO mixtures: Simulations
| Molality | Π (bar) | Molality | Π (bar) | Molality | Π (bar) |
|---|---|---|---|---|---|
| Urea | TMAO | Mixture | |||
| 1.0 | 21.9 ± 2.8 | 0.5 | 11.5 ± 2.9 | 1.0:0.5 | 38.03 ± 3.7 |
| 2.0 | 45.9 ± 4.9 | 1.0 | 27.7 ± 4.3 | 2.0:1.0 | 79.05 ± 6.5 |
Preferential Interaction of TMAO with polypeptides and proteins
In this section, we study the preferential interaction of TMAO with various model systems. The preferential interaction is calculated using Equation Eq. (2) as function of r , the boundary of the local domain. The experimentally measured preferential interaction of TMAO with proteins is negative,6,24 which implies that TMAO is excluded from the vicinity of the protein surface. Comparing the Kast and Osmotic models with respect to preferential interaction behavior with various systems provides us a measure of the physical viability of these models.
To study the interaction of TMAO with various aminoacids, we constructed systems of infinitely repeating extended homopolypeptides.61 Each polypeptide is 10-mer whose last residue is bonded to the first residue in its adjacent periodic image and is simulated with position restraints on the backbone atoms. This system enables us to study only the chemical interaction of TMAO with aminoacids, without the factors of conformation and end effects.
In Figure 3 A to D, we report the preferential interaction of TMAO with four homopolypeptides consisting of glycine, phenylalanine, asparagine and aspartic acid monomers - each taken as representative of backbone, apolar, polar and charged residues respectively. The Osmotic model for TMAO shows more negative values for Γ(r) when compared to the Kast model for polygly and polyphe as seen in Figure 3 A and B, which implies that the Osmotic model is better excluded from the vicinal domain of these polypeptides. Both the models show approximately the same first minimum in Γ(r), but the Osmotic model shows stronger exclusion at larger distances from the peptide. We note that the first minimum in Γ(r) is due to steric effect - the first peak of the peptide-water g(r) is at a shorter distance than that of peptide-TMAO. A significant difference is shown by polyphenylalanine in Figure 3 B, going from slightly accumulated beyond 0.5 nm in the Kast model to being strongly excluded in the Osmotic model. For polyasn in Figure 3 C, we find that the two models are essentially identical and shows that the preferential interaction can be residue specific. For polyasp in Figure 3 D, we find that both models show exclusion at large distances. However, the Osmotic model shows less exclusion than the Kast model and this could be due to the larger dipole moment in the Osmotic model. Each of the amino acids studied here shows a positive transfer free energy from water to 1 M TMAO solution,3 suggesting that TMAO should be preferentially excluded from all of systems studied here. The sequence specificity shown by the Osmotic model indicates that peptide-TMAO interactions may have to be tuned to match experimental transfer free energies.
Figure 3.
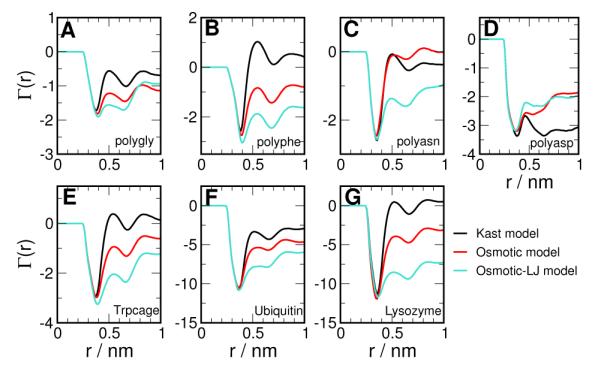
Preferential interaction of TMAO with (A) poly-glycine (B) poly-phenylalanine (C) poly-asparagine (D) poly-aspartic acid. The results for Kast and Osmotic models are shown in black and red respectively.
We next carried out simulations of three different proteins - Trpcage miniprotein, Ubiquitin, and Lysozyme in increasing order of size, in ~ 2 M TMAO solutions to study the preferential interaction behavior of the TMAO models with protein surfaces. The systems are built with the proteins in their folded state, and they remain folded (as measured by RMSD) during the course of the simulation.
From Figure 3 E to G, we see that the Kast model shows protein specific behavior - unlike Ubiquitin, no preferential exclusion beyond 0.5 nm from the protein surface is seen for Trpcage and Lysozyme. On the other hand, the Osmotic model shows greater preferential exclusion of TMAO than the Kast model for all the proteins studied, as indicated by the more negative value of Γ(r) for distances beyond 0.5 nm from the protein surface. Therefore, the Osmotic model qualitatively captures the preferential exclusion of TMAO from proteins, in agreement with experimental observation. It would be interesting to carry out a spatio-temporal analysis of the protein transfer free energies to gain insight into the protein-specific behavior of the Kast model.62
Effect of protein-TMAO interaction on Γ
In the calculation of the preferential interaction of TMAO with polypeptides and proteins using the Osmotic model, the protein-TMAO LJ interactions were kept identical to that in the Kast model, i.e., given by the Lorentz-Berthelot mixing rule. The LJ interactions between protein and TMAO can be altered by changing the mixing rule, without changing the osmotic pressure of TMAO-water solutions. Motivated thus, we scaled the parameter ε for protein-TMAO LJ potential by a factor of - effectively using the same ε parameters for TMAO to determine its interaction with itself as well as the protein.
Preferential interaction computed with the scaled down LJ potential , denoted as the Osmotic-LJ model, is also shown in Figure 3. Except for the charged polyaspartic acid, we find that greater exclusion of TMAO is obtained in the Osmotic-LJ model, i.e., by reducing protein-TMAO direct interaction through scaling down their LJ potential by 14%. This provides us a degree of freedom which can be guided according to experimental input on protein-TMAO interactions.
Osmometry experiments can measure the quantity,
| (7) |
where Osm is the osmolality of the solution and P, O and W stand for protein, osmolyte and water respectively.18,63 Protecting osmolytes such as TMAO have repulsive interactions with the protein surface, thereby showing a positive value for ΔOsm. The same experiment can be carried out in a MD simulation by setting up a osmotic pressure calculation of the three-component system with position restraints on the center of mass of the protein, such that the osmotic pressure contribution of the protein in the simulation is zero. The difference in osmotic pressure from simulation, ΔΠ = Π[P,O,W] – Π[O,W] can be matched to the experimental data by tuning the protein-TMAO LJ interaction.
We have also explored the possibility of determing the protein-TMAO interaction based on equilibrium folding experiments of the Trpcage miniprotein in TMAO solutions. Figure 4 A shows the temperature dependence of the ellipticity of Trp-cage at 230 nm in solutions containing various concentrations of TMAO. Addition of TMAO has profound effects on ellipticity. First, the ellipticity values at low temperature increase with the increase of TMAO concentration. This is consistent with the notion that even at the low temperatures in the absence of TMAO, the population of the native state in Trp-cage is 90-95 %.57,64 Upon addition of TMAO the stability of the native state increases and thus leads to higher absolute values of ellipticity at low temperature. Second, the melting profiles shift to higher temperatures upon addition of TMAO. This is again a direct indication that addition of TMAO leads to the stabilization of Trp-cage. Such effect has been previously observed for naturally occurring globular and repeat proteins.19,21 Analysis of the melting profiles using a two-state model allows the estimates of the Gibbs free energy of Trp-cage at 25 °C, ΔG(25°C), at different TMAO concentrations, [TMAO]. Figure 4 D shows the dependence of ΔG(25°C) on [TMAO]. Although the errors of the ΔG(25°C) are relatively large, it is clear that the m-value, that is defined by the slope of the dependence, is positive. We estimate it to be 0.30 ± 0.15 kJ/(mol M) for Trp-cage. The m-value for Trp-cage in presence of TMAO is much smaller in magnitude than the m-value in presence of urea, which we previously estimated to be 1.36 ± 0.08 kJ/(mol M).58
Figure 4.
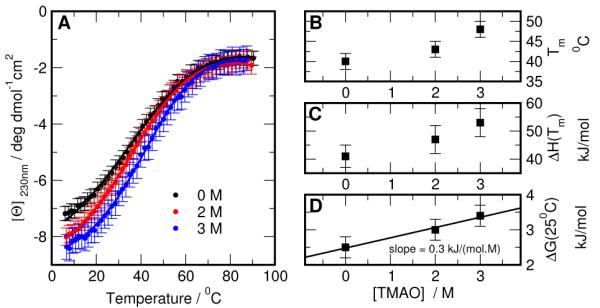
Thermodynamics of Trpcage stability in presence of TMAO. (A) Temperature dependence of the ellipticity of Trp-cage at different concentrations of TMAO. Solid lines show the results of the fit to a two-state model with the parameters Tm, ΔH(Tm), and ΔG(25°C) shown in (B),(C) and (D) respectively. The solid line in (D) shows the linear regression fit to the data, and the slope of the line corresponds to m-value for TMAO and is estimated to be 0.30 ± 0.15 kJ/(mol M). ±
To compare the TMAO models with the above folding experiments, we computed the preferential interaction of TMAO with Trpcage in the folded and the unfolded states. For the unfolded state, we generated an unfolded configuration of Trpcage and solvated it as described in Table 3, while the data for the folded state is taken from Figure 3. The results for different models of TMAO is presented in Figure 5. In Figure 5 A and B, we observe no difference between the folded and the unfolded ensembles of Trpcage with respect to their preferential interaction with TMAO, using either the Kast or the Osmotic model. However, using the the Osmotic-LJ model (Figure 5 C), we find that TMAO is more preferentially excluded from the unfolded ensemble than the folded. In this case, we have ΓUnfold<ΓFold, i.e., ΔΓ = ΓUnfold–ΓFold is negative. Note that ΔΓ is positive for urea.
Figure 5.
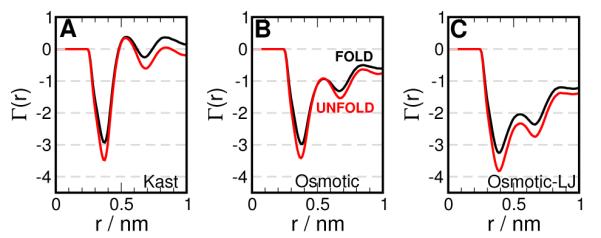
Preferential interaction of TMAO with Trpcage using (A) Kast model (B) Osmotic model v1 (C) Osmotic-LJ model. The result for the folded and unfolded ensembles are shown in black and red respectively.
An estimate of the m-value can be obtained from the measurement of ΔΓ. Starting from the Wyman linkage relation4 and assuming a linear dependence for ΔG on cosolvent concentration, i.e. ΔG[C] = ΔGWater+ m[C], it can be shown, for small concentrations, that
| (8) |
The m-value estimated using the Osmotic-LJ model, is 0.5 kJ/(mol M), which compares favorably with the experimental value of 0.30 ± 0.15 kJ/mol/M. Our data suggests that tuning protein-TMAO LJ interactions can capture the difference in the preferential interaction of TMAO between the folded and the unfolded ensembles. This suggests that the stabilization of the protein in TMAO may be enthalpic, and this interaction may be essential simulate this phenomenon through more detailed MD simulations. Based on m-values, we also suggest that the compensatory effect of urea:TMAO mixtures on Trpcage stability may occur at a ratio of 1:3. While the Osmotic-LJ model performs better for Trpcage, we recommend the use of the Osmotic model more generally and determination of the protein/TMAO interaction based on data available for the system considered.
Origins of preferential interaction
We showed that the newly developed Osmotic Model captures the preferential exclusion of TMAO from protein surfaces better than the Kast Model. To obtain the Osmotic model, we made the following changes to the Kast model - (i) scale up the original charges by a factor of 1.2 and (ii) weaken TMAO-TMAO LJ interactions, i.e., change the combination rule for TMAO-TMAO to . It is of interest to understand how each of these interactions govern the preferential interaction of TMAO with protein surfaces. To study this, we carried out simulations of previously described systems with either one of the modifications to the Kast model.
Firstly, we examine the preferential interaction of TMAO with polypeptides using one-step modifications of Kast model and plot them in Figure 6 A to C, along with the result for the Kast and the Osmotic models for comparison. For the polypeptides, changing TMAO-TMAO dispersions does not lead to greater preferential exclusion than the Kast model. Scaling the charge on TMAO leads to greater exclusion from polygly and polyphe, almost as much as shown by the full Osmotic model. For the protein systems, we report only the effect of charge scaling in Figure 6 D to F as we expect the effect of changing TMAO-TMAO ε’s to be negligible. For all the proteins studied, we find that scaling the charge alone shows preferential exclusion behavior similar to that shown by the Osmotic model.
Figure 6.
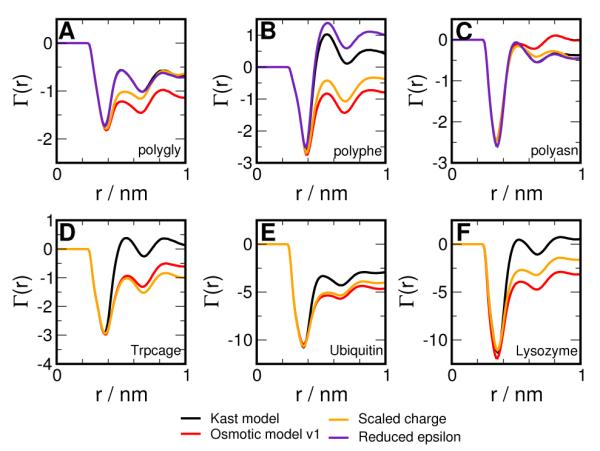
Preferential interaction of TMAO with polypetides (A) Polygly (B) Polyphe (C) Polyasn (D) Trpcage (E) Ubiquitin (F) Lysozyme. The Kast model is shown in black, the effect of charge scaling in orange, the effect of reduced epsilon in indigo, and the full Osmotic model in red.
To further explore the connection between the effect of charge scaling and preferential exclusion, we carried out simulations of Trpcage (starting from the folded state) with the charges of the Kast model scaled by a factor α, ranging from 0.8 to 1.4. We also evaluate the osmotic pressure of the 2.5 molal TMAO solution for the above scaling factors and report the results in Figure 7. We have seen previously that the Kast model ( α = 1) does not show any exclusion from Trpcage for distances beyond 0.5 nm. From Figure 7 B, we see that scaling down the charges leads to positive values of Γ(r) beyond 0.5 nm, i.e., TMAO behaves like a denaturant and accumulates around the protein. On the other hand, scaling up the charges progressively increases the magnitude of preferential exclusion. The preferential accumulation or exclusion is strongly correlated to solvent mediated TMAO-TMAO interactions as reflected by osmotic pressure, as shown in Figure 7 A. Scaling down the charges leads to reduction of osmotic pressure with respect to the Kast model, which can be interpreted as an increase in net TMAO-TMAO interaction, while the vice versa is true for scaling up the charges. Similar behavior is also observed in simulations of Lysozyme and Ubiquitin (data not shown).
Figure 7.
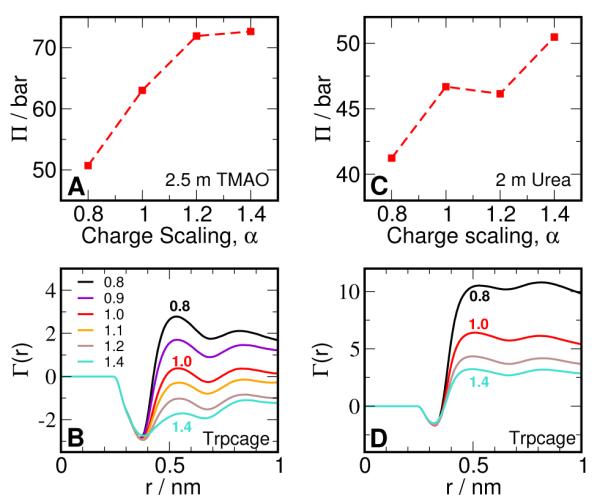
Osmotic pressure and Preferential interaction. (A) Osmotic pressure of 2.5 m TMAO solution as a function of scaling of TMAO charges. α = 1.0 corresponds to the Kast model. (B) Preferential interaction of Trpcage with TMAO as a function of scaling of TMAO charges. (C) Osmotic pressure of 2.5 m urea solution as a function of scaling of urea charges. α = 1.0 corresponds to the KBFF model. (B) Preferential interaction of Trpcage with urea as a function of scaling of TMAO charges.
To test if the above behavior is model and cosolvent dependent, we also carried out a similar charge scaling experiment with urea. We take the folded ensemble of Trpcage in 1.9 M urea reported previously17 as the reference system, and scale the charges on the KBFF urea model. From Figure 7 C and D, we observe qualitatively similar behavior to TMAO, i.e., scaling down the charges increases the preferential interaction of urea with the protein while the opposite is observed for scaling up the charges. This is despite the fact that scaling up the charges is expected to increase the electrostatic interaction and hydrogen bonding of urea with the protein. The behavior of preferential interaction is again strongly correlated to the osmotic pressure of the urea solution, as seen previously for TMAO.
This intimate connection between preferential exclusion and osmotic pressure provides us physical insight into the role of solute-solute interaction in preferential accumulation or exclusion of cosolvents from proteins. Denaturants such as urea have weak favorable interactions with protein surfaces and a significant concentration of cosolvent is required to to denature the proteins. We speculate that denaturants, in addition to favorable interactions with proteins, must also be able to tolerate it’s own excess concentration in the vicinity (local domain) of the protein, i.e, show a negative deviation from ideality with osmotic coefficient φ 1. Osmolytes on the other hand, must have repulsive interactions with each other in addition to repulsive interactions with the protein so that this factor also contributes to making its accumulation in the vicinity of the protein unfavorable. One can think of denaturants and osmolytes as lying on opposite sides of the ideal osmotic pressure curve given by the van’t Hoff law, as shown in Figure 8. From experimental osmotic pressure data, this scenario is true for the case of urea and TMAO, as well as for other osmolytes such as betaine, trehalose, proline and glycerol in the concentration range reported.6 Based on this principle, we suggest that a mixture of two protecting osmolytes that have repulsive interactions amongst themselves, as reflected in non-additivity of osmotic pressure, may show a synergistic enhancement of protein stability. We note that a similar suggestion, based on activity coefficients data, has been proposed earlier in literature.65
Figure 8.
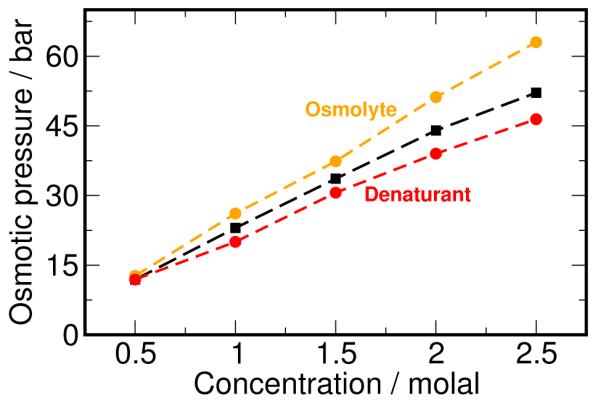
Osmotic behavior of cosolvents. We hypothesize that osmolytes (orange) show a positive deviation from the van’t Hoff law (black), while denaturants (red) show a negative deviation from the same.
Conclusion
The goal of this work was to develop interaction potentials to enable molecular simulations of the protecting effect of osmolyte TMAO on proteins, informed by experimental inputs from relevant phenomena, to understand the molecular mechanism of protecting effect of TMAO on proteins. Starting out with the Kast model for TMAO, we calculated the osmotic pressure of TMAO-water solutions from MD simulations over a range of osmolyte concentration. Comparison with experimental data showed that the Kast model underestimates the osmotic pressure at higher concentrations of TMAO. We then modified the Kast model using physically motivated changes to obtain the Osmotic model for TMAO which captures the osmotic pressure for TMAO solutions over the entire range of concentration for which experimental data is available. Fitting a model to the osmotic pressure for all concentrations is a challenging task, and the large deviations from the experimental value at higher concentrations dictated what interactions the new parameters must contain. Leaving out the osmotic pressure of 2 m and 2.5 m TMAO solutions from the fitting would have resulted in potentials that, in retrospect, do not show much difference from the Kast model with respect to preferential exclusion from protein surfaces.
We also studied the osmotic pressure of 2:1 urea-TMAO solutions. Experimental data shows that the osmotic pressures of urea:TMAO solutions are additive, indicating that there is no significant interaction between TMAO and urea molecules. We find that the Osmotic model for TMAO used along with the KBFF model for urea, with default LJ combination rules, adequately capture the experimental observation of additivity in MD simulations for the concentrations the data is available.
Simulations of polypeptides and model proteins showed that the Osmotic model shows larger preferential exclusion from protein surfaces than the Kast model, for most of the systems studied. This was a consequence of incorporating realistic water-TMAO interactions through osmotic measurements. Though greater preferential exclusion obtained in the Osmotic model is in qualitative agreement with experiments, the magnitude is still undetermined. We showed that the magnitude of preferential exclusion can be varied by tuning the direct LJ interaction between the protein and TMAO, and suggest experimental data that may be used to determine the protein-TMAO LJ interaction.
Further, we showed that scaling the charges on the Kast model alone led to a significant increase in preferential exclusion of TMAO from polypetides and proteins in comparison to the Kast model. We also demonstrated that preferential interaction of TMAO with protein surfaces can be controlled in a systematic way by progressively scaling the charges, and a qualitatively similar scenario was observed for the case of urea. These results highlight the importance of the solvent-mediated cosolvent-cosolvent interaction, as reflected by the osmotic pressure of the two-component solution, in determining the preferential interaction of the cosolvent with the protein surface. We suggest that a underlying design principle in determining the effect of a cosolvent on proteins lies in the positive or negative deviation of the osmotic pressure of the cosolvent solution from the van’t Hoff law. The chemical specificity of the interaction of the osmolyte with the protein surface is also important, as different osmolytes show varying magnitudes of exclusion at a given two-component osmolality.6 Further studies are required to determine the nature of ‘direct’ interactions of TMAO with various amino acids and in protein folding/unfolding to examine if the stabilization of proteins by TMAO is enthalpic, as suggested by the Osmotic-LJ model for TMAO here and by recent work for other osmolytes,66 as well as the role of water in mediating these interactions.60 We expect the use of a physically-motivated forcefield, in concert with enhanced sampling methods, will enable detailed simulation of the stabilizing effect of TMAO and the compensatory effect of urea:TMAO mixtures on protein stability from which the molecular mechanism of the phenomena can be obtained.
Acknowledgement
This work has been funded by the National Science Foundation (NSF MCB-1050966 to AEG and MCB-0110396 to GIM) and the National Institutes of Health (GM086801). This research was partially supported by the Intramural Research Program of the National Institutes of Health, Eunice Kennedy Shriver National Institute of Child Health and Human Development. We thank M. T. Record and D. Thirumalai for comments and suggestions.
References
- [1].Timasheff SN. Annu. Rev. Biophys. Biomolec. Struct. 1993;22:67–97. doi: 10.1146/annurev.bb.22.060193.000435. [DOI] [PubMed] [Google Scholar]
- [2].Yancey PH, Clark ME, Hand SC, Bowlus RD, Somero GN. Science. 1982;217:1214–1222. doi: 10.1126/science.7112124. [DOI] [PubMed] [Google Scholar]
- [3].Wang A, Bolen DW. Biochemistry. 1997;36:9101–9108. doi: 10.1021/bi970247h. [DOI] [PubMed] [Google Scholar]
- [4].Timasheff SN. Proc. Natl. Acad. Sci. U. S. A. 2002;99:9721–9726. doi: 10.1073/pnas.122225399. [DOI] [PMC free article] [PubMed] [Google Scholar]
- [5].Arakawa T, Timasheff SN. Biochemistry. 1982;21:6545–6552. doi: 10.1021/bi00268a034. [DOI] [PubMed] [Google Scholar]
- [6].Courtenay ES, Capp MW, Anderson CF, Record MT. Biochemistry. 2000;39:4455–4471. doi: 10.1021/bi992887l. [DOI] [PubMed] [Google Scholar]
- [7].Record MT, Anderson CF. Biophys. J. 1995;68:786–794. doi: 10.1016/S0006-3495(95)80254-7. [DOI] [PMC free article] [PubMed] [Google Scholar]
- [8].Parsegian VA, Rand RP, Rau DC. Proc. Natl. Acad. Sci. U. S. A. 2000;97:3987–3992. doi: 10.1073/pnas.97.8.3987. [DOI] [PMC free article] [PubMed] [Google Scholar]
- [9].Baynes BM, Trout BL. J. Phys. Chem. B. 2003;107:14058–14067. [Google Scholar]
- [10].Shukla D, Shinde C, Trout BL. J. Phys. Chem. B. 2009;113:12546–12554. doi: 10.1021/jp810949t. [DOI] [PubMed] [Google Scholar]
- [11].Auton M, Holthauzen LMF, Bolen DW. Proc. Natl. Acad. Sci. U. S. A. 2007;104:15317–15322. doi: 10.1073/pnas.0706251104. [DOI] [PMC free article] [PubMed] [Google Scholar]
- [12].Hua L, Zhou RH, Thirumalai D, Berne B. J. Proc. Natl. Acad. Sci. U. S. A. 2008;105:16928–16933. doi: 10.1073/pnas.0808427105. [DOI] [PMC free article] [PubMed] [Google Scholar]
- [13].Canchi DR, Paschek D, García A. J. Am. Chem. Soc. 2010;132:2338–2344. doi: 10.1021/ja909348c. [DOI] [PubMed] [Google Scholar]
- [14].England JL, Haran G. Annu. Rev. Phys. Chem. 2011;62:257–277. doi: 10.1146/annurev-physchem-032210-103531. [DOI] [PMC free article] [PubMed] [Google Scholar]
- [15].Stumpe MC, Grubmuller H. J. Am. Chem. Soc. 2007;129:16126–16131. doi: 10.1021/ja076216j. [DOI] [PubMed] [Google Scholar]
- [16].Lee S, Shek YL, Chalikian TV. Biopolymers. 2010;93:866–879. doi: 10.1002/bip.21478. [DOI] [PubMed] [Google Scholar]
- [17].Canchi DR, García AE. Biophys. J. 2011;100:1526–1533. doi: 10.1016/j.bpj.2011.01.028. [DOI] [PMC free article] [PubMed] [Google Scholar]
- [18].Guinn EJ, Pegram LM, Capp MW, Pollock MN, Record MT. Proc. Natl. Acad. Sci. U.S.A. 2011;108:16932–16937. doi: 10.1073/pnas.1109372108. [DOI] [PMC free article] [PubMed] [Google Scholar]
- [19].Baskakov I, Bolen DW. J. Biol. Chem. 1998;273:4831–4834. doi: 10.1074/jbc.273.9.4831. [DOI] [PubMed] [Google Scholar]
- [20].Qu YX, Bolen CL, Bolen DW. Proc. Natl. Acad. Sci. U. S. A. 1998;95:9268–9273. doi: 10.1073/pnas.95.16.9268. [DOI] [PMC free article] [PubMed] [Google Scholar]
- [21].Mello CC, Barrick D. Protein Sci. 2003;12:1522–1529. doi: 10.1110/ps.0372903. [DOI] [PMC free article] [PubMed] [Google Scholar]
- [22].Pradeep L, Udgaonkar JB. J. Biol. Chem. 2004;279:40303–40313. doi: 10.1074/jbc.M406323200. [DOI] [PubMed] [Google Scholar]
- [23].Attri P, Venkatesu P, Lee MJ. J. Phys. Chem. B. 2010;114:1471–1478. doi: 10.1021/jp9092332. [DOI] [PubMed] [Google Scholar]
- [24].Lin TY, Timasheff SN. Biochemistry. 1994;33:12695–12701. doi: 10.1021/bi00208a021. [DOI] [PubMed] [Google Scholar]
- [25].Krywka C, Sternemann C, Paulus M, Tolan M, Royer C, Winter R. ChemPhysChem. 2008;9:2809–2815. doi: 10.1002/cphc.200800522. [DOI] [PubMed] [Google Scholar]
- [26].Anand G, Jamadagni SN, Garde S, Belfort G. Langmuir. 2010;26:9695–9702. doi: 10.1021/la100363m. [DOI] [PubMed] [Google Scholar]
- [27].Mueller-Dieckmann C, Kauffman B, Weiss M. J. Appl. Crystallogr. 2011;44:433–436. [Google Scholar]
- [28].Bolen DW, Baskakov IV. J. Mol. Biol. 2001;310:955–963. doi: 10.1006/jmbi.2001.4819. [DOI] [PubMed] [Google Scholar]
- [29].Cho SS, Reddy G, Straub JE, Thirumalai D. J. Phys. Chem. B. 2011;115:13401–13407. doi: 10.1021/jp207289b. [DOI] [PMC free article] [PubMed] [Google Scholar]
- [30].Meersman F, Bowron D, Soper AK, Koch MHJ. Biophys. J. 2009;97:2559–2566. doi: 10.1016/j.bpj.2009.08.017. [DOI] [PMC free article] [PubMed] [Google Scholar]
- [31].Fornili A, Civera M, Sironi M, Fornili SL. Phys. Chem. Chem. Phys. 2003;5:4905–4910. [Google Scholar]
- [32].Athawale MV, Dordick JS, Garde S. Biophys. J. 2005;89:858–866. doi: 10.1529/biophysj.104.056671. [DOI] [PMC free article] [PubMed] [Google Scholar]
- [33].Paul S, Patey GN. J. Am. Chem. Soc. 2007;129:4476–4482. doi: 10.1021/ja0685506. [DOI] [PubMed] [Google Scholar]
- [34].Paul S, Patey GN. J. Phys. Chem. B. 2007;111:7932–7933. doi: 10.1021/jp0733668. [DOI] [PubMed] [Google Scholar]
- [35].Hu CY, Lynch GC, Kokubo H, Pettitt BM. Proteins. 2010;78:695–704. doi: 10.1002/prot.22598. [DOI] [PMC free article] [PubMed] [Google Scholar]
- [36].Wei HY, Fan YB, Gao YQ. J. Phys. Chem. B. 2010;114:557–568. doi: 10.1021/jp9084926. [DOI] [PubMed] [Google Scholar]
- [37].Kokubo H, Hu CY, Pettitt BM. J. Am. Chem. Soc. 2011;133:1849–1858. doi: 10.1021/ja1078128. [DOI] [PMC free article] [PubMed] [Google Scholar]
- [38].Bennion BJ, Daggett V. Proc. Natl. Acad. Sci. U. S. A. 2004;101:6433–6438. doi: 10.1073/pnas.0308633101. [DOI] [PMC free article] [PubMed] [Google Scholar]
- [39].Kast KM, Brickmann J, Kast SM, Berry RS. J. Phys. Chem. A. 2003;107:5342–5351. [Google Scholar]
- [40].McMillan WG, Mayer JE. J. Chem. Phys. 1945;13:276–305. [Google Scholar]
- [41].Ben-Naim A. Molecular theory of solutions. Oxford University Press; 2006. [Google Scholar]
- [42].Weerasinghe S, Smith PE. J. Phys. Chem. B. 2003;107:3891–3898. [Google Scholar]
- [43].Weerasinghe S, Smith PE. J. Chem. Phys. 2004;121:2180–2186. doi: 10.1063/1.1768938. [DOI] [PubMed] [Google Scholar]
- [44].Weerasinghe S, Smith PE. J. Phys. Chem. B. 2005;109:15080–15086. doi: 10.1021/jp051773i. [DOI] [PubMed] [Google Scholar]
- [45].Luo Y, Roux B. J. Phys. Chem. Lett. 2010;1:183–189. [Google Scholar]
- [46].Phillips JC, Braun R, Wang W, Gumbart J, Tajkhorshid E, Villa E, Chipot C, Skeel RD, Kale L, Schulten K. J. Comput. Chem. 2005;26:1781–1802. doi: 10.1002/jcc.20289. [DOI] [PMC free article] [PubMed] [Google Scholar]
- [47].Jorgensen WL, Chandrasekhar J, Madura JD, Impey RW, Klein ML. J. Chem. Phys. 1983;79:926–935. [Google Scholar]
- [48].Essmann U, Perera L, Berkowitz ML, Darden T, Lee H, Pedersen LG. J. Chem. Phys. 1995;103:8577–8593. [Google Scholar]
- [49].Hess B, Kutzner C, van der Spoel D, Lindahl E. J. Chem. Theory Comput. 2008;4:435–447. doi: 10.1021/ct700301q. [DOI] [PubMed] [Google Scholar]
- [50].Nose S. Mol. Phys. 1984;52:255–268. [Google Scholar]
- [51].Hoover WG. Phys. Rev. A. 1985;31:1695–1697. doi: 10.1103/physreva.31.1695. [DOI] [PubMed] [Google Scholar]
- [52].Hess B, Bekker H, Berendsen HJC, Fraaije JGEM. J. Comput. Chem. 1997;18:1463–1472. [Google Scholar]
- [53].Hornak V, Abel R, Okur A, Strockbine B, Roitberg A, Simmerling C. Proteins. 2006;65:712–725. doi: 10.1002/prot.21123. [DOI] [PMC free article] [PubMed] [Google Scholar]
- [54].Baker JR, Chaykin S. J. Biol. Chem. 1962;237:1309–1313. [PubMed] [Google Scholar]
- [55].Chang Y, Oas TG. Biochemistry. 2010;49:5086–5096. doi: 10.1021/bi100222h. [DOI] [PMC free article] [PubMed] [Google Scholar]
- [56].Jayasimha P, Shanmuganathan A, Suladze S, Makhatadze GI. J. Chem. Thermo. 2012;237:1309–1313. [Google Scholar]
- [57].Streicher WW, Makhatadze GI. Biochemistry. 2007;46:2876–2880. doi: 10.1021/bi602424x. [DOI] [PubMed] [Google Scholar]
- [58].Wafer LNR, Streicher WW, Makhatadze GI. Proteins. 2010;78:1376–1381. doi: 10.1002/prot.22681. [DOI] [PMC free article] [PubMed] [Google Scholar]
- [59].Zou Q, Bennion BJ, Daggett V, Murphy KP. J. Am. Chem. Soc. 2002;124:1192–1202. doi: 10.1021/ja004206b. [DOI] [PubMed] [Google Scholar]
- [60].Rosgen J, Jackson-Atogi R. J. Am. Chem. Soc. 2012;134:3590–3597. doi: 10.1021/ja211530n. [DOI] [PMC free article] [PubMed] [Google Scholar]
- [61].Horinek D, Netz RR. J. Phys. Chem. A. 2011;115:6125–6136. doi: 10.1021/jp1110086. [DOI] [PubMed] [Google Scholar]
- [62].Yu I, Nakada K, Nagaoka M. J. Phys. Chem. B. 2012;116:4080–4088. doi: 10.1021/jp300380p. [DOI] [PubMed] [Google Scholar]
- [63].Capp M, Pegram L, Saecker R, Kratz M, Riccardi D, Wendorff T, Cannon J, Record M. Biochemistry. 2009;48:10372–10379. doi: 10.1021/bi901273r. [DOI] [PMC free article] [PubMed] [Google Scholar]
- [64].Neidigh JW, Fesinmeyer RM, Andersen NH. Nat. Struct. Biol. 2002;9:425–430. doi: 10.1038/nsb798. [DOI] [PubMed] [Google Scholar]
- [65].Rosgen J, Pettitt B, Bolen D. Biochemistry. 2004;43:14472–14484. doi: 10.1021/bi048681o. [DOI] [PubMed] [Google Scholar]
- [66].Politi R, Harries D. Chem. Commun. 2010;46:6449–6451. doi: 10.1039/c0cc01763a. [DOI] [PubMed] [Google Scholar]