

Abstract
Glycation induced protein aggregation has been implicated in the development of diabetic complications and neurodegenerative diseases. These aggregates are known to be resistant to proteolytic digestion. Here we report the identification of protease resistant proteins from the streptozotocin induced diabetic rat kidney, which included enzymes in glucose metabolism and stress response proteins. These protease resistant proteins were characterized to be advanced glycation end products modified and ubiquitinated by immunological and mass spectrometry analysis. Further, diabetic rat kidney exhibited significantly impaired proteasomal activity. The functional analysis of identified physiologically important enzymes showed that their activity was reduced in diabetic condition. Loss of functional activity of these proteins was compensated by enhanced gene expression. Aggregation prone regions were predicted by in silico analysis and compared with advanced glycation end products modification sites. These findings suggested that the accumulation of protein aggregates is an inevitable consequence of impaired proteasomal activity and protease resistance due to advanced glycation end products modification.
One of the foremost causes of diabetic complications is formation of sugar-derived substances called advanced glycation end products (AGEs),1 which affect target cell through altered protein structure- function, matrix-matrix/matrix-cell interaction, and by activation of receptor for AGE (RAGE) signaling pathway (1). Although the accumulation of AGEs is a slow process in healthy individuals, their formation is markedly accelerated in diabetes because of hyperglycemia (2). AGE-modified proteins are thermostable and resistant to denaturation. The stability of proteins is believed to be because of additional negative charge (highly oxidized state) brought by AGE modification of proteins, which may contribute to protease resistance (3). Glycation induced protease resistance has been studied in collagen (4–6) and amyloid (7). In addition to glycation, impairment in the proteasomal function may facilitate accumulation of protease resistant protein aggregates in diabetes. Proteasome mediated protein degradation is a central quality control mechanism in the cell. Activity of proteasome is affected during aging (8) and physiological disorders like diabetes (9) resulting in accumulation of ubiquitinated protein aggregates. In muscle extract of diabetic rats, accumulation of toxic glycated proteins was observed because of decreased proteasomal activity (6–9). This proteolytic system is of particular importance in protecting cells against adverse conditions, such as heat shock, glycation, or oxidative stress. However, when the generation of damaged proteins exceeds the capacity of the cell to degrade them, they are progressively accumulated leading to cytotoxicity (10). Severely aggregated, cross-linked, and oxidized proteins are poor substrates for degradation and inhibit the proteasomal activity (11).
The kidney is one of the main organs affected in diabetes caused by accumulation of AGEs. Proteins of extracellular matrix, kidney, as well as proteins from circulation, get AGE modified and trapped in the kidney (12). Both intracellular and extracellular AGEs have been observed in the diabetic kidney. Extracellular AGEs interact with the RAGE leading to apoptosis and inflammation (13), whereas intracellular AGEs are formed because of various dicarbonyls. Eventually, both types of the AGEs contribute to kidney damage (14). Furthermore, methyl glyoxal, a highly reactive dicarbonyl covalently modifies the 20S proteasome, decreasing its activity in the diabetic kidney (15). Together AGE modification and decreased proteasomal function may be responsible for the accumulation of protease resistant proteins (PRPs) in the diabetic kidney. In our previous study, we have reported the presence of AGE modified proteins in the kidney of the streptozotocin (STZ) induced diabetic rat (12). The current work is inspired by a DARTS (drug affinity responsive target stability) approach, wherein the drug targets are relatively less susceptible to protease action on drug binding (16). A similar approach was adopted here to identify protease resistant proteins from the diabetic kidney. These proteins were characterized to be AGE modified and ubiquitinated by Western blot analysis and mass spectrometry. Functional characterization and expression analysis of some of the identified proteins was performed to gain insight into the consequences of these modifications in diabetes. Further, aggregation prone regions in these proteins were predicted by the in silico approach. These findings shed light on the role of identified PRPs in diabetic complications.
EXPERIMENTAL PROCEDURES
Chemicals
All chemicals were procured from Sigma unless otherwise stated. All the primary antibodies were purchased from Abcam (Cambridge, UK) except for anti-AGE, which was purchased from Millipore (Billerica, MA). The secondary antibody-biotin conjugate and streptavidin-HRP was purchased from Bangalore Genei (India).
Induction of Diabetes and Kidney Sample Collection
All animal experiments were carried out at Poona College of Pharmacy, Bharati Vidyapeeth University, Pune. The research protocol was approved by the Institutional Animal Ethics Committee (IAEC) of the Poona College of Pharmacy, Pune, India, constituted under the Committee for the Purpose of Control and Supervision of Experiments on Animals (CPCSEA). (Approval No.: CPCSEA/45/2010). Adult male Wistar rats were purchased from National Biosciences, Pune, India. The animals were housed in a room at an ambient temperature of 25 ± 2 °C. A 12 ± 1 h light and dark schedule was maintained in the animal house. Before the study began, all the animals received standard rodent chow ad libitum and had free access to water. Diabetes was induced by injecting Nicotinamide (110 mg/kg) followed by a single intraperitoneal injection of streptozotocin 65 mg/kg body weight dissolved in 10 mm sodium citrate buffer (pH 4.0) to the overnight fasting Wistar rats. Blood glucose level of animals from all the groups was measured using Eco-Pak glucose kit (Accurex Bio Medical Pvt. Ltd., Mumbai, India), according to manufacturer's instructions. After 15 days of administration of STZ, stable hyperglycemia was confirmed. The animals were considered diabetic if the blood glucose values were >250 mg/dl. Animals surviving after diabetes induction were maintained for 100–120 days. Glycated hemoglobin (HBA1c) was measured by using HBA1c Analyzer (In2it, Bio-Rad). Control (HbA1c ≤ 5.5) and diabetic kidney tissues (HBA1c ≥8%) were collected after sacrificing the respective animals. The tissue was washed with cold saline three to four times and stored at −80 °C.
Sample Preparation
The kidney was perfused with cold phosphate buffer saline to remove blood stains before homogenization. The tissue was homogenized to fine powder in liquid nitrogen and washed two to three times with chilled acetone. Then, the acetone powder was dissolved in buffer consisting of 7 m urea, 2 m thiourea, 2% 3-[(3-cholamidopropyl)dimethylammonio]propanesulfonate, 1% dithiothreitol, 40 mm Tris, and centrifuged at 14,000 × g for 30 min at 4°C. The supernatant was collected and stored in aliquots at –80°C. For enzyme assays, protein was extracted in phosphate buffer saline. The extract was centrifuged at 6000 rpm for 30 min at 4°C. Supernatant was collected and re-centrifuged at 14000 × g for 30 min at 4°C. Again the supernatant was collected and stored in aliquot at –80°C. Protein concentration was estimated by using Bio-Rad protein assay kit (Bio-Rad, Hercules, CA).
Analysis of Protease Resistance
As a proof of concept, an in vitro glycated and ribosylated BSA was synthesized by incubating 50 mg/ml BSA with either 0.5 m glucose or 0.5 m ribose in 0.2 m phosphate buffer, pH 7.4 at 37 °C for 30 days, respectively. Afterwards 10 μg of control, glycated and ribosylated BSA was subjected for in-solution digestion by using 1 μg of trypsin in 25 mm ammonium bicarbonate buffer pH 8.4, without prior reduction and alkylation with dithiothreitol and iodoacetamide respectively, to simulate in vivo conditions of proteolysis. The reaction was performed at 37°C for 1 h and stopped by 10% formic acid. The samples were air-dried, reconstituted in Laemmli sample buffer (60 mm Tris-HCl pH 6.8, 2% SDS, 10% glycerol, 5% β-mercaptoethanol, 0.01% bromophenol blue) and boiled for 5 min. Further, these samples along with respective undigested samples were subjected for 12% SDS-PAGE and proteins were visualized by Coomassie Brilliant Blue (CBB-R250) staining. The same approach was used for kidney protein lysate except the protein quantity used was 20 μg.
Western Blotting
Control and diabetic kidney protein samples, before and after trypsin digestion, were separated on 12% SDS-PAGE. Proteins were transferred onto polyvinylidene difluoride membrane and incubated overnight at 4°C in blocking buffer containing 5% skimmed milk powder dissolved in TBS (20 mm Tris-HCl (pH 7.5), 0.15 m NaCl). The membranes were incubated with different primary antibodies in blocking buffer at 37 °C for 1 h. The following antibodies were used: anti-AGE antibody (1:2500), anti-ubiquitin antibody (1:2000), anti-GAPDH (1:10,000), anti-SOD (1:10,000), anti-HSP (1:10,000), anti-GST (1:2000), anti-LDH (1:1000), anti-ADH (1:500). After one wash with TBS-T (TBS containing 0.05% Tween 20) and two washes with TBS, the membranes were incubated with secondary antibody conjugated with biotin conjugate (Bangalore Genei) at a dilution of 1:2000 for 30 min at room temperature. After washing, membranes were incubated with streptavidin-conjugated horseradish peroxidise (HRP) at dilution 1:2000 for 30 min at RT. Immunodetection was carried out in the dark by adding diaminobenzidine (DAB), the substrate for HRP.
In-gel Trypsin Digestion
The Comassie-stained gels and Western blots were scanned using a densitometer GS-800 (Bio-Rad Laboratories, Hercules, CA). The trypsin resistant proteins detected by Anti-AGE as well as anti-ubiquitin antibody were excised and destained with destaining solution (50 mm ammonium bicarbonate/acetonitrile mixed 1:1 v/v). After thorough rinsing with 100 mm ammonium bicarbonate, the gel pieces were dehydrated in 100% acetonitrile (ACN), which was removed by air drying. Proteins were reduced and alkylated by 10 mm dithiothreitol for 30 min and 55 mm iodoacetamide for 45 min respectively. Again gel pieces were dehydrated with 100% ACN and kept for rehydration with 15–20 μl of 20 ng/μl trypsin solution in 25 mm ammonium bicarbonate buffer pH 8.4 overnight at 4°C. Further rapid trypsin digestion was done at 58°C for 1 h (17). Peptides from the gel were extracted with 5% formic acid in 50% ACN, and were reconstituted in 10 μl of 0.1% formic acid in 3% ACN.
Liquid Chromatography-Mass Spectrometry Analysis
Tryptic peptides were analyzed by nano LC-MSE (MS at elevated energy) using a Nano Acquity UPLC system (Waters Corporation, Milford, MA) coupled to a Q-TOF, SYNAPT-HDMS (Waters Corporation). The nano-LC separation was performed using a BEH-C18 reversed phase column (1.7 μm particle size) with an internal diameter of 75 μm and length of 150 mm (Waters Corporation). The binary solvent system used comprised 99.9% water and 0.1% formic acid (mobile phase A) and 99.9% acetonitrile and 0.1% formic acid (mobile phase B). Peptides were initially preconcentrated and desalted online at a flow rate of 5 μl/min using a Symmetry C18 trapping column (internal diameter 180 μm, length 20 mm) (Waters Corporation) with a 0.1% B. After each injection, peptides were eluted into the NanoLockSpray ion source at a flow rate of 300 nL/min using a gradient of 2–40% B for 35 min, then the column was washed and equilibrated. All mass spectrometric analysis was performed in a positive V-mode at a resolution of about 9000 full width half maximum (FWHM). The instrument was calibrated with a MS/MS spectra of glu-fibrinopeptide B (600 fmol/μl), and the lock mass correction was done every 30s by the same peptide delivered through the reference sprayer of the NanoLockSpray source. MSE was performed by acquiring the spectra at constant low collision energy (4 eV) to generate intact peptide masses, and the collision energy was elevated (20 to 40 eV) to get product ions at an alternative 1s scan. The radio frequency voltage applied to the quadrupole mass analyzer was adjusted such that ions from m/z 50 to 2000 were efficiently transmitted.
Data Processing and Database Searching
The LC-MSE data was analyzed by Protein Lynx Global Server 2.4 (PLGS; Waters Corporation) software. The ion accounting parameters used to search included precursor and product ion tolerance 25 ppm and 100 ppm respectively, minimum number of peptide matches (1), minimum number of product ion matches per peptide (3), minimum number of product ion matches per protein (5) and the number of missed tryptic cleavage sites were three. The false positive rate was 4%. Ion intensity threshold was set at 1000 counts. A preliminary search was performed for protein identification using UniProt rat database updated with Ensembl release 66 available at the end of February 2012 containing 7773 reviewed protein entries. LC-MSE data were searched with a fixed carbamidomethyl modification for Cys residues, along with a variable modification for oxidized Met residues. For identification of AGE and ubiquitin modifications, a targeted search was perfomed involving variable glycation modifications specific to lysine residues were carboxymethyllysine (CML) (+58.0055 Da); carboxyethyllysine (CEL) (+72.0211 Da); pyrraline (+108.0211 Da) and ubiquitin(114.02 Da). Those involving both lysine and arginine residues were 1-alkyl-2-formyl-3,4-glycosylpyrrole (AFGP) (+270.074 Da); Schiff's base/Amadori modification (+162.02); imidazolone-A (144.03 Da); methylglyoxal lysine dimer (MOLD) (49.0078 Da); Pentosidine (58.03 Da), and crossline (252.11 Da). Glycation and ubiquitin modifications identified by PLGS were manually validated as described by Bhonsle et al. (18). Triplicate replications were performed for each sample.
Semiquantitative RT-PCR
Total RNA was isolated from diabetic and control rat kidney using TRIzol reagent (Invitrogen, Carlsbad, CA) according to the manufacturer's instructions. First strand cDNA was reverse-transcribed from 1 μg of total RNA in a final volume of 20 μl using reverse transcriptase and random hexamer primers from eurofinsTM reagent kit according to the manufacturer's instructions. PCR was performed with rTaq (BlackBio) in a Veriti (Thermo Scientific) according to a standard protocol as follows: one cycle of initial denaturation at 94 °C for 5 min; 35 cycles of 94 °C for 30 s, annealing for 45 s, and 72 °C for 1.30 min; a final extension at 72 °C for 10 min; and holding at 4 °C. The amount of cDNA used for each PCR was 10 ng in a 10 μl reaction volume. The PCR products were analyzed by electrophoresis through 2% agarose gels and visualized by Gel Red staining. The primers used for amplifying the proteins are given in supplemental Table S1. β actin was used as a housekeeping gene.
Enzyme assays
Control and diabetic kidney protein lysate (50 μg) was used to carry out the following functional assays (a) total protease activity (19), (b) in-gel protease assay (20), (c) proteasomal activity was assayed according to manufacturer's instructions, (d) SOD assay (21), (e) LDH assay (http://www.worthington-biochem.com/ldh/assay.html), (f) ADH assay (22), and (g) GST assay (23). The detailed methodology is described in supplemental Methods S1.
Determination of Aggregation Propensity of Identified Proteins
Amino acid sequences of identified trypsin resistant proteins were retrieved from Uniprot (http://www.uniprot.org/) and further used for prediction of aggregation propensity. Different Web servers like Aggrescan (http://bioinf.uab.es/aggrescan/) (24), Tango (www.tango.embl.de) (25), PASTA (www.protein.cribi.unipd.it/pasta) (26), and Waltz (http://waltz.switchlab.org/) (27) were used for predicting and calculating aggregation propensity of proteins, with their default parameters. Homology modeling of these proteins was performed using CPH model server 3.0 (http://www.cbs.dtu.dk/services/CPHmodels/). Predicted structures were validated by Ramchandran plot analysis using RAMPAGE (http://mordred.bioc.cam.ac.uk/∼rapper/rampage.php) and also for overall model quality by using ProSA (https://prosa.services.came.sbg.ac.at/prosa.php). Further, AGE modified peptides identified through PLGS analysis and predicted aggregation prone regions were examined for putative identification of common regions between them. These aggregation prone regions were then mapped on the predicted structure using PyMol (Python based Molecular viewer).
Statistical analysis
All experiments were performed in triplicates. Statistical analysis was performed by Student's t test. Data were expressed as mean ± S.D. A p value < 0.05 was considered as statistically significant.
RESULTS AND DISCUSSION
Accumulation of PRPs: Consequence of Glycation and Impaired Proteasomal Function
Diabetes is associated with accelerated glycation and crosslinking of proteins. The characteristic feature of cross linked proteins is increased stability and resistance for the proteolysis (3) because of which, cells are unable to clear the aggregated proteins and the accumulated aggregates often have toxic effects. This protease resistance property of PRPs was used for their identification. A similar approach called drug affinity responsive target stability (DARTS) was used to identify drug targets, whereby binding of drug to protein causes protease resistance (16). In this study, an attempt has been made to identify glycation induced PRPs using the DARTS approach. The basic strategy used in this study was masking protease recognition sites of proteins by glucose caused by the glycation reaction, thereby reducing protease action. This idea is comparable to a well-known concept of DNase resistance of DNA bound by transcription factors. As a proof of concept, an in vitro study was carried out with glycated and ribosyled BSA. Glycation and ribosylation induced protein aggregation and resistance to trypsin digestion was compared with unmodified BSA (Fig. 1). These results suggested that glycation induced PRPs can be identified by this approach. Further, the feasibility of these in vitro results was demonstrated in complex protein mixtures. A diabetic condition in Wistar rats was induced by STZ and confirmed by measuring blood glucose and HbA1C levels (Table I). Protease resistance of control and diabetic rat kidney proteins was determined by trypsin digestion without reduction and alkylation. Interestingly, control kidney protein was almost completely digested with trypsin, while the diabetic kidney protein showed several protease resistant bands (Fig. 2A). These in vivo results supported our in vitro results, as well as previous studies where proteins such as collagen and amyloid were demonstrated to be protease resistant in diabetic condition (4–7). As protease resistance is induced by glycation, the kidney proteins were characterized for AGE modification by Western blot analysis (Fig. 2B). Diabetic rat kidney showed relatively more AGE modified proteins than the corresponding control, and also these AGE modified proteins were relatively resistant to trypsin (Fig. 2B). This strongly suggested that accumulation of PRPs in diabetes could be caused by AGE modification. Protein glycation is associated with altered conformation and function. Under normal physiological condition, misfolded proteins and potentially harmful protein aggregates are ubiquitinated and removed by the proteasomal system. However, the oxidative inactivation of proteasome has been reported during aging (11, 28), glyoxal treated cells (3), Alzheimer's disease (29) etc. Analysis of protein ubiquitination and proteasome activity reveals the basis for the accumulation of AGE modified PRPs in the diabetic rat kidney. As proteasome targets ubiquitin marked proteins, its reduced function will slowly build up ubiquitinated proteins in cells. It was remarkable to notice relatively more ubiquitinated proteins in the diabetic rat kidney than in the control group. The protease resistant fragments in diabetes were also found to be ubiquitinated (Fig. 2C). Interestingly, most of the AGE modified proteins were ubiquitinated. Further, the detection of ubiquitinated PRPs has driven us to investigate total protease and proteasomal activity from control and diabetic kidney homogenate. Azocasein assay (Fig. 3A) and in-gel protease assay (Fig. 3B) showed significantly decreased total protease activity in the diabetic kidney than control. Chymotrypsin-like activity of proteasome was considerably decreased in the diabetic condition (Fig. 3C), as this was selectively inhibited by carbonyl compounds in the cell culture (15). Inhibition of chymotrypsin like activity of proteasome by carbonyl compound was demonstrated by in vitro modification of proteasome with methylglyoxal (Fig. 3D). This suggested that the decreased proteasome activity in diabetic kidney could be caused by AGE modification. Collectively, these results indicate that accumulation of PRPs in the diabetic rat kidney is a consequence of AGE modification and reduced proteasomal function.
Fig. 1.

In vitro evidence on protease resistance of glycated protein. BSA was glycated and ribosylated with glucose and ribose respectively, which showed protease resistance to tryptic digestion. Lane 2, 3, and 4 contains undigested BSA, Gly-BSA, and Rib-BSA respectively, whereas lane 5, 6, and 7 contains the same digested with trypsin, Try-BSA, Try-Gly-BSA, and Try-Rib-BSA respectively, and Lane 1 contains SDS-PAGE marker. The experiment was repeated independently three times.
Table I. Blood glucose and HbA1c level of diabetic and control rats. Value in parenthesis indicates the total number of rats in the group and (±) indicates the standard deviations. Diabetic animal groups showed approximately 20% mortality.
| Number of animals | Number of animals survived | Body wt in g | Glucose mg/dl | HbA1c level |
|---|---|---|---|---|
| Control (12) | 12 | 246.5 ± 13.22 | 73.46 ± 6.18 | <5.5 |
| Diabetic (12) | 10 | 162.4 ± 24.70 | 335.08 ± 11.56 | >8.0 |
Fig. 2.
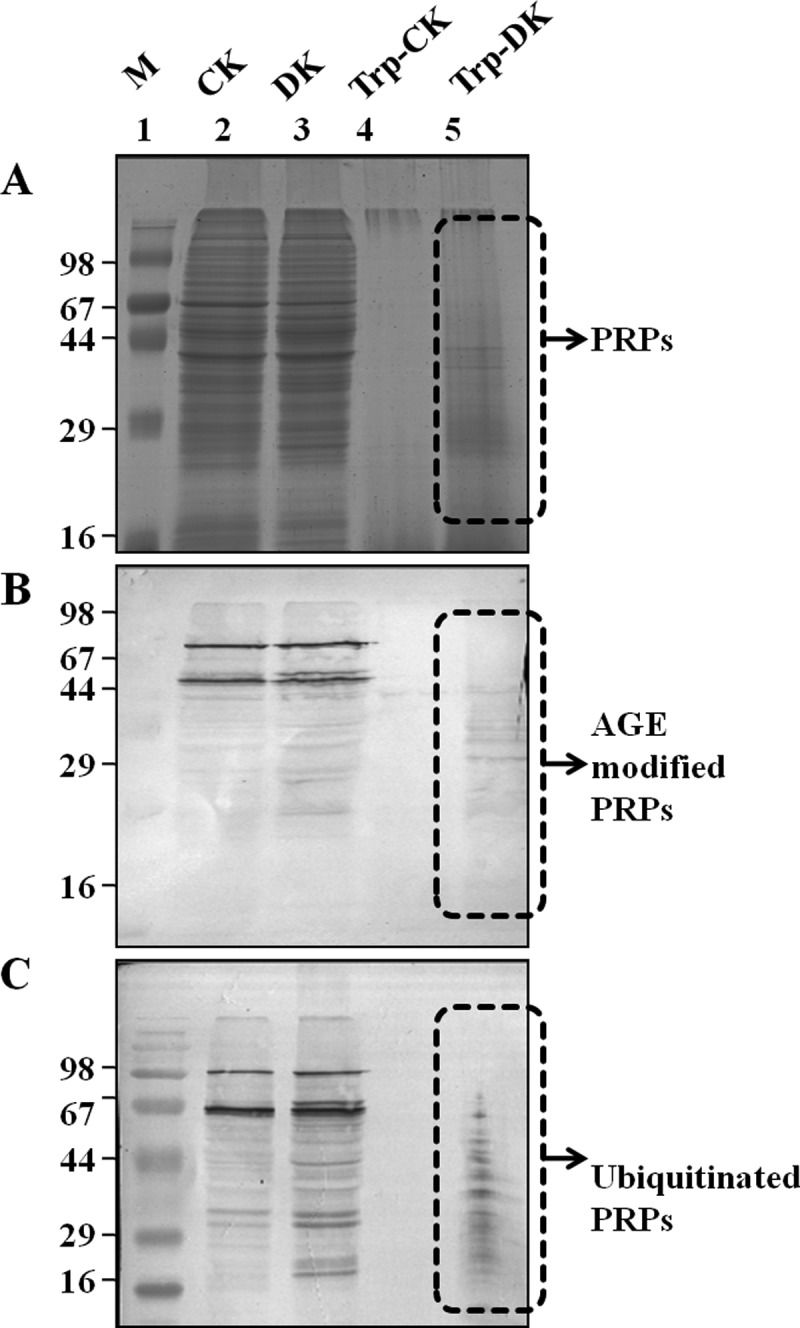
AGE and ubiquitin modification of PRPs. The protein lysate of control (CK) and diabetic (DK) rat kidney was separated on SDS-PAGE with and without tryptic digestion. Western blot analysis was performed with anti-AGE or anti-ubiquitin antibodies for detection of PRPs with AGE and ubiquitin modification. A, SDS-PAGE: Lane 2 and 3 showing undigested control (CK) and diabetic (DK) rat kidney lysate whereas lane 4 and 5 contains the same digested with trypsin (Try-CK, Try-DK). The same samples were immunoblotted with Anti-AGE (B) and Anti-ubiquitin (C) antibody, respectively. The experiment was repeated independently three times.
Fig. 3.

Total protease and proteasomal activity. Control (CK) and diabetic (DK) rat kidney protein lysate was assessed for total protease activity by A, Azocasein assay and B, In- gel protease assay. These assays demonstrated that total protease activity is significantly reduced in DK. Formation of fluorescent AMC from AMC-tagged peptide was determined to assess (C) Proteasomal activity of rat kidney homogenate of CK and DK, and D, In vitro MGO modified proteasome activity. Bars represent means ± S.E. from three independent experiments. *p < 0.05.
Identification and Characterization of PRPs for Glycation and Ubiquitin Modifications
Mass spectrometry has been extensively used to identify and characterize proteins modified by glycation (30) and ubiquitination (31). Therefore, PRPs detected as AGE modified and ubiquitinated by Western blotting were identified and characterized by mass spectrometry. About 18 PRPs were identified with a confidence of > 95% and found to be involved in various cellular processes are listed in Table II and detailed information is given in supplemental Table S2. A list of distinct peptides assigned for each protein, and all peptide sequences and their score are listed in supplemental Tables S3 and S5 respectively. All 18 proteins were further confirmed for the presence of different AGE modification and ubiquitination in MSE analysis (See supplemental Fig. S1 and Table S4). Identified PRPs were additionally validated by Western blotting using specific antibodies for a few representative proteins (Fig. 4). It was interesting to identify some of these proteins involved in glucose/energy metabolism such as ENO, GAPDH, ICDH, and MDH as modified by various glycation modifications, common to our previous study (12). Hence, these results provided additional evidence that the protease resistance of these proteins is caused by a variety of AGE modifications. In addition to these proteins, stress response proteins such as 60 kDa HSP, Mn-SOD were identified as PRPs in the diabetic rat kidney. Other PRPs involved in cytoskeletal organization and transport were also identified (Table II).
Table II. Mass spectrometrically identified proteins detected by anti-AGE and anti-ubiquitin antibody.
| Acc. no. | Protein name | No. of AGE modifications | No. of ubiquitin modifications |
|---|---|---|---|
| D3ZGY4 | Glyceraldehyde 3 phosphate dehydrogenase | 7 | 2 |
| P63039 | 60 kDa heat shock protein mitochondrial | 14 | 4 |
| P56574 | Isocitrate dehydrogenase NADP | 11 | 1 |
| P07895 | Superoxide dismutase Mn mitochondrial | 11 | 1 |
| P51635 | Alcohol dehydrogenase NADP | 9 | 1 |
| F1LP05 | ATP synthase subunit alpha | 14 | 4 |
| P10719 | ATP synthase subunit beta mitochondrial | 6 | 3 |
| P04764 | Alpha enolase | 6 | 2 |
| P16617 | Phosphoglycerate kinase | 13 | 4 |
| P42123 | L lactate dehydrogenase B chain | 10 | 3 |
| P04636 | Malate dehydrogenase mitochondrial | 8 | 1 |
| 4903 | Glutathione S transferase alpha 1 | 18 | 2 |
| P00884 | Fructose bisphosphate aldolase B | 12 | 3 |
| P06685 | Sodium potassium transporting ATPase subunit alpha 1 | 17 | 2 |
| P10860 | Glutamate dehydrogenase 1 mitochondrial | 10 | 4 |
| Q68FU3 | Electron transfer flavoprotein subunit beta | 11 | 2 |
| Q5XIF6 | Tubulin alpha 4A chain | 7 | 1 |
| Q9WVK7 | Hydroxyacyl coenzyme A dehydrogenase mitochondrial | 12 | 2 |
Fig. 4.
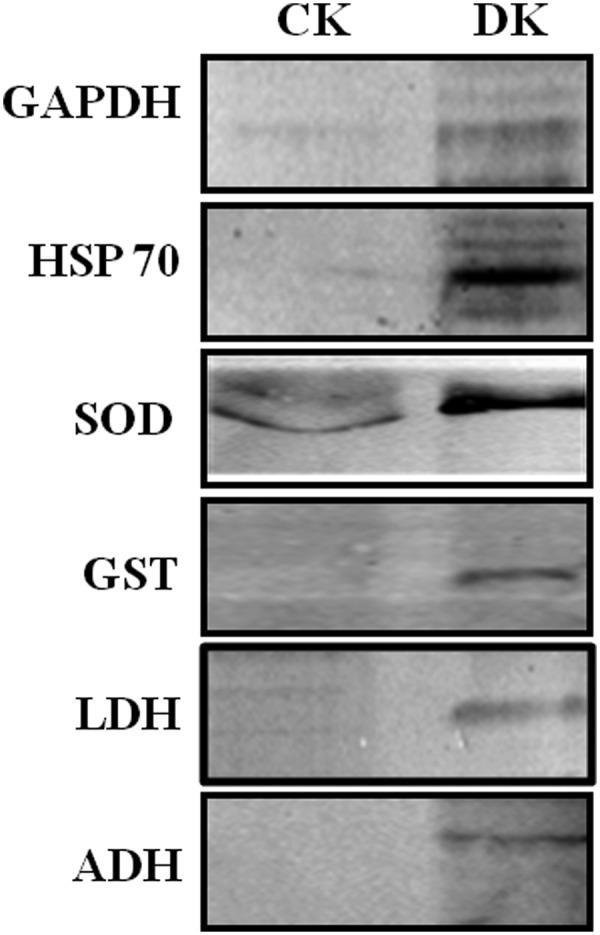
Validation of LC-MSE identified PRPs by Western blotting. Protein lysate of Control (CK) and diabetic (DK) rat kidney was digested with trypsin, and separated on SDS-PAGE, followed by immunoblotting with antibodies against GAPDH, HSP 60, SOD, GST, LDH, and ADH. Presence of these proteins in DK after trypsin digestion confirmed the identification of PRPs by mass spectrometry. The experiment was repeated independently three times.
PRPs Exhibited Reduced Functional Activity
Mn-SOD, LDH, ADH, and GST were selected as representative proteins involved in oxidative stress, energy metabolism, and detoxification respectively for the functional analysis. The activity of all these enzymes was significantly affected in diabetic condition (Fig. 5A–5D). The activity of Mn-SOD was reported to be reduced in leukocytes of diabetic patients (32). In normal physiological condition SOD plays a central role in scavenging free radicals, reduced SOD function may increase oxidative stress. Our results with ADH were comparable with a previous study of glycation of sorbitol dehydrogenase decreasing its activity (33). With respect to GST, our results were consistent with the earlier reports in which impaired GST activity in liver microsomes and mitochondria was observed in diabetic rats (34). As GSTs constitute one of the major components of the phase II drug-metabolizing enzyme and antioxidant systems, its reduced activity may lead to diabetic complications by causing a disturbance in xenobiotic metabolism. Glycation induced inactivation of LDH was observed both in isolation and in cell lysates previously (35). These effects could be caused by the direct adduction of the free- or protein-bound carbonyls with the target enzymes.
Fig. 5.

Functional assays of identified PRPs. The enzymatic activities of A, SOD, B, LDH, C, ADH, and D, GST were analyzed for control (CK) and diabetic (DK) rat kidney protein lysate using protocols described in supplemental method S1. In DK, significant reduction in enzymatic activity was observed. Bars represent means ± S.E. from three independent experiments. *p < 0.05.
Prediction of Aggregation Hotspots in PRPs
Protein aggregation is implicated in the development of Alzheimer's and Parkinson's disease and in diabetes through crosslinking of proteins. In this study, identified PRPs were observed to be aggregated because of a glycation reaction. In silico analysis was performed to predict the regions of a polypeptide chain that were prone to β-sheet aggregation and amyloid formation. Aggregation prone regions of the identified PRPs are listed in Table III. It was remarkable to find that some of the aggregation-prone regions had glycation modification sites identified by LC-MSE. The aggregation prone regions containing glycation modifications were mapped onto their structure in representative PRPs (Fig. 6). The finding of glycation modification sites in the aggregation-prone region suggests that the increased protein cross-linking and aggregation in diabetes could be because of AGE modification.
Table III. In silico analysis of aggregation prone regions in PRPs. Bold and italicized regions had glycation modifications.
| Identified proteins | Predicted aggregation prone regions |
|---|---|
| Glyceraldehyde 3 phosphate dehydrogenase | 35–47, 114–121, 158–181, 214–232, 301–314 |
| 60 kDa heat shock protein mitochondrial | 17–31, 60–76, 138–142, 240–250, 253–258, 397–405, 464–481 |
| Isocitrate dehydrogenase NADP | 60–72, 74–84, 105–114, 142–150, 186–197, 246–253, 297–308, 322–336, 369–377 |
| Superoxide dismutase Mn mitochondrial | 1–6, 97–105, 134–146, 179–194, 200–211, 214–218 |
| Alcohol dehydrogenase NADP | 31–46, 72–81, 102–114, 145–161, 173–179, 233–238, 247–261, 269–282 |
| ATP synthase subunit alpha | 1–11, 74–80, 112–125, 218–227, 241–252, 339–367, 407–417 |
| ATP synthase subunit beta mitochondrial | 61–72, 82–86, 139–149, 202–235, 263–271, 282–290, 303–310, 316–332, 384–395, 435–443, 504–511 |
| Alpha enolase | 21–35, 105–121, 149–154, 165–172, 223–232, 276–287, 307–316, 363–370, 381–393 |
| Phosphoglycerate kinase | 16–26, 81–101, 112–122, 175–185, 235–254, 363–375 |
| L lactate dehydrogenase B chain | 22–47, 88–98, 124–129, 131–139, 141–152, 173–179, 200–212, 294–301 |
| Malate dehydrogenase mitochondrial | 27–35, 40–61, 91–98, 134–157, 164–180, 235–260 |
| Glutathione S transferase alpha 1 | 6–10, 67–79, 101–112, 147–151, 156–171 |
| Fructose Bisphosphate aldolase B | 61–69, 98–110, 249–261, 267–273, 281–290, 353–364 |
| Sodium potassium transporting ATPase subunit alpha 1 | 91–117, 130–150, 244–249, 253–263, 303–332, 388–393, 750–760, 771–798, 802–817, 865–879, 802–817, 916–936, 949–971, 994–1001 |
| Glutamate dehydrogenase 1 mitochondrial | 104–120, 160–177, 300–328, 355–363, 418–425, 427–447, 550–558 |
| Electron transfer flavoprotein subunit beta | 1–20, 117–127, 218–228 |
| Tubulin alpha 4A chain | 1–12, 64–71, 148–158, 166–172, 189–193, 226–243, 312–323, 327–333, 335–347, 372–383, 399–410 |
| Hydroxyacyl coenzyme A dehydrogenase mitochondrial | 21–45, 47–55, 106–122, 153–173, 215–233, 259–272 |
Fig. 6.

Prediction of aggregation prone regions. Protein structures of rat GAPDH, HSP 60, SOD, GST, LDH and ADH were modeled by CPH 3.0 model server and analyzed using PyMol. Aggregation prone regions in these proteins were predicted in silico using Aggrescan, Tango, PASTA, and Waltz web servers (blue color). The regions common to aggregation prone sequences and glycation sites were highlighted in the red color, indicating that most of the glycation sites were overlapping with predicted aggregation hotspots.
Gene Expression Analysis of PRPs
Western blotting (Fig. 7A) and semiquantitative RT-PCR (Fig. 7B) studies revealed the up-regulation of GAPDH, HSP60, SOD, GST, LDH, and ADH at both protein as well as mRNA level respectively in diabetic rat kidneys. Beta-actin (housekeeping gene) showed equivalent expression at the mRNA level of control as well as diabetic kidney tissue (supplemental Fig. S2). Increased expression of GAPDH has been observed in the diabetic rat liver (36). HSP70, which is involved in stress response, has also been observed to be up-regulated in the circulation of diabetic patients and correlates positively with the chronicity of disease (37). The mRNA levels of Mn-SOD found to be increased in the rat embryos as a response to maternal diabetes (38). Increased expression of GST in renal proximal tubules in the early stages of diabetes in mouse has been detected by mRNA, Western blot, and immunohistochemical analysis (39). Dramatic increase in LDH mRNA level has been reported in chronic hyperglycemia induced in rats by partial pancreatectomy (40). Increased brain protein level of ADH has been observed in Alzheimer's disease because of elevated carbonyls (41). As we have shown that the biological function of PRPs was decreased because of AGE modification in the diabetic condition, the cells possibly have increased expression of these proteins to compensate for the loss of activity. Indeed, it has been studied that inactivation of sorbitol dehydrogenase by glycation reaction was associated with increased mRNA and protein levels in the liver of STZ-induced diabetic rats (33). In addition to this, decreased proteasomal activity and decreased removal of these proteins contributes to their stability and may lead to cross-linking and aggregation (Fig. 8). These results provided insight into the probable cause of protease resistance and its consequences leading to diabetic complications.
Fig. 7.

Expression analysis of PRPs. A, Protein expression of GAPDH, HSP 60, SOD, GST, LDH, and ADH in control (CK) and diabetic (DK) rat kidney was measured by the Western blot analysis. B, The same proteins were analyzed at the transcript level by performing semi-quantitative RT-PCR using total RNA isolated from control and diabetic rat kidney tissues. All samples were analyzed on 2% agarose gels containing gel red. Both analyses showed up-regulation of PRPs in diabetic condition. Results shown are representative of three independent experiments.
Fig. 8.

Schematic diagram for accumulation of PRPs and up-regulation of proteins. The proposed model shows that AGE modification and impairment in proteasomal activity results in accumulation of protease resistant aggregates. AGE modification causes loss of functional activity of enzymes, which is compensated by increased gene expression. Both the inability of proteasome to remove protease resistant aggregates and decreased enzyme activity may cause up-regulation of proteins in the diabetic condition.
Supplementary Material
Acknowledgments
This work was supported by CSIR network project NWP0004. SBB and RSJ acknowledge CSIR and UGC for the research fellowships respectively. ADC is grateful to acknowledge the fellowship provided by the Department of Biotechnology (DBT), India. The authors have declared no conflict of interest.
Footnotes
 This article contains supplemental Figs. S1 and S2 and Tables S1 to S5.
1 The abbreviations used are:
- AGE
- advanced glycation end product
- ADH
- alcohol dehydrogenase
- BSA
- bovine serum albumin
- DAB
- diaminobenzidine
- ENO
- enolase
- GAPDH
- glyceraldehyde 3-phosphate dehydrogenase
- GST
- glutathione S-transferase
- HSP
- heat shock protein
- ICDH
- isocitrate dehydroganse
- LDH
- lactate dehydrogenase
- MDH
- malate dehydrogenase
- PRPs
- protease resistant proteins
- RAGE
- receptor for advanced glycation end products
- SOD
- superoxide dismutase.
REFERENCES
- 1. Brownlee M. (2001) Biochemistry and molecular cell biology of diabetic complications. Nature. 414, 813–820 [DOI] [PubMed] [Google Scholar]
- 2. Peppa M., Uribarri J., Vlassara H. (2003) Glucose, Advanced Glycation End products, and Diabetes complications: What is new and what works. Clin. Diabetes. 21, 186–187 [Google Scholar]
- 3. Bulteau A. L., Verbeke P., Petropoulos I., Chaffotte A. F., Friguet B. (2001) Proteasome inhibition in glyoxal-treated fibroblasts and resistance of glycated glucose-6-phosphate dehydrogenase to 20s proteasome degradation in vitro. J. Biol. Chem. 276, 45662–45668 [DOI] [PubMed] [Google Scholar]
- 4. Monnier V. M., Kohn R. R., Cerami A. (1984) Accelerated age-related browning of human collagen in diabetes mellitus. Proc. Natl. Acad. Sci. U.S.A. 81, 583–587 [DOI] [PMC free article] [PubMed] [Google Scholar]
- 5. Reddy G. K., Stehno-Bittel L., Enwemeka C. S. (2002) Glycation-induced matrix stability in the rabbit achilles tendon. Arch. Biochem. Biophys. 399, 174–180 [DOI] [PubMed] [Google Scholar]
- 6. Schnider S.L., Kohn R. R. (1981) Effects of age and diabetes mellitus on the solubility and nonenzymatic glucosylation of human skin collagen. J. Clin. Invest. 67, 1630–1635 [DOI] [PMC free article] [PubMed] [Google Scholar]
- 7. Smith M. A., Taneda S., Richey P. L., Miyata S., Yan S. D., Stern D., Sayre L. M., Monnier V. M., Perry G. (1994) Advanced Maillard reaction end products are associated with Alzheimer disease pathology. Proc. Natl. Acad. Sci. U.S.A. 91, 5710–5714 [DOI] [PMC free article] [PubMed] [Google Scholar]
- 8. Vernace V. A., Schmidt-Glenewinkel T., Figueiredo-Pereira M. E. (2007) Aging and regulated protein degradation: who has the UPPer hand? Aging Cell. 6, 599–606 [DOI] [PMC free article] [PubMed] [Google Scholar]
- 9. Portero-Otín M., Pamplona R., Ruiz M. C., Cabiscol E., Prat J., Bellmunt M. J. (1999) Diabetes induces an impairment in the proteolytic activity against oxidized proteins and a heterogeneous effect in nonenzymatic protein modifications in the cytosol of rat liver and kidney. Diabetes. 48, 2215–2220 [DOI] [PubMed] [Google Scholar]
- 10. Goldberg A. L. (2003) Protein degradation and protection against misfolded or damaged proteins. Nature. 426, 895–899 [DOI] [PubMed] [Google Scholar]
- 11. Davies K. J., Shringarpure R. (2006) Preferential degradation of oxidized proteins by the 20S proteasome may be inhibited in aging and in inflammatory neuromuscular diseases. Neurology. 66, S93–S96 [DOI] [PubMed] [Google Scholar]
- 12. Chougale A. D., Bhat S. P., Bhujbal S. V., Zambare M. R., Puntambekar S., Somani R. S., Boppana R., Giri A. P., Kulkarni M. J. (2012) Proteomic analysis of glycated proteins from streptozotocin-induced diabetic rat kidney. Mol. Biotech. 50, 28–38 [DOI] [PubMed] [Google Scholar]
- 13. Figueroa-Romero C., Sadidi M., Feldman E. L. (2008) Mechanisms of disease: the oxidative stress theory of diabetic neuropathy. Rev. Endocr. Metab. Disord. 9, 301–314 [DOI] [PMC free article] [PubMed] [Google Scholar]
- 14. Ahmad W., Li L., Deng Y. (2008) Identification of AGE-precursors and AGE formation in glycation-induced BSA peptides. BMB Rep. 41, 516–522 [DOI] [PubMed] [Google Scholar]
- 15. Queisser M. A., Yao D., Geisler S., Hammes H. P., Lochnit G., Schleicher E. D., Brownlee M., Preissner K. T. (2010) Hyperglycemia Impairs Proteasome Function by Methylglyoxal. Diabetes. 59, 670–678 [DOI] [PMC free article] [PubMed] [Google Scholar]
- 16. Lomenick B., Hao R., Jonai N., Chin R. M., Aghajan M., Warburton S., Wang J., Wu R. P., Gomez F., Loo J. A., Wohlschlegel J. A., Vondriska T. M., Pelletier J., Herschman H. R., Clardy J., Clarke C. F., Huang J. (2009) Target identification using drug affinity responsive target stability (DARTS). Proc. Natl. Acad. Sci. U.S.A. 106, 21984–21989 [DOI] [PMC free article] [PubMed] [Google Scholar]
- 17. Havlis J., Thomas H., Sebela M., Shevchenko A. (2003) Fast-response proteomics by accelerated in-gel digestion of proteins. Anal. Chem. 75, 1300–1306 [DOI] [PubMed] [Google Scholar]
- 18. Bhonsle H. S., Korwar A. M., Kote S. S., Golegaonkar S. B., Chougale A. D., Shaik M. L., Dhande N. L., Giri A. P., Shelgikar K. M., Boppana R., Kulkarni M. J. (2012) Low plasma albumin levels are associated with increased plasma protein glycation and HbA1c in diabetes. J. Prot. Res. 11, 1391–1396 [DOI] [PubMed] [Google Scholar]
- 19. Brock F. M., Forsberg C. W., Buchanan-Smith J. G. (1982) Proteolytic activity of rumen microorganisms and effects of proteinase inhibitors. Appl. Environ. Microbiol. 44, 561–569 [DOI] [PMC free article] [PubMed] [Google Scholar]
- 20. Solomon M., Belenghi B., Delledonne M., Menachem E., Levine A. (1999) The involvement of cysteine proteases and protease inhibitor genes in the regulation of programmed cell death in plants. Plant Cell 11, 431–444 [DOI] [PMC free article] [PubMed] [Google Scholar]
- 21. Beauchamp C., Fridovich I. (1971) Superoxide dismutase: Improved assays and an assay applicable to acrylamide gels. Anal. Biochem. 44, 276–287 [DOI] [PubMed] [Google Scholar]
- 22. Zanon J. P., Peres M. F. S., GattÃA¡s E. A. L. (2007) Colorimetric assay of ethanol using alcohol dehydrogenase from dry baker's yeast. Enz. Microb. Tech. 40, 466–470 [Google Scholar]
- 23. Habig W. H., Pabst M. J., Jakoby W. B. (1974) Glutathione S-Transferases-First enzymatic step in mercapturic acid formation. J. Biol. Chem. 249, 7130–7139 [PubMed] [Google Scholar]
- 24. Conchillo-Sole O., de Groot N. S., Aviles F. X., Vendrell J., Daura X., Ventura S. (2007) AGGRESCAN: a server for the prediction and evaluation of “hot spots” of aggregation in polypeptides. BMC Bioinformatics. 27, 8, 65 [DOI] [PMC free article] [PubMed] [Google Scholar]
- 25. Fernandez-Escamilla A. M., Rousseau F., Schymkowitz J., Serrano L. (2004) Prediction of sequence-dependent and mutational effects on the aggregation of peptides and proteins. Nat. Biotech. 22, 1302–1306 [DOI] [PubMed] [Google Scholar]
- 26. Trovato A., Seno F., Tosatto S. C. E. (2007) The PASTA server for protein aggregation prediction. Protein Eng. Des. Sel. 20, 521–523 [DOI] [PubMed] [Google Scholar]
- 27. Trovato A., Chiti F., Maritan A., Seno F. (2006) Insight into the Structure of Amyloid Fibrils from the Analysis of Globular Proteins. PLoS Comput. Biol. 2, e170. [DOI] [PMC free article] [PubMed] [Google Scholar]
- 28. Friguet B., Bulteau A. L., Chondrogianni N., Conconi M., Petropoulos I. (2000) Protein Degradation by the Proteasome and Its Implications in Aging. Ann. N.Y. Acad. Sci. 908, 143–154 [DOI] [PubMed] [Google Scholar]
- 29. Riederer B. M., Leuba G., Vernay A., Riederer I. M. (2011) The role of the ubiquitin proteasome system in Alzheimer's disease. Exp. Biol. Med. (Maywood). 236, 268–276 [DOI] [PubMed] [Google Scholar]
- 30. Lapolla A., Fedele D., Seraglia R., Traldi P. (2006) The role of mass spectrometry in the study of non-enzymatic protein glycation in diabetes: An update. Mass Spectrom. Rev. 25, 775–797 [DOI] [PubMed] [Google Scholar]
- 31. Kaiser P., Wohlschlegel J. (2005) Identification of ubiquitination sites and determination of ubiquitin-chain architectures by mass spectrometry. Methods Enzymol. 399, 266–277 [DOI] [PubMed] [Google Scholar]
- 32. Uchimura K., Nagasaka A., Hayashi R., Makino M., Nagata M., Kakizawa H., Kobayashi T., Fujiwara K., Kato T., Iwase K., Shinohara R., Kato K., Itoh M. (1999) Changes in Superoxide Dismutase Activities and Concentrations and Myeloperoxidase Activities in Leukocytes from Patients with Diabetes Mellitus. J. Diabetes Complications. 13, 264–270 [DOI] [PubMed] [Google Scholar]
- 33. Hoshi A., Takahashi M., Fujii J., Myint T., Kaneto H., Suzuki K., Yamasaki Y., Kamada T., Taniguchi N. (1996) Glycation and inactivation of sorbitol dehydrogenase in normal and diabetic rats. Biochem. J. 318, 119–123 [DOI] [PMC free article] [PubMed] [Google Scholar]
- 34. Traverso N., Menini S., Odetti P., Pronzato M. A., Cottalasso D., Marinari U. M. (2002) Diabetes impairs the enzymatic disposal of 4-hydroxynonenal in rat liver. Free Radic. Biol. Med. 32, 350–359 [DOI] [PubMed] [Google Scholar]
- 35. Morgan P. E., Dean R. T., Davies M. J. (2002) Inactivation of cellular enzymes by carbonyls and protein-bound glycation/glycoxidation products. Arch. Biochem. Biophys. 403, 259–269 [DOI] [PubMed] [Google Scholar]
- 36. Johnson D. T., Harris R. A., French S., Aponte A., Balaban R. S. (2009) Proteomic changes associated with diabetes in the BB-DP rat. Am. J. Physiol. Endocrinol. Metab. 296, E422–E432 [DOI] [PMC free article] [PubMed] [Google Scholar]
- 37. Nakhjavani M., Morteza A., Khajeali L., Esteghamati A., Khalilzadeh O., Asgarani F., Outeiro T. F. (2010) Increased serum HSP70 levels are associated with the duration of diabetes. Cell Stress and Chaperones. 15, 959–964 [DOI] [PMC free article] [PubMed] [Google Scholar]
- 38. Cederberg J., Galli J., Luthman H., Eriksson U. J. (2000) Increased mRNA levels of Mn-SOD and catalase in embryos of diabetic rats from a malformation-resistant strain. Diabetes. 49, 101–107 [DOI] [PubMed] [Google Scholar]
- 39. Fujita H., Haseyama T., Kayo T., Nozaki J., Wada Y., Ito S., Koizumi A. (2001) Increased expression of glutathione S-transferase in renal proximal tubules in the early stages of diabetes: a study of type-2 diabetes in the Akita mouse model. Exp. Nephrol. 9, 380–386 [DOI] [PubMed] [Google Scholar]
- 40. Jonas J. C., Sharma A., Hasenkamp W., Ilkova H., Patanè G., Laybutt R., Bonner-Weir S., Weir G. C. (1999) Chronic Hyperglycemia Triggers Loss of Pancreatic Î2 Cell Differentiation in an Animal Model of Diabetes. J. Biol. Chem. 274, 14112–14121 [DOI] [PubMed] [Google Scholar]
- 41. Balcz B., Kirchner L., Cairns N., Fountoulakis M., Lubec G. (2001) Increased brain protein levels of carbonyl reductase and alcohol dehydrogenase in Down syndrome and Alzheimer's disease. J. Neural Transm. Suppl. 61, 193–201 [DOI] [PubMed] [Google Scholar]
Associated Data
This section collects any data citations, data availability statements, or supplementary materials included in this article.