

Abstract
RACK1/Asc1p and its essential orthologues in higher eukaryotes, such as RACK1 in metazoa, are involved in several distinct cellular signaling processes. The implications of a total deletion have never been assessed in a comprehensive manner. This study reveals the major cellular processes affected in a Saccharomyces cerevisiae Δasc1 deletion background via de novo proteome and transcriptome analysis, as well as subsequent phenotypical characterizations. The deletion of ASC1 reduces iron uptake and causes nitrosative stress, both known indicators for hypoxia, which manifests in a shift of energy metabolism from respiration to fermentation in the Δasc1 strain. Asc1p further impacts cellular metabolism through its regulative role in the MAP kinase signal transduction pathways of invasive/filamentous growth and cell wall integrity. In the Δasc1 mutant strain, aberrations from the expected cellular response, mediated by these pathways, can be observed and are linked to changes in protein abundances of pathway-targeted transcription factors. Evidence of the translational regulation of such transcription factors suggests that ribosomal Asc1p is involved in signal transduction pathways and controls the biosynthesis of the respective final transcriptional regulators.
The Gβ-like WD40-repeat protein Asc1p of Saccharomyces cerevisiae is an integral component of the small 40S ribosomal subunit (1, 2). Because of the distinct seven-bladed propeller structure of Asc1p and its exposed localization near the ribosomal mRNA exit tunnel, Asc1p depicts an eminent platform for protein–protein interactions and a nexus to the translational apparatus (1, 3).
Genome-wide genetic, biochemical, and interaction studies have defined ASC1/Asc1p as a potential interaction partner for a multitude of various genes/proteins (4–7). Asc1p specifically interacts with the mRNA-binding protein Scp160 (4, 5) and has been shown to be required for the interaction of Scp160p with the ribosome, suggesting a role for Asc1p as an adapter protein, bringing specific mRNAs, translation factors, and the ribosome in proximity (8). An extended Asc1p network (Smy2p, Eap1p, Scp160p, and Asc1p, known as the SESA network) has been identified to specifically inhibit the translation initiation of the POM34-mRNA, encoding an integral membrane protein of the nuclear pore complex (9). The influence of Asc1p on the translational process is further evident in the increased Gcn2p-kinase-dependent phosphorylation of eukaryotic translation initiation factor 2 (eIF2) in a Δasc1 background and increased levels of phosphorylated eIF4A, an RNA helicase, when ASC1 is deleted (10). In addition to encoding for Asc1p, the ASC1 locus harbors an intron coding for the small nucleolar RNA (snoRNA) U24. U24 is required for the maturation of the 60S ribosomal subunit via site-specific 2′-O-methylation of the 28S rRNA (11). As a result, snoRNA U24 deletion results in reduced levels of mature 60S ribosomal subunits, producing a halfmer phenotype in polysome experiments, which might affect translation efficiency (12).
The particular structure of Asc1p is highly conserved among eukaryotes, including mammalian RACK1, which was originally found as a receptor of activated protein kinase C (PKC)1 (13). RACK1 has since been described as an anchoring and translocation-mediating protein for several other cellular proteins, including Ras-GAP, dynamin-1, Src, several integrins (14), and the cAMP-specific phosphodiesterase PDE4D5 (15). RACK1 presumably recruits these proteins to their appropriate subcellular sites, thereby integrating their actions into intracellular signaling pathways (14). Accordingly, RACK1 has recently been shown to enable cross-talk between the PKC and cAMP signaling pathways by mediating the PKC-dependent activation of PDE4D5 in response to elevated intracellular cAMP levels (16).
Correspondingly, the deletion of ASC1 in S. cerevisiae and its orthologues in other eukaryotic organisms leads to pleiotropic phenotypes based on significant misregulations in signal perception and transduction (10, 17). As a result, in S. cerevisiae, developmental differentiation is affected when ASC1 is deleted, resulting in the absence of filamentous growth (haploid invasive or diploid pseudohyphal) and severely compromised cell wall integrity (10, 18). Furthermore, Asc1p's involvement in the organization of cellular respiration and fermentation is suggested by its initial characterization as absence of growth suppressor of a hem1−cyp1−/hap1− mutant strain in S. cerevisiae (19). In Schizosaccharomyces pombe, Cpc2p (Asc1p in S. cerevisiae) regulates sexual differentiation in a complex with Moc1p/Sds23p and Moc2p/Ded1p (20). The Asc1p complement Rak1 of Ustilago maydis interacts with several ribosomal proteins and has been shown to regulate virulence and mating by influencing the mRNA levels of the transcriptional activator Rop1 (21). Also in higher eukaryotes, RACK1 is required for several developmental processes, including seed germination, root formation, leaf production, and flowering in Arabidopsis thaliana (22, 23). RACK1 of Drosophila melanogaster is expressed in many tissues with a specific requirement at multiple steps of development (24). Studies of human cell lines revealed that RACK1 influences cellular processes that are directly connected to cell proliferation and cell cycle progression (25). Thus, RACK1 has been repeatedly described in the context of uncontrolled cell division and as a contributing factor in in vivo tumor growth (26, 27). It is up-regulated during angiogenesis, as well as in colon carcinoma, non-small cell lung carcinoma (28), and melanomas (29).
Because of the essential function of RACK1 in developmental processes, its deletion is lethal even at early embryonic stages and can therefore not be examined in higher eukaryotes such as plants or metazoa (30). In S. cerevisiae, Asc1p is also involved in cell development, evident by the inability of a Δasc1 strain to grow adhesively or form pseudohyphae, but the consequences of an ASC1 deletion in this simple eukaryotic model organism are far less severe. This allows the investigation of a total ASC1 deletion in S. cerevisiae to determine the cellular and molecular function of the highly conserved eukaryotic protein Asc1p.
This study is based on a proteome and transcriptome analysis of an S. cerevisiae Δasc1 strain. Together with phenotypical and molecular characterizations, it delivers functional groups of proteins and mRNAs with an altered expression in response to the deletion of ASC1 and determines affected cellular processes. We show that Asc1p post-transcriptionally regulates the abundances of transcription factors involved in the MAPK signaling pathways of invasive/pseudohyphal growth and pheromone response. Furthermore, cell wall integrity, regulated by the Pkc1p-MAPK pathway, as well as iron homeostasis and energy metabolism, is imbalanced in a Δasc1 mutant.
EXPERIMENTAL PROCEDURES
Yeast Strains and Growth Conditions
The Saccharomyces cerevisiae strains used in this work were of the Σ1278b background and are listed in Table I. Strain RH3428 was derived from RH2816 by deleting the ASC1 gene with a URA3-cassette, as described by Gueldener et al. (31). The deletion strains RH3461–RH3464 were obtained via amplification of the KanMX4 deletion cassette from plasmid pUG6 and subsequent transformation of strains RH2817 and RH3263 (31). Marker rescue, according to Gueldener et al. (31), was performed with strains RH3463 and RH3464 prior to the deletion of YHB1 as described above, yielding strains RH3497 and RH3498. For the construction of strain RH3510, the loxP-URA3-loxP cassette was amplified from pUG72 with the oligonucleotides 5′-GACTTTGATCTCCTGGAAGTTGACTGGTGACGACCAAAAGTTTGGAGCAGCTGAAGCTTCGTACGC-3′ (forward) and 5′-TCTTGGACAATGTGACTGTGACCCTTGAAAGATCTAACTGGGACAGCATAGGCCACTAGTGGATCTG-3′ (reverse), containing sequences identical to regions of exon 1 in the ASC1 locus. The resulting fragment was inserted into the genome via homologous recombination. Subsequently, the URA3 gene was removed by the expression of the Cre recombinase from plasmid pSH63, leaving behind one loxP site in exon 1 (supplemental Fig. S2) (31). Strains RH3429–RH3436 and strains RH3478, RH3479, RH3503, RH3504, and RH3505 were generated by C-terminally tagging HBN1, YHB1, PHD1, FLO8, and STE12 with 3xmyc according to the procedure described by Janke and colleagues (32). Transformations were carried out according to the lithium acetate method (33). Cultures were grown at 30 °C overnight in 10 ml liquid minimal yeast nitrogen base media (YNB: 1,5 g/l yeast nitrogen base lacking amino acids and ammonium sulfate, 5 g/l ammonium sulfate, 2% glucose) containing respective supplements, diluted and cultivated in main cultures to midlog phase before the isolation of protein extracts. Experiment-specific growth conditions are given in the respective paragraphs.
Table I. S. cerevisiae strains used in this work.
| Strain | Genotype | Reference |
|---|---|---|
| RH2816 | MATa, ura3-52, trp1::hisG | Our collection |
| RH2817 | MATα, ura3-52, trp1::hisG | Valerius et al., 2007 (10) |
| RH3263 | MATα, ura3-52, trp1::hisG, leu2::hisG, Δasc1::LEU2 | Valerius et al., 2007 (10) |
| RH2681 | MATa, ura3-52, trp1::hisG, Δflo11::kanMX4 | Braus et al., 2003 (87) |
| RH3220 | MATα, ura3-52, Δsfl1::kanMX4, trp1::hisG | Valerius et al., 2007 (10) |
| RH3428 | MATa, ura3-52, trp1::hisG, Δasc1::URA3 | This work |
| RH3433 | MATα, ura3-52, trp1::hisG, HBN1-3myc | This work |
| RH3434 | MATα, ura3-52, trp1::hisG, leu2::hisG, Δasc1::LEU2, HBN1-3myc | This work |
| RH3435 | MATα, ura3-52, trp1::hisG, YHB1-3myc | This work |
| RH3436 | MATα, ura3-52, trp1::hisG, leu2::hisG, Δasc1::LEU2, YHB1-3myc | This work |
| RH3429 | MATα, ura3-52, trp1::hisG, PHD1-3myc | This work |
| RH3430 | MATα, ura3-52, trp1::hisG, leu2::hisG, Δasc1::LEU2, PHD1-3myc | This work |
| RH3431 | MATα, ura3-52, trp1::hisG, FLO8-3myc | This work |
| RH3432 | MATα, ura3-52, trp1::hisG, leu2::hisG, Δasc1::LEU2, FLO8-3myc | This work |
| RH3461 | MATα, ura3-52, trp1::hisG Δyhb1::kanMX4 | This work |
| RH3462 | MATα, ura3-52, trp1::hisG, leu2::hisG, Δasc1::LEU2, Δyhb1::kanMX4 | This work |
| RH3463 | MATα, ura3-52, trp1::hisG Δhbn1::kanMX4 | This work |
| RH3464 | MATα, ura3-52, trp1::hisG, leu2::hisG, Δasc1::LEU2, Δhbn1::kanMX4 | This work |
| RH3478 | MATα, ura3-52, trp1::hisG, STE12-3myc | This work |
| RH3479 | MATα, ura3-52, trp1::hisG, leu2::hisG, Δasc1::LEU2, STE12-3myc | This work |
| RH3497 | MATα, ura3-52, trp1::hisG, Δhbn1::loxP, Δyhb1::kanMX4 | This work |
| RH3498 | MATα, ura3-52, trp1::hisG, leu2::hisG, Δasc1::LEU2, Δhbn1::loxP, Δyhb1::kanMX4 | This work |
| RH3503 | MATα, ura3-52, trp1::hisG, asc1-loxP SNR24, PHD1-3myc | This work |
| RH3504 | MATα, ura3-52, trp1::hisG, asc1-loxP SNR24, FLO8-3myc | This work |
| RH3505 | MATα, ura3-52, trp1::hisG, asc1-loxP SNR24, STE12-3myc | This work |
| RH3510 | MATα, ura3-52, trp1::hisG, asc1-loxP SNR24 | This work |
Plasmid Construction
All plasmids used in this study are listed in Table II. To construct plasmids pME3751–pME3755, the lengths of the 5′UTRs of respective transcription factors were obtained from the European Bioinformatics Institute Web site (34), and the fragments were amplified and inserted in the testing vector pME3680 as described by Rachfall et al. (35) (supplemental Table S1). Plasmids were amplified in the Escherichia coli strain DH5α in LB medium with 100 μg/ml ampicillin.
Table II. Plasmids used in this work.
| Plasmid | Description | Reference |
|---|---|---|
| pME3680 | promPGK1 followed by BamHI restriction site and ATG start codon (testing vector) | Rachfall et al., 2011 (35) |
| pME3751 | pME3680 with STE12-5′UTR introduced by BamHI restriction | This work |
| pME3752 | pME3680 with RAP1-5′UTR introduced by BamHI restriction | This work |
| pME3753 | pME3680 with TEC1-5′UTR introduced by BamHI restriction | This work |
| pME3754 | pME3680 with FLO8-5′UTR introduced by BamHI restriction | This work |
| pME3755 | pME3680 with PHD1-5′UTR introduced by BamHI restriction | This work |
De Novo Proteome and Two-dimensional PAGE Analysis
Yeast cultures were grown to midlog phase (OD600 = 0.8) prior to the addition of 450μCi Met-[35S]-label (Hartmann Analytik, Braunschweig, Germany) and further incubated for an additional hour. Cells were harvested and washed in wash buffer (0.1 m Tris, pH 8.0, with 1% DMSO and 1 mm PMSF). Protein extracts were obtained by lysing cells with Y-PER® Plus reagent (#78999, Pierce, Rockford, IL) containing complete Protease Inhibitor Mixture (Roche Diagnostics GmbH, Mannheim, Germany) and purifying via methanol-chloroform extraction (36). Protein concentrations were determined using a BCA Protein Assay kit from Pierce (#23227). 100 μg of purified protein extracts were used in two-dimensional PAGE analyses. Gels were silver-stained according to the procedure of Blum et al. (37), vacuum dried, and exposed on imaging plates (Fuji, Tokyo, Japan) for 2 weeks. The protein-spots of the resulting autoradiographies were quantified with the image analysis software PDQuest™ (Bio-Rad, Munich, Germany). Protein-spots were submitted to LC-MS/MS upon a regulation by at least 2-fold. The analysis was performed for seven biologically independent replicates.
LC-MS/MS Protein Identification
Excised polyacrylamide gel pieces of stained protein-spots were digested with trypsin according to the procedure presented by Shevchenko et al. (38). Tryptic peptides extracted from each gel piece were injected onto a reverse-phase liquid chromatographic column (Dionex-NAN75–15-03-C18 PM) utilizing the ultimate HPLC system (Dionex, Idstein, Germany) to further reduce sample complexity prior to mass analyses with an LCQ DecaXP mass spectrometer (Thermo Scientific, San Jose, CA) equipped with a nano-electrospray ion source. Cycles of MS spectra with m/z ratios of peptides and four data-dependent MS2 spectra were recorded via MS. The “peak list” was created with extractms provided with the Xcalibur software package (BioworksBrowser 3.3.1, Thermo Scientific). The MS2 spectra with a total ion current higher than 10,000 were used to search for matches against a yeast genome protein sequence database from the National Center for Biotechnology Information (NCBI) Saccharomyces Genome Database (SGD) (Stanford, CA; March 2005, 6882 sequences, plus 180 sequences of the most commonly appearing contaminants such as keratins and proteases, provided with the BioworksBrowser package) using the TurboSEQUEST algorithm (39) of the Bioworks software. The search parameters based on the TurboSEQUEST software included (i) precursor ion mass tolerance less than 1.4 amu; (ii) fragment ion mass tolerance less than 1.0 amu; (iii) up to three missed tryptic cleavages allowed; and (iv) fixed cysteine modifications by carboxyamidomethylation (plus 57.05 amu), variable modifications by methionine oxidation (plus 15.99 amu), and phosphorylation of serine, threonine, or tyrosine (plus 79.97 amu). At least two matched peptide sequences of identified proteins had to meet the following criteria: (i) the rank by primary score must be 1 for all peptides, (ii) the peptide probability value must be below 0.1, and (iii) the cross-correlation score of matches must be greater than 1.5, 2.0, and 2.5 for peptide ions of charge states 1, 2, and 3, respectively. Each protein included in further analyses had to be identified according to these criteria in at least two independent proteome analyses performed (supplemental Table S2). Peptides of identified proteins were individually blasted against the SGD database (BLASTP against the dataset “Protein Encoding Genes”) to ensure their unambiguous assignment to the TurboSEQUEST-specified protein.
Scintillation Counting
Metabolically labeled protein extracts were separated from free Met-[35S]-isotope via methanol-chloroform extraction (36), and the sediment was resuspended in 400 μl Y-PER® Plus reagent. 200 μl of the suspension were mixed with 5 ml of ULTIMA GOLD XR LCS-Mixture (Perkin Elmer, Boston, MA) and subjected to scintillation counting. The measured counts per minute were related to the concentration of protein extracts determined using a BCA Protein Assay kit (Pierce). The insoluble fraction was washed in wash buffer and incubated in Y-PER® Plus reagent overnight. After being washed in H2O, the pellet was weighed and resuspended in 1 ml H2O. 100 μl of this suspension were added to 5 ml of ULTIMA GOLD XR LCS-Mixture, and this sample underwent scintillation counting. The relative activities were determined via normalization to respective pellet masses. The data shown are the result of five independent experiments.
Microarray Analysis
The array was constructed by spotting a 15 μm solution of 5′ amino-C6-modified oligonucleotides in 50 mm sodium phosphate pH 8.5 with a length of 70 bases on CodeLink microarray slides (SurModics, Eden Prairie, MN) using a MicroGrid II microarray spotter (Zinsser Analytic, Frankfurt, Germany). Each spot contains around 1.5 fmol of oligonucleotide. Oligonucleotides were covalently coupled to the slide surface and blocked using ethanolamine according to the instructions of the supplier. The array consisted of 6388 probes, as provided by the Array-Ready Oligo Set V1.1 for S. cerevisiae (Eurofins, Ebersberg, Germany).
RNA Isolation, cDNA Labeling, and Hybridization
Yeast cultures were grown in 1l minimal medium (YNB) at 30 °C to midlog phase. Total RNA was isolated following the protocol described by Schmitt and colleagues (40). For the preparation of fluorescently labeled cDNA, 25 μg of total RNA were treated according to the instructions for the CyScribe First-Strand cDNA Labeling Kit (GE Healthcare, Munich, Germany). Primer annealing was carried out with random nonamers and anchored oligo(dT), and for the extension reaction, Cy3 or Cy5 labeled dCTP (GE Healthcare) was used. Labeled cDNA was purified according to the CyScribe GFX Purification Kit (GE Healthcare). Before hybridization, samples were denatured at 98 °C for 5 min. The hybridization was carried out in Tom Freeman hybridization buffer (41) for 15 h at 58 °C with cDNA containing ∼60 pmol of Cy3 and Cy5 in an automatic Lucidea slide processor (GE Healthcare). Slides were washed with two consecutive washes with 1x SSC buffer containing 0.2% SDS and with 0.1x SSC. Finally, the hybridization chambers were flushed with isopropanol, and the slides were dried via evaporation. Scanning was done using a GenePix 4000B microarray scanner (Molecular Devices, Sunnyvale, CA) with the GenePix Pro 6.0 software.
Data Analysis
To normalize the data, the arithmetic mean of the ratios was set equal to 1 (GenePix Pro 6.0 software). Only features with fluorescence greater than the local background plus one standard deviation were included in the analysis. To correct for features with irregular spot morphology, we included only those differing by less than 30% in the ratio of medians, the ratio of means, and a regression ratio. The presented transcriptional data are the result of three biologically independent experiments. For each biological replicate, two technical replications and dye-swaps were analyzed. Genes were considered significantly up- or down-regulated if the logarithmic (to the basis of two) expression ratio of medians was ≥0.59 or ≤−0.59 for a gene in all three biological replicates, corresponding to a transcriptional change of at least 1.5-fold. Additionally, the statistical error could not exceed 5%. Microarray data were deposited in the NCBI Gene Expression Omnibus database (Accession number GSE 34286, http://www.ncbi.nlm.nih.gov/geo/query/acc.cgi?token = bjuntwckiqiiyfw&acc = GSE%2034286).
Spot Growth Assays
Yeast cell main cultures were grown to midlog phase, adjusted to OD600 = 0.1, and serially 10-fold diluted up to 1:10,000. 10 or 20 μl of each dilution were spotted onto yeast extract–peptone dextrose (YEPD) or YNB plates, respectively, containing 2% agar and the denoted supplements. YNB plates containing 30 μm of the iron (II) chelator bathophenanthrolinedisulfonic acid (BPS) were used to determine the sensitivity to iron limitation. The control plates contained 100 μm (NH4)2Fe(SO4)2. Cell wall integrity was scored on YEPD medium containing 125 μg/ml congo red. Aerobic growth was determined on yeast extract peptone medium containing 2% glucose or 2% ethanol (EtOH) as a carbon source.
Adhesive Growth Test
Strains were grown on solid (2% agar) YNB medium containing respective supplements and 10 mm histidine analog 3-amino-1,2,4-triazole (3AT) to induce amino acid starvation. After 3 days of incubation at 30 °C, the plates were washed under a gentle stream of water.
Growth Inhibition Assay/Halo Assay
Yeast cells were grown to OD600 = 0.6. 100 μl of the cell suspension was transferred to 10 ml 0.5% liquid agar (40 °C). The agar was poured onto MV plates (1.45 g/l YNB, 5.52 g/l ammonium sulfate, 10% succinic acid, 8.5 g/l KOH, adjust pH to 7.2), and filter papers (ø 6 mm) soaked with 2 μl or 4 μl 1 m DETA-NONOate (BIOZOL Diagnostica Vertrieb GmbH, Eching, Germany) were immediately placed onto the agar surface. Plates were photographed after 2 days of incubation at 30 °C.
Growth Conditions for Glucose-dependent Colony Morphology Alterations
Yeast cells were grown to midlog phase and diluted to 2 × 10³ cells/ml. 150 μl of the cell suspension were plated onto YEPD medium with 0.4% or 2% glucose, and the plates were incubated at 30 °C for 3 days before examination of the colonies.
Assay to Score for Respiratory Activity
Yeast cells were grown to midlog phase and diluted to 2 × 10³ cells/ml. 150 μl of the cell suspension were plated onto minimal medium (YNB) with 0.4% glucose to establish preferential conditions for respiration. The plates were incubated at 30 °C for 3 days. To determine the respiratory activity, 10 ml of triphenyltetrazolium chloride (TTC) agar (1.2% agar and 0.5% TTC) were overlaid, and red and white colonies were photographed after 20 min of incubation at 30 °C. Red colonies indicate the reduction of TTC, which requires the activity of the respiratory chain, whereas colonies impaired in their respiratory chain remain white (42).
Determination of Glucose Consumption and Ethanol Production
Cell main cultures were grown in YNB medium at 30 °C to OD600 = 0.5. Thereafter, samples of 500 μl were taken every hour for 8 h. Additionally, the cell density was determined at the respective time points. Proteins were precipitated with 0.4 ml 0.33 m perchloric acid and chilled. After neutralization with 0.1 ml 1.25 m NaOH, the proteins were sedimented via centrifugation at 12,000 rpm for 5 min. The supernatants were diluted 1:10 with H2O prior to the determination of ethanol or glucose concentrations. To determine the ethanol production, 100 μl of the diluted supernatant, 100 μl standard (2 mm EtOH), and 100 μl YNB (blank) were added to 3 ml E-buffer (26.7 g pyrophosphate, 6.7 g semicarbazide, 1.26 g glycine, 800 ml H2O), 100 μl 13 mm NAD, and 100 μl 13.84kU ADH from S. cerevisiae, respectively. The solution was incubated at 37 °C for 25 min before the optical density was measured at 363 nm. Standard and blank values served for quantification and normalization, respectively. For the determination of glucose consumption, the glucose concentration in the medium was measured. 50 μl of the diluted supernatant, 50 μl standard (5 mm glucose), and 50 μl H2O (blank) were added to 1 ml glucose test solution (Glucose-Hexokinase kit, DiaSys Diagnostic Systems GmbH, Holzheim, Germany). OD363 was measured after 15 min of incubation at room temperature. Glucose concentrations were determined according to standard and blank values.
β-galactosidase Assay
Assays were performed with extracts grown in liquid minimal medium. 10 ml pre-cultures were grown overnight at 30 °C, and 1 ml was used to inoculate 10 ml main cultures. Cells were harvested after 6 h of growth at 30 °C. Protein extracts were obtained via lysing with glass beads in breaking buffer (100 mm Tris pH 8.0, 20% glycerol). Specific β-galactosidase activities were normalized to the total protein amount (43) in each extract and calculated in accordance with the work of Rose and Botstein (44) ((A415 × 0.3)/(0.0045 × protein concentration × extract volume × time)). The values obtained for the inserted 5′UTR sequences were related to the values obtained for the empty testing vector for wild type and Δasc1 strain, respectively.
Western Hybridization Analysis
Cell cultures were grown at 30 °C to midlog phase (OD600 = 0.8). Harvested cells were washed in ice-cold buffer b (100 mm Tris-HCl pH 7.5, 200 mm NaCl, 20% glycerol, 5 mm EDTA) and lysed with glass beads in 500 μl of buffer b+ (1x complete Protease Inhibitor Mixture, 0.5% β-mercaptoethanol), and protein extracts were obtained via centrifugation at 13,000 rpm for 15 min. Protein concentrations were determined in accordance with the work of Bradford (43). Proteins were denatured in SDS loading dye at 65 °C for 15 min and subjected to SDS-PAGE followed by blotting onto nitrocellulose membrane. The membranes were incubated with polyclonal goat anti-Rap1 (yN-18, Santa Cruz Biotechnology, Heidelberg, Germany), monoclonal mouse anti-myc (#2276, Cell Signaling Technology, Inc., Danvers, MA), polyclonal rabbit anti-Asc1, polyclonal rabbit anti-eIF2α, or polyclonal rabbit anti-Tec1 antibodies. Subsequently, the membranes were incubated with peroxidase-coupled donkey anti-goat (#sc-2020, Santa Cruz Biotechnology), goat anti-rabbit (#G21234, MoBiTec, Göttingen, Germany), or goat anti-mouse (#115–035-003, Dianova, Hamburg, Germany) secondary antibodies. Proteins were visualized using ECL technology (Amersham Biosciences, Munich, Germany) or FUSION-SL-4 (PEQLAB Biotechnology GmbH, Erlangen, Germany). The quantification was carried out using BIO-1D Software (PEQLAB Biotechnology GmbH).
RESULTS
De Novo Proteome Analysis: Hypoxic Energy Metabolism in Δasc1 Cells
Given Asc1p's potential impact on translation as ribosomal Gβ-like protein, the deletion of its encoding gene is expected to result in decisive changes in cellular gene and protein expression. We compared the proteomes of Δasc1 and an isogenic wild type S. cerevisiae strain to assess those changes and identify affected proteins and processes. The incubation with Met-[35S]-isotope enables the visualization of the de novo protein biosynthesis in each cell population of 1 h (supplemental Fig. S1). Subsequent cell lysis with Y-PER® Plus reagent resulted in two separate radioactive fractions: the soluble protein extracts, used for two-dimensional PAGE analysis, and the insoluble remains (supplemental Fig. S1). In order to determine qualitative differences in the de novo protein biosynthesis rates of wild type and Δasc1 mutant, both fractions were analyzed by means of scintillation counting to detect the respective amounts of incorporated radioactive methionine (Fig. 1). The soluble fraction represents a measure for the de novo biosynthesis of soluble proteins, whereas the insoluble fraction corresponds to newly synthesized insoluble proteins (e.g. cell wall or plasma membrane proteins) (45). Relative to the wild type, the Δasc1 mutant showed elevated de novo biosynthesis of soluble proteins. The measured activities for the deletion strain were about 50% higher than for the wild type. For the insoluble fraction, in contrast, activities were reduced by nearly a quarter in the Δasc1 strain. This converse effect on the de novo biosynthesis of soluble and insoluble proteins indicates a supporting function of Asc1p in cell wall and/or membrane biogenesis.
Fig. 1.
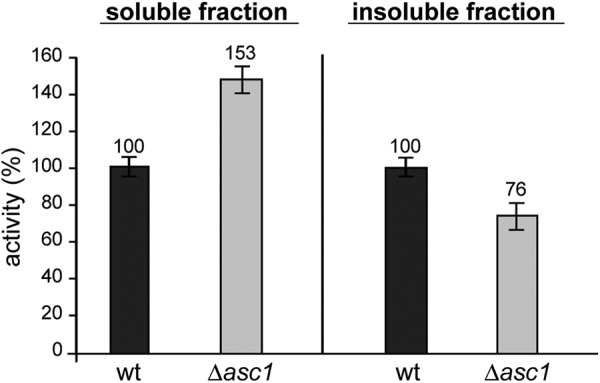
Scintillation counting for the soluble and insoluble cell fractions of wild type and Δasc1 strains. The relative activities of protein-incorporated radioactive [35S]methionine were determined. The activity for the soluble fraction was normalized against the total protein content of the respective extract as determined via BCA protein assay, whereas the activity of the insoluble fraction was normalized against the weight of the respective pellet.
This finding is affirmed by the results of the de novo proteome analysis. Although insoluble cell wall proteins generally do not appear in two-dimensional proteome analyses of the soluble fraction, some proteins involved in cell wall biogenesis and overall cell morphology were found to be significantly reduced in Δasc1 cells (Fig. 2A). Pdi1p and Mlc1p are essential for viability and appear to be positively controlled by Asc1p. Pdi1p is a protein disulfide isomerase required for the formation of disulfide bonds in secretory and cell surface proteins. Mlc1p localizes to the bud neck and is involved in actin ring formation, promoting targeted membrane deposition at the bud neck during cytokinesis. In contrast, the protein levels of the guanylate kinase Guk1p, required for mannose outer chain elongation of cell wall N-linked glycoproteins, were increased 7-fold in the mutant strain.
Fig. 2.

Proteins identified as being regulated in Δasc1 cells. A, proteome analysis. Regulated proteins were classified according to their cellular function or localization. The regulation for each protein is given as the average relative spot intensity (spot intensity (Δasc1)/spot intensity (wild type)). The percent distribution of proteins in the functional groups is illustrated in a pie chart relative to the number of total proteins found to be regulated. The composed group of energy metabolism is accentuated. B, close-up views of selected protein-spots regulated in Δasc1 cells. Protein names are given according to mass spectrometric identifications. The corresponding proteins belong to the joined group of energy metabolism making up 46% of all regulated proteins. For each of the proteins, its average regulation is displayed relative to that of the wild type (Ø (Δasc1/wild type)).
By far the largest group, consisting of almost 50% of all proteins found to be regulated in Δasc1 cells, is made up of proteins involved in energy metabolism (Fig. 2A). This comprehensive group is composed of proteins taking part in glycolysis, mitochondrial biogenesis and respiration, oxidative stress, and fermentation. Representative protein-spots for each group are illustrated in Fig. 2B.
The six proteins involved in glycolysis span nearly the entire glycolytic process. Cdc19p, Fba1p, Pgi1p, and Tpi1p were down-regulated in Δasc1 cells, but Eno1/2p and Gpm1p were found to be increased. A negative genetic interaction was previously established between ASC1 and GCR2, coding for a transcriptional activator of genes involved in glycolysis (7). Glycolysis is directly connected to the energy restoring and generating processes in the cell via the delivery of substrates for either respiration in the mitochondria or fermentation in the cytosol.
For the four proteins assigned to the group of mitochondria and respiration, a similar differential expression was found. The d-lactate dehydrogenase Dld2p resides in the mitochondrial matrix. Its biosynthesis was reduced in the Δasc1 strain and for Rdl1p, a protein of the outer mitochondrial membrane. Ssc1p and Yhb1p showed 4.5-fold and 2.3-fold increases, respectively. Ssc1p is an essential constituent of the import motor component of the translocase of the inner mitochondrial membrane (TIM23 complex). The yeast flavohemoglobin Yhb1p acts as nitric oxide (NO) oxidoreductase required for NO detoxification (46). NO is believed to lead to the inhibition of mitochondrial respiration and enhance the production of reactive oxygen species (ROS) (47), which are increasingly produced during compromised cellular respiration and cause oxidative damage within the cell (48). In this analysis, four proteins were assigned to the “oxidative stress” group. The nitroreductase-like protein Hbn1p has been described as important for superoxide dismutase activity (49). Whereas the other three proteins involved in oxidative stress response-namely, Ahp1p, Hor2p/Rhr2p, and Tsa1p-showed reduced expression, Hbn1p biosynthesis was increased 8-fold in the Δasc1 strain.
In the context of energy metabolism, it is especially striking that all five proteins assigned to the process of fermentation were uniformly increased at least 2-fold in the absence of Asc1p. This group includes, among others, the alcohol dehydrogenase Adh1p and the pyruvate decarboxylases Pdc1p and Pdc5p, which are key enzymes of alcoholic fermentation in yeast.
Taken together, the majority of processes found to be affected in the Δasc1 strain are involved in energy metabolism. Additionally, a strong down-regulation of proteins taking part in cell wall biogenesis and maintenance could be observed. According to scintillation counting, the de novo biosynthesis of insoluble proteins was reduced by 25% in Δasc1 cells. Furthermore, significant changes in the expression of several proteins involved in the maintenance of cell morphology were revealed in the Δasc1 strain. Proteins involved in energy metabolism, including glycolysis, mitochondria biogenesis and respiration, oxidative stress, and fermentation, amount to almost half of all regulated proteins. In particular, proteins involved in fermentation showed a distinct increase in response to the deletion of ASC1, suggesting elevated fermentation in Δasc1 cells.
Transcriptome Analysis: Asc1p Is Involved in Several Cellular Signaling Pathways
The microarray analyses revealed 80 genes that were considered differentially expressed in the Δasc1 strain relative to the wild type (Fig. 3), according to stringent thresholds and experimental settings (see Experimental Procedures). Significant up-regulation was found for mRNAs identified as transposable elements. This group consists solely of retrotransposons of the Ty1 and Ty2 type. Corresponding to their common promoter, they uniformly showed up-regulation in the Δasc1 strain.
Fig. 3.

Functional classification of mRNAs regulated in Δasc1 cells. The regulation for each mRNA is given as average relative to the wild type (wt) (spot intensity (Δasc1)/spot intensity (wt)). The groups resulting from the respective function of the mRNA products are expressed as the percentage of the total number of regulated mRNAs. The complete data set is supplied in supplemental Table S3.
Additionally, the expression of many mRNAs involved in energy metabolism was affected in the Δasc1 strain. They are presented in the groups of glucose transporters, mitochondria/respiration, and oxidative stress (Fig. 3). The affected mRNAs of the first group code for the low-affinity transporter Hxt3p and the two almost identical high-affinity transporters Hxt6p and Hxt7p. All three corresponding proteins reside in the plasma membrane and showed significant down-regulation in their mRNA level in the mutant strain. Among the mRNAs assigned to the “oxidative stress” group, DDR2 and PEP4 could be found as down-regulated in Δasc1 cells. They code for proteins expressed in response to multiple stressors and oxidative-damage-induced protein turnover, respectively. Additionally, the expression of HBN1, coding for a putative nitroreductase, was 3-fold up-regulated in the mutant strain. The group of mitochondria and respiration consists of seven regulated mRNAs. MDH1, RIB4, ATP1, ATP2, and INH1 were down-regulated in the Δasc1 strain. MDH1 codes for the mitochondrial malate dehydrogenase of the tricarboxylic acid cycle. Rib4p is required for riboflavin synthesis, which is a precursor of the flavin coenzymes flavin adenine dinucleotide (FAD) and flavin mononucleotide. As a non-covalently bound part of the NADH:ubiquinone oxidoreductase Ndi1p, FAD is involved in electron transfer from the tricarboxylic acid cycle to ubiquinone in the electron transport chain at the inner mitochondrial membrane (50, 51). ATP1 and ATP2 code for the α and β subunits, respectively, of the F1 sector of the mitochondrial F1F0 ATPase synthase. ATPase synthase activity is required for the synthesis of ATP, which is inhibited by Inh1p. Additionally, IRC18 was found to be up-regulated, a known indicator for respiratory deficiency (52). The transcription of YHB1, encoding for NO oxidoreductase, was increased in the mutant strain.
Another group of special interest in the context of energy metabolism consists of genes encoding proteins involved in iron homeostasis, as iron is directly involved in respiration via heme-biosynthesis and iron–sulfur cluster formation (53). All proteins corresponding to the mRNAs in this group have their function in the uptake of iron, except for Tis11p, which is an mRNA-binding protein promoting mRNA degradation under iron starvation. FRE1 codes for the major cell-surface iron reductase, reducing iron prior to its uptake. Ccc2p is required for the translocation of the Fet3p/Ftr1p complex to the plasma membrane, which mediates high-affinity iron uptake. Enb1p, Sit1p, and Arn1p are directly linked to iron uptake as members of the Arn family of siderophore iron transporters. Except for Ccc2p, all corresponding proteins involved in iron uptake showed down-regulation in their mRNA level in the Δasc1 mutant strain and reside in the plasma membrane. The negative influence on the transcription of genes coding for membrane proteins in Δasc1 cells suggested by the mRNAs associated with iron uptake and glucose transport further becomes apparent in the group of cell wall/morphology. CWP2, coding for a major constituent of the cell wall, as well as HOR7, HPF1, and SCW4, coding for additional cell wall components, were clearly down-regulated in Δasc1 cells. Additionally, PSA1, coding for an essential protein required for a normal cell wall structure, was found to be down-regulated in the mutant strain. Furthermore, the two mRNAs up-regulated in this group—namely, UTR2 and WSC3—are described as being induced under cell wall stress. The integral membrane protein Wsc3p acts as sensor-transducer of the Pkc1p-MAPK cell wall integrity pathway (54, 55).
According to the presented transcriptome data, transposition seems to be a process up-regulated in the Δasc1 mutant strain. Additionally, Asc1p takes part in the regulation of iron homeostasis and herein seems to be specifically required for the uptake of iron. This is supported by an elevated sensitivity of the Δasc1 strain to the iron (II) chelator BPS relative to the wild type, suggesting that the absence of Asc1p leads to lower iron concentrations within the cell (Fig. 4).
Fig. 4.

Sensitivity to iron limitation. Serial 10-fold dilutions of wild type and Δasc1 cells were plated on YNB medium containing 30 μm of the iron (II) chelator bathophenanthrolinedisulfonic acid (BPS) or 100 μm (NH4)2Fe(SO4)2 as a control. Plates were incubated at 30 °C for 5 days.
The transcriptional changes further indicate a distinctive role for Asc1p in cell wall integrity. Furthermore, processes involved in energy metabolism, represented by the regulated groups of glucose transporters, mitochondria/respiration, and oxidative stress, are affected by the deletion of ASC1. Especially the particular regulation of mRNAs involved in respiration suggests the significance of Asc1p in the processes of oxygen and energy metabolism. The transcriptome analysis corroborates the previous indication obtained via proteome analysis that Asc1p has a distinct impact on energy metabolism (Fig. 2A). The cumulative data obtained via proteome and microarray analyses reveal that several distinct biological processes are affected by Asc1p and suggest its involvement in various cellular signaling pathways.
The Δasc1 Strain Shows Enhanced Sensitivity to Nitrosative Stress
Two especially interesting candidates found to be regulated in both the cellular proteome and the transcriptome are HBN1/Hbn1p, assigned to the group of mitochondria and respiration, and YHB1/Yhb1p, assigned to the group of oxidative stress. Both rank among the most significantly up-regulated candidates in both data sets. Their protein abundances, determined by means of Western hybridization, emphasize the significant impact of Asc1p on their expression (Fig. 5A). The total protein amounts of Hbn1p and Yhb1p showed up-regulation in the Δasc1 strain by 8- and 4-fold, respectively. Because of these strong effects and the involvement of Hbn1p and Yhb1p in protection against reactive nitrogen oxide species (RNOS), the sensitivity of the Δasc1 strain, as well as that of the Δhbn1, Δyhb1, respective double deletion strains and the triple mutant Δasc1Δhbn1Δyhb1, to the NO-donor (Z)-1-[N-(2-aminoethyl)-N-(2-ammonioethyl)amino]diazen-1-ium-1,2-diolate (DETA-NONOate) was tested via agar diffusion assay (Fig. 5B). The Δasc1 strain and the Δhbn1 and Δyhb1 strains showed larger areas of no growth (halos) than the wild type strain, indicating increased intracellular nitrosative stress in the mutant strains and/or impaired RNOS detoxification. The Δasc1 cells were slightly more sensitive to NO when they were additionally lacking either Yhb1p or Hbn1p, as was also observed for the Δhbn1Δyhb1 double mutant. The triple deletion strain Δasc1Δhbn1Δyhb1 seemed to be more sensitive to DETA-NONOate, which might be attributed to its strong general growth defect (Fig. 5C). This observation implies a genetic interaction of ASC1 with both YHB1 and HBN1. It further suggests that the up-regulation of Yhb1p and Hbn1p in the Δasc1 strain is a protective response to an increased nitrosative burden, possibly intrinsically generated in the mutant strain. Additionally, the asc1SNR24 strain, deficient in Asc1p but still expressing the snoRNA U24, encoded by the intron of the ASC1 locus, was analyzed. The displayed sensitivity to DETA-NONOate and its general growth phenotype correspond to the results obtained for the total ASC1 deletion strain Δasc1, showing that NO sensitivity is an Asc1p-, and not a U24-, dependent phenotype.
Fig. 5.

Evaluation regarding nitrosative stress. A, immuno-detection for candidates significantly regulated on the mRNA and protein levels in Δasc1 cells. myc3-tagged variants of Hbn1p and Yhb1p were detected by anti-myc antibody. eIF2α signals display an internal loading control and served for normalization of Hbn1p and Yhb1p signals. The results are illustrated relative to wild type in the adjacent graphs. B, agar diffusion/halo assay to determine sensitivity toward the nitric oxide donor DETA-NONOate. Cells were plated on MV plates (pH = 7.2) embedded in liquid top agar, and this was followed by the application of filter papers containing 2 μl or 4 μl DETA-NONOate (1 m). Respective halo sizes were measured after 2 days of growth at 30 °C. The graph shows the resistance of the deletion strains relative to the wild type, determined by the reciprocal values of the halo diameters. C, spot assay to score total growth. Growth of 10-fold diluted cell suspension identical to cultures used in halo assays was monitored on MV plates (pH = 7.2).
Cell Wall Integrity is Compromised in Δasc1 Cells
Because of the indications of compromised cell wall integrity in Δasc1 cells, we performed growth assays on medium supplemented with the chitin-interacting reagent congo red (56). The Δasc1 strain showed significantly enhanced sensitivity to congo red relative to the wild type (Fig. 6A). This is further evidence of a controlling function of Asc1p in the maintenance of cell wall integrity, as has been indicated by the global expression data. The role of Asc1p in cell wall integrity is further displayed by the differences in colony morphology of the Δasc1 mutant and the wild type strain under reduced glucose concentrations (0.4%) (Fig. 6B). Wild type colonies formed a distinct loopy structure when grown with a reduced glucose supply, as has been described previously for yeast mat formation (57). This effect is linked to the expression of the cell surface glycoprotein Flo11p and is therefore absent in a Δflo11 strain. Similar to the Δflo11 strain, Δasc1 colonies also lacked the structure formation displayed by the wild type strain and merely displayed a slightly smaller colony size (Fig. 6B). This effect might be attributed to the significantly impaired ability of the Δasc1 strain to express the cell wall gene FLO11, indicated by the lack of adhesion under glucose or amino acid limitations (10) (Fig. 6C). The results for the ASC1 mutant strain asc1SNR24 confirm that the observed phenotypes are a consequence of the absence of Asc1p in the Δasc1 strain, and not of the snoRNA U24.
Fig. 6.

Investigation of cell wall integrity. A, growth assays. Cells were serially 10-fold diluted and spotted on YEPD plates with and without 125 μg/ml congo red. Growth was documented after 3 days of incubation at 30 °C. B, colony morphology alterations under glucose limitation. Wild type (wt) cells, as well as Δasc1, asc1SNR24, and Δflo11 mutant cells, were plated on YEPD medium containing 2% (no limitation) or 0.4% glucose (glucose limitation). Colonies were investigated via binocular after 3 days of incubation at 30 °C. C, asc1p-dependent adhesive growth under amino acid starvation. Strains RH2817 (wt), RH3263 (Δasc1), RH3510 (asc1SNR24), RH2681 (Δflo11), and RH3220 (Δsfl1; Sfl1p is a transcriptional repressor of FLO11) were patched on solid YNB medium supplemented with 10 mm 3AT. After 3 days of incubation at 30 °C, plates were photographed before and after washing. Non-adhesive strains were washed off the agar surface.
Respiration is Restrained in Δasc1 Cells
The presented proteome and transcriptome analyses suggest that Asc1p promotes respiration, whereas its absence induces fermentation. To confirm this influence of Asc1p on energy metabolism, the glucose consumption and ethanol production of wild type and Δasc1 cultures were monitored over a period of 8 h (Fig. 7A). The data show that Δasc1 cells consume increasingly more glucose than wild type cells. This suggests elevated fermentation rates in the Δasc1 mutant strain, as more glucose is required for fermentation to obtain the same energy yield as respiration. Elevated ethanol production by the Δasc1 strain further supports a shift of energy metabolism from respiration toward fermentation in the mutant cells (Fig. 7A). The specific dependence of the respiratory chain on Asc1p was scored via TTC assay (Fig. 7B). TTC functions as an electron acceptor and is reduced in the course of electron transfer within the respiratory chain, leading to the production of red formazan when colonies are actively respiring (42). Under the given growth conditions, nearly all of the wild type colonies were actively respiring, as indicated by their red pigmentation, whereas colonies without Asc1p remained white. This drastic reduction in respiratory activity illustrates a significant impairment in the respiratory chain as consequence of the deletion of ASC1. To further assess the respiratory capability of the Δasc1 strain, a growth assay of wild type and Δasc1 cells on agar plates, containing either a fermentable (2% glucose) or a non-fermentable (2% EtOH) carbon source, was conducted (Fig. 7C). The results show that colony growth was rather similar in the wild type and Δasc1 strains when glucose was readily available as a carbon source. However, when the cells were forced to respire during growth on EtOH as a non-fermentable carbon source, Δasc1 cells showed significantly reduced colony growth. The colonies of both strains further demonstrated altered morphology and reduced colony size, and Δasc1 colonies exhibited a significantly stronger phenotype than wild type colonies. Δasc1 colony size was halved with the growth on EtOH as a carbon source and was only 40% of the wild type colony size on EtOH. This “petite” phenotype is an additional indicator of restrained respiration in the Δasc1 strain (58). The ASC1 mutant strains Δasc1 and asc1SNR24 displayed corresponding results for the TTC and growth assays.
Fig. 7.

Evaluation of respiratory and fermentative activity in Δasc1 cells. A, comparative analysis of glucose consumption and ethanol production in wild type and Δasc1 cells. Wild type and Δasc1 cells were grown to OD600 = 0.5 before the first sample drawing (t = 0). Over a period of 8 h, samples were drawn at the given time points to determine glucose or ethanol concentrations in the medium. Additionally, the cell density was determined. The data were obtained in three biologically independent analyses. The glucose concentration in the medium was measured and the glucose consumption (Δc) was determined for wild type and Δasc1 relative to the cell density (OD600) at the given time points (Δc (nm glucose)/OD600). Δc is defined as the difference in glucose concentration from the first sample drawing (t = 0) to the concentration at the given time points. The ethanol concentration was determined in wild type and Δasc1 cell cultures at the given time points and related to the respective cell density (Δc (nm ethanol)/OD600). The illustrated graph displays the average ethanol production relative to the cell density at t = x (min). B, assay to determine respiratory activity in wild type and Δasc1 cells. Colonies were grown on YNB under limited glucose conditions (0.4% glucose) for 3 days and subsequently overlaid with 1.2% agar containing 0.5% triphenyltetrazolium chloride (TTC). Colonies were photographed after 20 min of incubation with TTC at 30 °C. C, growth assay to evaluate respiratory colony growth. Cells were spotted in serial 10-fold dilutions on plates containing a fermentable (2% glucose) or non-fermentable (2% EtOH) carbon source. After incubation at 30 °C for 3 days, colony diameters were determined via binocular. The results are displayed relative to the wild type in the adjacent graphs.
Taken together, the data demonstrate the requirement of Asc1p for full respiratory chain activity, as respiration is significantly reduced in Δasc1 cells. In contrast, fermentation seems to be up-regulated in Δasc1 cells, possibly as a secondary effect to compensate for the reduced respiratory activity when Asc1p is absent.
Asc1p Post-transcriptionally Regulates Transcription Factor Abundances
The data presented so far illustrate that Asc1p influences different cellular processes that are controlled by various signaling pathways and, ultimately, by specific transcription factors. Changes in their availability depict an efficient and rapid way of globally adjusting gene expression. In order to identify Asc1p-regulated transcription factors, the downstream effectors causing the changes apparent on the protein- and mRNA-levels, as well as the phenotypical observations noted for the Δasc1 strain, were analyzed.
The transcriptome data generated for the Δasc1 strain served as a starting point for determining candidate-transcription factors possibly regulated by Asc1p. The entity of genes/mRNAs that were found to be regulated in the Δasc1 strain was submitted to the online program YEASTRACT (May 2010) to identify the transcription factors that are known to bind to their promoters (59, 60). Respective transcription factors are displayed in Table III. The transcription factors binding most of the genes are Ste12p, Phd1p, Tec1p, and Rap1p, each interacting with over 20% of the genes regulated in the Δasc1 strain. Furthermore, these transcription factors all bind to the promoter of FLO11, whose expression cannot be effectively induced in the Δasc1 strain (10).
Table III. Major transcription factors inducing changes in the Δasc1 transcriptome.
| Transcription factor | Regulated Genes (%) | Δasc1 | mRNAs regulated by transcription factor |
|---|---|---|---|
| Ste12 | 40.0 | Up | YCL021W-A, AHA1, YDR316W-B, UTR2, YER138W-A, YHB1, YHR177W, ARG3, BNA2, YJR079W, SRL3, YMR045C, WSC3, THI80, SFG1, YOR343W-A, YOR343W-B |
| Down | ATP1, PMP1, PSA1, HXT7, HXT6, HXT3, SCW4, ARN1, YIL169c, URA2, CWP2, TMA10, HOR7, DDR2, HPF1 | ||
| Phd1 | 23.8 | Up | SFG1, UTR2 |
| Down | PSA1, INH1, YDR134C, CPR1, HXT7, HXT6, HXT3, SIT1, SCW4, ARN1, YIL169C, CWP2, TIS11, FRE1, TMA10, HOR7, DDR2 | ||
| Tec1 | 22.5 | Up | YBR012W-B, YCL021W-A, YDR316W-B, UTR2, YER138W-A, YHB1, SRL3, WSC3, SFG1 |
| Down | ATP1, PSA1, HXT7, HXT6, HXT3, URA2, CWP2, HOR7, DDR2 | ||
| Rap1 | 22.5 | Up | KTI11, UTR2, YHB1, YHR177W, ARG3, SFG1 |
| Down | PMP1, PSA1, CWP2, FRE1, TMA10, ASC1, DDR2, ENB1, ALD4, EEB1, HXT6, SCW3 | ||
| Sok2 | 20.0 | Up | UTR2, YHR177W, SFG1 |
| Down | PMP1, PSA1, YDR134C, HXT7, HXT6, HXT3, SIT1, SCW4, YIL169C, CWP2, HOR7, DDR2, EEB1 | ||
| Skn7 | 17.5 | Up | BNA2, YJR079W, SFG1, YOR343W-A, YOR343W-B, YPR158C-D |
| Down | ATP1, CPR1, SCW4, BNA2, YJR079W, CWP2, FRE1, HOR7, DDR2, HPF1 | ||
| Flo8 | 15.0 | Up | UTR2, SFG1 |
| Down | PSA1, YDR134C, HXT3, SCW4, ARN1, YIL169C, CWP2, FET3, HOR7, DDR2 | ||
| Fhl1 | 15.0 | Up | KTI11, AHA1, BNA2 |
| Down | PSA1, YDR133C, YDR134C, CPR1, CWP2, TMA10, FET3, ASC1, HOR7 | ||
| Pho4 | 13.8 | Up | WWM1, YHB1 |
| Down | INH1, CPR1, HXT7, HXT6, YIL169C, MDH1, TIS11, HOR7, HPF1 | ||
| 1Swi4 | 13.8 | Up | UTR2, YHB1, YOL114C, SFG1, YPR158C-D |
| Down | PSA1, YDR134c, HXT3, SCW4, CWP2, HPF1 | ||
The list of regulated genes was submitted to YEASTRACT (59, 60) to determine the respective transcription factors. The search criteria were set to consider only direct evidence for transcription factor binding. The ten top transcription factors are listed according to the number of genes regulated by them. This number is given as a percentage relative to the total number of genes in the list. The target genes for each transcription factor are separated according to the up- or down-regulation of their respective mRNAs in the Δasc1 strain.
We analyzed whether the protein abundances for these transcription factors are affected by the absence of Asc1p by conducting comparative Western hybridizations in the ASC1 mutant strains Δasc1 and asc1SNR24 and in the wild type (Fig. 8A). Additionally, the protein abundance of the transcription factor Flo8p, found at position seven on the ranking list, was analyzed because this factor is known to be crucial for FLO11 expression (61). All five transcription factors showed significant changes in abundance in response to the absence of Asc1p (Fig. 8A). Rap1p was down-regulated by 2- to 3-fold in the asc1SNR24 and Δasc1 strains, respectively. Protein levels of Tec1p, Phd1p, and Flo8p were also significantly reduced to 10% to 30% of wild type levels in the absence of Asc1p. Ste12p showed an opposite behavior and was up-regulated at rates 6- and 9-fold greater in the Δasc1 and asc1SNR24 strains, respectively. The significance of the difference in protein levels between wild type and Asc1p-deficient strains suggests that the analyzed transcription factors are indeed involved in the induction of the majority of proteome and transcriptome changes in the Δasc1 strain, as well as in its described phenotypical characteristics. Thus, these global changes can be, at least partially, considered as a consequence of the function of Asc1p in regulating the abundances of the mentioned transcription factors.
Fig. 8.

Regulation of transcription factor abundance in wild type and Δasc1 strains. A, Western hybridization for transcription factors in the wild type and Asc1p-deficient backgrounds Δasc1 and asc1SNR24. Tec1p and Rap1p were detected by protein-specific antibodies. The myc3-tagged variants of Ste12p, Phd1p, and Flo8p were detected with anti-myc antibody. Signals were quantified and normalized against eIF2α levels detected by anti-eIF2α antibody. The adjacent graphs illustrate the fold changes relative to wild type signal intensities. B, 5′UTR-mediated translational regulation in wild type and Δasc1 cells. Wild type and Δasc1 strains were transformed with the testing vector (TV) with or without specified transcription factor 5′UTRs. The changes in β-galactosidase activity upon the introduction of the respective 5′UTRs are illustrated relative to the basal β-galactosidase activity measured for the empty TV without 5′UTR in the wild type and Δasc1 mutant.
Interestingly, our transcriptome data (supplemental Table S3) and quantitative real-time PCR (supplemental Fig. S4 and data not shown) did not indicate an alteration in the mRNA levels of Ste12p, Tec1p, Rap1p, Phd1p, or Flo8p for the Δasc1 mutant. This implies that Asc1p does not alter the abundance of these transcription factors through transcription, but rather influences these proteins post-transcriptionally.
Asc1p Controls the Translation of the Transcription Factor mRNAs of Ste12p, Phd1p, and Tec1p through Their Respective mRNA-5′UTRs
According to our data, the transcription of STE12, PHD1, TEC1, RAP1, or FLO8 genes themselves is not affected in Δasc1 cells, whereas the determined protein abundances of the corresponding transcription factors changed significantly from wild type levels in the absence of Asc1p (Fig. 8A), indicating their post-transcriptional regulation. Given the involvement of RACK1/Asc1p in mRNA translation, and specifically in the initiation process (9, 62), we assessed the influence of the respective mRNA-5′UTRs of these candidates on translation initiation in wild type and Δasc1 background via lacZ-reporter assay (35). The basal lacZ-expression for the wild type and Δasc1 strain is expressed by the β-galactosidase activity measured for the empty testing vector without any 5′UTR-insertion (Fig. 8B). After the introduction of the STE12-5′UTR, the β-galactosidase activity in the Δasc1 mutant strain was twice as high as that in the wild type background. A significantly reduced expression in the Δasc1 strain could be observed for the 5′UTRs of the PHD1- and TEC1-mRNA. For the PHD1-5′UTR, the β-galactosidase activity stayed at basal levels in the Δasc1 mutant strain, whereas it nearly doubled in the wild type. The insertion of the TEC1-5′UTR led to the highest induction of activities in both strains, whereas β-galactosidase activities in the Δasc1 strain amounted to only 50% of wild type levels.
For the mRNAs of STE12, PHD1, and TEC1, this strongly suggests Asc1p-dependent regulation during the initiation of translation that is mediated by the 5′UTR sequences. Further, the changes in β-galactosidase activity from the wild type to the Δasc1 strain correlate with the observed changes in protein abundance for these candidates. These data support Asc1p's role as a ribosomal regulator in the translation of STE12, PHD1, and TEC1.
DISCUSSION
Eukaryotic RACK1/Asc1p has strong effects on cellular signaling and thereby defines the developmental fate of a cell. Uncontrolled cell growth and cancer formation in metazoa have been connected to distorted RACK1 expression, designating it as a biomarker for breast carcinoma (26, 27, 63). As its deletion in higher eukaryotes, but not in yeast, is lethal at early developmental stages, the unicellular model organism S. cerevisiae was utilized here to analyze the consequences of a total ASC1 deletion on a genome-wide scale. Asc1p was found to affect diverse cellular processes, including translation, iron homeostasis, pheromone response, cell wall integrity, and energy metabolism (glycolysis, respiration, fermentation, oxidative stress). In addition to the ASC1 gene, the ASC1 locus encodes for the snoRNA U24. An ASC1 mutant strain, asc1SNR24, expressing the snoRNA U24 but not Asc1p, was generated to determine Asc1p specific effects (supplemental Fig. S2). Our data show that the phenotypes and the changes in transcription factor expression observed in the Δasc1 strain can be attributed to the absence of Asc1p.
Our analysis suggests a distinct function of Asc1p as a central ribosomal node, taking in a variety of different signals (e.g. from the Kss1p- and Pkc1p-MAPK pathways) and thereupon enabling the respective cellular reprogramming. Our detailed analyses link the Asc1p-mediated control to the initiation of translation of the transcription factors responsible for the majority of transcriptional alterations observed in the Δasc1 strain. Asc1p regulates translation initiation of the mRNAs coding for the transcription factors Ste12p, Tec1p, and Phd1p through their respective 5′UTR sequences. This finding might stem from a direct interaction of Asc1p with factors involved in translation initiation as demonstrated recently for the translation initiation factor eIF3 (62). The deletion of ASC1 results in a reduced eIF3-binding affinity toward the 40S subunit, thereby inhibiting translation initiation.
One central consequence of the deletion of ASC1 is the down-regulation of mRNAs coding for siderophore transporters and the high-affinity iron-uptake complex Fet3p/Ftr1p (Fig. 9), leading to an imbalance in iron homeostasis in Δasc1 cells. The resulting iron limitation would severely compromise biosynthetic processes of, for example, iron–sulfur-cluster-containing proteins and heme in Δasc1 cells (53). In support of this, a negative genetic interaction of ASC1 with HEM1 and ISU2, encoding proteins involved in heme biosynthesis and the synthesis of mitochondrial and cytosolic Fe–S proteins, respectively, has previously been established (7). Fe–S proteins are directly involved in the electron transport chain at the inner mitochondrial membrane, whereas heme is critical in supplying oxygen to mitochondria, where it serves as a final electron acceptor in the respiratory chain (Fig. 9). Heme deficiency results in hypoxic (low-oxygen) cellular conditions. Human RACK1 is implicated in the degradation of the hypoxia-induced transcription factor HIF-1 (64), the master regulator of hypoxic genes. HIF-1 further controls the gene expression of key players in angiogenesis, erythropoiesis, and glucose/energy metabolism (65). Yeast cells grown under oxygen limitation down-regulate Asc1p (66). This indicates that Asc1p is specifically required during aerobic respiration, as demonstrated in this study via TTC assay and the impaired growth of Δasc1 cells on EtOH as a non-fermentable carbon source. The requirement of Asc1p for respiration is further reflected by the severely reduced expression of MDH1, encoding the tricarboxylic acid cycle malate dehydrogenase, and RIB4, required for riboflavin synthesis in Δasc1 cells (Fig. 9). Electron transfer across the inner mitochondrial membrane will most likely be impaired by the prevailing compromised respiration in Δasc1 cells. In agreement, ATP1 and ATP2, coding for components of the F1F2-ATPase, are down-regulated in the deletion strain, suggesting reduced respiratory ATP production (67). Additionally, ASC1 shows a negative genetic interaction with MDJ2, involved in stimulating ATPase activity (7).
Fig. 9.

Cellular context of processes affected by Asc1p. Expression data and phenotypical observations are incorporated according to the cellular localization of the corresponding protein or process, respectively. Regulations supported by direct evidence are illustrated in red for a down-regulation in the Δasc1 strain and green for an up-regulation.
In the course of respiration, electrons can leak along the way through the inner mitochondrial membrane, leading to the production of ROS (48). Hypoxia and inhibition of the respiratory chain further increase the production of ROS such as superoxide anions and lead to the formation of RNOS (68). In Δasc1 cells, these conditions are indicated by the strong up-regulation of Hbn1p and Yhb1p in the mutant strain on the mRNA level and the protein level. Furthermore, agar diffusion assays with the NO-donor DETA-NONOate indicate that nitrosative stress is inflicted by the deletion of ASC1 and that the up-regulation of Hbn1p and Yhb1p in the Δasc1 mutant strain is required for protection against nitrosative stress. Hbn1p has previously been reported to be up-regulated upon iron deficiency (69) in order to activate superoxide dismutase (SOD) (49). Yhb1 protein levels are generally low in respiring yeast cells but strongly increase under hypoxic conditions, when the electron transfer chain is compromised and oxidative and nitrosative stress is enhanced (70–72). Accordingly, Yhb1p functions indirectly in oxidative stress response as NO reductase (46) (Fig. 9). Yhb1p consumes NO, thereby diminishing NO's inhibitory effect on mitochondrial respiration through the modification of cytochrome c oxidase (73, 74) and the consequently enhanced ROS production (47) (Fig. 9). Despite the lack of NO synthases, yeast cells produce NO by passing electrons from the cytochrome c oxidase to NO2− as an alternative final electron acceptor when cellular oxygen levels are reduced (72). NO and the superoxide anion (O2−) combine and form peroxinitrite (ONOO2), which in turn can nitrate specific protein tyrosine residues (72, 75) (Fig. 9). The experimental data in this study suggest the presence of an excessive amount of ROS, as well as of NO, in Δasc1 cells, consequently suggesting elevated ONOO2 levels and tyrosine nitration. In mammalian cells, this modification specifically activates PKCε through its increased interaction with RACK (76). Increased protein tyrosine nitration has been reported as a consequence of hypoxic growth conditions (72) and might represent a very effective mechanism by which to influence protein activities upon ROS- and NO-inducing conditions, especially in the mitochondria. A proteome study for tyrosine nitrated proteins in rat revealed nitration targets especially within the functional groups of oxidative stress, energy production, and fatty acid metabolism, as well as the Asc1p homologue RACK1 (77). Probably closely associated with cellular nitration is the function of Hbn1p through its NAD(P)H-dependent activity as putative nitroreductase and its involvement in SOD activation (49, 78).
Although the nitration of yeast Pkc1p or Asc1p has not yet been shown, the Pkc1-dependent maintenance of cell wall integrity is significantly compromised in the Δasc1 strain. This results in increased sensitivity to the cell-wall-disturbing reagents calcofluor white, zymolyase (10), and congo red. Additionally, previous studies have identified negative genetic interactions of ASC1 with several genes, both essential and non-essential for cell wall synthesis (5, 7, 79, 80). The misregulation of multiple mRNAs and proteins involved in cell wall biogenesis and morphology, as well as the reduced de novo biosynthesis of radioactively labeled proteins of the insoluble fraction in the Δasc1 strain, corroborates this result (Fig. 9). Despite these unambiguous phenotypes, several findings indicate that the corresponding cell wall integrity signaling pathway is in fact activated (supplemental Fig. S3). The mRNA for WSC3, coding for the sensor-transducer of the pathway, is up-regulated in the mutant strain. Additionally, the MAP kinase of the cell wall integrity pathway, Slt2p, physically interacts with Asc1p (6) and, more important, shows elevated phosphorylation when ASC1 is deleted (81). This discrepancy between the activation of the cell wall integrity pathway and the obvious deficiencies in cell wall integrity suggests that the MAPK pathway of cell wall integrity might be influenced downstream of its MAP kinase Slt2p in the Δasc1 mutant. Consistent with this, in our analysis, the bulk of target genes of the cell wall integrity pathway were not up-regulated and even showed down-regulation despite pathway activation when ASC1 was deleted (Fig. 3 and Table III). These data indicate that Asc1p might influence the Slt2p targeted transcription factors Rlm1p, Skn7p, and Swi4p and thereby cause the observed transcriptional changes, which is a question that needs to be addressed in the future.
A similar discrepancy, supporting a specific requirement of Asc1p for the appropriate synthesis of transcription factors, is observed in the Δasc1 strain for the signaling cascade of adhesive and pseudohyphal growth, divided between the cAMP-dependent PKA pathway and the Kss1p-MAPK pathway (supplemental Fig. S3). Both pathways are constitutively activated when ASC1 is absent, as monitored via elevated cAMP-levels and the enhanced phosphorylation of the MAP kinase Kss1p (17). The activation of the PKA pathway in wild type cells leads to the phosphorylation of the transcription factor Flo8p, inducing FLO11 and other target genes (61). Activated Kss1p mediates the transcriptional activity of the transcription factors Ste12p and Tec1p on the FLO11 promotor. In the course of activation, it phosphorylates Ste12p and its inhibitors Dig1p/Dig2p, leading to the release and activation of Ste12p (82, 83). Despite the activated FLO11-inducing pathways, FLO11 expression is shut down in Δasc1 cells, and Flo11p-dependent adhesive/pseudohyphal growth and mat formation cannot be induced (10, 57) (Figs. 6B and 6C). This again suggests a direct effect of Asc1p on the transcription factors. Consistently, the abundances of Ste12p, Tec1p, and Flo8p and the PKA and MAPK pathway-independent FLO11-promoter-binding transcription factors Phd1p and Rap1p are in part drastically altered when Asc1p is absent. Whereas the protein levels of Tec1p, Flo8p, Phd1p, and Rap1p are significantly reduced, Ste12p is more abundant in ASC1 mutant cells. In compliance, the transcriptome data reveal a down-regulation for the majority of target genes regulated by Tec1p, Flo8p, Phd1p, and Rap1p in the Δasc1 strain, whereas Ste12p target genes are mostly up-regulated (Table III).
A function of Asc1p in translational regulation is strongly supported by our analysis of specific transcription factor-5′UTR sequences via reporter system in this study. Our data show that the changes in Tec1p, Phd1p, and Ste12p abundances depend on Asc1p. Their protein levels, as determined by Western experiments, and 5′UTR activities in the testing system significantly correlate. This strongly supports a specific function of Asc1p in the control of the initiation of translation of specific transcription-factor-encoding mRNAs, thereby regulating the cellular response via affiliated signaling pathways. Additionally, Asc1p might influence the stability of the transcription factors. In order to evaluate the ASC1-dependent transcription factor degradation rates, shut-off Western experiments were performed for those transcription factors that can be deleted and overexpressed (Tec1p, Phd1p, and Flo8p). The differences in transcription-factor-degradation rates observed in Western shut-off experiments are not sufficient to explain the differing steady-state levels of the transcription factors in the wild type and Δasc1 backgrounds under their native conditions and with the GAL1 promoter (supplemental Fig. S4). However, we consider the possibility of an Asc1p-mediated coupling of transcription factor translation with native polypeptide-chain folding and premature protein degradation.
In conclusion, our study provides evidence that Asc1p is enmeshed in the regulation of diverse cellular processes, ranging from iron homeostasis and energy metabolism to intracellular signaling through MAPK cascades and the cAMP-dependent PKA pathway. Asc1p is involved in balancing different energy-producing strategies according to oxygen- and carbon-source availability. This supports the requirement of Asc1p/RACK1 to regulate the normoxic–hypoxic transition, a process of significance in cellular aging, neurodegeneration, and cancer in mammalian cells (84–86).
Asc1p physically interacts with several components of signal transduction pathways that, when activated, might lead to changes in Asc1p modification and/or conformation at the ribosome, thereby transferring their message into the translational machinery (6, 17). Some of these possibilities are currently being explored in our laboratory, but it will take further extensive research to identify the exact mechanisms by which Asc1p confers signal-pathway-sensitive translational regulation. On the basis of the discrepancies between the activation of signaling pathways and the transcription-factor-mediated phenotypical read-out, we hypothesize that the interactions of the ribosomal protein Asc1p with upstream signal transduction proteins specifically alters ribosomal settings and thereby couples signal transduction events with the translational process (supplemental Fig. S5). We imagine that as a result of the deletion of ASC1, signal transduction and translation become at least partially uncoupled, and, as we were able to show for the process of adhesive/pseudohyphal growth, the pathway is turned on but the expected cellular response is not achieved, a discrepancy previously observed (17). Another important aspect supporting this idea is that Asc1p indeed influences the modification and abundance of translation initiation and elongation factors (10; unpublished data). This, in combination with regulatory element-harboring 5′UTR sequences, could determine the translational rates of specific transcription factor mRNAs or confer ribosome specificity for distinct groups of mRNAs.
Supplementary Material
Acknowledgments
We especially thank Verena Hofer-Pretz for her outstanding and continuous technical and experimental assistance. We thank Stefan Irniger for helpful ideas and discussions, Britta Herzog for her technical support, Lennart Opitz (Core Facility for Transcriptome Analyses, University Medical Center, Göttingen) for the statistical analysis of the transcriptome data, and Sabrina Sander for her experimental contribution during her practical course. We cordially thank Thomas Dever (NIH, Bethesda, MD) and Hans-Ulrich Mösch (Philipps-Universität Marburg, Germany) for providing the polyclonal rabbit anti-eIF2α and polyclonal rabbit anti-Tec1p antibodies, respectively, and Andrew Link for providing the anti-Asc1p antibody.
Footnotes
 This article contains supplemental material.
1 The abbreviations used are:
- 3AT
- 3-amino-1,2,4-triazole
- 5′UTR
- 5′ untranslated region
- BPS
- bathophenanthrolinedisulfonic acid
- NO
- nitric oxide
- PKC
- protein kinase C
- RNOS
- reactive nitrogen oxide species
- ROS
- reactive oxygen species
- TTC
- triphenyltetrazolium chloride.
REFERENCES
- 1. Smith T. F., Gaitatzes C., Saxena K., Neer E. J. (1999) The WD repeat: a common architecture for diverse functions. Trends Biochem. Sci. 24, 181–185 [DOI] [PubMed] [Google Scholar]
- 2. Gerbasi V. R., Weaver C. M., Hill S., Friedman D. B., Link A. J. (2004) Yeast Asc1p and mammalian RACK1 are functionally orthologous core 40S ribosomal proteins that repress gene expression. Mol. Cell. Biol. 24, 8276–8287 [DOI] [PMC free article] [PubMed] [Google Scholar]
- 3. Coyle S. M., Gilbert W. V., Doudna J. A. (2009) Direct link between RACK1 function and localization at the ribosome in vivo. Mol. Cell. Biol. 29, 1626–1634 [DOI] [PMC free article] [PubMed] [Google Scholar]
- 4. Gavin A. C., Bösche M., Krause R., Grandi P., Marzioch M., Bauer A., Schultz J., Rick J. M., Michon A. M., Cruciat C. M., Remor M., Höfert C., Schelder M., Brajenovic M., Ruffner H., Merino A., Klein K., Hudak M., Dickson D., Rudi T., Gnau V., Bauch A., Bastuck S., Huhse B., Leutwein C., Heurtier M. A., Copley R. R., Edelmann A., Querfurth E., Rybin V., Drewes G., Raida M., Bouwmeester T., Bork P., Seraphin B., Kuster B., Neubauer G., Superti-Furga G. (2002) Functional organization of the yeast proteome by systematic analysis of protein complexes. Nature 415, 141–147 [DOI] [PubMed] [Google Scholar]
- 5. Gavin A. C., Aloy P., Grandi P., Krause R., Boesche M., Marzioch M., Rau C., Jensen L. J., Bastuck S., Dümpelfeld B., Edelmann A., Heurtier M. A., Hoffman V., Hoefert C., Klein K., Hudak M., Michon A. M., Schelder M., Schirle M., Remor M., Rudi T., Hooper S., Bauer A., Bouwmeester T., Casari G., Drewes G., Neubauer G., Rick J. M., Kuster B., Bork P., Russell R. B., Superti-Furga G. (2006) Proteome survey reveals modularity of the yeast cell machinery. Nature 440, 631–636 [DOI] [PubMed] [Google Scholar]
- 6. Breitkreutz A., Choi H., Sharom J. R., Boucher L., Neduva V., Larsen B., Lin Z. Y., Breitkreutz B. J., Stark C., Liu G., Ahn J., Dewar-Darch D., Reguly T., Tang X., Almeida R., Qin Z. S., Pawson T., Gingras A. C., Nesvizhskii A. I., Tyers M. (2010) A global protein kinase and phosphatase interaction network in yeast. Science 328, 1043–1046 [DOI] [PMC free article] [PubMed] [Google Scholar]
- 7. Costanzo M., Baryshnikova A., Bellay J., Kim Y., Spear E. D., Sevier C. S., Ding H., Koh J. L., Toufighi K., Mostafavi S., Prinz J., St Onge R. P., VanderSluis B., Makhnevych T., Vizeacoumar F. J., Alizadeh S., Bahr S., Brost R. L., Chen Y., Cokol M., Deshpande R., Li Z., Lin Z. Y., Liang W., Marback M., Paw J., San Luis B. J., Shuteriqi E., Tong A. H., van Dyk N., Wallace I. M., Whitney J. A., Weirauch M. T., Zhong G., Zhu H., Houry W. A., Brudno M., Ragibizadeh S., Papp B., Pál C., Roth F. P., Giaever G., Nislow C., Troyanskaya O. G., Bussey H., Bader G. D., Gingras A. C., Morris Q. D., Kim P. M., Kaiser C. A., Myers C. L., Andrews B. J., Boone C. (2010) The genetic landscape of a cell. Science 327, 425–431 [DOI] [PMC free article] [PubMed] [Google Scholar]
- 8. Baum S., Bittins M., Frey S., Seedorf M. (2004) Asc1p, a WD40-domain containing adaptor protein, is required for the interaction of the RNA-binding protein Scp160p with polysomes. Biochem. J. 380(Pt 3), 823–830 [DOI] [PMC free article] [PubMed] [Google Scholar]
- 9. Sezen B., Seedorf M., Schiebel E. (2009) The SESA network links duplication of the yeast centrosome with the protein translation machinery. Genes Dev. 23, 1559–1570 [DOI] [PMC free article] [PubMed] [Google Scholar]
- 10. Valerius O., Kleinschmidt M., Rachfall N., Schulze F., López Marín S., Hoppert M., Streckfuss-Bömeke K., Fischer C., Braus G. H. (2007) The Saccharomyces homolog of mammalian RACK1, Cpc2/Asc1p, is required for FLO11-dependent adhesive growth and dimorphism. Mol. Cell. Proteomics 6, 1968–1979 [DOI] [PubMed] [Google Scholar]
- 11. Kiss-László Z., Henry Y., Bachellerie J. P., Caizergues-Ferrer M., Kiss T. (1996) Site-specific ribose methylation of preribosomal RNA: a novel function for small nucleolar RNAs. Cell 85, 1077–1088 [DOI] [PubMed] [Google Scholar]
- 12. Li Z., Lee I., Moradi E., Hung N. J., Johnson A. W., Marcotte E. M. (2009) Rational extension of the ribosome biogenesis pathway using network-guided genetics. PLoS Biol. 7(10), e1000213. [DOI] [PMC free article] [PubMed] [Google Scholar]
- 13. Ron D., Chen C. H., Caldwell J., Jamieson L., Orr E., Mochly-Rosen D. (1994) Cloning of an intracellular receptor for protein kinase C: a homolog of the β subunit of G proteins. Proc. Natl. Acad. Sci. U.S.A. 91, 839–843 [DOI] [PMC free article] [PubMed] [Google Scholar]
- 14. McCahill A., Warwicker J., Bolger G. B., Houslay M. D., Yarwood S. J. (2002) The RACK1 scaffold protein: a dynamic cog in cell response mechanisms. Mol. Pharmacol. 62, 1261–1273 [DOI] [PubMed] [Google Scholar]
- 15. Yarwood S. J., Steele M. R., Scotland G., Houslay M. D., Bolger G. B. (1999) The RACK1 signaling scaffold protein selectively interacts with the cAMP-specific phosphodiesterase PDE4D5 isoform. J. Biol. Chem. 274, 14909–14917 [DOI] [PubMed] [Google Scholar]
- 16. Bird R. J., Baillie G. S., Yarwood S. J. (2010) Interaction with receptor for activated C-kinase 1 (RACK1) sensitizes the phosphodiesterase PDE4D5 towards hydrolysis of cAMP and activation by protein kinase C. Biochem. J. 432, 207–216 [DOI] [PMC free article] [PubMed] [Google Scholar]
- 17. Zeller C. E., Parnell S. C., Dohlman H. G. (2007) The RACK1 ortholog Asc1 functions as a G-protein β subunit coupled to glucose responsiveness in yeast. J. Biol. Chem. 282, 25168–25176 [DOI] [PubMed] [Google Scholar]
- 18. Melamed D., Bar-Ziv L., Truzman Y., Arava Y. (2010) Asc1 supports cell-wall integrity near bud sites by a Pkc1 independent mechanism. PLoS One 5, e11389. [DOI] [PMC free article] [PubMed] [Google Scholar]
- 19. Chantrel Y., Gaisne M., Lions C., Verdière J. (1998) The transcriptional regulator Hap1p (Cyp1p) is essential for anaerobic or heme-deficient growth of Saccharomyces cerevisiae: genetic and molecular characterization of an extragenic suppressor that encodes a WD repeat protein. Genetics 148, 559–569 [DOI] [PMC free article] [PubMed] [Google Scholar]
- 20. Paul S. K., Oowatari Y., Kawamukai M. (2009) A large complex mediated by Moc1, Moc2 and Cpc2 regulates sexual differentiation in fission yeast. FEBS J. 276, 5076–5093 [DOI] [PubMed] [Google Scholar]
- 21. Wang L., Berndt P., Xia X., Kahnt J., Kahmann R. (2011) A seven-WD40 protein related to human RACK1 regulates mating and virulence in Ustilago maydis. Mol. Microbiol. 81, 1484–1498 [DOI] [PubMed] [Google Scholar]
- 22. Chen J. G., Ullah H., Temple B., Liang J., Guo J., Alonso J. M., Ecker J. R., Jones A. M. (2006) RACK1 mediates multiple hormone responsiveness and developmental processes in Arabidopsis. J. Exp. Bot. 57, 2697–2708 [DOI] [PubMed] [Google Scholar]
- 23. Guo J., Wang S., Valerius O., Hall H., Zeng Q., Li J. F., Weston D. J., Ellis B., Chen J. G. (2011) Involvement of Arabidopsis RACK1 in protein translation and its regulation by abscisic acid. Plant Physiol. 155 (1), 370–383 [DOI] [PMC free article] [PubMed] [Google Scholar]
- 24. Kadrmas J. L., Smith M. A., Pronovost S. M., Beckerle M. C. (2007) Characterization of RACK1 function in Drosophila development. Dev. Dyn. 236, 2207–2215 [DOI] [PubMed] [Google Scholar]
- 25. Hermanto U., Zong C. S., Li W., Wang L. H. (2002) RACK1, an insulin-like growth factor I (IGF-I) receptor-interacting protein, modulates IGF-I-dependent integrin signaling and promotes cell spreading and contact with extracellular matrix. Mol. Cell. Biol. 22, 2345–2365 [DOI] [PMC free article] [PubMed] [Google Scholar]
- 26. Zhang W., Cheng G. Z., Gong J., Hermanto U., Zong C. S., Chan J., Cheng J. Q., Wang L. H. (2008) RACK1 and CIS mediate the degradation of BimEL in cancer cells. J. Biol. Chem. 283, 16416–16426 [DOI] [PMC free article] [PubMed] [Google Scholar]
- 27. Mamidipudi V., Cartwright C. A. (2009) A novel pro-apoptotic function of RACK1: suppression of Src activity in the intrinsic and Akt pathways. Oncogene 28, 4421–4433 [DOI] [PubMed] [Google Scholar]
- 28. Berns H., Humar R., Hengerer B., Kiefer F. N., Battegay E. J. (2000) RACK1 is up-regulated in angiogenesis and human carcinomas. FASEB J. 14, 2549–2558 [DOI] [PubMed] [Google Scholar]
- 29. López-Bergami P., Habelhah H., Bhoumik A., Zhang W., Wang L. H., Ronai Z. (2005) RACK1 mediates activation of JNK by protein kinase C [corrected]. Mol. Cell 19, 309–320 [DOI] [PMC free article] [PubMed] [Google Scholar]
- 30. Guillemot F., Billault A., Auffray C. (1989) Physical linkage of a guanine nucleotide-binding protein-related gene to the chicken major histocompatibility complex. Proc. Natl. Acad. Sci. U.S.A. 86, 4594–4598 [DOI] [PMC free article] [PubMed] [Google Scholar]
- 31. Gueldener U., Heinisch J., Koehler G. J., Voss D., Hegemann J. H. (2002) A second set of loxP marker cassettes for Cre-mediated multiple gene knockouts in budding yeast. Nucleic Acids Res. 30, e23. [DOI] [PMC free article] [PubMed] [Google Scholar]
- 32. Janke C., Magiera M. M., Rathfelder N., Taxis C., Reber S., Maekawa H., Moreno-Borchart A., Doenges G., Schwob E., Schiebel E., Knop M. (2004) A versatile toolbox for PCR-based tagging of yeast genes: new fluorescent proteins, more markers and promoter substitution cassettes. Yeast 21, 947–962 [DOI] [PubMed] [Google Scholar]
- 33. Ito H., Fukuda Y., Murata K., Kimura A. (1983) Transformation of intact yeast cells treated with alkali cations. J. Bacteriol. 153, 163–168 [DOI] [PMC free article] [PubMed] [Google Scholar]
- 34. David L., Huber W., Granovskaia M., Toedling J., Palm C. J., Bofkin L., Jones T., Davis R. W., Steinmetz L. M. (2006) A high-resolution map of transcription in the yeast genome. Proc. Natl. Acad. Sci. U.S.A. 103, 5320–5325 [DOI] [PMC free article] [PubMed] [Google Scholar]
- 35. Rachfall N., Heinemeyer I., Morgenstern B., Valerius O., Braus G. H. (2011) 5′TRU: identification and analysis of translationally regulative 5′untranslated regions in amino acid starved yeast cells. Mol. Cell. Proteomics 10(6), M110.003350. [DOI] [PMC free article] [PubMed] [Google Scholar]
- 36. Wessel D., Flügge U. I. (1984) A method for the quantitative recovery of protein in dilute solution in the presence of detergents and lipids. Anal. Biochem. 138, 141–143 [DOI] [PubMed] [Google Scholar]
- 37. Blum H., Eyer H., Gross H. J. (1987) Improved silver staining of plant proteins, RNA and DNA in polyacrylamide gels. Electrophoresis 8, 93–99 [Google Scholar]
- 38. Shevchenko A., Wilm M., Vorm O., Mann M. (1996) Mass spectrometric sequencing of proteins silver-stained polyacrylamide gels. Anal. Chem. 68, 850–858 [DOI] [PubMed] [Google Scholar]
- 39. Eng J. K., McCormack A. L., Yates J. R., III (1994) An approach to correlate tandem mass spectral data of peptides with amino acid sequences in a protein database. J. Am. Soc. Mass Spectrom. 5, 976–989 [DOI] [PubMed] [Google Scholar]
- 40. Schmitt M. E., Brown T. A., Trumpower B. L. (1990) A rapid and simple method for preparation of RNA from Saccharomyces cerevisiae. Nucleic Acids Res. 18, 3091–3092 [DOI] [PMC free article] [PubMed] [Google Scholar]
- 41. Fitzpatrick J. M., Johnston D. A., Williams G. W., Williams D. J., Freeman T. C., Dunne D. W., Hoffmann K. F. (2005) An oligonucleotide microarray for transcriptome analysis of Schistosoma mansoni and its application/use to investigate gender-associated gene expression. Mol. Biochem. Parasitol. 141, 1–13 [DOI] [PubMed] [Google Scholar]
- 42. Ogur M., St. John R., Nagai S. (1957) Tetrazolium overlay technique for population studies of respiration deficiency in yeast. Science 125, 928–929 [DOI] [PubMed] [Google Scholar]
- 43. Bradford M. M. (1976) A rapid and sensitive method for the quantitation of microgram quantities of protein utilizing the principle of protein-dye binding. Anal. Biochem. 72, 248–254 [DOI] [PubMed] [Google Scholar]
- 44. Rose M., Botstein D. (1983) Construction and use of gene fusions to lacZ (β-galactosidase) that are expressed in yeast. Methods Enzymol. 101, 167–180 [DOI] [PubMed] [Google Scholar]
- 45. Trimpin S., Brizzard B. (2009) Analysis of insoluble proteins. BioTechniques 46, 409–419 [DOI] [PubMed] [Google Scholar]
- 46. Liu L., Zeng M., Hausladen A., Heitman J., Stamler J. S. (2000) Protection from nitrosative stress by yeast flavohemoglobin. Proc. Natl. Acad. Sci. U.S.A. 97, 4672–4676 [DOI] [PMC free article] [PubMed] [Google Scholar]
- 47. Cassanova N., O'Brien K. M., Stahl B. T., McClure T., Poyton R. O. (2005) Yeast flavohemoglobin, a nitric oxide oxidoreductase, is located in both the cytosol and the mitochondrial matrix: effects of respiration, anoxia, and the mitochondrial genome on its intracellular level and distribution. J. Biol. Chem. 280, 7645–7653 [DOI] [PubMed] [Google Scholar]
- 48. Turrens J. F. (2003) Mitochondrial formation of reactive oxygen species. J. Physiol. 552(Pt 2), 335–344 [DOI] [PMC free article] [PubMed] [Google Scholar]
- 49. de Oliveira I. M., Zanotto-Filho A., Moreira J. C., Bonatto D., Henriques J. A. (2010) The role of two putative nitroreductases, Frm2p and Hbn1p, in the oxidative stress response in Saccharomyces cerevisiae. Yeast 27, 89–102 [DOI] [PubMed] [Google Scholar]
- 50. Li W., Sun L., Liang Q., Wang J., Mo W., Zhou B. (2006) Yeast AMID homologue Ndi1p displays respiration-restricted apoptotic activity and is involved in chronological aging. Mol. Biol. Cell 17, 1802–1811 [DOI] [PMC free article] [PubMed] [Google Scholar]
- 51. Seo B. B., Marella M., Yagi T., Matsuno-Yagi A. (2006) The single subunit NADH dehydrogenase reduces generation of reactive oxygen species from complex I. FEBS Lett. 580, 6105–6108 [DOI] [PubMed] [Google Scholar]
- 52. Epstein C. B., Waddle J. A., Hale W. T., Dave V., Thornton J., Macatee T. L., Garner H. R., Butow R. A. (2001) Genome-wide responses to mitochondrial dysfunction. Mol. Biol. Cell 12, 297–308 [DOI] [PMC free article] [PubMed] [Google Scholar]
- 53. Hausmann A., Samans B., Lill R., Mühlenhoff U. (2008) Cellular and mitochondrial remodeling upon defects in iron-sulfur protein biogenesis. J. Biol. Chem. 283, 8318–8330 [DOI] [PubMed] [Google Scholar]
- 54. Verna J., Lodder A., Lee K., Vagts A., Ballester R. (1997) A family of genes required for maintenance of cell wall integrity and for the stress response in Saccharomyces cerevisiae. Proc. Natl. Acad. Sci. U.S.A. 94, 13804–13809 [DOI] [PMC free article] [PubMed] [Google Scholar]
- 55. Wojda I., Alonso-Monge R., Bebelman J. P., Mager W. H., Siderius M. (2003) Response to high osmotic conditions and elevated temperature in Saccharomyces cerevisiae is controlled by intracellular glycerol and involves coordinate activity of MAP kinase pathways. Microbiology 149(Pt 5), 1193–1204 [DOI] [PubMed] [Google Scholar]
- 56. Kopecká M., Gabriel M. (1992) The influence of congo red on the cell wall and (1,3)-β-D-glucan microfibril biogenesis in Saccharomyces cerevisiae. Arch. Microbiol. 158, 115–126 [DOI] [PubMed] [Google Scholar]
- 57. Reynolds T. B., Jansen A., Peng X., Fink G. R. (2008) Mat formation in Saccharomyces cerevisiae requires nutrient and pH gradients. Eukaryot. Cell 7, 122–130 [DOI] [PMC free article] [PubMed] [Google Scholar]
- 58. Ogur M., St John R. (1956) A differential and diagnostic plating method for population studies of respiration deficiency in yeast. J. Bacteriol. 72, 500–504 [DOI] [PMC free article] [PubMed] [Google Scholar]
- 59. Teixeira M. C., Monteiro P., Jain P., Tenreiro S., Fernandes A. R., Mira N. P., Alenquer M., Freitas A. T., Oliveira A. L., Sá-Correia I. (2006) The YEASTRACT database: a tool for the analysis of transcription regulatory associations in Saccharomyces cerevisiae. Nucleic Acids Res. 34, D446–D451 [DOI] [PMC free article] [PubMed] [Google Scholar]
- 60. Monteiro P. T., Mendes N. D., Teixeira M. C., d'Orey S., Tenreiro S., Mira N. P., Pais H., Francisco A. P., Carvalho A. M., Lourenco A. B., Sá-Correia I., Oliveira A. L., Freitas A. T. (2008) YEASTRACT-DISCOVERER: new tools to improve the analysis of transcriptional regulatory associations in Saccharomyces cerevisiae. Nucleic Acids Res. 36, D132–D136 [DOI] [PMC free article] [PubMed] [Google Scholar]
- 61. Rupp S., Summers E., Lo H. J., Madhani H., Fink G. (1999) MAP kinase and cAMP filamentation signaling pathways converge on the unusually large promoter of the yeast FLO11 gene. EMBO J. 18, 1257–1269 [DOI] [PMC free article] [PubMed] [Google Scholar]
- 62. Kouba T., Rutkai E., Kárasková M., Valášek L. S. (2012) The eIF3c/NIP1 PCI domain interacts with RNA and RACK1/ASC1 and promotes assembly of translation preinitiation complexes. Nucleic Acids Res. 40 (6), 2683–2699 [DOI] [PMC free article] [PubMed] [Google Scholar]
- 63. Cao X. X., Xu J. D., Liu X. L., Xu J. W., Wang W. J., Li Q. Q., Chen Q., Xu Z. D., Liu X. P. (2010) RACK1: a superior independent predictor for poor clinical outcome in breast cancer. Int. J. Cancer 127, 1172–1179 [DOI] [PubMed] [Google Scholar]
- 64. Liu Y. V., Baek J. H., Zhang H., Diez R., Cole R. N., Semenza G. L. (2007) RACK1 competes with HSP90 for binding to HIF-1alpha and is required for O(2)-independent and HSP90 inhibitor-induced degradation of HIF-1alpha. Mol. Cell 25, 207–217 [DOI] [PMC free article] [PubMed] [Google Scholar]
- 65. Baek J. H., Liu Y. V., McDonald K. R., Wesley J. B., Zhang H., Semenza G. L. (2007) Spermidine/spermine N1-acetyltransferase-1 binds to hypoxia-inducible factor-1α (HIF-1α) and RACK1 and promotes ubiquitination and degradation of HIF-1α. J. Biol. Chem. 282, 33358–33366 [DOI] [PubMed] [Google Scholar]
- 66. Bruckmann A., Hensbergen P. J., Balog C. I., Deelder A. M., Brandt R., Snoek I. S., Steensma H. Y., van Heusden G. P. (2009) Proteome analysis of aerobically and anaerobically grown Saccharomyces cerevisiae cells. J. Proteomics 71, 662–669 [DOI] [PubMed] [Google Scholar]
- 67. Senior A. E., Nadanaciva S., Weber J. (2002) The molecular mechanism of ATP synthesis by F1F0-ATP synthase. Biochim. Biophys. Acta 1553, 188–211 [DOI] [PubMed] [Google Scholar]
- 68. Dirmeier R., O'Brien K. M., Engle M., Dodd A., Spears E., Poyton R. O. (2002) Exposure of yeast cells to anoxia induces transient oxidative stress. Implications for the induction of hypoxic genes. J. Biol. Chem. 277, 34773–34784 [DOI] [PubMed] [Google Scholar]
- 69. Seo H. Y., Chang Y. J., Chung Y. J., Kim K. S. (2008) Proteomic analysis of recombinant Saccharomyces cerevisiae upon iron deficiency induced via human H-ferritin production. J. Microbiol. Biotechnol. 18, 1368–1376 [PubMed] [Google Scholar]
- 70. Waterland R. A., Basu A., Chance B., Poyton R. O. (1991) The isoforms of yeast cytochrome c oxidase subunit V alter the in vivo kinetic properties of the holoenzyme. J. Biol. Chem. 266, 4180–4186 [PubMed] [Google Scholar]
- 71. Zhao X. J., Raitt D. P. V. B., Clewell A. S., Kwast K. E., Poyton R. O. (1996) Function and expression of flavohemoglobin in Saccharomyces cerevisiae. Evidence for a role in the oxidative stress response. J. Biol. Chem. 271, 25131–25138 [DOI] [PubMed] [Google Scholar]
- 72. Castello P. R., David P. S., McClure T., Crook Z., Poyton R. O. (2006) Mitochondrial cytochrome oxidase produces nitric oxide under hypoxic conditions: implications for oxygen sensing and hypoxic signaling in eukaryotes. Cell Metab. 3, 277–287 [DOI] [PubMed] [Google Scholar]
- 73. Brown G. C., Borutaite V. (2001) Nitric oxide, mitochondria, and cell death. IUBMB Life 52, 189–195 [DOI] [PubMed] [Google Scholar]
- 74. Groot M. T., Merkx M., Koper M. T. (2007) Reorganization of immobilized horse and yeast cytochrome c induced by pH changes or nitric oxide binding. Langmuir 23, 3832–3839 [DOI] [PubMed] [Google Scholar]
- 75. Radi R. (2004) Nitric oxide, oxidants, and protein tyrosine nitration. Proc. Natl. Acad. Sci. U.S.A. 101, 4003–4008 [DOI] [PMC free article] [PubMed] [Google Scholar]
- 76. Balafanova Z., Bolli R., Zhang J., Zheng Y., Pass J. M., Bhatnagar A., Tang X. L., Wang O., Cardwell E., Ping P. (2002) Nitric oxide (NO) induces nitration of protein kinase Cε (PKCε), facilitating PKCε translocation via enhanced PKCε -RACK2 interactions: a novel mechanism of no-triggered activation of PKCε. J. Biol. Chem. 277, 15021–15027 [DOI] [PubMed] [Google Scholar]
- 77. Aulak K. S., Miyagi M., Yan L., West K. A., Massillon D., Crabb J. W., Stuehr D. J. (2001) Proteomic method identifies proteins nitrated in vivo during inflammatory challenge. Proc. Natl. Acad. Sci. U.S.A. 98, 12056–12061 [DOI] [PMC free article] [PubMed] [Google Scholar]
- 78. de Oliveira I. M., Henriques J. A., Bonatto D. (2007) In silico identification of a new group of specific bacterial and fungal nitroreductase-like proteins. Biochem. Biophys. Res. Commun. 355, 919–925 [DOI] [PubMed] [Google Scholar]
- 79. Lesage G., Sdicu A. M., Ménard P., Shapiro J., Hussein S., Bussey H. (2004) Analysis of β-1,3-glucan assembly in Saccharomyces cerevisiae using a synthetic interaction network and altered sensitivity to caspofungin. Genetics 167, 35–49 [DOI] [PMC free article] [PubMed] [Google Scholar]
- 80. Tong A. H., Lesage G., Bader G. D., Ding H., Xu H., Xin X., Young J., Berriz G. F., Brost R. L., Chang M., Chen Y., Cheng X., Chua G., Friesen H., Goldberg D. S., Haynes J., Humphries C., He G., Hussein S., Ke L., Krogan N., Li Z., Levinson J. N., Lu H., Ménard P., Munyana C., Parsons A. B., Ryan O., Tonikian R., Roberts T., Sdicu A. M., Shapiro J., Sheikh B., Suter B., Wong S. L., Zhang L. V., Zhu H., Burd C. G., Munro S., Sander C., Rine J., Greenblatt J., Peter M., Bretscher A., Bell G., Roth F. P., Brown G. W., Andrews B., Bussey H., Boone C. (2004) Global mapping of the yeast genetic interaction network. Science 303, 808–813 [DOI] [PubMed] [Google Scholar]
- 81. Chasse S. A., Flanary P., Parnell S. C., Hao N., Cha J. Y., Siderovski D. P., Dohlman H. G. (2006) Genome-scale analysis reveals Sst2 as the principal regulator of mating pheromone signaling in the yeast Saccharomyces cerevisiae. Eukaryot. Cell 5, 330–346 [DOI] [PMC free article] [PubMed] [Google Scholar]
- 82. Elion E. A., Satterberg B., Kranz J. E. (1993) Fus3 phosphorylates multiple components of the mating signal transduction cascade: evidence for Ste12 and Far1. Mol. Biol. Cell 4, 495–510 [DOI] [PMC free article] [PubMed] [Google Scholar]
- 83. Tedford K., Kim S., Sa D., Stevens K., Tyers M. (1997) Regulation of the mating pheromone and invasive growth responses in yeast by two MAP kinase substrates. Curr. Biol. 7, 228–238 [DOI] [PubMed] [Google Scholar]
- 84. Cataldi A., Di Giulio C. (2009) “Oxygen supply” as modulator of aging processes: hypoxia and hyperoxia models for aging studies. Curr. Aging Sci. 2, 95–102 [DOI] [PubMed] [Google Scholar]
- 85. Carvalho C., Santos M. S., Baldeiras I., Oliveira C. R., Seiça R., Moreira P. I. (2010) Chronic hypoxia potentiates age-related oxidative imbalance in brain vessels and synaptosomes. Curr. Neurovasc. Res. 7, 288–300 [DOI] [PubMed] [Google Scholar]
- 86. West X. Z., Malinin N. L., Merkulova A. A., Tischenko M., Kerr B. A., Borden E. C., Podrez E. A., Salomon R. G., Byzova T. V. (2010) Oxidative stress induces angiogenesis by activating TLR2 with novel endogenous ligands. Nature 467, 972–976 [DOI] [PMC free article] [PubMed] [Google Scholar]
- 87. Braus G. H., Grundmann O., Brückner S., Mösch H. U. (2003) Amino acid starvation and Gcn4p regulate adhesive growth and FLO11 gene expression in Saccharomyces cerevisiae. Mol Biol Cell 14 (10), 4272–4284 [DOI] [PMC free article] [PubMed] [Google Scholar]
Associated Data
This section collects any data citations, data availability statements, or supplementary materials included in this article.