Abstract
Amiodarone (AMD), a class III antiarrhythmic drug, causes idiosyncratic hepatotoxicity in human patients. We demonstrated previously that tumor necrosis factor-alpha (TNF-α) plays an important role in a rat model of AMD-induced hepatotoxicity under inflammatory stress. In this study, we developed a model in vitro to study the roles of caspase activation and oxidative stress in TNF potentiation of AMD cytotoxicity. AMD caused cell death in Hepa1c1c7 cells, and TNF cotreatment potentiated its toxicity. Activation of caspases 9 and 3/7 was observed in AMD/TNF-cotreated cells, and caspase inhibitors provided minor protection from cytotoxicity. Intracellular reactive oxygen species (ROS) generation and lipid peroxidation were observed after treatment with AMD and were further elevated by TNF cotreatment. Adding water-soluble antioxidants (trolox, N-acetylcysteine, glutathione, or ascorbate) produced only minor attenuation of AMD/TNF-induced cytotoxicity and did not influence the effect of AMD alone. On the other hand, α-tocopherol (TOCO), which reduced lipid peroxidation and ROS generation, prevented AMD toxicity and caused pronounced reduction in cytotoxicity from AMD/TNF cotreatment. α-TOCO plus a pancaspase inhibitor completely abolished AMD/TNF-induced cytotoxicity. In summary, activation of caspases and oxidative stress were observed after AMD/TNF cotreatment, and caspase inhibitors and a lipid-soluble free-radical scavenger attenuated AMD/TNF-induced cytotoxicity.
Key Words: amiodarone, tumor necrosis factor-alpha, lipid peroxidation, caspase
Amiodarone [2-butyl-3-(3',5'-diiodo-4'α-diethylamino-ethoxybenzoyl)-benzofuran] (AMD) is an antiarrhythmic drug effective for the treatment of myocardial infarction or congestive heart failure (Singh, 1996). The use of AMD has been associated with a variety of adverse effects, including liver dysfunction, pulmonary complications, thyroid dysfunction, and ocular disturbance (Rotmensch et al., 1984). The U.S. Food and Drug Administration issued a black box warning for AMD for its ability to induce idiosyncratic hepatotoxicity. The frequency of symptomatic liver abnormalities in patients receiving AMD is 1–3% (Lewis et al., 1989). Many of these reactions are mild, but some can be acute and severe, especially during iv administration (Ratz Bravo et al., 2005). Fulminant hepatic failure or even death related to AMD treatment was reported (Babatin et al., 2008).
The mechanisms of AMD-induced idiosyncratic hepatotoxicity are not clear. Neither the magnitude nor the frequency of severe hepatotoxicity is directly related to the dose and duration of AMD therapy (Pollak and Shafer, 2004). Attempts to establish a model with healthy rodents were unsuccessful: neither large-dose, short-term exposure nor small-dose, long-term exposure resulted in observable liver damage (Young and Mehendale, 1989). The induction of severe AMD hepatotoxicity is more likely to be due to a combination of AMD and other factors, e.g., inflammatory episodes.
Lipopolysaccharide (LPS) is widely used to induce an inflammatory response in animal studies. Results from studies in rodents indicate that liver injury results from cotreatment with LPS and some drugs that are associated with idiosyncratic hepatotoxicity in people (Deng et al. 2006; Luyendyk et al. 2003; Waring et al. 2006; Zou et al., 2009). This occurs with nontoxic doses of several drugs from different pharmacologic classes. One of these drugs is AMD. We reported previously that modest inflammation caused by LPS can interact with AMD to induce liver damage in rats (Lu et al., 2012). Tumor necrosis factor-alpha (TNF-α), a cytokine released upon LPS administration, was critically involved in this AMD/LPS-induced liver injury model: inhibition of TNF signaling by etanercept significantly attenuated AMD/LPS-induced hepatotoxicity (Lu et al., 2012). Furthermore, TNF potentiated the cytotoxicity of AMD in Hepa1c1c7 cells, providing a simplified model with which to study the intracellular events involved in the interactions between AMD and TNF in hepatocytes in vitro.
The appearance of TNF is one of the earliest events after LPS exposure. TNF triggers the expression of other cytokines, infiltration and activation of inflammatory cells, impairment of the hemostatic system, etc. (Beutler and Kruys, 1995). Furthermore, TNF is cytotoxic to a variety of primary cells or transformed cell lines (Fransen et al., 1986). The majority of the biological effects from soluble TNF is mediated by TNF receptor-1 (TNF-R1). TNF binding to TNF-R1 can lead to the activation of a variety of signaling pathways, one of which involves procaspase 8 cleavage, which initiates an apoptotic cascade. In hepatocytes, mitochondria are involved in bridging caspase 8 to caspase 9, and eventually to effector caspases, e.g. caspases 3 and 7 (Wullaert et al., 2007). Loss of mitochondrial membrane potential, generation of reactive oxygen species (ROS), formation of the mitochondrial permeability transition pore, and release of cytochrome C are critical to TNF-induced hepatocyte apoptosis (Bradham et al., 1998; Colell et al., 2001; Hatano et al., 2000).
AMD induces apoptosis and/or necrosis in many different cell types (Kaufmann et al., 2005), including primary hepatocytes (Kaufmann et al., 2005) and hepatoma cell lines (Shojiro et al., 2004). AMD inhibits the β-oxidation of fatty acids (Fromenty et al., 1990b), inhibits complexes I, II, and III in the respiratory chain (Spaniol et al., 2001), decreases mitochondrial membrane potential (Yano et al., 2008), uncouples oxidative phosphorylation (Fromenty et al., 1990a), and increases the mRNA level of the proapoptotic protein bax (Choi et al., 2002). All of these events can lead to mitochondrial dysfunction and consequent ROS generation and caspase activation and eventually result in cell death. Indeed, activation of caspase cascades, disruption of mitochondrial function, and generation of ROS are important in AMD-induced cytotoxicity in vitro.
As mentioned above, our previous findings demonstrated that TNF potentiates the cytotoxicity of AMD (Lu et al., 2012). The purpose of this study was to investigate the mechanism of this interaction. We explored the roles of caspase activation, ROS generation, and lipid peroxidation in the potentiation of AMD cytotoxicity by TNF.
MATERIALS AND METHODS
Materials.
Unless otherwise noted, all chemicals were purchased from Sigma-Aldrich (St Louis, MO). The concentrations and vehicles of stock solutions were as follows: AMD, 10mM in water; TNF, 100 µg/ml in PBS with 2% bovine serum albumin; z-VAD-FMK, 40mM in dimethyl sulfoxide (DMSO); z-LEHD-FMK, 40mM in DMSO; Ac-DEVD-CHO, 40mM in DMSO; CM-H2DCFDA, 10mM in DMSO; trolox, 4mM in PBS; glutathione (GSH), 100mM in PBS; N-acetyl-l-cysteine (NAC), 100mM in PBS; ascorbic acid (ASC), 200mM in PBS; C11-BODIPY581/591, 100mM in DMSO; and α-tocopherol (TOCO), 500mM in DMSO.
The murine hepatoma cell line Hepa1c1c7 and human hepatoma cell line HepG2 were purchased from American Type Culture Collection (Manassas, VA). Recombinant truncated form of murine TNF was purchased from R&D Systems (Minneapolis, MN).
Animal experiments.
Male, C57Bl/6J mice (Jackson Laboratory, Bar Harbor, ME), 9–11 weeks old, were allowed to acclimate for 1 week in a 12-h light/dark cycle before experiments. They were given continuous access to bottled spring water and fed a standard chow (Rodent Chow/Tek 2018, Harlan Teklad, Madison, WI). All animals received humane care, and all studies were conducted under Michigan State University guidelines.
Mice were fasted 12h prior to treatment. LPS (2 × 10⁶ EU/kg, ip) or saline was given, and 2h later AMD (300mg/kg, ip) or its vehicle (0.18% Tween 80) was administered. Food was returned immediately after AMD administration. Mice were anesthetized with sodium pentobarbital (50mg/kg, ip) at 24h after LPS, and blood was drawn into a syringe containing 3.2% sodium citrate. Alanine aminotransferase (ALT) activity was measured in the plasma with Infinity ALT reagent (Thermo Electron Corp., Louisville, KY).
Cell culture and assessment of cytotoxicity.
Hepa1c1c7 cells were maintained in Dulbecco’s Modified Eagle’s Medium (Invitrogen, Carlsbad, CA) with 1% antibiotic-antimycotic (Invitrogen) and 10% heat-inactivated fetal bovine serum (SAFC Biosciences, Lenexa, KS) in 75-cm2 tissue culture flasks at 37°C in a humidified atmosphere of 95% air and 5% CO2. Cells were plated in 96-well plates at 15,000 cells per well and allowed to attach for 8h before medium was replaced. Various concentrations of AMD and/or TNF were added to designated wells, and cells were incubated under maintenance conditions for the times indicated in figures and legends. The same conditions were applied to experiments with HepG2 cells.
To assess cytotoxicity, the activity of lactate dehydrogenase (LDH) released into the culture medium was measured using the Cytotox-One Homogeneous Membrane Integrity Assay (Promega, Madison, WI). LDH release reflects loss of plasma membrane integrity as an indicator of cytotoxicity. LDH was measured in the supernatants and the cell lysates. Cell lysate was generated by adding cell-lysing reagent provided in the assay kit. The percent LDH release was calculated as (100x) LDH activity in supernatant/(LDH activity in supernatant + LDH activity in cell lysate).
Assessment of cell death using annexin V/propidium iodide stain.
Early apoptosis was assessed using annexin V/propidium iodide (AnnV/PI) Apoptosis Detection Kit (BD Biosciences, Pharmingen, San Diego, CA) according to the manufacturer’s protocol. AnnV is a protein with high affinity for phosphatidylserine, which is translocated from the inner to the outer leaflet of the plasma membrane during apoptotic cell death as an early apoptotic change (Koopman et al., 1994). PI is a fluorescent DNA dye that is excluded by intact membranes of viable cells (Jones and Senft, 1985). Accordingly, AnnV and PI are used in combination to determine the state of cell death: cells with AnnV−/PI− staining are considered healthy and viable; cells with AnnV+/PI− staining are in early apoptosis, and cells with AnnV+/PI+ staining are in late apoptosis or are already dead.
Hepa1c1c7 cells treated with AMD and/or TNF were removed from tissue culture plates by trypsin digestion. After recommended washing steps, 1 × 10⁵ cells were suspended in 100 µl of buffer with 5µl of AnnV-allophycocyanin and 5µl of PI. After 15min incubation in the dark, 400 µl of labeling buffer was added to each sample. Cells treated with 5µM staurosporine (STS) were used as a positive control. Stained cells were measured immediately with a BD FACS Canto II flow cytometer. All FACS data were analyzed with Kaluza software (Beckman Coulter, Brea, CA). Quadrant cutoffs were determined from saline/saline (Sal/Sal) treated cells (negative control) and STS-treated cells (positive control).
Assessment of DNA strand breaks and total DNA content.
One of the later steps in apoptosis is endonuclease-mediated degradation of higher order chromatin structure into fragments. Loss of DNA fragments from the cell results in hypodiploid cells (cells with DNA content less than normal diploid cells in G1 phase of the cell cycle). Measuring hypodiploid cells is an alternative way to assess apoptotic cell death (Nicoletti et al., 1991). A terminal deoxy-nucleotidyl transferase dUTP nick end labeling (TUNEL) kit (Invitrogen) was used to detect DNA strand breaks and to assess total DNA content. Briefly, Hepa1c1c7 cells treated with AMD and/or TNF for the designated time were harvested using trypsin and then fixed in 4% formaldehyde for 30min at room temperature. The cells were then stored in 70% ethanol at −20°C overnight for permeabilization. The TUNEL reaction was performed at 4°C overnight by addition of reaction mixtures containing bromodeoxyuridine (BrdU) and terminal deoxynucleotidyl transferase (TdT) per the kit instruction. After washing with PBS, the cells were incubated with Alexa Fluor 647-labeled mouse monoclonal antibody to BrdU, then with PI. PI was used to determine the total DNA content in each cell. Stained cells were measured immediately with a BD FACS Canto II flow cytometer. All FACS data were analyzed with Kaluza software. The threshold for TUNEL staining was determined according to the positive and negative control cells provided in the kit. Gating for the hypodiploid cells was determined according to Sal/Sal-treated cells stained with or without PI.
Visualization of cell morphology with modified Wright’s stain.
Hepa1c1c7 cells were plated in 10-mm culture wells at 750,000 cells per well and allowed to attach for 8h before medium was replaced with medium containing AMD and/or TNF. After 48h, cells were washed three times with PBS, fixed with 4% formaldehyde, and stained with modified Wright’s stain. The stained cells were examined using light microscopy.
Determination of caspase activity.
The Caspase-Glo8, Caspase-Glo9, and Caspase-Glo3/7 assays (Promega) were used to measure the activities of caspase 8, 9, and 3/7, respectively. The cells were treated in 96-well plates under conditions described in the figure legend, and addition of the assay reagent resulted in cell lysis, cleavage of the substrates, and generation of luminescence. The luminescent signal was measured in a SpectraMax Gemini fluorescent plate reader (Molecular Devices, Sunnyvale, CA).
Caspase inhibitors study.
Caspase inhibitors or their vehicles were added to AMD- and/or TNF-containing medium for Hepa1c1c7 cell treatment: 40µM pan caspase inhibitor z-VAD-FMK (R&D System), 20µM caspase 9 inhibitor z-LEHD-FMK (R&D System), or 40µM caspase 3/7 inhibitor Ac-DEVD-CHO (Calbiochem, La Jolla, CA). The effectiveness of these caspase inhibitors at the doses used has been demonstrated in Hepa1c1c7: z-VAD-FMK (Asare et al., 2009; Podechard et al., 2011; Shaw et al., 2009); z-LEHD-FMK (Kern et al., 2006; Wang et al., 2008); Ac-DEVD-CHO (Kim et al., 2007; Kwon et al., 2002, 2005). After 48h incubation, cytotoxicity was assessed by measuring LDH release as described above.
Evaluation of intracellular ROS.
ROS generation was assessed by fluorescence microscopy of cells in culture to avoid artifactual changes in ROS due to trypsinization of cells and to allow visualization of the subcellular distribution of ROS generation. CM-H2DCFDA (5-[and-6]-chloromethyl-2',7' -dichlorodihydrofluorescein diacetate, acetyl ester) (Invitrogen) was used. Hepa1c1c7 cells were plated in four-well Lab-Tek II chambered cover glass (Nalge Nunc International, Rochester, NY) at 15,000 cells per well and allowed to attach for 8h before medium was replaced. After treating with AMD and/or TNF for the times indicated, the cells were washed in PBS and stained with 10µM CM-H2DCFDA for 20min in Hanks’ Balanced Salt Solution (HBSS). After one wash with HBSS, cells were photographed on an Olympus IX71 inverted fluorescent microscope, using green fluorescence filter sets: excitation 480±30nm, emission 535±40nm. Quantification of positive 2',7'-dichlorofluorescein (DCF) fluorescence was performed using Image J software and is expressed as the integrated intensity, which accounts for both the number of pixels and the intensity of each pixel. At least 10 randomly chosen microscope fields per well were measured, and the average was calculated as one replicate.
Treatment with water-soluble antioxidants.
6-Hydroxy-2,5,7,8-tetramethylchromane-2-carboxylic acid (trolox) is a water-soluble analogue of α-TOCO. GSH is a major endogenous antioxidant produced by cells. NAC is a source of sulfhydryl groups and stimulates GSH regeneration. ASC is a water-soluble antioxidant. Trolox (400µM), GSH (1mM), NAC (1mM), or ASC (2mM) was added to the medium at the same time as AMD and/or TNF. After 48h incubation, percent LDH release was measured as described above.
Evaluation of lipid peroxidation.
BODIPY (C11-BODIPY581/591) (Invitrogen) is a fluorescent probe used to detect lipid peroxidation in living cells, with excellent spectral separation of the nonoxidized (595nm) and oxidized (520nm) forms. Hepa1c1c7 cells were plated in four-well, Lab-Tek II-chambered cover glass and treated with AMD and/or TNF as indicated in figure legends. After incubation, cells were washed with PBS and stained with 20µM BODIPY in HBSS for 30min. For the assessment of lipid peroxidation, images of the BODIPY-labeled cells were captured using an Olympus IX71 inverted fluorescence microscope, with green fluorescence filter sets: excitation 480±30nm, emission 535±40nm. Quantification of fluorescence was performed according to the method described above for ROS and is expressed as integrated intensity.
Treatment with a lipid-soluble antioxidant.
α-TOCO (vitamin E) is a lipid-soluble free radical scavenger. Because lipid peroxyl radicals react more rapidly with TOCO than with polyunsaturated fatty acids, TOCO can terminate the chain reactions of lipid peroxidation and thereby protect cellular membrane systems (Traber, 2007). TOCO was included, at the concentrations indicated, in the incubation medium together with AMD and/or TNF. ROS generation, lipid peroxidation, LDH release, and caspase 3/7 activation were measured as described above.
Statistical analyses.
The results are expressed as means ± SEM. Two-way or three-way ANOVA was applied as appropriate; Tukey’s method was employed as a post hoc test. At least three biological repetitions (cells grown at different passages or started from different frozen batches) were performed for each experiment. P < 0.05 was set as the criterion for statistical significance.
RESULTS
Concentration-Response and Time Course of TNF Potentiation of AMD-Induced Apoptotic Cell Death
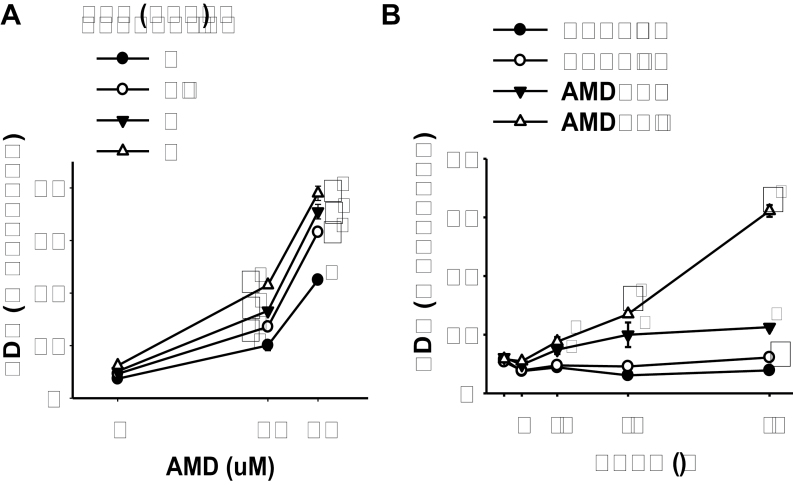
Given that cotreatment with AMD and LPS caused hepatotoxicity in both rats (Lu et al., 2012) and mice (Supplementary fig. 1), the murine hepatoma cell line Hepa1c1c7 was chosen for initial evaluation. Hepa1c1c7 cells were treated with various concentrations of AMD and/or TNF for 48h. TNF alone at concentrations up to 3ng/ml (176pM) did not cause any increase in LDH release. AMD induced cytotoxicity at both 30 and 40µM. TNF cotreatment significantly increased the cytotoxicity caused by AMD at all concentrations of AMD and of TNF tested (Fig. 1A). Concentrations of 35µM AMD and 3ng/ml TNF were chosen for subsequent experiments. AMD-induced cytotoxicity was apparent by 12h and increased only slightly through 48h. TNF potentiation of AMD-induced cytotoxicity started by 24h and continued to increase through 48h (Fig. 1B).
FIG. 1.
TNF potentiation of AMD cytotoxicity.
(A) Hepa1c1c7 cells were treated with AMD and TNF at the concentrations indicated. After 48h incubation, the release of LDH was determined as described in Materials and Methods section. (B) Hepa1c1c7 cells were treated with 35µM AMD and/or 3ng/ml TNF, and the release of LDH was measured at the indicated times. Data were analyzed by two-way ANOVA; for Panel B, data were compared within each time point. *Significantly different from the same treatment without TNF. #Significantly different from the same treatment without AMD. Significant interaction between AMD and TNF was observed for all TNF concentrations. p < 0.05, n = 4–6.
Similar results were observed in human HepG2 cells (Supplementary fig. 2), although the response to AMD alone and potentiation by TNF were less robust. In addition, the concentrations effective in the Hepa1c1c7 cells were more relevant to the concentrations of AMD and TNF that interacted to produce hepatotoxicity in the rat model (Lu et al., 2012) as well as those observed in human patients (Pollak et al., 2000). Accordingly, subsequent studies were conducted using Hepa1c1c7 cells.
AnnV/PI Staining After AMD and/or TNF Treatment
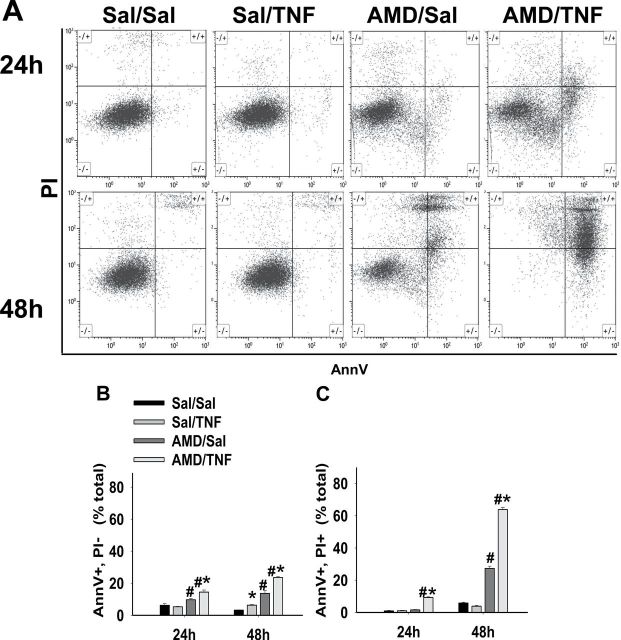
AnnV/PI, TUNEL, and modified Wright’s staining were employed to differentiate the cell death pathways in this model of AMD/TNF-mediated cytotoxicity. For the AnnV/PI staining, representative dot plots from flow cytometric analysis of cells treated with AMD and/or TNF are shown in Figure 2A. Cells treated with Sal/Sal distributed mainly in the AnnV−/PI− quadrant and remained unchanged from 24 to 48h. Similar findings were observed in Sal/TNF-treated cells. Cells treated with AMD/Sal or AMD/TNF distributed less in the AnnV−/PI− quadrant and more in the AnnV+/PI− and AnnV+/PI+ quadrants. A trend of cells moving from AnnV−/PI− to AnnV+/PI− and eventually to AnnV+/PI+ quadrant from 24 to 48h was observed after AMD/Sal and AMD/TNF treatments. A small percentage of cells appeared in the AnnV−/PI+ quadrant: this percentage was similar in all treatment groups at both time points, indicating that this quadrant of cells was not affected by treatment.
FIG. 2.
AnnV/PI staining after AMD and/or TNF treatment.
Hepa1c1c7 cells were exposed to 35µM AMD and/or 3ng/ml TNF for 24 or 48h and then stained with AnnV and PI as described in Materials and Methods section. Quadrant cutoffs were determined from Sal/Sal-treated cells (negative control) and STS-treated cells (positive control). (A) Representative dot plots at 24 and 48h. (B) Percent of AnnV+/PI− cells. (C) Percent of AnnV+/PI+ cells. Two-way ANOVA was applied at each time point. *Significantly different from the same treatment without TNF. #Significantly different from the same treatment without AMD. p < 0.05, n = 4.
Percentages of cells distributed in AnnV+/PI− and AnnV+/PI+ quadrants were calculated and plotted in Figure 2B. The percent of Sal/Sal-treated cells in these two quadrants was small (< 7%) at both times. Treatment with Sal/TNF did not change the percentage of the AnnV+/PI− cells or the AnnV+/PI+ cells. At 24h, AMD/Sal treatment caused a slight increase in AnnV+/PI− cells but did not affect the percentage of AnnV+/PI+ cells. At 48h, AMD/Sal increased the percent of both AnnV+/PI− cells and AnnV+/PI+ cells. TNF enhanced the AMD-induced elevation of AnnV+/PI− cells and AnnV+/PI+ cells at both times.
DNA Strand Breaks and Total DNA Content Assessment After AMD and/or TNF Treatment
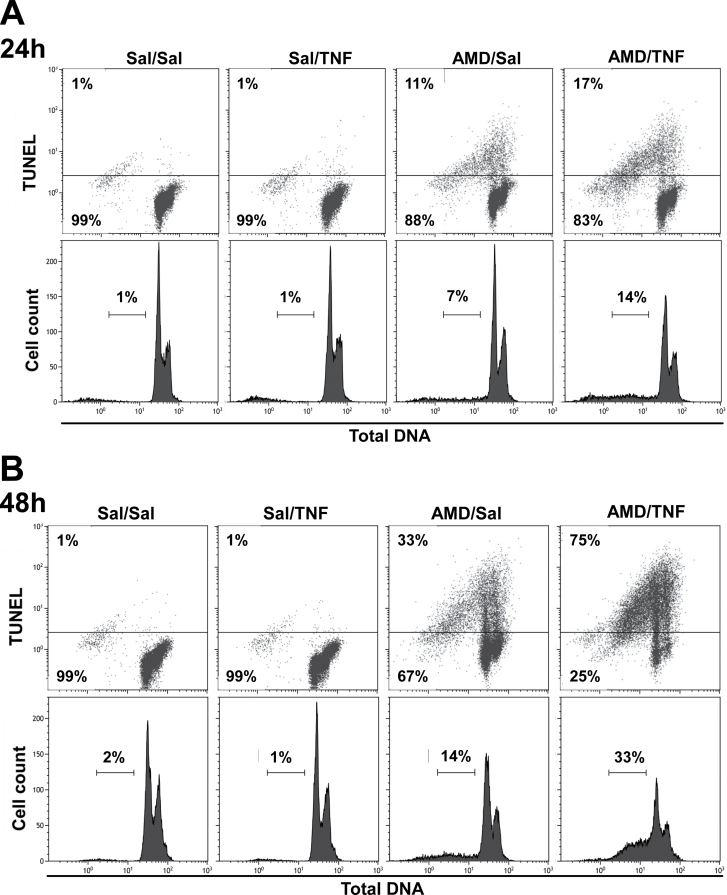
Dot plots for TUNEL staining versus total DNA content and corresponding histograms for total DNA content in Hepa1c1c7 cells treated with AMD and/or TNF are shown in Figure 3. Very few TUNEL-positive cells were observed in the Sal/Sal and Sal/TNF treatment groups (< 2%) at either 24 or 48h. AMD alone increased the percentage of TUNEL-positive cells at 24h (~11%) and 48h (~33%), and TNF cotreatment significantly enhanced these values (17% at 24h and 75% at 48h). A similar trend was observed in the percentage of hypodiploid cells. Sal/Sal- and Sal/TNF-treated groups had very few of these cells (< 2%). TNF cotreatment enhanced the AMD-induced effect to increase the percentage of hypodiploid cells at both 24h (7 to 14%) and 48h (14 to 33%).
FIG. 3.
TUNEL staining after AMD and/or TNF treatment.
Hepa1c1c7 cells were exposed to 35µM AMD and/or 3ng/ml TNF for 24 or 48h and then stained with TUNEL as described in Materials and Methods section. Dot plots (TUNEL vs. Total DNA) and corresponding histogram plots (cell count vs. total DNA) at 24h (A) and 48h (B).
AMD/TNF-Induced Morphological Changes in Hepa1c1c7 Cells
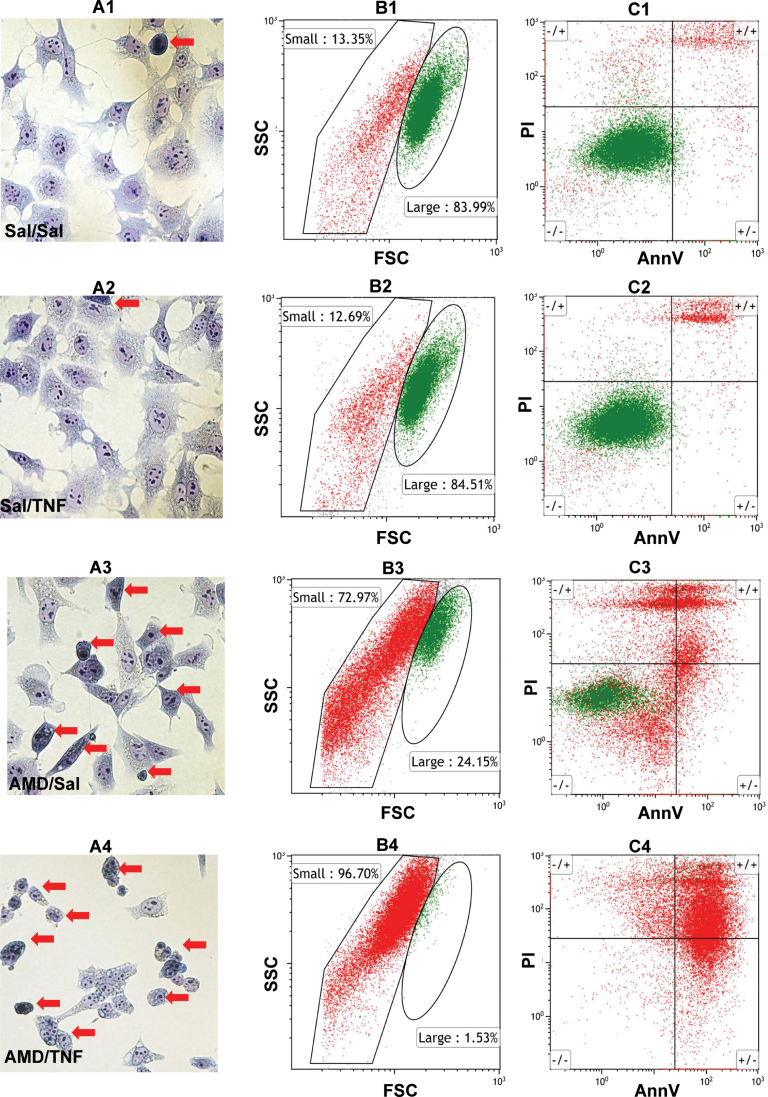
Morphological changes after 48h treatment with AMD and/or TNF were observed in cells stained with modified Wright’s stain (Figs. 4A1–4A4). The majority of the Sal/Sal-treated cells were stellate-shaped with small nucleus-to-cytoplasm ratio and prominent nucleoli. A very small portion (red arrow) of the Sal/Sal-treated cells were smaller in size and relatively round-shaped (less stellate), with a large nucleus-to-cytoplasm ratio, darkly stained cytoplasm and indistinct nucleoli (Fig. 4A1). Similar observations were found in Sal/TNF-treated cells (Fig. 4A2). In the AMD/Sal-treated group, there was an obvious decrease in the number of larger, normally stained, stellate-shaped cells and an increase in the smaller, darkly stained, round-shaped cells (Fig. 4A3). In the AMD/TNF-treated group, most of the cells were smaller, darkly stained, and round-shaped (Fig. 4A4).
FIG. 4.
Morphological changes after AMD and/or TNF treatment.
Hepa1c1c7 cells were treated with 35µM AMD and/or 3ng/ml TNF for 48h. (A) Cells were stained by modified Wright’s method as described in Materials and Methods section. Images from light microscopy were collected. Red arrows denote cells with smaller size, round-shape (less stellate), a larger nucleus-to-cytoplasm ratio, darkly stained cytoplasm and less distinct nucleoli. (B) and (C) Cells were stained with AnnV/PI as described in Materials and Methods section. (B) Dot plots for FSC versus SSC. Gates distinguishing the small (RED) and large (GREEN) subgroups were drawn based on Sal/Sal treatment. (C) Dot plots for AnnV versus PI. Quadrant cutoffs were determined from Figure 2. GREEN and RED colors were derived from corresponding groups in plot B (Row1, Sal/Sal; Row2, Sal/TNF; Row3, AMD/Sal; Row4, AMD/TNF).
Cell size and granularity changes were assessed from flow cytometry plots of forward scatter (FSC) versus side scatter (SSC) (Figs. 4B1–4B4). Two populations of cells were observed: the population indicated in green in Figure 4 had greater FSC readings, indicating a larger cell size. The population indicated in red in Figure 4 had a lesser FSC reading, indicating a smaller cell size. Moreover, part of the “red” population showed decreased SSC reading, indicating that some cells in this population were losing their granularity. According to their size, granularity, and relative abundance, we postulated that the “green” population represented the larger, normally stained, stellate cells shown in Panel 4A, and the red population represented the smaller, darkly stained, round cells identified by red arrows in Panel 4A.
The distribution of red and green populations in AnnV/PI plots was also analyzed (Figs. 4C1–4C4). The majority (~84%) of the Sal/Sal-, Sal/TNF-treated cells localized to the green population, and they appeared AnnV−/PI−, suggesting these were viable cells. A small portion of the Sal/Sal-, Sal/TNF-treated cells localized to the red population, and these were mostly AnnV+/PI+ (Figs. 4B1, C1, B2, and C2). In the AMD/Sal-treated group, a smaller percentage of cells was in the green group (24%) compared with the red population (73%) (Fig. 4B3). The green population in this group appeared AnnV−/PI−. The red population distributed in AnnV−/PI−, AnnV+/PI−, and AnnV+/PI+ quadrants (Fig. 4C3), suggesting that they were transitioning through stages of the cell death process (healthy, early apoptosis, or late apoptosis/necrosis). In the AMD/TNF-treated group, the green population was almost absent (1.5%), and the majority of the cells were in the red population (Fig. 4B4). They were located in both AnnV+/PI− and AnnV+/PI+ quadrants (Fig. 4C4), indicating that they were in the early apoptotic or late apoptotic/necrotic stages of cell death process.
Activation of Caspases and Effect of Caspase Inhibitors
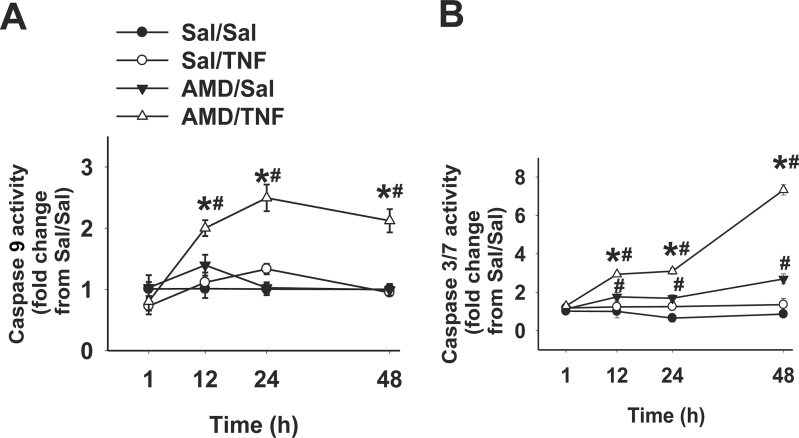
Activities of caspase 8, 9, and 3/7 were measured after 1, 12, 24, and 48h of incubation. Caspase 9 activity was unaffected by treatment with AMD or TNF alone (Fig. 5A). Cotreatment with AMD/TNF caused a twofold increase in caspase 9 activity by 12h that was sustained through 48h. AMD alone caused a less than twofold increase in caspase 3/7 activity from 12 through 48h (Fig. 5B). TNF alone did not affect caspase 3/7 activity but greatly increased caspase 3/7 activation caused by AMD. The AMD/TNF-induced increase in caspase 3/7 activity remained about threefold from 12 to 24h and reached sevenfold by 48h (Fig. 5B). Caspase 8 activity was unchanged by any of the treatments at any time (Supplementary fig. 3).
FIG. 5.
Activities of caspases after AMD and/or TNF treatment.
Hepa1c1c7 cells were treated with 35µM AMD and/or 3ng/ml TNF for 1, 12, 24, or 48h, and activities of caspase 9 (A) and caspase 3/7 (B) were measured as described in Materials and Methods section. Results were presented as fold changes from Sal/Sal group. Data within each time point were analyzed by two-way ANOVA. *Significantly different from the same treatment without TNF. #Significantly different from the same treatment without AMD. p < 0.05, n = 3–5.
The effects of three different caspase inhibitors on AMD/TNF-induced cytotoxicity were evaluated (Fig. 6). Without the caspase inhibitors, baseline LDH release from Sal/Sal groups was around 20%. AMD alone or TNF alone caused a mild increase in LDH release (to ~30%), and AMD/TNF cotreatment enhanced LDH release (to ~70%). Caspase inhibitors did not cause any cytotoxicity by themselves and did not affect the cytotoxicity caused by AMD alone. z-VAD (pancaspase inhibitor) or Ac-DEVD (caspase 3/7 inhibitor) slightly attenuated the cytotoxicity caused by TNF alone. z-VAD, z-LEHD (caspase 9 inhibitor), or Ac-DEVD slightly decreased the AMD/TNF-induced LDH release by 5–10% (Figs. 6A–6C).
FIG. 6.
Effect of caspase inhibition on AMD/TNF-induced cytotoxicity.
Hepa1c1c7 cells were treated with 35µM AMD and/or 3ng/ml TNF for 48h and with different caspase inhibitors or their vehicles: (A) 40µM pancaspase inhibitor z-VAD-FMK; (B) 20µM caspase 9 inhibitor z-LEHD-FMK; (C) 40µM caspase 3/7 inhibitor Ac-DEVD-CHO. LDH release was measured as described in Materials and Methods section. Three-way ANOVA was applied. *Significantly different from the same treatment without TNF. #Significantly different from the same treatment without AMD. @Significantly different from the same treatment without caspase inhibitor. p < 0.05, n = 3–6.
ROS Generation and Effect of Water-Soluble Antioxidants on AMD/TNF-Induced Cytotoxicity
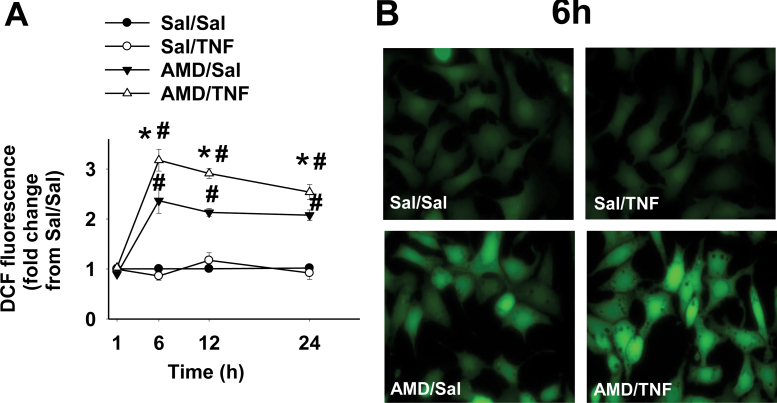
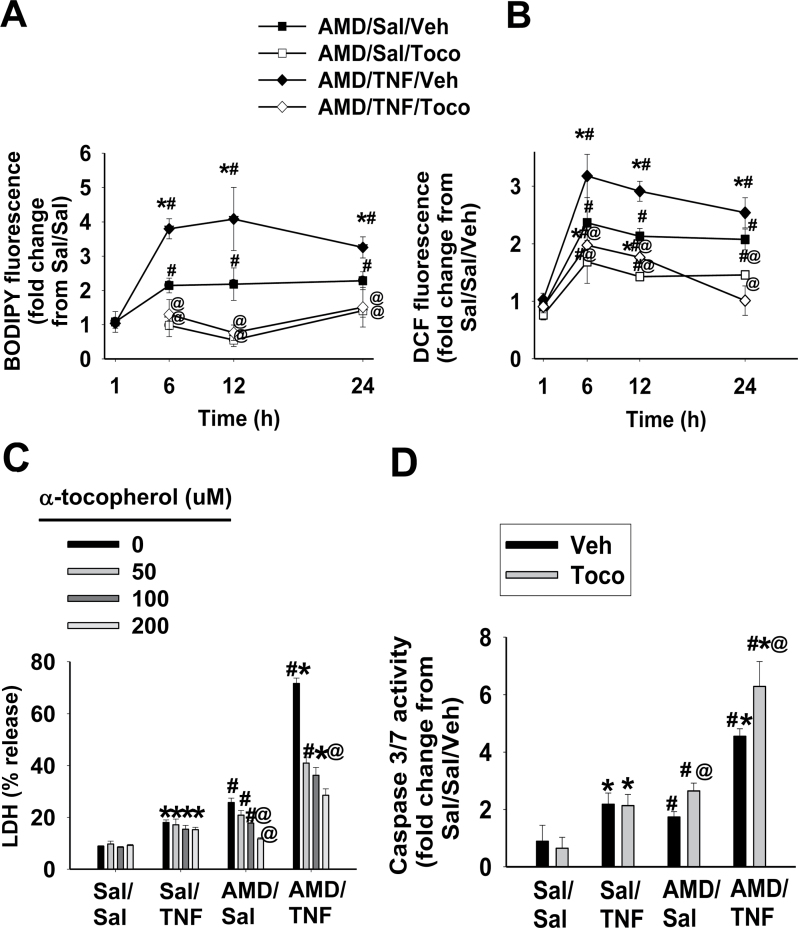
TNF alone did not cause an increase in ROS generation compared with Sal/Sal treatment (Fig. 7A). Elevated ROS production in the AMD-treated group started between 1 and 6h and remained at the same level through 24h. TNF potentiated AMD-induced ROS at all times from 6 through 24h. Representative fluorescence photomicrographs for each treatment group at 6h are shown in Figure 7B: bright green fluorescence from DCF was evenly spread throughout entire cells in AMD- and AMD/TNF-treated groups.
FIG. 7.
ROS generation in cells treated with AMD and/or TNF.
Hepa1c1c7 cells were treated with 35µM AMD and/or 3ng/ml TNF for 1, 6, 12, or 24h and stained with CM-H2DCFDA for intracellular ROS generation as described in Materials and Methods section. (A) DCF fluorescence presented as fold change from Sal/Sal group; (B) representative fluorescence photomicrographs for each treatment group at 6h. Data within each time point were analyzed by two-way ANOVA. *Significantly different from the same treatment without TNF. #Significantly different from the same treatment without AMD. p < 0.05, n = 3.
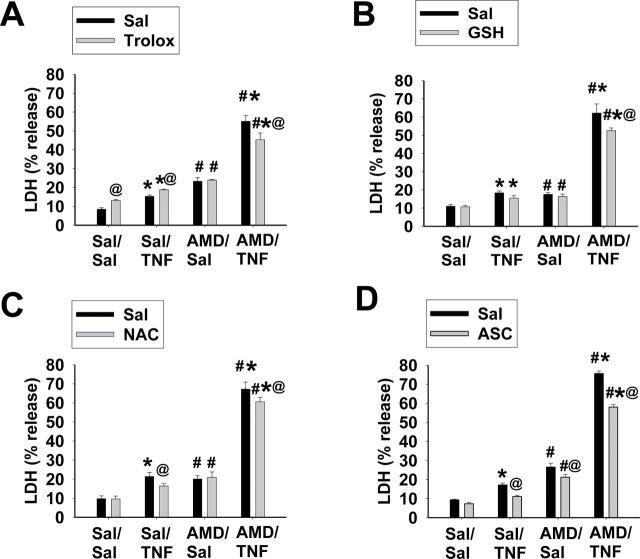
TNF alone or AMD alone caused minor LDH release, whereas TNF/AMD cotreatment caused a more pronounced increase (Fig. 8). Water-soluble antioxidants caused very minor changes in Sal/Sal-, Sal/TNF-, or AMD/Sal-induced LDH release. Trolox slightly increased LDH release from Sal/Sal and Sal/TNF treatments; NAC decreased LDH release from Sal/TNF treatment; and ASC decreased LDH release from Sal/TNF and AMD/Sal treatments. All four water-soluble antioxidants decreased AMD/TNF-induced LDH release, but the decreases were minor (5–10%).
FIG. 8.
Effect of water-soluble antioxidants on AMD/TNF-induced cytotoxicity.
Hepa1c1c7 cells were treated with 35µM AMD and/or 3ng/ml TNF for 48h in the presence of different water-soluble antioxidants or saline: (A) 400µM trolox; (B) 1mM GSH; (C) 1mM N-acetylcysteine (NAC); and (D) 2mM l-ASC. LDH release was measured as described in Materials and Methods section. Three-way ANOVA was applied. *Significantly different from respective groups not given TNF. #Significantly different from the same treatment without AMD. @Significantly different from the same treatment without antioxidant. p < 0.05, n = 3–6.
Lipid Peroxidation and the Effect of Lipid-Soluble Antioxidant on AMD/TNF-Induced Cytotoxicity
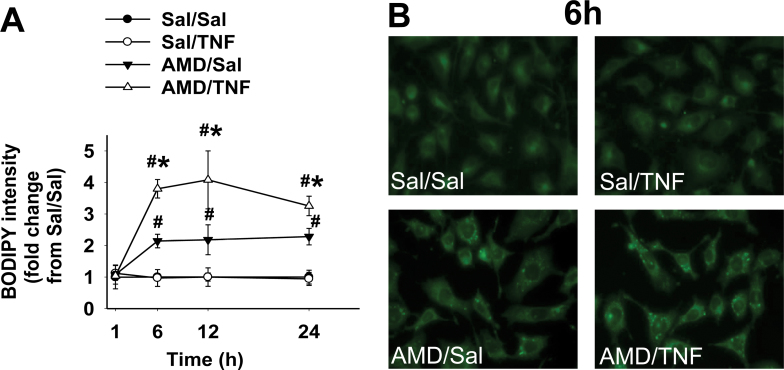
Lipid peroxidation was assessed by measuring changes in BODIPY fluorescence (Fig. 9A). TNF alone did not increase BODIPY fluorescence compared with Sal/Sal treatment. AMD alone caused a twofold increase by 6h, which was sustained through 24h. TNF enhanced AMD-induced changes in BODIPY fluorescence from 6 through 24h. Representative images at 6h are presented in Figure 9B. Sal/Sal- and Sal/TNF-treated cells were dim and homogeneous. Intracellular bright spots with greater intensity were seen after treatment with AMD alone, and these were more pronounced in AMD/TNF-treated cells.
FIG. 9.
Lipid peroxidation in cells treated with AMD and/or TNF.
Hepa1c1c7 cells were exposed to 35µM AMD and/or 3ng/ml TNF for 1, 6, 12, or 24h and stained with C11-BODIPY581/591 as described in Materials and Methods section. The fluorescence from oxidized BODIPY was quantified as an indication of lipid peroxidation. (A) Fluorescence from oxidized BODIPY represented as fold changes from Sal/Sal group; (B) representative fluorescence photomicrographs for each treatment at 6h. Data within each time point were analyzed by two-way ANOVA. *Significantly different from the same treatment without TNF. #Significantly different from the same treatment without AMD. p < 0.05, n = 3.
Lipid peroxidation and ROS generation were quantified after the addition of the lipid-soluble antioxidant, TOCO. Lipid peroxidation was not observed in Sal/Sal- and Sal/TNF-treated cells, and addition of TOCO was without effect (data not shown). In AMD/Sal and AMD/TNF groups, elevation of lipid peroxidation (BODIPY fluorescence) was observed at 6, 12, and 24h (Fig. 9A). Accordingly, the effect of TOCO on lipid peroxidation was assessed at these times. The lipid peroxidation caused by AMD alone and by AMD/TNF was completely prevented by addition of TOCO (Fig. 10A). There was no ROS generation in the absence of AMD and no change with TOCO (data not shown). TOCO attenuated the ROS generation in cells treated with AMD alone or AMD/TNF (Fig. 10B).
FIG. 10.
Protective effect of α-TOCO on AMD/TNF-induced cytotoxicity.
Hepa1c1c7 cells were treated with 35µM AMD and/or 3ng/ml TNF, together with α-TOCO (100µM) or its vehicle. After incubation for the indicated time, ROS generation (A) and lipid peroxidation (B) were measured as described in Materials and Methods section. (C) TOCO was added to the medium at the concentrations indicated, and LDH release was measured after 48h. (D) TOCO (100µM) or vehicle was added to the medium, and caspase 3/7 activity was measured after 48h. Three-way ANOVA was applied. *Significantly different from the same treatment without TNF. #Significantly different from the same treatment without AMD. @Significantly different from the same treatment without antioxidant. p < 0.05, n = 3–5.
The effects of TOCO on AMD- and/or TNF-induced cytotoxicity were evaluated at 48h (Fig. 10C). TOCO, at concentrations of 100 and 200µM, significantly reduced (40–90%) the cytotoxicity caused by AMD alone. At concentrations of 50–200µM, TOCO diminished AMD/TNF-induced cytotoxicity by 40–60%.
The effect of TOCO on caspase 3/7 activation was measured at 48h (Fig. 10D). TOCO did not affect the minor activation of caspase 3/7 caused by TNF alone, but it slightly increased the activation of caspase 3/7 in cells treated with either AMD alone or AMD/TNF. The result that TOCO did not reduce the caspase 3/7 activity suggested that TOCO did not attenuate AMD/TNF cytotoxicity through inactivation of caspase cascades. Therefore, the effect of TOCO on caspase 9, which is upstream of caspase 3/7, was not evaluated.
Effect of Combined Inhibition of Caspase Activation and Lipid Peroxidation on AMD/TNF-Induced Cytotoxicity
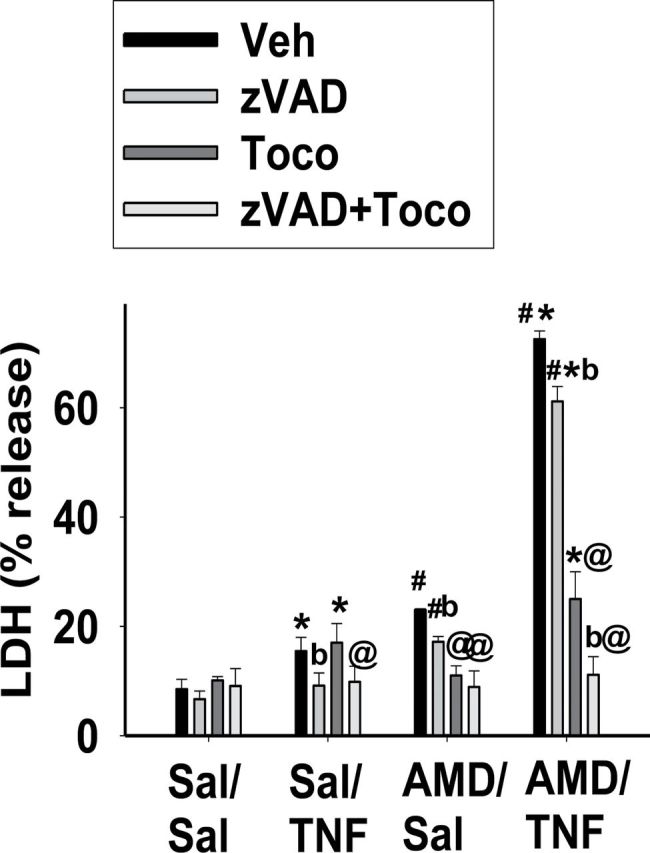
The effect of combined treatment with TOCO and z-VAD was explored at 48h in cells treated with AMD and/or TNF. As seen in Figure 11, z-VAD slightly attenuated the cytotoxicity caused by TNF alone or AMD alone. TOCO abolished the cytotoxicity of AMD alone, but did not affect the cytotoxicity of TNF. Combination of the two completely abolished the cytotoxicity caused by AMD/TNF, in which TOCO provided a major contribution, and z-VAD contributed less to the reduction.
FIG. 11.
Effect of α-TOCO and pancaspase inhibition on AMD/TNF-induced cytotoxicity.
Cells were treated with 35µM AMD and/or 3ng/ml TNF, and TOCO (100µM) and/or z-VAD (40µM) were added to the incubation medium. After 48h, LDH release was measured as described in Materials and Methods section. Two-way ANOVA was applied. *Significantly different from the same treatment without TNF. #Significantly different from the same treatment without AMD. @Significantly different from the same treatment without TOCO. bSignificantly different from the same treatment without z-VAD. p < 0.05, n = 3–4.
DISCUSSION
In our rodent studies, AMD/LPS cotreatment induced liver injury both in mice (Supplementary fig. 1) and rats (Lu et al., 2012). Further studies revealed that TNF is necessary for liver injury caused by AMD/LPS cotreatment in rats (Lu et al., 2012). In studies presented here, the interaction between AMD and TNF leading to cell death was investigated in a cell culture system. It has been reported that AMD caused cytotoxicity in primary hepatocytes (Kaufmann et al., 2005; Ruch et al., 1991) and hepatoma cell lines (Golli-Bennour et al., 2012; Shojiro et al., 2004) at concentrations relevant to those observed in vivo. Similar cell death pathways, e.g. mitochondrial dysfunction and oxidative stress, were triggered in primary cells and cell lines. Similarly, in our studies, AMD alone was cytotoxic to Hepa1c1c7 cells at clinically relevant concentrations (Fig. 1), and interestingly, TNF enhanced this cytotoxicity.
TNF administered together with certain other agents causes death in many cell types, including hepatocytes (Leist et al., 1994). TNF induces cell death mainly through an apoptotic pathway (Hentze et al., 2004; Jones et al., 2000). On the other hand, AMD induces cell death through pathways that vary among different cell types (Kaufmann et al., 2005; Mulder et al., 2011). Activation of caspases, TUNEL-positive staining, and observation of hypodiploid cells (Figs. 2, 23, and 5) suggested that apoptosis occurred in cells treated with AMD alone or with AMD/TNF. Morphological changes, such as cytosolic shrinkage and nuclear fragmentation, supported this interpretation (Fig. 4). Similar findings were reported in AMD-treated (100µM, 8h) rat hepatocytes, in which cytochrome C release, chromatin condensation, chromatin fragmentation, and AnnV+/PI+ staining all suggested an apoptotic cell death pathway (Kaufmann et al., 2005). However, both AnnV+/PI+ and TUNEL-positive staining can be observed in necrotic cells; therefore, the possibility of some level of oncotic cell death related to treatment cannot be eliminated.
The observation that cells in vitro die by apoptotic pathways differs from the results of the LPS/AMD model in vivo, in which TNF played a critical role but oncotic necrosis was the primary observation (Lu et al., 2012). The mode of cell death can be controlled by a variety of factors, e.g. pO2, cellular ATP (energy status), cytokines, etc. In many of the studies in vitro using primary rat or mouse hepatocytes, AMD caused only apoptosis (Kaufmann et al., 2005) or both necrosis and apoptosis (Ouazzani-Chahdi et al., 2007; Waldhauser et al., 2006). Therefore, although differences were observed between the rat model in vivo and studies in vitro in Hepa1c1c7 cells, these differences do not necessarily preclude this study from providing mechanistic information about the intracellular interaction between TNF and AMD.
Apoptosis induced by TNF in the presence of an inhibitor of NF-κB or an inhibitor of transcription has been associated with activation of caspases 8 and 3/7 (Jones et al., 1999). AMD can also induce caspases 8 and 3/7 in a variety of cell types (Isomoto et al., 2006; Yano et al., 2008). In hepatocytes, activated caspase 8 uses a mitochondrial pathway to activate downstream caspase 9 or 3/7 (Wullaert et al., 2007). Activated caspase 8 can cleave the BH3-interacting domain death agonist (BID) into its truncated and active form, tBID, which in turn leads to release of cytochrome C and other proapoptotic mediators from mitochondria. These mitochondrial factors can then activate caspase 9 and eventually caspase 3/7. In this study, caspases 9 and 3/7 were activated after AMD/TNF cotreatment, whereas caspase 8 was not (Fig. 5, Supplementary fig. 3). Mitochondrial damage, which is the bridging step between activation of caspase 8 and of caspase 9 in TNF-induced apoptosis (Wullaert et al., 2007), is the most probable locus where AMD and TNF had interaction.
Inhibition of caspase activation attenuated cell death in Type II pneumocytes exposed to AMD (Bargout et al., 2000) and in a hepatocyte cell line exposed to TNF in the presence of an inhibitor of NF-κB (Jones et al., 1999). These results contrast with those presented here in which a pancaspase inhibitor did not affect the AMD-induced cytotoxicity and had only a minor effect against the cytotoxicity caused by AMD/TNF. Similarly, inhibitors of caspases 9 and 3/7 had little effect on the cytotoxicity of AMD/TNF (Fig. 6). These results suggest that caspase activation plays a minor role in AMD/TNF-induced cytotoxicity. Although we speculate that enhanced mitochondrial alterations were the cause of downstream caspase activation, it is possible that other effectors from mitochondrial damage, e.g., ROS generation, act as major contributors to AMD/TNF-induced cytotoxicity.
In hepatocytes, increased ROS production is important to the cytotoxic effect of TNF, and the respiratory chain on the inner membrane of mitochondria is the major source of TNF-induced ROS (Corda et al., 2001). The cytotoxicity of AMD is also linked to its ability to alter mitochondrial function and induce ROS generation. AMD can inhibit both complex I- and II-mediated respiration (Bolt et al., 2001), induce mitochondrial swelling and permeability transition (Varbiro et al., 2003), and decrease mitochondrial membrane potential (Yano et al., 2008). In this study, TNF alone did not induce ROS production, but it significantly potentiated the ROS generation caused by AMD (Fig. 7). There are a variety of pathways in mitochondria that can lead to degradation or dismutation of normally generated ROS (Feissner et al., 2009). It is possible that TNF caused a small increase in ROS that was rapidly inactivated by the mitochondrial antioxidative enzymes.
The observation that water-soluble antioxidants caused only a small reduction in AMD/TNF-induced cytotoxicity (Fig. 8) suggested that water-soluble oxidants played a minor role in this cytotoxicity. TNF enhanced AMD-induced lipid peroxidation (Fig. 9), and the major protective role of a lipid-soluble radical scavenger (TOCO) (Fig. 10) suggested that radicals generated from peroxidized lipids were major contributors to the cytotoxicity. The protective effect of TOCO on AMD-induced cytotoxicity was also observed in human peripheral lung epithelial HPL1A cells (Nicolescu et al., 2008), suggesting that AMD might work by similar mechanisms in these two cell types.
It has been reported by Honegger et al. (1995) and Scuntaro et al. (1996) that TOCO reduces the accumulation of AMD in fibroblasts. In both studies, 50µM TOCO caused a significant (~60%) reduction of AMD accumulation after 8 days in culture but less than 10% reduction at day 2. In our study, 50µM TOCO reduced TNF/AMD-induced cytotoxicity by 60% at day 2 (Fig. 10C). Therefore, the effect of TOCO in our study is unlikely to be explained by reduced accumulation of AMD in the cells.
As is shown in Figure 5B, the greatest increase in activity of caspase 3/7 was observed at 48h in both AMD/TNF and AMD/Sal groups. Based on this time course, 48h was selected as the time to measure the effect of TOCO on caspase 3/7 activation. The observation that TOCO significantly reduced cell death without reducing the activation of caspase 3/7 at its peak time suggests that lipid peroxidation contributed to AMD/TNF-induced cell death independently of caspase 3/7 activation. Treatment with TOCO and the pancaspase inhibitor together led to full protection against AMD/TNF-induced cytotoxicity (Fig. 11), suggesting that lipid peroxidation and activation of caspases contribute to AMD/TNF-induced cytotoxicity, probably through different pathways.
In summary, TNF cotreatment potentiated the cytotoxicity induced by AMD in Hepa1c1c7 cells. Enhanced activation of caspases and lipid peroxidation were two separate contributors to AMD/TNF-induced cytotoxicity, and lipid peroxidation played a major role. These findings increase our understanding of the intracellular events that contribute to the potentiation of AMD cytotoxicity by TNF, a phenomenon that might underlie AMD-induced idiosyncratic liver injury in humans.
SUPPLEMENTARY DATA
Supplementary data are available online at http://toxsci.oxfordjournals.org/.
FUNDING
National Institutes of Health (NIH) (R01DK061315).
Supplementary Material
ACKNOWLEDGMENT
The authors are grateful to Nicole Crisp for technical assistance in flow cytometry.
REFERENCES
- Asare N., Tekpli X., Rissel M., Solhaug A., Landvik N., Lecureur V., Podechard N., Brunborg G., Låg M., Lagadic-Gossmann D, et al. (2009). Signalling pathways involved in 1-nitropyrene (1-NP)-induced and 3-nitrofluoranthene (3-NF)-induced cell death in Hepa1c1c7 cells. Mutagenesis 24, 481–493. [DOI] [PubMed] [Google Scholar]
- Babatin M., Lee S. S., Pollak P. T. (2008). Amiodarone hepatotoxicity. Curr. Vasc. Pharmacol. 6, 228–236. [DOI] [PubMed] [Google Scholar]
- Bargout R., Jankov A., Dincer E., Wang R., Komodromos T., Ibarra-Sunga O., Filippatos G., Uhal B. D. (2000). Amiodarone induces apoptosis of human and rat alveolar epithelial cells in vitro. Am. J. Physiol. Lung Cell Mol. Physiol. 278, L1039–L1044. [DOI] [PubMed] [Google Scholar]
- Beutler B., Kruys V. (1995). Lipopolysaccharide signal transduction, regulation of tumor necrosis factor biosynthesis, and signaling by tumor necrosis factor itself. J. Cardiovasc. Pharmacol. 25(Suppl. 2)S1–S8. [DOI] [PubMed] [Google Scholar]
- Bolt M. W., Card J. W., Racz W. J., Brien J. F., Massey T. E. (2001). Disruption of mitochondrial function and cellular ATP levels by amiodarone and N-desethylamiodarone in initiation of amiodarone-induced pulmonary cytotoxicity. J. Pharmacol. Exp. Ther. 298, 1280–1289. [PubMed] [Google Scholar]
- Bradham C. A., Qian T., Streetz K., Trautwein C., Brenner D. A., Lemasters J. J. (1998). The mitochondrial permeability transition is required for tumor necrosis factor alpha-mediated apoptosis and cytochrome c release. Mol. Cell. Biol. 18, 6353–6364. [DOI] [PMC free article] [PubMed] [Google Scholar]
- Choi I. S., Kim B. S., Cho K. S., Park J. C., Jang M. H., Shin M. C., Jung S. B., Chung J. H., Kim C. J. (2002). Amiodarone induces apoptosis in L-132 human lung epithelial cell line. Toxicol. Lett. 132, 47–55. [DOI] [PubMed] [Google Scholar]
- Colell A., Coll O., García-Ruiz C., París R., Tiribelli C., Kaplowitz N., Fernández-Checa J. C. (2001). Tauroursodeoxycholic acid protects hepatocytes from ethanol-fed rats against tumor necrosis factor-induced cell death by replenishing mitochondrial glutathione. Hepatology 34, 964–971. [DOI] [PubMed] [Google Scholar]
- Corda S., Laplace C., Vicaut E., Duranteau J. (2001). Rapid reactive oxygen species production by mitochondria in endothelial cells exposed to tumor necrosis factor-alpha is mediated by ceramide. Am. J. Respir. Cell Mol. Biol. 24, 762–768. [DOI] [PubMed] [Google Scholar]
- Deng X., Stachlewitz R. F., Liguori M. J., Blomme E. A., Waring J. F., Luyendyk J. P., Maddox J. F., Ganey P. E., Roth R. A. (2006). Modest inflammation enhances diclofenac hepatotoxicity in rats: Role of neutrophils and bacterial translocation. J. Pharmacol. Exp. Ther. 319, 1191–1199. [DOI] [PubMed] [Google Scholar]
- Feissner R. F., Skalska J., Gaum W. E., Sheu S. S. (2009). Crosstalk signaling between mitochondrial Ca2+ and ROS. Front. Biosci. 14, 1197–1218. [DOI] [PMC free article] [PubMed] [Google Scholar]
- Fransen L., Van der Heyden J., Ruysschaert R., Fiers W. (1986). Recombinant tumor necrosis factor: Its effect and its synergism with interferon-gamma on a variety of normal and transformed human cell lines. Eur. J. Cancer Clin. Oncol. 22, 419–426. [DOI] [PubMed] [Google Scholar]
- Fromenty B., Fisch C., Berson A., Letteron P., Larrey D., Pessayre D. (1990a). Dual effect of amiodarone on mitochondrial respiration. Initial protonophoric uncoupling effect followed by inhibition of the respiratory chain at the levels of complex I and complex II. J. Pharmacol. Exp. Ther. 255, 1377–1384. [PubMed] [Google Scholar]
- Fromenty B., Fisch C., Labbe G., Degott C., Deschamps D., Berson A., Letteron P., Pessayre D. (1990b). Amiodarone inhibits the mitochondrial beta-oxidation of fatty acids and produces microvesicular steatosis of the liver in mice. J. Pharmacol. Exp. Ther. 255, 1371–1376. [PubMed] [Google Scholar]
- Golli-Bennour E. E., Bouslimi A., Zouaoui O., Nouira S., Achour A., Bacha H. (2012). Cytotoxicity effects of amiodarone on cultured cells. Exp. Toxicol. Pathol. 64, 425–430. [DOI] [PubMed] [Google Scholar]
- Hatano E., Bradham C. A., Stark A., Iimuro Y., Lemasters J. J., Brenner D. A. (2000). The mitochondrial permeability transition augments Fas-induced apoptosis in mouse hepatocytes. J. Biol. Chem. 275, 11814–11823. [DOI] [PubMed] [Google Scholar]
- Hentze H., Latta M., Künstle G., Dhakshinamoorthy S., Ng P. Y., Porter A. G., Wendel A. (2004). Topoisomerase inhibitor camptothecin sensitizes mouse hepatocytes in vitro and in vivo to TNF-mediated apoptosis. Hepatology 39, 1311–1320. [DOI] [PubMed] [Google Scholar]
- Honegger U. E., Scuntaro I., Wiesmann U. N. (1995). Vitamin E reduces accumulation of amiodarone and desethylamiodarone and inhibits phospholipidosis in cultured human cells. Biochem. Pharmacol. 49, 1741–1745. [DOI] [PubMed] [Google Scholar]
- Isomoto S., Kawakami A., Arakaki T., Yamashita S., Yano K., Ono K. (2006). Effects of antiarrhythmic drugs on apoptotic pathways in H9c2 cardiac cells. J. Pharmacol. Sci. 101, 318–324. [DOI] [PubMed] [Google Scholar]
- Jones B. E., Lo C. R., Liu H., Srinivasan A., Streetz K., Valentino K. L., Czaja M. J. (2000). Hepatocytes sensitized to tumor necrosis factor-alpha cytotoxicity undergo apoptosis through caspase-dependent and caspase-independent pathways. J. Biol. Chem. 275, 705–712. [DOI] [PubMed] [Google Scholar]
- Jones B. E., Lo C. R., Srinivasan A., Valentino K. L., Czaja M. J. (1999). Ceramide induces caspase-independent apoptosis in rat hepatocytes sensitized by inhibition of RNA synthesis. Hepatology 30, 215–222. [DOI] [PubMed] [Google Scholar]
- Jones K. H., Senft J. A. (1985). An improved method to determine cell viability by simultaneous staining with fluorescein diacetate-propidium iodide. J. Histochem. Cytochem. 33, 77–79. [DOI] [PubMed] [Google Scholar]
- Kaufmann P., Török M., Hänni A., Roberts P., Gasser R., Krähenbühl S. (2005). Mechanisms of benzarone and benzbromarone-induced hepatic toxicity. Hepatology 41, 925–935. [DOI] [PubMed] [Google Scholar]
- Kern M. A., Haugg A. M., Koch A. F., Schilling T., Breuhahn K., Walczak H., Fleischer B., Trautwein C., Michalski C., Schulze-Bergkamen H, et al. (2006). Cyclooxygenase-2 inhibition induces apoptosis signaling via death receptors and mitochondria in hepatocellular carcinoma. Cancer Res. 66, 7059–7066. [DOI] [PubMed] [Google Scholar]
- Kim J. Y., Chung J. Y., Park J. E., Lee S. G., Kim Y. J., Cha M. S., Han M. S., Lee H. J., Yoo Y. H., Kim J. M. (2007). Benzo[a]pyrene induces apoptosis in RL95-2 human endometrial cancer cells by cytochrome P450 1A1 activation. Endocrinology 148, 5112–5122. [DOI] [PubMed] [Google Scholar]
- Koopman G., Reutelingsperger C. P., Kuijten G. A., Keehnen R. M., Pals S. T., van Oers M. H. (1994). Annexin V for flow cytometric detection of phosphatidylserine expression on B cells undergoing apoptosis. Blood 84, 1415–1420. [PubMed] [Google Scholar]
- Kwon K. B., Kim E. K., Lim J. G., Jeong E. S., Shin B. C., Jeon Y. S., Kim K. S., Seo E. A., Ryu D. G. (2005). Molecular mechanisms of apoptosis induced by Scorpio water extract in human hepatoma HepG2 cells. World J. Gastroenterol. 11, 943–947. [DOI] [PMC free article] [PubMed] [Google Scholar]
- Kwon Y. W., Ueda S., Ueno M., Yodoi J., Masutani H. (2002). Mechanism of p53-dependent apoptosis induced by 3-methylcholanthrene: Involvement of p53 phosphorylation and p38 MAPK. J. Biol. Chem. 277, 1837–1844. [DOI] [PubMed] [Google Scholar]
- Leist M., Gantner F., Bohlinger I., Germann P. G., Tiegs G., Wendel A. (1994). Murine hepatocyte apoptosis induced in vitro and in vivo by TNF-alpha requires transcriptional arrest. J. Immunol. 153, 1778–1788. [PubMed] [Google Scholar]
- Lewis J. H., Ranard R. C., Caruso A., Jackson L. K., Mullick F., Ishak K. G., Seeff L. B., Zimmerman H. J. (1989). Amiodarone hepatotoxicity: Prevalence and clinicopathologic correlations among 104 patients. Hepatology 9, 679–685. [DOI] [PubMed] [Google Scholar]
- Lu J., Jones A. D., Harkema J. R., Roth R. A., Ganey P. E. (2012). Amiodarone exposure during modest inflammation induces idiosyncrasy-like liver injury in rats: Role of tumor necrosis factor-alpha. Toxicol. Sci. 125, 126–133. [DOI] [PMC free article] [PubMed] [Google Scholar]
- Luyendyk J. P., Maddox J. F., Cosma G. N., Ganey P. E., Cockerell G. L., Roth R. A. (2003). Ranitidine treatment during a modest inflammatory response precipitates idiosyncrasy-like liver injury in rats. J. Pharmacol. Exp. Ther. 307, 9–16. [DOI] [PubMed] [Google Scholar]
- Mulder J. E., Brien J. F., Racz W. J., Takahashi T., Massey T. E. (2011). Mechanisms of amiodarone and desethylamiodarone cytotoxicity in nontransformed human peripheral lung epithelial cells. J. Pharmacol. Exp. Ther. 336, 551–559. [DOI] [PubMed] [Google Scholar]
- Nicolescu A. C., Ji Y., Comeau J. L., Hill B. C., Takahashi T., Brien J. F., Racz W. J., Massey T. E. (2008). Direct mitochondrial dysfunction precedes reactive oxygen species production in amiodarone-induced toxicity in human peripheral lung epithelial HPL1A cells. Toxicol. Appl. Pharmacol. 227, 370–379. [DOI] [PubMed] [Google Scholar]
- Nicoletti I., Migliorati G., Pagliacci M. C., Grignani F., Riccardi C. (1991). A rapid and simple method for measuring thymocyte apoptosis by propidium iodide staining and flow cytometry. J. Immunol. Methods 139, 271–279. [DOI] [PubMed] [Google Scholar]
- Ouazzani-Chahdi A., Elimadi A., Chabli A., Spénard J., Colin P., Haddad P. S. (2007). Combining ursodeoxycholic acid or its NO-releasing derivative NCX-1000 with lipophilic antioxidants better protects mouse hepatocytes against amiodarone toxicity. Can. J. Physiol. Pharmacol. 85, 233–242. [DOI] [PubMed] [Google Scholar]
- Podechard N., Tekpli X., Catheline D., Holme J. A., Rioux V., Legrand P., Rialland M., Fardel O., Lagadic-Gossmann D., Lecureur V. (2011). Mechanisms involved in lipid accumulation and apoptosis induced by 1-nitropyrene in Hepa1c1c7 cells. Toxicol. Lett. 206, 289–299. [DOI] [PubMed] [Google Scholar]
- Pollak P. T., Bouillon T., Shafer S. L. (2000). Population pharmaco-kinetics of long-term oral amiodarone therapy. Clin. Pharmacol. Ther. 67, 642–652. [DOI] [PubMed] [Google Scholar]
- Pollak P. T., Shafer S. L. (2004). Use of population modeling to define rational monitoring of amiodarone hepatic effects. Clin. Pharmacol. Ther. 75, 342–351. [DOI] [PubMed] [Google Scholar]
- Ratz Bravo A. E., Drewe J., Schlienger R. G., Krähenbühl S., Pargger H., Ummenhofer W. (2005). Hepatotoxicity during rapid intravenous loading with amiodarone: Description of three cases and review of the literature. Crit. Care Med. 33, 128–34. [DOI] [PubMed] [Google Scholar]
- Rotmensch H. H., Belhassen B., Swanson B. N., Shoshani D., Spielman S. R., Greenspon A. J., Greenspan A. M., Vlasses P. H., Horowitz L. N. (1984). Steady-state serum amiodarone concentrations: Relationships with antiarrhythmic efficacy and toxicity. Ann. Intern. Med. 101, 462–469. [DOI] [PubMed] [Google Scholar]
- Ruch R. J., Bandyopadhyay S., Somani P., Klaunig J. E. (1991). Evaluation of amiodarone free radical toxicity in rat hepatocytes. Toxicol. Lett. 56, 117–126. [DOI] [PubMed] [Google Scholar]
- Scuntaro I., Kientsch U., Wiesmann U. N., Honegger U. E. (1996). Inhibition by vitamin E of drug accumulation and of phospholipidosis induced by desipramine and other cationic amphiphilic drugs in human cultured cells. Br. J. Pharmacol. 119, 829–834. [DOI] [PMC free article] [PubMed] [Google Scholar]
- Shaw P. J., Beggs K. M., Sparkenbaugh E. M., Dugan C. M., Ganey P. E., Roth R. A. (2009). Trovafloxacin enhances TNF-induced inflammatory stress and cell death signaling and reduces TNF clearance in a murine model of idiosyncratic hepatotoxicity. Toxicol. Sci. 111, 288–301. [DOI] [PMC free article] [PubMed] [Google Scholar]
- Shojiro I., Atsushi K., Akira O., Shunichi Y., Katsusuke Y. (2004). Antiarrhythmic amiodarone mediates apoptotic cell death of HepG2 hepatoblastoma cells through the mitochondrial pathway. Acta Med Nagasakiensia 49, 13–17. [Google Scholar]
- Singh B. N. (1996). Antiarrhythmic actions of amiodarone: A profile of a paradoxical agent. Am. J. Cardiol. 78(4A),41–53. [DOI] [PubMed] [Google Scholar]
- Spaniol M., Bracher R., Ha H. R., Follath F., Krähenbühl S. (2001). Toxicity of amiodarone and amiodarone analogues on isolated rat liver mitochondria. J. Hepatol. 35, 628–636. [DOI] [PubMed] [Google Scholar]
- Traber M. G. (2007). Vitamin E regulatory mechanisms. Annu. Rev. Nutr. 27, 347–362. [DOI] [PubMed] [Google Scholar]
- Varbiro G., Toth A., Tapodi A., Veres B., Sumegi B., Gallyas F., Jr (2003). Concentration dependent mitochondrial effect of amiodarone. Biochem. Pharmacol. 65, 1115–1128. [DOI] [PubMed] [Google Scholar]
- Waldhauser K. M., Török M., Ha H. R., Thomet U., Konrad D., Brecht K., Follath F., Krähenbühl S. (2006). Hepatocellular toxicity and pharmacological effect of amiodarone and amiodarone derivatives. J. Pharmacol. Exp. Ther. 319, 1413–1423. [DOI] [PubMed] [Google Scholar]
- Wang X., Li H., Chen Y., Fu J., Ren Y., Dong L., Tang S., Liu S., Wu M., Wang H. (2008). p28GANK knockdown-derived reactive oxygen species induces apoptosis through mitochondrial dysfunction mediated by p38 in HepG2 cells. Int. J. Oncol. 33, 743–750. [PubMed] [Google Scholar]
- Waring J. F., Liguori M. J., Luyendyk J. P., Maddox J. F., Ganey P. E., Stachlewitz R. F., North C., Blomme E. A., Roth R. A. (2006). Microarray analysis of lipopolysaccharide potentiation of trovafloxacin-induced liver injury in rats suggests a role for proinflammatory chemokines and neutrophils. J. Pharmacol. Exp. Ther. 316, 1080–1087. [DOI] [PubMed] [Google Scholar]
- Wullaert A., van Loo G., Heyninck K., Beyaert R. (2007). Hepatic tumor necrosis factor signaling and nuclear factor-kappaB: Effects on liver homeostasis and beyond. Endocr. Rev. 28, 365–386. [DOI] [PubMed] [Google Scholar]
- Yano T., Itoh Y., Yamada M., Egashira N., Oishi R. (2008). Combined treatment with L-carnitine and a pan-caspase inhibitor effectively reverses amiodarone-induced injury in cultured human lung epithelial cells. Apoptosis 13, 543–552. [DOI] [PubMed] [Google Scholar]
- Young R. A., Mehendale H. M. (1989). Effects of short-term and long-term administration of amiodarone on hepatobiliary function in male rats. J. Appl. Toxicol. 9, 407–412. [DOI] [PubMed] [Google Scholar]
- Zou W., Devi S. S., Sparkenbaugh E., Younis H. S., Roth R. A., Ganey P. E. (2009). Hepatotoxic interaction of sulindac with lipopolysaccharide: Role of the hemostatic system. Toxicol. Sci. 108, 184–193. [DOI] [PMC free article] [PubMed] [Google Scholar]
Associated Data
This section collects any data citations, data availability statements, or supplementary materials included in this article.


