

Abstract
There has been a dramatic increase in the number of studies using resting state fMRI, a recent addition to imaging analysis techniques. The technique analyzes ongoing low frequency fluctuations in the blood oxygen level dependent (BOLD) signal. Through patterns of spatial coherence, these fluctuations can be used to identify the networks within the brain. Multiple brain networks are present simultaneously and the relationships within and between networks are in constant dynamic flux. Resting state fMRI functional connectivity (rs-fMRI) analysis is increasingly used to detect subtle brain network differences, and in the case of pathophysiology, subtle abnormalities in illnesses such as Alzheimer’s disease (AD). The sequence of events leading up to dementia has been hypothesized to begin many years or decades before any clinical symptoms occur. Here we review the findings across rs-fMRI studies in the spectrum of preclinical AD to clinical AD. In addition, we discuss evidence for underlying preclinical AD mechanisms, including an important relationship between resting state functional connectivity and brain metabolism, and how this results in a distinctive pattern of amyloid plaque deposition in default mode network regions.
Keywords: fMRI, BOLD, amyloid, precuneus, default mode network (DMN), glycolysis
Resting State fMRI Background
Resting state functional connectivity fMRI (rs-fMRI) is a recent addition to imaging analysis techniques. In the literature there are several synonyms, including resting state functional connectivity, spontaneous activity, intrinsic functional connectivity and task free functional connectivity, where “functional connectivity” is used to distinguish it from structural connectivity. For the purposes of this review it will be referred to as rs-fMRI. In the context of experimentation, “rest” refers to a constant condition without imposed stimuli or other behaviorally salient events; there is no task performance. Subjects typically are asked to rest quietly with their eyes closed or fixated on a cross-hair for a relatively short time period (5–10 minutes). The objective of resting state experiments is to capture the statistical properties of endogenously generated neural activity during the acquisition of blood oxygen level dependent (BOLD) data (see Figure 1A and B). During quiet wakefulness, humans experience stimulus independent thoughts(1–2), which are not easy to relate to objectively measured fMRI responses(3–4). As such, the resting state is uncontrolled according to usual cognitive neuroimaging conventions(5). However, resting state BOLD fluctuations appear to be a fundamental property of the brain that are found during sleep(6) and even during general anaesthesia(7).
Figure 1.

From the fluctuating patterns of intrinsic activity seen in the human brain with fMRI BOLD imaging striking patterns of spatial coherence within known brain systems can be extracted. A single subject example of data from which these patterns are derived is shown (A). These data were obtained continuously over a period of 5 minutes (each row is one minute, each frame is 2.3 seconds). An interpolated version of these data in a movie format may be downloaded from (ftp://imaging.wustl.edu/pub/raichlab/restless_brain). Patterns of spatial coherence are obtained by placing a seed region in a single focus within a system (in this case in the sensorimotor cortex) and extracting the resulting BOLD time series (B). This time series is then used to search the brain for correlated time series. The results are brain-network specific images of spatial coherence in the ongoing activity of the brain (C). This strategy has been applied with ever increasing sophistication to systems throughout the human brain. A more complete description of the data processing steps leading to such images is presented elsewhere along with alternate strategies (94). Shown in (D) are 7 major brain networks analyzed in this way accompanied by a. cross-correlogram constructed from regions of interest within the 7 brain networks shown. The data represent a 30 minute average from a normal adult male volunteer resting quietly in 3T scanner (Siemens Trio) but awake. The names of the regions are shown along the right. The diagonal of the correlogram represents the correlation of each region with itself. It should be noted that while correlations within networks appear distinctive in this presentation, relationships among networks (both positive and negative) are also prominent emphasizing the integrated nature of the brain’s functional networks. An additional important feature of the data presented in this cross-correlogram is its temporal dynamics. While not feasible to present in the form of static images these temporal dynamics in movie format may be downloaded from (ftp://imaging.wustl.edu/pub/raichlab/restless_brain).
The BOLD signal exhibits low-frequency spontaneous fluctuations in the resting brain that had initially been thought to represent noise. In 1995 Biswal(8) demonstrated that these low frequency (0.1 to 0.01 Hz) fluctuations in BOLD signal were highly correlated across the hemispheres in the bilateral motor cortices. Subsequently the low frequency fluctuations were shown to be of neural origin and specific to gray matter(8–9). The correlational structure of these rs-fMRI fluctuations among brain regions when determined, can be used to identify networks within the brain(10–11). Proceeding in this manner, resting state BOLD correlations have been shown to recapitulate the topography of task-evoked responses now in most cortical and subcortical systems in the human brain (for reviews see(12–13)). As shown in Figure 1D, multiple brain networks are present simultaneously and the relationships within and between networks are in constant dynamic flux. However, given that rs-fMRI measures the correlation of time series it is important to consider potential confounds, such as changes in cerebral hemodynamics in AD(14). Another important methodological issue is physiological and scanner noise. A widely used approach to reduce noise is regressing out the global signal(15–16), regressing out signal from white matter and ventricles, as well as measuring cardiac and respiratory signals in the scanner(17), so that these noise sources can be removed. An additional source of noise is motion artifact, and as recent reports have shown(18), it is critical to account for and control this variable.
There are two main methodologies used to characterize resting state functional connectivity. One approach uses a region-of-interest (ROI) (or “seed based”) approach and the other uses independent component analysis (ICA). These methods are reviewed elsewhere(12). Briefly, ROI analysis involves an a-priori selection of a region from which the BOLD signal fluctuations are selected and correlated with BOLD signal fluctuations from all the other voxels in the brain. Voxels with significant correlations in low-signal fluctuations are then selected for analysis. In ICA, several distinct resting state networks (RSN) are detected and separated, based on their spatial patterns; voxel values selected reflect the degree to which each voxel’s time series is correlated with the mean time series of the RSN(19). Whether using ICA or ROI approaches, when comparing groups, the connectivity maps are then compared using a two-sample t-test. Advantages of the hypothesis driven seed based (ROI) approach include the ability to clearly visualize the anatomy of correlated regions; disadvantages include the statistical challenge to simultaneously examine multiple networks. ICA can examine multiple networks simultaneously but determining an optimal number of components and separating noise related components is not standardized(19).
In addition to scans acquired during studies specifically devoted to task-free rest, other methods have included cutting and pasting blocks of rest within a longer cognitive task(20), and regressing task related activation out of the time series and then examining resting state network connectivity using the residual signal(21). However in a study comparing results limited to pure resting state scans with alternative methods, it was found(22) that when using residual signal from extracted resting blocks, there was significant loss of signal.
Resting State fMRI in MCI and AD
One of the most frequently used applications of rs-fMRI is in the characterization of brain networks in Alzheimer’s disease (AD). AD usually begins insidiously, with episodic memory disturbance and progresses towards a more general impairment in memory, executive function, language, visuospatial function and other cognitive and behavioral domains. An important advantage of resting state fMRI imaging in AD is the ability to scan patients who are too impaired to actively participate in a task-based scanning paradigm or in whom the interpretation of task-based fMRI responses would be confounded by differences in task performance. Another potential utility is that potential treatments could be tested for their ability to normalize rs-fMRI connectivity. As treatments that can slow disease progression become available, the use of quantitative rs-fMRI evaluation may become an important tool.
The rs-fMRI findings in AD and MCI have been fairly consistent across studies. Using network analysis in a large sample (n=510) of cognitively normal CDR 0, CDR = 0.5 AD and CDR = 1.0 AD, loss of intra-network connectivity was shown in large scale networks including the default mode network (DMN), dorsal attention network, control network, salience network and sensory motor network(23). Further, the between-network connectivities also were decreased progressively as the degree of cognitive impairment increased from CDR 0 to 0.5 to 1.0. A number of other studies in participants with AD and Mild Cognitive Impairment (MCI) have found rs-MRI abnormalities in the DMN. The DMN is comprised of a characteristic set of brain regions, including the precuneus/posterior cingulate cortex (PCC), medial prefrontal cortex, lateral temporal and parietal cortices and hippocampus. These regions are active at rest (hence the term “default”)(24) but during the performance of demanding cognitive tasks, these regions show decreased activity. Importantly, relevant to the study of AD, these regions are among the earliest to show abnormal amyloid deposition(25). Studies finding alterations of rs-fMRI in the DMN(26–28) primarily have found decreased connectivity. Decreased functional connectivity in the posterior cingulate and hippocampus could explain the hypometabolism found in PET studies in AD(29–30). Patients with MCI are at high risk for developing AD, with 10–15% converting to AD per year(31) compared with healthy controls who develop dementia at a rate of 1–2% per year(31–32). In these patients the same pattern of decreased functional connectivity from the posterior to anterior portions of DMN has been identified(33–35). Recent studies of resting state functional connectivity in mice validate the relationship between elevated amyloid deposition and decreased resting state functional connectivity seen in humans(36) (see Figure S1 in Supplement 1). Using optical imaging in a transgenic mouse model of AD, Bero et al. showed that by 11 months of age, following amyloid accumulation, there was a significant decrease in functional connectivity in both the cingulate cortex (Figure S1B) and retrosplenial cortex (Figure S1B), the mouse equivalent of the posterior cingulate/precuneus, both regions with early amyloid deposition in humans. They also showed amyloid deposition and decreased functional connectivity in other regions (not shown).
Some studies have found decreased DMN connectivity to be associated with increased prefrontal connectivity(37) or with increased salience network connectivity(38). Several activation fMRI studies in AD and MCI(39–40) showed decreased ability to deactivate regions irrelevant for task performance. Further, the degree of deficit in deactivating cortical regions was correlated with memory performance(41) and indicated deterioration in cognitive task performance. Thus the ability to decrease brain activity in the DMN is associated with brain health. This complements the hypothesis that increased medial temporal lobe (MTL) activity represents compensatory activity(42–43) as cognition begins to become impaired(44). With further impairment, MTL fMRI activity was found to decrease during memory tasks(42, 45). However, in contrast, some animal studies and a recent study in humans suggest that increased activity reflects ongoing damage (see below) and is harmful. In a group of MCI patients who had hippocampal hyperactivity during a memory task, when a low dose of an anti-epileptic drug reduced the hyperactivity there was a significant improvement in memory performance, compared with placebo(46)
Preclinical AD
There is evidence for a prolonged phase of ‘pre-clinical AD’(47–48) in which Aβ plaques are accumulating for a number of years prior to first disease symptoms. Pathological evidence first indicated that 20–30% of non-demented elderly who came to autopsy had evidence of amyloid deposition(49). Fibrillar amyloid deposition was then shown to be measurable in vivo using Pittsburgh Compound B (PIB) PET scanning(50) and, consistent with autopsy findings, PET studies(25) identified increased amyloid deposition in approximately 25% of cognitively normal elderly. The extent and pattern of amyloid burden with [11C]-labeled PIB was found in some studies to differ in clinically diagnosed AD from normal controls and from other dementias(51–52). The percent with elevated amyloid is age dependent, with increasing numbers with amyloid deposition up to the eighth decade and then leveling off(53). Cognitively normal elderly with increased amyloid binding on PET imaging, as compared to those without increased amyloid, have cortical thinning in parietal and posterior cingulate regions extending into the precuneus(54), a greater rate of change in cognitive function(55), and an increased rate of progression to AD in a 3–4 year follow- up period(56). An important recent observation supporting the amyloid hypothesis is the existence not only of disease-inducing mutations involving amyloid but also a mutation in amyloid precursor protein (APP) processing(57) that confers protection even in the face of a double APOE4 allele.
The recent National Institute of Aging (NIA)/Alzheimer’s Association definition of preclinical AD defined preclinical AD Stage I as asymptomatic cerebral amyloidosis (the presence of amyloid on positron emission tomography (PET) scan or lumbar puncture (LP). Stage II was defined as Stage I plus downstream neurodegeneration (the presence of elevated tau on LP, abnormal fluor-deoxyglucose (FDG) metabolism on PET scan or abnormal volumetric loss on structural magnetic resonance imaging (MRI) scan). Stage III was defined as Stage II with the addition of subtle cognitive decline(58). Ultimately the injury occurring during preclinical AD progresses and results in Alzheimer’s dementia(47, 59).
The sequence of events (See Figure 2 for a schematic representation) leading up to dementia has been hypothesized to begin decades before any clinical symptoms occur. In this sequence the initiating event is progressive amyloid accumulation. As shown in Figure 2, amyloid accumulation (preclinical AD-Stage I) is imaged with positron emission tomography (PET) scanning. Discussed below and shown in Figure 2, following PET detection of amyloid and before structural damage is manifested as atrophy, abnormalities in resting state functional connectivity can be detected on fMRI (see the following section). There is subsequently a phase with tau protein buildup producing neurotoxicity. In some models tau deposition is the first step in this sequence, with trans-synaptic spread(60–61); however tau deposition is also a consequence of normal aging(49, 60). Tau deposition, augmented by oxidative damage and inflammation, results in neuronal death, seen cumulatively as atrophy in imaging studies (Figure 2). Following atrophy, cognitive decline produces progressive clinical deterioration.
Figure 2. Timecourse from Preclinical to Clinical AD: Pathophysiology and Imaging.

Preclinical AD has been hypothesized to begin many years or decades before clinical symptoms. Progressive amyloid accumulation occurs early, with models for the kinetics of amyloid accumulation shown with different dotted lines. As yet the kinetics remain to be determined. Tau deposition, augmented by oxidative damage and inflammation, results in neuronal death. In the figure the timing and onset of tau deposition, inflammation, activated microglia, oxidative stress and other mechanisms is not meant to be precise but is simply meant to show onset during the preclinical phase. Following onset of cognitive decline clinical progression occurs resulting inevitably in death. The definitive diagnosis of AD can only be made post-mortem with autopsy showing neuropathological features of senile plaques and neurofibrillary tangles.
Amyloid accumulation is imaged with positron emission tomography (PET) scanning (dotted curve). Kinetic models for amyloid deposition remain to be determined. Following PET detection of amyloid and before structural damage, abnormalities in resting state functional connectivity can be detected on fMRI (red curve) (see text for exceptions). Progressive neurotoxicity manifests cumulatively as structural damage in imaging studies (blue curve). Following structural damage, cognitive decline produces progressive clinical deterioration.
While the sequence of amyloid deposition continuing to resting state fMRI abnormalities then to volume loss and finally to cognitive loss is observed in general, there are notable exceptions. For example, the hippocampus is affected early by pathological changes (49) and by clinically observed memory loss but is among the last regions to show amyloid plaque deposition(62). Similarly, as shown in the recent Dominantly Inherited Alzheimer’s Network (DIAN) cohort, medial prefrontal cortex had relatively normal metabolism on FDG PET but early plaque deposition and the caudate had minimal volume loss despite substantial amyloid deposition(63). Thus, in addition to understanding the general pattern, it will be important to understand differential patterns of tissue response to amyloid deposition (likely associated with glycolysis, see below) and differential sensitivity to the toxic effects of amyloid deposition resulting in atrophy.
Finally, another caveat to the sequence proposed in Figure 2 is that some resting state studies show differences in functional connectivity prior to evidence of fibrillar amyloid deposition. For example we showed(64) that APOE4 positive subjects who were both PIB negative and also had normal CSF levels of Aβ42 nonetheless had lower functional connectivity of precuneus to hippocampus and anterior cingulate. In addition these subjects had a number of other differences in brain functional connectivity compared with non-APOE4 carriers that did not appear in AD. It is not clear if these additional resting state differences reflect an effect of amyloid detectable prior to PET scan, or more likely, whether these additional rs-fMRI differences reflect other effects of genetically induced neurodevelopmental brain differences. Other papers also suggest that earlier abnormalities involving synaptic function may antedate amyloid deposition(65) (66–67).
Resting State fMRI in Preclinical AD
Resting state fMRI functional connectivity (rs-fMRI) analysis is increasingly used to detect subtle brain network abnormalities in illnesses such as Alzheimer’s disease (AD). An important question has been whether the effects of fibrillar amyloid-beta could be detected in brain functional studies as well as in molecular imaging studies prior to the development of cognitive change. Several studies using resting state functional MRI(68–70), have supplied supporting evidence, demonstrating, that as in AD and MCI there is significantly decreased default mode network (DMN) connectivity in cognitively normal elderly with elevated brain amyloid. Shown in Figure 3, in early Alzheimers disease (clinical dementia rating scale, CDR = 0.5) resting state functional connectivity of the precuneus (part of DMN) was significantly decreased with the left hippocampus, anterior cingulate cortex and gyrus rectus and increased with visual cortex (Figures 3a and 3b). The same pattern of rs-fMRI abnormalities was found in cognitively normal persons with elevated amyloid (Figures 3c and 3d), supporting the concept that amyloid deposition results in changes in rs-fMRI functional connectivity prior to any clinical symptoms.
Figure 3. Similarity in Regions of Connectivity Loss in Early AD and Cognitively Normal Elderly with Increased Brain Amyloid Binding.
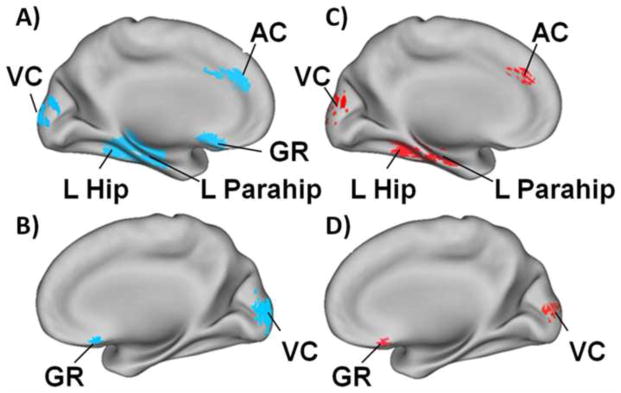
Figure 3A and 3B: Resting state functional connectivity is significantly decreased in early Alzheimers disease. Using the precuneus as the seed region there is less functional connectivity with the left hippocampus (L Hip), left parahippocampus (L Parahip), anterior cingulate cortex (AC) and gyrus rectus (GR) and increased connectivity with visual cortex (VC). Figure 3C and 3D: Again using the precuneus as the seed region, the same pattern of rs-fMRI abnormalities was found in cognitively normal persons with elevated amyloid binding on PIB-PET. The regions with decreased functional connectivity are shown in blue and those with increased connectivity are shown in red. Adapted from Sheline et al (68).
Studies examining the effect of amyloid burden on rs-fMRI have consistently demonstrated decreased functional connectivity of DMN from the posterior portion (precuneus, posterior cingulate) to the anterior portion (anterior cingulate cortex) and from precuneus to hippocampus(68–69). Decreased functional connectivity was also observed when amyloid burden was treated as a continuous variable(69). In these studies all participants were cognitively normal and did not differ from controls on tests of cognitive performance. The finding that connectivity between precuneus and hippocampus was significantly lower in individuals with amyloid plaques versus those without evidence of brain Aβ plaques, indicated that resting state functional disconnection already had occurred in nondemented aging in the presence of Aβ plaques. Because there are extensive anatomical connections between posterior cortical regions and hippocampus and parahippocampus, including the entorhinal cortex(71), a finding also seen in the macaque(71–72), it is possible that even without observable Aβ deposits in the hippocampus, the Aβ deposits in the precuneus may alter hippocampal function. The precuneus is known to have very early involvement in amyloid plaque deposition(25) and may play a critical role in memory function. Thus, it is consistent that before any manifestations of cognitive or behavioral changes, early manifestation of Aβ toxicity could be detected using resting state fMRI(68).
Another study built on the notion of brain “hubs” to investigate the effects of amyloid(73). Brain hubs are brain regions densely connected to multiple other brain regions and as such occupy a central role in both functional and structural brain relationships. Drzezga et al(73) found that older individuals with increased brain amyloid burden had disruptions of functional connectivity in cortical hubs, e.g. precuneus/posterior cingulate, in the absence of clinical symptoms and that connectivity disruptions were associated with hypometabolism on FDG PET studies in the same regions. The authors concluded that spatial overlap between hypometabolism and disruption of connectivity in cortical hubs pointed to particular susceptibility of these regions to early changes on the path to Alzheimer’s disease and might reflect a link between synaptic dysfunction and functional disconnection. One study(74) found both decreases and increases in default mode network connectivity as a function of increasing amyloid deposition in cognitively normal elderly, speculating that the increases may represent compensatory activity.
Relationship between resting state functional connectivity and brain metabolism
Part of the emerging puzzle may require a greater understanding of the relationship between resting state functional connectivity and brain metabolism. Measurements of brain energy metabolism using magnetic resonance spectroscopy (75–76) in a variety of experimental settings have indicated that up to 80% of the entire energy consumption of the brain at rest is spent on glutamate cycling, with the majority of that energy produced by oxidative phosphorylation coupled to aerobic glycolysis. An observation that earliest deposition of amyloid occurred in brain regions with high activity was first made in rodents(77) and hypothesized to occur in humans(78). More recently(79), this was borne out experimentally with the demonstration of correlations between 11C-PIB binding and aerobic glycolysis both for individuals with AD (p < 0.0001) and for cognitively normal amyloid positive participants (p < 0.0001), suggesting a possible link between regional aerobic glycolysis and later development of Alzheimer pathology. As shown in Figure 4, the regions with high aerobic glycolysis correspond almost exactly to DMN regions. These are many of the same regions which in Alzheimer’s disease show decreased activity on FDG PET and increased amyloid deposition. The very distinct pattern of distribution of Aβ in AD suggests that something specific to these brain areas predisposes them to the pathophysiology of AD(78). Paradoxically, drugs that augment aerobic glycolysis were shown to enhance neuronal survival in a mouse AD model, leading the authors to speculate that aerobic glycolysis may be elevated in areas of brain most susceptible to insult as a pre-emptive protective mechanism or in response to Aβ accumulation during aging, and that loss of this protective mechanism might render particular areas of the brain susceptible to Aβ-induced neurotoxicity (80). Because many critical functions are associated with glucose outside its traditional role in supplying energy through oxidative phosphorylation (81–82), this relationship might signal a causal element in the chain of events leading to AD, including disruption of synaptic function.
Figure 4. Default Mode Network Regions Have Elevated Glycolysis in Normals and Decreased Glucose Metabolism and Amyloid Binding in AD.
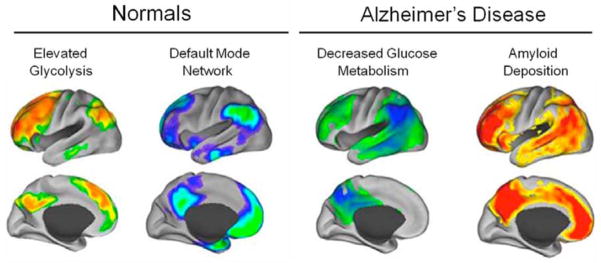
4a) Default mode network (DMN) regions have increased aerobic glycolysis; 4b) DMN regions in the normal brain; 4c) DMN regions have decreased glucose metabolism in AD; 4d) DMN regions are the first to develop amyloid deposition in AD.
Glucose, apart from the generation of ATP through oxidative phosphorylation, is vital for synaptic function in several ways. First, it is critical for glutamate removal from the synaptic cleft into astrocytes(83) by providing ATP to Na/K ATPase, and failure to do so can be damaging through excitotoxic effects of excessive glutamate(84). A second synaptic role for glucose is the Na/K-ATPase regulation of AMPA receptor turnover, also fueled by glycolysis(85). It has been hypothesized that the loss of AMPA receptors occurs in conjunction with Aβ-induced synaptic depression and the loss of dendritic spines(86). A concentration-dependent, Aβ-induced interference with the delivery of ATP to Na/K-ATPase in astrocytes and post synaptic densities could link elevated levels of Aβ to synaptic depression, loss of dendritic spines, and glutamate-induced excitotoxicity. In addition to its role specifically at the synapse, glucose also plays a critical role in protecting the brain against reactive oxygen species (ROS) and diminishing oxidative stress(87), which is thought to play an important role in the pathophysiology of AD(88–89).
Astrocytes may provide neurons with both lactate to supplement glycolysis in fueling oxidative phosphorylation(90) and with precursors of glutathione(91) that are released from the cell and made available to neurons for ameliorating ROS(90–91). When cultured astrocytes incorporate Aβ, which aggregates within these astrocytes at high concentrations, glycogen synthesis, oxidative phosphorylation, and the production of ROS all increase significantly(91). When neurons are introduced to astrocytes pre-exposed to Aβ, there is a significant decrease in neuronal viability. One caveat regarding this work is that it was all performed in embryonic stem cells and it remains to be shown whether the same relationships exist in adult cells.
Timeline, Differential Diagnosis and Future Directions
Resting state intrinsic activity may be as significant as, if not more so, than evoked activity in terms of overall brain function. The intimate association between resting state activity and amyloid-beta deposition reflects the characteristic pattern of amyloid deposition. As shown in Figure 3b, amyloid-beta depositions appears to be the earliest event in pre-clinical AD measureable with imaging techniques, followed by alterations in resting state functional connectivity (see above for exceptions) and then structural loss as determined by 3-D volumetrics. While there is now beginning to be longitudinal data on PET amyloid deposition, the longitudinal characteristics of rs-fMRI remain to be determined. Currently there have been no large scale studies conducted to examine longitudinal resting state fMRI changes in preclinical AD, although efforts are underway as part of the Alzheimers Disease Neuroimaging Initiative (ADNI) and the Dominantly Inherited Alzheimers Network (DIAN). ADNI is collecting longitudinal imaging studies in all stages of the disease to determine the extent to which baseline measures predict rates of subsequent clinical progression and post-mortem neuropathology. More information is needed to assess test-retest reliability and natural history to help provide sample size estimates. The exact relationship of the duration of rs-fMRI changes prior to development of structural MRI changes remains to be determined. In addition, the specificity of resting state functional connectivity changes (and their ability to be used as a biomarker) in the amyloid-positive to AD spectrum is still being investigated, although preliminary evidence suggests a pattern distinct from Lewy body dementia(92) and fronto-temporal dementia(93). With further characterization of the relationship of disturbances among brain networks and the timecourse over which they develop it may be possible to add rs-fMRI to the biomarkers distinguishing among the dementias. This would be a particularly valuable tool in the case of Lewy body dementia, which commonly is associated with pathological deposition of brain amyloid. In summary, the potential use of rs-fMRI in identifying early manifestations of pre-clinical AD and distinguishing it from other dementing disorders is a promising area of investigation and remains to be fully developed.
Supplementary Material
Acknowledgments
The authors acknowledge K. Moulder and J.C. Morris for contributing an unpublished figure that was adapted as Figure 2.
Footnotes
Financial Disclosure:
In addition to NIH funding, Dr. Sheline has served as a consultant for the NIMH grant-Establishing Moderators and Biosignatures of Antidepressant Response for Clinical care (EMBARC), as a consultant for Bristol-Myers Squibb, Inc, and also receives research grant funding from NeoSync, Inc. This work was supported by NIMH K24 MH79510 to Dr. Sheline. Dr. Raichle reports no biomedical financial interests or potential conflicts of interest.
Publisher's Disclaimer: This is a PDF file of an unedited manuscript that has been accepted for publication. As a service to our customers we are providing this early version of the manuscript. The manuscript will undergo copyediting, typesetting, and review of the resulting proof before it is published in its final citable form. Please note that during the production process errors may be discovered which could affect the content, and all legal disclaimers that apply to the journal pertain.
References
- 1.Christoff K, Gordon AM, Smallwood J, Smith R, Schooler JW. Experience sampling during fMRI reveals default network and executive system contributions to mind wandering. Proc Natl Acad Sci U S A. 2009;106:8719–8724. doi: 10.1073/pnas.0900234106. [DOI] [PMC free article] [PubMed] [Google Scholar]
- 2.Mason MF, Norton MI, Van Horn JD, Wegner DM, Grafton ST, Macrae CN. Wandering minds: the default network and stimulus-independent thought. Science. 2007;315:393–395. doi: 10.1126/science.1131295. [DOI] [PMC free article] [PubMed] [Google Scholar]
- 3.Gruberger M, Ben-Simon E, Levkovitz Y, Zangen A, Hendler T. Towards a neuroscience of mind-wandering. Front Hum Neurosci. 2011;5:56. doi: 10.3389/fnhum.2011.00056. [DOI] [PMC free article] [PubMed] [Google Scholar]
- 4.Hasenkamp W, Wilson-Mendenhall CD, Duncan E, Barsalou LW. Mind wandering and attention during focused meditation: a fine-grained temporal analysis of fluctuating cognitive states. Neuroimage. 2012;59:750–760. doi: 10.1016/j.neuroimage.2011.07.008. [DOI] [PubMed] [Google Scholar]
- 5.Morcom AM, Fletcher PC. Does the brain have a baseline? Why we should be resisting a rest. Neuroimage. 2007;37:1073–1082. doi: 10.1016/j.neuroimage.2007.06.019. [DOI] [PubMed] [Google Scholar]
- 6.Larson-Prior LJ, Zempel JM, Nolan TS, Prior FW, Snyder AZ, Raichle ME. Cortical network functional connectivity in the descent to sleep. Proc Natl Acad Sci U S A. 2009;106:4489–4494. doi: 10.1073/pnas.0900924106. [DOI] [PMC free article] [PubMed] [Google Scholar]
- 7.Vincent JL, Patel GH, Fox MD, Snyder AZ, Baker JT, Van Essen DC, et al. Intrinsic functional architecture in the anaesthetized monkey brain. Nature. 2007;447:83–86. doi: 10.1038/nature05758. [DOI] [PubMed] [Google Scholar]
- 8.Biswal B, Yetkin FZ, Haughton VM, Hyde JS. Functional connectivity in the motor cortex of resting human brain using echo-planar MRI. Magn Reson Med. 1995;34:537–541. doi: 10.1002/mrm.1910340409. [DOI] [PubMed] [Google Scholar]
- 9.Li SJ, Biswal B, Li Z, Risinger R, Rainey C, Cho JK, et al. Cocaine administration decreases functional connectivity in human primary visual and motor cortex as detected by functional MRI. Magn Reson Med. 2000;43:45–51. doi: 10.1002/(sici)1522-2594(200001)43:1<45::aid-mrm6>3.0.co;2-0. [DOI] [PubMed] [Google Scholar]
- 10.Damoiseaux JS, Rombouts SA, Barkhof F, Scheltens P, Stam CJ, Smith SM, et al. Consistent resting-state networks across healthy subjects. Proc Natl Acad Sci U S A. 2006;103:13848–13853. doi: 10.1073/pnas.0601417103. [DOI] [PMC free article] [PubMed] [Google Scholar]
- 11.Damoiseaux JS, Greicius MD. Greater than the sum of its parts: a review of studies combining structural connectivity and resting-state functional connectivity. Brain Struct Funct. 2009;213:525–533. doi: 10.1007/s00429-009-0208-6. [DOI] [PubMed] [Google Scholar]
- 12.Fox MD, Raichle ME. Spontaneous fluctuations in brain activity observed with functional magnetic resonance imaging. Nat Rev Neurosci. 2007;8:700–711. doi: 10.1038/nrn2201. [DOI] [PubMed] [Google Scholar]
- 13.Wig GS, Schlaggar BL, Petersen SE. Concepts and principles in the analysis of brain networks. Ann N Y Acad Sci. 2011;1224:126–146. doi: 10.1111/j.1749-6632.2010.05947.x. [DOI] [PubMed] [Google Scholar]
- 14.D’Esposito M, Deouell LY, Gazzaley A. Alterations in the BOLD fMRI signal with ageing and disease: a challenge for neuroimaging. Nat Rev Neurosci. 2003;4:863–872. doi: 10.1038/nrn1246. [DOI] [PubMed] [Google Scholar]
- 15.Fox MD, Snyder AZ, Vincent JL, Corbetta M, Van Essen DC, Raichle ME. The human brain is intrinsically organized into dynamic, anticorrelated functional networks. P Natl Acad Sci USA. 2005;102:9673–9678. doi: 10.1073/pnas.0504136102. [DOI] [PMC free article] [PubMed] [Google Scholar]
- 16.Birn RM, Diamond JB, Smith MA, Bandettini PA. Separating respiratory-variation-related fluctuations from neuronal-activity-related fluctuations in fMRI. Neuroimage. 2006;31:1536–1548. doi: 10.1016/j.neuroimage.2006.02.048. [DOI] [PubMed] [Google Scholar]
- 17.Shmueli K, van Gelderen P, de Zwart JA, Horovitz SG, Fukunaga M, Jansma JM, et al. Low-frequency fluctuations in the cardiac rate as a source of variance in the resting-state fMRI BOLD signal. Neuroimage. 2007;38:306–320. doi: 10.1016/j.neuroimage.2007.07.037. [DOI] [PMC free article] [PubMed] [Google Scholar]
- 18.Power JD, Barnes KA, Snyder AZ, Schlaggar BL, Petersen SE. Spurious but systematic correlations in functional connectivity MRI networks arise from subject motion. Neuroimage. 2012;59:2142–2154. doi: 10.1016/j.neuroimage.2011.10.018. [DOI] [PMC free article] [PubMed] [Google Scholar]
- 19.Beckmann CF, DeLuca M, Devlin JT, Smith SM. Investigations into resting-state connectivity using independent component analysis. Philos T Roy Soc B. 2005;360:1001–1013. doi: 10.1098/rstb.2005.1634. [DOI] [PMC free article] [PubMed] [Google Scholar]
- 20.Fair DA, Cohen AL, Dosenbach NU, Church JA, Miezin FM, Barch DM, et al. The maturing architecture of the brain’s default network. Proc Natl Acad Sci U S A. 2008;105:4028–4032. doi: 10.1073/pnas.0800376105. [DOI] [PMC free article] [PubMed] [Google Scholar]
- 21.He BJ, Snyder AZ, Vincent JL, Epstein A, Shulman GL, Corbetta M. Breakdown of functional connectivity in frontoparietal networks underlies behavioral deficits in spatial neglect. Neuron. 2007;53:905–918. doi: 10.1016/j.neuron.2007.02.013. [DOI] [PubMed] [Google Scholar]
- 22.Fair DA, Schlaggar BL, Cohen AL, Miezin FM, Dosenbach NUF, Wenger KK, et al. A method for using blocked and event-related fMRI data to study “resting state” functional connectivity. Neuroimage. 2007;35:396–405. doi: 10.1016/j.neuroimage.2006.11.051. [DOI] [PMC free article] [PubMed] [Google Scholar]
- 23.Brier M, Thomas JB, Snyder AZ, Benzinger TL, Zhang D, ERM, et al. Loss of Intranetwork and Internetwork Resting State Functional Connections with Alzheimer’s Disease Progression. Neurobiology of Disease. 2012 doi: 10.1523/JNEUROSCI.5698-11.2012. In Press. [DOI] [PMC free article] [PubMed] [Google Scholar]
- 24.Raichle ME, MacLeod AM, Snyder AZ, Powers WJ, Gusnard DA, Shulman GL. A default mode of brain function. Proc Natl Acad Sci U S A. 2001;98:676–682. doi: 10.1073/pnas.98.2.676. [DOI] [PMC free article] [PubMed] [Google Scholar]
- 25.Mintun MA, Larossa GN, Sheline YI, Dence CS, Lee SY, Mach RH, et al. [11C]PIB in a nondemented population: potential antecedent marker of Alzheimer disease. Neurology. 2006;67:446–452. doi: 10.1212/01.wnl.0000228230.26044.a4. [DOI] [PubMed] [Google Scholar]
- 26.Allen G, Barnard H, McColl R, Hester AL, Fields JA, Weiner MF, et al. Reduced hippocampal functional connectivity in Alzheimer disease. Arch Neurol. 2007;64:1482–1487. doi: 10.1001/archneur.64.10.1482. [DOI] [PubMed] [Google Scholar]
- 27.Greicius MD, Srivastava G, Reiss AL, Menon V. Default-mode network activity distinguishes Alzheimer’s disease from healthy aging: evidence from functional MRI. Proc Natl Acad Sci U S A. 2004;101:4637–4642. doi: 10.1073/pnas.0308627101. [DOI] [PMC free article] [PubMed] [Google Scholar]
- 28.Li SJ, Li Z, Wu G, Zhang MJ, Franczak M, Antuono PG. Alzheimer Disease: evaluation of a functional MR imaging index as a marker. Radiology. 2002;225:253–259. doi: 10.1148/radiol.2251011301. [DOI] [PubMed] [Google Scholar]
- 29.Minoshima S, Giordani B, Berent S, Frey KA, Foster NL, Kuhl DE. Metabolic reduction in the posterior cingulate cortex in very early Alzheimer’s disease. Ann Neurol. 1997;42:85–94. doi: 10.1002/ana.410420114. [DOI] [PubMed] [Google Scholar]
- 30.Caroli A, Prestia A, Chen K, Ayutyanont N, Landau SM, Madison CM, et al. Summary metrics to assess Alzheimer disease-related hypometabolic pattern with 18F-FDG PET: head-to-head comparison. J Nucl Med. 2012;53:592–600. doi: 10.2967/jnumed.111.094946. [DOI] [PMC free article] [PubMed] [Google Scholar]
- 31.Grundman M, Petersen RC, Ferris SH, Thomas RG, Aisen PS, Bennett DA, et al. Mild cognitive impairment can be distinguished from Alzheimer disease and normal aging for clinical trials. Arch Neurol. 2004;61:59–66. doi: 10.1001/archneur.61.1.59. [DOI] [PubMed] [Google Scholar]
- 32.Bischkopf J, Busse A, Angermeyer MC. Mild cognitive impairment--a review of prevalence, incidence and outcome according to current approaches. Acta Psychiatr Scand. 2002;106:403–414. doi: 10.1034/j.1600-0447.2002.01417.x. [DOI] [PubMed] [Google Scholar]
- 33.Wee CY, Yap PT, Zhang D, Denny K, Browndyke JN, Potter GG, et al. Identification of MCI individuals using structural and functional connectivity networks. Neuroimage. 2012;59:2045–2056. doi: 10.1016/j.neuroimage.2011.10.015. [DOI] [PMC free article] [PubMed] [Google Scholar]
- 34.Sperling RA, Dickerson BC, Pihlajamaki M, Vannini P, LaViolette PS, Vitolo OV, et al. Functional alterations in memory networks in early Alzheimer’s disease. Neuromolecular Med. 2010;12:27–43. doi: 10.1007/s12017-009-8109-7. [DOI] [PMC free article] [PubMed] [Google Scholar]
- 35.Bai F, Zhang Z, Yu H, Shi Y, Yuan Y, Zhu W, et al. Default-mode network activity distinguishes amnestic type mild cognitive impairment from healthy aging: a combined structural and resting-state functional MRI study. Neurosci Lett. 2008;438:111–115. doi: 10.1016/j.neulet.2008.04.021. [DOI] [PubMed] [Google Scholar]
- 36.Bero AW, Bauer AQ, Stewart FR, White BR, Cirrito JR, Raichle ME, et al. Bidirectional relationship between functional connectivity and amyloid-beta deposition in mouse brain. J Neurosci. 2012;32:4334–4340. doi: 10.1523/JNEUROSCI.5845-11.2012. [DOI] [PMC free article] [PubMed] [Google Scholar]
- 37.Agosta F, Pievani M, Geroldi C, Copetti M, Frisoni GB, Filippi M. Resting state fMRI in Alzheimer’s disease: beyond the default mode network. Neurobiol Aging. 2011 doi: 10.1016/j.neurobiolaging.2011.06.007. [DOI] [PubMed] [Google Scholar]
- 38.Zhou J, Greicius MD, Gennatas ED, Growdon ME, Jang JY, Rabinovici GD, et al. Divergent network connectivity changes in behavioural variant frontotemporal dementia and Alzheimer’s disease. Brain. 2010;133:1352–1367. doi: 10.1093/brain/awq075. [DOI] [PMC free article] [PubMed] [Google Scholar]
- 39.Drzezga A, Grimmer T, Peller M, Wermke M, Siebner H, Rauschecker JP, et al. Impaired cross-modal inhibition in Alzheimer disease. PLoS Med. 2005;2:e288. doi: 10.1371/journal.pmed.0020288. [DOI] [PMC free article] [PubMed] [Google Scholar]
- 40.Lustig C, Snyder AZ, Bhakta M, O’Brien KC, McAvoy M, Raichle ME, et al. Functional deactivations: change with age and dementia of the Alzheimer type. Proc Natl Acad Sci U S A. 2003;100:14504–14509. doi: 10.1073/pnas.2235925100. [DOI] [PMC free article] [PubMed] [Google Scholar]
- 41.Celone KA, Calhoun VD, Dickerson BC, Atri A, Chua EF, Miller SL, et al. Alterations in memory networks in mild cognitive impairment and Alzheimer’s disease: an independent component analysis. J Neurosci. 2006;26:10222–10231. doi: 10.1523/JNEUROSCI.2250-06.2006. [DOI] [PMC free article] [PubMed] [Google Scholar]
- 42.Hamalainen A, Pihlajamaki M, Tanila H, Hanninen T, Niskanen E, Tervo S, et al. Increased fMRI responses during encoding in mild cognitive impairment. Neurobiol Aging. 2007;28:1889–1903. doi: 10.1016/j.neurobiolaging.2006.08.008. [DOI] [PubMed] [Google Scholar]
- 43.Heun R, Freymann K, Erb M, Leube DT, Jessen F, Kircher TT, et al. Mild cognitive impairment (MCI) and actual retrieval performance affect cerebral activation in the elderly. Neurobiol Aging. 2007;28:404–413. doi: 10.1016/j.neurobiolaging.2006.01.012. [DOI] [PubMed] [Google Scholar]
- 44.Dickerson BC, Sperling RA. Large-scale functional brain network abnormalities in Alzheimer’s disease: insights from functional neuroimaging. Behav Neurol. 2009;21:63–75. doi: 10.3233/BEN-2009-0227. [DOI] [PMC free article] [PubMed] [Google Scholar]
- 45.Machulda MM, Ward HA, Borowski B, Gunter JL, Cha RH, O’Brien PC, et al. Comparison of memory fMRI response among normal, MCI, and Alzheimer’s patients. Neurology. 2003;61:500–506. doi: 10.1212/01.wnl.0000079052.01016.78. [DOI] [PMC free article] [PubMed] [Google Scholar]
- 46.Bakker A, Krauss GL, Albert MS, Speck CL, Jones LR, Stark CE, et al. Reduction of hippocampal hyperactivity improves cognition in amnestic mild cognitive impairment. Neuron. 2012;74:467–474. doi: 10.1016/j.neuron.2012.03.023. [DOI] [PMC free article] [PubMed] [Google Scholar]
- 47.Price JL, Morris JC. Tangles and plaques in nondemented aging and “preclinical” Alzheimer’s disease. Ann Neurol. 1999;45:358–368. doi: 10.1002/1531-8249(199903)45:3<358::aid-ana12>3.0.co;2-x. [DOI] [PubMed] [Google Scholar]
- 48.Morris JC, Roe CM, Xiong C, Fagan AM, Goate AM, Holtzman DM, et al. APOE predicts amyloid-beta but not tau Alzheimer pathology in cognitively normal aging. Ann Neurol. 2010;67:122–131. doi: 10.1002/ana.21843. [DOI] [PMC free article] [PubMed] [Google Scholar]
- 49.Braak H, Braak E. Neuropathological Staging of Alzheimer-Related Changes. Acta Neuropathol. 1991;82:239–259. doi: 10.1007/BF00308809. [DOI] [PubMed] [Google Scholar]
- 50.Klunk WE, Engler H, Nordberg A, Wang Y, Blomqvist G, Holt DP, et al. Imaging brain amyloid in Alzheimer’s disease with Pittsburgh Compound-B. Ann Neurol. 2004;55:306–319. doi: 10.1002/ana.20009. [DOI] [PubMed] [Google Scholar]
- 51.Johnson KA, Gregas M, Becker JA, Kinnecom C, Salat DH, Moran EK, et al. Imaging of amyloid burden and distribution in cerebral amyloid angiopathy. Ann Neurol. 2007;62:229–234. doi: 10.1002/ana.21164. [DOI] [PubMed] [Google Scholar]
- 52.Gomperts SN, Rentz DM, Moran E, Becker JA, Locascio JJ, Klunk WE, et al. Imaging amyloid deposition in Lewy body diseases. Neurology. 2008;71:903–910. doi: 10.1212/01.wnl.0000326146.60732.d6. [DOI] [PMC free article] [PubMed] [Google Scholar]
- 53.Vlassenko AG, Mintun MA, Xiong C, Sheline YI, Goate AM, Benzinger TL, et al. Amyloid-beta plaque growth in cognitively normal adults: longitudinal [11C]Pittsburgh compound B data. Ann Neurol. 2011;70:857–861. doi: 10.1002/ana.22608. [DOI] [PMC free article] [PubMed] [Google Scholar]
- 54.Becker JA, Hedden T, Carmasin J, Maye J, Rentz DM, Putcha D, et al. Amyloid-beta associated cortical thinning in clinically normal elderly. Ann Neurol. 2011;69:1032–1042. doi: 10.1002/ana.22333. [DOI] [PMC free article] [PubMed] [Google Scholar]
- 55.Storandt M, Mintun MA, Head D, Morris JC. Cognitive decline and brain volume loss as signatures of cerebral amyloid-beta peptide deposition identified with Pittsburgh compound B: cognitive decline associated with Abeta deposition. Arch Neurol. 2009;66:1476–1481. doi: 10.1001/archneurol.2009.272. [DOI] [PMC free article] [PubMed] [Google Scholar]
- 56.Morris JC, Roe CM, Grant EA, Head D, Storandt M, Goate AM, et al. Pittsburgh compound B imaging and prediction of progression from cognitive normality to symptomatic Alzheimer disease. Arch Neurol. 2009;66:1469–1475. doi: 10.1001/archneurol.2009.269. [DOI] [PMC free article] [PubMed] [Google Scholar]
- 57.Jonsson T, Atwal JK, Steinberg S, Snaedal J, Jonsson PV, Bjornsson S, et al. A mutation in APP protects against Alzheimer’s disease and age-related cognitive decline. Nature. 2012 doi: 10.1038/nature11283. [DOI] [PubMed] [Google Scholar]
- 58.Sperling RA, Aisen PS, Beckett LA, Bennett DA, Craft S, Fagan AM, et al. Toward defining the preclinical stages of Alzheimer’s disease: recommendations from the National Institute on Aging-Alzheimer’s Association workgroups on diagnostic guidelines for Alzheimer’s disease. Alzheimers Dement. 2011;7:280–292. doi: 10.1016/j.jalz.2011.03.003. [DOI] [PMC free article] [PubMed] [Google Scholar]
- 59.Jack CR, Jr, Knopman DS, Jagust WJ, Shaw LM, Aisen PS, Weiner MW, et al. Hypothetical model of dynamic biomarkers of the Alzheimer’s pathological cascade. Lancet Neurol. 2010;9:119–128. doi: 10.1016/S1474-4422(09)70299-6. [DOI] [PMC free article] [PubMed] [Google Scholar]
- 60.Braak H, Thal DR, Ghebremedhin E, DelTredici K. Stages of the pathologic process in Alzheimer disease: age categories from 1 to 100 years. J Neuropathol Exp Neurol. 2011;70:960–969. doi: 10.1097/NEN.0b013e318232a379. [DOI] [PubMed] [Google Scholar]
- 61.Liu L, Drouet V, Wu JW, Witter MP, Small SA, Clelland C, et al. Trans-synaptic spread of tau pathology in vivo. PLoS One. 2012;7:e31302. doi: 10.1371/journal.pone.0031302. [DOI] [PMC free article] [PubMed] [Google Scholar]
- 62.Jack CR, Jr, Vemuri P, Wiste HJ, Weigand SD, Aisen PS, Trojanowski JQ, et al. Evidence for ordering of Alzheimer disease biomarkers. Arch Neurol. 2011;68:1526–1535. doi: 10.1001/archneurol.2011.183. [DOI] [PMC free article] [PubMed] [Google Scholar]
- 63.Bateman RJ, Xiong C, Benzinger TL, Fagan AM, Goate A, Fox NC, et al. Clinical and Biomarker Changes in Dominantly Inherited Alzheimer’s Disease. N Engl J Med. 2012 doi: 10.1056/NEJMoa1202753. [DOI] [PMC free article] [PubMed] [Google Scholar]
- 64.Sheline YI, Morris JC, Snyder AZ, Price JL, Yan Z, D’Angelo G, et al. APOE4 allele disrupts resting state fMRI connectivity in the absence of amyloid plaques or decreased CSF Abeta42. J Neurosci. 2010;30:17035–17040. doi: 10.1523/JNEUROSCI.3987-10.2010. [DOI] [PMC free article] [PubMed] [Google Scholar]
- 65.Reiman EM, Chen K, Alexander GE, Caselli RJ, Bandy D, Osborne D, et al. Functional brain abnormalities in young adults at genetic risk for late-onset Alzheimer’s dementia. Proc Natl Acad Sci U S A. 2004;101:284–289. doi: 10.1073/pnas.2635903100. [DOI] [PMC free article] [PubMed] [Google Scholar]
- 66.Filippini N, MacIntosh BJ, Hough MG, Goodwin GM, Frisoni GB, Smith SM, et al. Distinct patterns of brain activity in young carriers of the APOE-epsilon4 allele. Proc Natl Acad Sci U S A. 2009;106:7209–7214. doi: 10.1073/pnas.0811879106. [DOI] [PMC free article] [PubMed] [Google Scholar]
- 67.Machulda MM, Jones DT, Vemuri P, McDade E, Avula R, Przybelski S, et al. Effect of APOE epsilon4 status on intrinsic network connectivity in cognitively normal elderly subjects. Arch Neurol. 2011;68:1131–1136. doi: 10.1001/archneurol.2011.108. [DOI] [PMC free article] [PubMed] [Google Scholar]
- 68.Sheline YI, Raichle ME, Snyder AZ, Morris JC, Head D, Wang S, et al. Amyloid plaques disrupt resting state default mode network connectivity in cognitively normal elderly. Biol Psychiatry. 2010;67:584–587. doi: 10.1016/j.biopsych.2009.08.024. [DOI] [PMC free article] [PubMed] [Google Scholar]
- 69.Hedden T, Van Dijk KR, Becker JA, Mehta A, Sperling RA, Johnson KA, et al. Disruption of functional connectivity in clinically normal older adults harboring amyloid burden. J Neurosci. 2009;29:12686–12694. doi: 10.1523/JNEUROSCI.3189-09.2009. [DOI] [PMC free article] [PubMed] [Google Scholar]
- 70.Oh H, Mormino EC, Madison C, Hayenga A, Smiljic A, Jagust WJ. beta-Amyloid affects frontal and posterior brain networks in normal aging. Neuroimage. 2011;54:1887–1895. doi: 10.1016/j.neuroimage.2010.10.027. [DOI] [PMC free article] [PubMed] [Google Scholar]
- 71.Kobayashi Y, Amaral DG. Macaque monkey retrosplenial cortex: II. Cortical afferents. The Journal of Comparative Neurology. 2003;466:48–79. doi: 10.1002/cne.10883. [DOI] [PubMed] [Google Scholar]
- 72.Parvizi J, Van Hoesen GW, Buckwalter J, Damasio A. Neural connections of the posteromedial cortex in the macaque. Proc Natl Acad Sci U S A. 2006;103:1563–1568. doi: 10.1073/pnas.0507729103. [DOI] [PMC free article] [PubMed] [Google Scholar]
- 73.Drzezga A, Becker JA, Van Dijk KR, Sreenivasan A, Talukdar T, Sullivan C, et al. Neuronal dysfunction and disconnection of cortical hubs in non-demented subjects with elevated amyloid burden. Brain. 2011;134:1635–1646. doi: 10.1093/brain/awr066. [DOI] [PMC free article] [PubMed] [Google Scholar]
- 74.Mormino EC, Smiljic A, Hayenga AO, Onami SH, Greicius MD, Rabinovici GD, et al. Relationships between Beta-Amyloid and Functional Connectivity in Different Components of the Default Mode Network in Aging. Cerebral Cortex. 2011;21:2399–2407. doi: 10.1093/cercor/bhr025. [DOI] [PMC free article] [PubMed] [Google Scholar]
- 75.Sibson NR, Dhankhar A, Mason GF, Behar KL, Rothman DL, Shulman RG. In vivo 13C NMR measurements of cerebral glutamine synthesis as evidence for glutamate-glutamine cycling. Proc Natl Acad Sci U S A. 1997;94:2699–2704. doi: 10.1073/pnas.94.6.2699. [DOI] [PMC free article] [PubMed] [Google Scholar]
- 76.Shulman RG, Rothman DL, Behar KL, Hyder F. Energetic basis of brain activity: implications for neuroimaging. Trends Neurosci. 2004;27:489–495. doi: 10.1016/j.tins.2004.06.005. [DOI] [PubMed] [Google Scholar]
- 77.Cirrito JR, Yamada KA, Finn MB, Sloviter RS, Bales KR, May PC, et al. Synaptic activity regulates interstitial fluid amyloid-beta levels in vivo. Neuron. 2005;48:913–922. doi: 10.1016/j.neuron.2005.10.028. [DOI] [PubMed] [Google Scholar]
- 78.Buckner RL, Snyder AZ, Shannon BJ, LaRossa G, Sachs R, Fotenos AF, et al. Molecular, structural, and functional characterization of Alzheimer’s disease: evidence for a relationship between default activity, amyloid, and memory. J Neurosci. 2005;25:7709–7717. doi: 10.1523/JNEUROSCI.2177-05.2005. [DOI] [PMC free article] [PubMed] [Google Scholar]
- 79.Vlassenko AG, Vaishnavi SN, Couture L, Sacco D, Shannon BJ, Mach RH, et al. Spatial correlation between brain aerobic glycolysis and amyloid-beta (Abeta) deposition. Proc Natl Acad Sci U S A. 2010;107:17763–17767. doi: 10.1073/pnas.1010461107. [DOI] [PMC free article] [PubMed] [Google Scholar]
- 80.Newington JT, Rappon T, Albers S, Wong DY, Rylett RJ, Cumming RC. Overexpression of pyruvate dehydrogenase kinase 1 and lactate dehydrogenase A in nerve cells confers resistance to amyloid beta and other toxins by decreasing mitochondrial respiration and ROS production. J Biol Chem. 2012 doi: 10.1074/jbc.M112.366195. [DOI] [PMC free article] [PubMed] [Google Scholar]
- 81.Vander Heiden MG, Cantley LC, Thompson CB. Understanding the Warburg effect: the metabolic requirements of cell proliferation. Science. 2009;324:1029–1033. doi: 10.1126/science.1160809. [DOI] [PMC free article] [PubMed] [Google Scholar]
- 82.Vaughn AE, Deshmukh M. Glucose metabolism inhibits apoptosis in neurons and cancer cells by redox inactivation of cytochrome c. Nat Cell Biol. 2008;10:1477–1483. doi: 10.1038/ncb1807. [DOI] [PMC free article] [PubMed] [Google Scholar]
- 83.Pellerin L, Magistretti PJ. Glutamate uptake into astrocytes stimulates aerobic glycolysis: a mechanism coupling neuronal activity to glucose utilization. Proc Natl Acad Sci U S A. 1994;91:10625–10629. doi: 10.1073/pnas.91.22.10625. [DOI] [PMC free article] [PubMed] [Google Scholar]
- 84.Olney JW. Excitotoxicity, apoptosis and neuropsychiatric disorders. Curr Opin Pharmacol. 2003;3:101–109. [PubMed] [Google Scholar]
- 85.Zhang D, Hou Q, Wang M, Lin A, Jarzylo L, Navis A, et al. Na, K-ATPase activity regulates AMPA receptor turnover through proteasome-mediated proteolysis. J Neurosci. 2009;29:4498–4511. doi: 10.1523/JNEUROSCI.6094-08.2009. [DOI] [PMC free article] [PubMed] [Google Scholar]
- 86.Hsieh H, Boehm J, Sato C, Iwatsubo T, Tomita T, Sisodia S, et al. AMPAR removal underlies Abeta-induced synaptic depression and dendritic spine loss. Neuron. 2006;52:831–843. doi: 10.1016/j.neuron.2006.10.035. [DOI] [PMC free article] [PubMed] [Google Scholar]
- 87.Brand KA, Hermfisse U. Aerobic glycolysis by proliferating cells: a protective strategy against reactive oxygen species. FASEB J. 1997;11:388–395. doi: 10.1096/fasebj.11.5.9141507. [DOI] [PubMed] [Google Scholar]
- 88.Mattson MP, Magnus T. Ageing and neuronal vulnerability. Nat Rev Neurosci. 2006;7:278–294. doi: 10.1038/nrn1886. [DOI] [PMC free article] [PubMed] [Google Scholar]
- 89.Fukui H, Moraes CT. The mitochondrial impairment, oxidative stress and neurodegeneration connection: reality or just an attractive hypothesis? Trends Neurosci. 2008;31:251–256. doi: 10.1016/j.tins.2008.02.008. [DOI] [PMC free article] [PubMed] [Google Scholar]
- 90.Magistretti PJ. Neuron-glia metabolic coupling and plasticity. J Exp Biol. 2006;209:2304–2311. doi: 10.1242/jeb.02208. [DOI] [PubMed] [Google Scholar]
- 91.Allaman I, Gavillet M, Belanger M, Laroche T, Viertl D, Lashuel HA, et al. Amyloid-beta aggregates cause alterations of astrocytic metabolic phenotype: impact on neuronal viability. J Neurosci. 2010;30:3326–3338. doi: 10.1523/JNEUROSCI.5098-09.2010. [DOI] [PMC free article] [PubMed] [Google Scholar]
- 92.Galvin JE, Price JL, Yan Z, Morris JC, Sheline YI. Resting bold fMRI differentiates dementia with Lewy bodies vs Alzheimer disease. Neurology. 2011;76:1797–1803. doi: 10.1212/WNL.0b013e31821ccc83. [DOI] [PMC free article] [PubMed] [Google Scholar]
- 93.Seeley WW, Menon V, Schatzberg AF, Keller J, Glover GH, Kenna H, et al. Dissociable intrinsic connectivity networks for salience processing and executive control. J Neurosci. 2007;27:2349–2356. doi: 10.1523/JNEUROSCI.5587-06.2007. [DOI] [PMC free article] [PubMed] [Google Scholar]
- 94.Zhang D, Raichle ME. Disease and the brain’s dark energy. Nat Rev Neurol. 2010;6:15–28. doi: 10.1038/nrneurol.2009.198. [DOI] [PubMed] [Google Scholar]
Associated Data
This section collects any data citations, data availability statements, or supplementary materials included in this article.