

Abstract
Objective
To analyze longitudinal trends in the incidence, etiology, and treatment of hepatocellular carcinoma (HCC) in community residents in Olmsted County, Minnesota, and their survival.
Patients and Methods
Olmsted County residents 20 years or older with HCC newly diagnosed from January 1, 1976, through December 31, 2008, were identified using a community-wide medical record linkage system (Rochester Epidemiology Project). The incidence rate of HCC was calculated by age and sex according to the 2000 US Census population. Temporal trends of HCC etiology, treatment, and patient survival were assessed.
Results
The age- and sex-adjusted incidence rate for HCC in Olmsted County was 3.5 per 100,000 person-years for the first era (1976-1990), 3.8 per 100,000 for the second era (1991-2000), and 6.9 per 100,000 for the third era (2001-2008). Alcohol use was the most common risk factor in the first and second eras and chronic hepatitis C virus in the third. The proportion attributed to nonalcoholic fatty liver disease was small (5/47 [10.6%] in the third era). Because the proportion of patients receiving curative treatment increased over time, survival also improved, with a median survival time of 3, 6, and 9 months in the first, second, and third eras, respectively (P=.01).
Conclusion
In this midwestern US community, the incidence of HCC has increased, primarily due to hepatitis C virus. Although there was a demonstrable improvement in the outcome of HCC in community residents over time, the overall prognosis remains poor.
Hepatocellular carcinoma (HCC) remains the third leading cause of cancer-related death in the world, with 748,000 estimated deaths in 2008.1 The incidence of HCC in the United States is estimated to have nearly tripled during the past 3 decades, from 1.6 to 4.6 cases per 100,000 person-years.2 The increasing incidence of HCC is also reflected in the increasing rates of mortality and hospital use for HCC in the United States.3 Although the increasing burden of HCC is well established, detailed population-based data on HCC in the United States are sparse.
Worldwide, hepatitis B virus (HBV) and hepatitis C virus (HCV) are the 2 most common causes of HCC, accounting for 78% of cases.4 In developing countries, HBV is the most common cause of HCC, whereas HCV is more common in developed countries.5 In the United States, the number of individuals at risk for HCC from viral hepatitis is believed to have increased as a result of lengthening duration of infection of HCV-infected Americans and increasing number of immigrants with chronic HBV infection.6 More recently, the increasing prevalence of obesity has raised concerns that nonalcoholic fatty liver disease (NAFLD), including nonalcoholic steatohepatitis, has also become an important risk factor for HCC.7 However, the extent to which NAFLD has contributed to the epidemic of HCC is uncertain.8
Besides the increasing trends in HCC incidence, little is known about the long-term outcomes of HCC in the United States. In the past 2 decades, substantial improvement has been made in the diagnosis and management of HCC. A number of interventions, such as liver transplant, have been shown to improve survival if applied in early stages of HCC.9 Furthermore, modalities such as transarterial chemoembolization and molecular-targeted treatment have been shown to prolong survival in patients with intermediate- and advanced-stage HCC.10,11 It is unclear, however, whether these new modalities have had any effect on HCC outcomes at the population level. To address these questions, we conducted a study to describe trends in the incidence rates, risk factors, treatment, and survival in HCC patients residing in Olmsted County, Minnesota.
Patients and Methods
All patients older than 20 years with newly diagnosed HCC who resided in Olmsted County, Minnesota, from January 1, 1976, through December 31, 2008, were identified using the Rochester Epidemiology Project database.12 The database uses the Hospital International Classification of Disease Adaptation system. The codes used to identify all potential HCC patients included (1) hepatocellular carcinoma, primary (01550150); (2) neoplasm, malignant, liver primary (01550110); (3) hepatoma, not otherwise specified (malignant) (01550140); (4) carcinoma, hepatocellular, code also neoplasm, malignant by site–liver (01550141); and (5) carcinoma, liver cell (01550151). Only those individuals who lived within Olmsted County for at least 1 year before their HCC diagnosis were included to prevent inclusion of patients who might have moved to Olmsted County for the care of HCC.
To verify the HCC diagnosis, all available pathology slides were reviewed by a single pathologist (S.O.S.). In patients in whom HCC was diagnosed without a biopsy, a single radiologist (B.K.) reviewed the radiographic images to verify the diagnosis according to the guidelines from the American Association for the Study of Liver Disease.13 In addition, a small number of patients who had lesions with the characteristic angiographic pattern and received transarterial chemoembolization (2/104 [1.9%]) and comfort care (2/104 [1.9%]) were included in this study after independent review of medical records from experienced hepatologists (L.R.R., W.R.K.). This study was approved by the institutional review boards of Mayo Clinic and Olmsted Medical Center.
Data Collection
Relevant clinical information was abstracted from medical records. These data included the etiology of underlying liver disease, comorbidities, laboratory results, characteristics and extent of the tumor, treatment, survival, follow-up status, and, if applicable, cause of death.
Infection with HBV was defined by positive hepatitis surface antigen and HCV infection by detectable HCV RNA or anti-HCV. Alcohol use was considered a cause of HCC when the patient had a documented history of alcoholic liver disease, alcohol abuse, or dependence.14,15 Nonalcoholic fatty liver disease was considered a cause of HCC when the patient had a documented history of NAFLD or had radiographic or histologic evidence of fatty infiltration in the absence of significant alcohol history at HCC diagnosis or at any time before HCC diagnosis.8 Cirrhosis was defined by histologic analysis, evidence of portal hypertension, morphologic characteristics consistent with cirrhosis in cross-sectional images, and/or thrombocytopenia (platelet count, <150 × 109L [to convert to ×103/μL, multiply by 1).16 Tumor characteristics were recorded on the basis of cross-sectional images obtained at the time of HCC diagnosis.
Vital status of study participants was assessed as of December 31, 2009. The cause of death was divided into 3 categories. Progressive HCC was designated in patients in whom increasing tumor burden with or without liver dysfunction was directly linked to death. Liver failure with controlled HCC represents circumstances in which HCC was under control by curative or locoregional treatment but the patient died of progressive liver dysfunction. Non–liver-related death was designated if the tumor and liver function were stable but the patient died of other causes.
Statistical Analyses
The R (http://www.r-project.org/) and SAS (SAS Institute Inc, Cary, NC) statistical software packages were used for statistical analyses. We divided the whole cohort into 3 groups based on the time of HCC diagnosis. The first group includes patients with HCC whose diagnoses were made in 1990 or earlier when HCV testing was not available. We divided the rest of the cohort into 2 groups (diagnosis made before or after 2000) for the statistical test for trends. The linear regression analysis (variable ranks as the outcome and era as the predictor) was used to assess the trend of continuous variables, and the Cochran-Armitage trend test was used for comparison of proportions.
In calculating incidence rates in the community, the entire population of Olmsted County (age ≥20 years) was considered to be at risk. Age-specific person-years were estimated from these decennial census data with linear interpolation between census years. With the assumption that incident cases follow a Poisson distribution, 95% confidence intervals (CIs) for incidence rate and age-specific incidence rate ratios were calculated. Standardized incidence rates were calculated by adjusting the incidence rates to the population structure of the United States in 2000. Sensitivity analyses were performed to examine the effect of using different definitions of HCC on estimates of HCC incidence.
Patient survival was assessed from the time of HCC diagnosis to the last known follow-up or death. For patients who have not died or were lost to follow-up, the observation was censored on the day of last follow-up or the date of study closure. Survival probabilities were estimated using the Kaplan-Meier method and compared by the log rank test.
Results
Patient Characteristics
Initially, 239 patients with a diagnosis of HCC were identified in the Rochester Epidemiology Project database. On review of the records, 34 patients (14.2%) were excluded because the 1-year residency requirement was not met, whereas 101 patients (42.3%) did not satisfy the HCC diagnosis criteria, including liver metastasis from other primary cancers or unknown primary (51/101 [50.5%]), cholangiocarcinoma (15/101 [14.8%]), gallbladder cancer (4/101 [4.0%]), and other benign diagnoses (31/101 [30.7%]). Thus, the final study participants included in this analysis were 104 Olmsted County residents with verified diagnoses of HCC. Table 1 summarizes the characteristics of patients in this study at the time of diagnosis. The mean age of our patients was 65.5 years, and two-thirds were male. Although the predominant race was white, the proportion of white patients decreased over time (P=.04). The proportion of patients who had cirrhosis at the time of HCC diagnosis increased over time. There was a reciprocal decrease in the proportion of patients in whom histologic analysis was used for diagnosis. Mean body mass index increased over time (P=.02), and there was a trend toward increasing prevalence of hypertension (P=.14).
TABLE 1.
Characteristics of Olmsted County Residents Diagnosed as Having HCC, 1976-2008a
| Characteristic | 1976-1990 (n=29) | 1991-2000 (n=28) | 2001-2008 (n=47) | Overall (N=104) | P value for trend |
|---|---|---|---|---|---|
| Age, mean ± SD (y) | 63.4±19.4 | 61.1±16.9 | 69.4±12.3 | 65.5±16.1 | .18 |
| Male | 19 (65.5) | 20 (71.4) | 32 (68.1) | 71 (68.3) | .86 |
| Race | .04b | ||||
| White | 27 (93.1) | 23 (82.1) | 35 (74.5) | 85 (81.7) | |
| African American | 1 (3.4) | 0 | 10 (21.3) | 11 (10.6) | |
| Asian | 1 (3.4) | 5 (17.9) | 2 (4.3) | 8 (7.7) | |
| Immigrant | 3 (10.3) | 6 (21.4) | 9 (19.2) | 18 (17.3) | .37 |
| Liver cirrhosis | 15 (51.7) | 17 (60.7) | 37 (78.7) | 69 (66.4) | .01 |
| Histologic diagnosis of HCC | 28 (96.6) | 21 (75.0) | 27 (57.4) | 76 (73.1) | <.01 |
| BMI, mean ± SD | 25.7±4.3 | 29.6±10.6 | 29.2±6.5 | 28.3±7.5 | .02 |
| Diabetes mellitus | 8 (27.6) | 8 (28.6) | 17 (36.2) | 33 (31.7) | .41 |
| Hypertension | 10 (34.5) | 11 (39.3) | 24 (51.1) | 45 (43.3) | .14 |
Data are presented as No. (percentage) of patients unless indicated otherwise. BMI = body mass index; HCC = hepatocellular carcinoma.
Tested as white vs other races.
Incidence Rates of HCC
In the first era (1976-1990), the age-adjusted incidence rate of HCC was 3.5 (95% CI, 2.2-4.8) per 100,000 person-years overall, 5.6 (95% CI, 3.0-8.3) per 100,000 person-years for men, and 2.0 (95% CI, 0.8-3.3) per 100,000 person-years for women. In the second era (1991-2000), the age-adjusted incidence rates of HCC were similar to the first era, with 3.8 (95% CI, 2.4-5.2), 6.0 (95% CI, 3.3-8.7), and 1.9 (95% CI, 0.6-3.3) per 100,000 person-years for overall, men, and women, respectively. In the third era (2001-2008), the age-adjusted incidence rates doubled to 6.9 (95% CI, 4.9-8.8) per 100,000 person-years overall, 10.9 (95% CI, 7.1-14.8) per 100,000 person-years for men, and 3.8 (95% CI, 1.9-5.8) per 100,000 person-years for women.
Table 2 gives the age-specific incidence rates of HCC in Olmsted County, which are formally compared by means of incidence rate ratios. For age groups between 20 and 49 years and between 60 and 69 years, the incidence of HCC was stable over time. The increase in HCC was most pronounced in the 50- to 59-year group, in which the incidence increased 3.3-fold in the third era compared with previous eras. A similar increase was seen in the oldest age group, in which the incidence of HCC increased 3.0-fold in the most recent era.
TABLE 2.
Incidence Rates and Incidence Rate Ratios of HCCa
| Age group (y) | Era 1 (1976-1990) |
Era 2 (1991-2000) |
Era 3 (2001-2008) |
|||||
|---|---|---|---|---|---|---|---|---|
| Incidence rate (95% CI) | Incidence rate ratio (95% CI) | Incidence rate (95% CI) | Incidence rateb ratio (95% CI) | P value | Incidence rate (95% CI) | Incidence rateb ratio (95% CI) | P value | |
| 20-49 | 1.1 (0.4-2.2) | 1 (Reference) | 1.3 (0.5-2.7) | 1.2 (0.4-3.5) | .70 | 0.8 (0.2-2.1) | 0.7 (0.2-2.1) | .53 |
| 50-59 | 1.7 (0.2-6.0) | 1 (Reference) | 2.7 (0.6-7.8) | 1.6 (0.3-9.7) | .60 | 7.1 (3.1-14.0) | 3.3 (1.1-10.2) | .04 |
| 60-69 | 10.2 (4.7-19.4) | 1 (Reference) | 13.5 (6.5-24.8) | 1.3 (0.5-3.3) | .54 | 12.9 (5.9-24.4) | 1.1 (0.5-2.4) | .82 |
| ≥70 | 11.4 (5.7-20.3) | 1 (Reference) | 9.2 (4.0-18.0) | 0.8 (0.3-2.0) | .64 | 30.9 (20.2-45.2) | 3.0 (1.7-5.4) | <.01 |
CI = confidence interval; HCC = hepatocellular carcinoma.
Incidence rate ratios in relation to all prior years.
We performed sensitivity analyses using different definitions of HCC. First, when the analysis was restricted to histologically proven HCCs, the age- and sex-adjusted incidence rates were 3.4 (95% CI, 2.1-4.7), 2.8 (95% CI, 1.6-4.0), and 4.0 (95% CI, 2.5-5.5) per 100,000 person-years in the first, second, and third eras, respectively (P=.28). Second, when the 4 patients who did not strictly meet the American Association for the Study of Liver Disease criteria were excluded, incidence rates and the trend remained virtually unchanged: the incidence was 3.5 (95% CI, 2.2-4.8) per 100,000 person-years in the first era, 3.5 (95% CI, 2.2-4.9) per 100,000 person-years in the second, and 6.6 (95% CI, 4.7-8.5) per 100,000 person-years in the latest (P=.001).
Etiology of HCC
Figure 1 shows the temporal changes in the underlying etiology of HCC. In the first era (1976-1990), alcohol use was the most common cause of HCC. As expected, no HCV diagnoses were made during this era. However, in the second era (1991-2000), the proportion of HCCs attributable to HCV increased rapidly to 25.0% (7/28) (including 7.1% [2/28] who had both HCV and alcohol use as a cause of HCC). By the third era (2001-2008), 21 (44.7%) of 47 HCC patients had evidence of chronic HCV infection.
FIGURE 1.
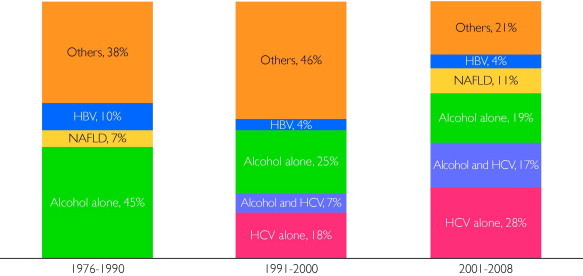
Trends in the risk factors for hepatocellular carcinoma among Olmsted County, Minnesota, residents, 1976-2008. HBV = hepatitis B virus; HCV = hepatitis C virus; NAFLD = nonalcoholic fatty liver disease.
Given the noticeable increase in the proportion of patients with HCV, we further investigated the effect of HCV in different age groups (Supplemental Table 1, available online at http://www.mayoclinicproceedings.org). The increase in the proportion of HCV affected the 50- to 59-year-old group the most; 7 (87.5%) of 8 had HCV in the most recent period. In addition, coexisting alcoholic liver disease was common in HCV patients who developed HCC at age younger than 60 years: 6 (75.0%) of 8 HCV patients younger than 60 years had coexisting alcoholic liver disease, whereas only 1 (6.3%) of 16 patients aged 60 years or older did (P<.01).
In the first 2 eras, 11 (37.9%) of 29 and 13 (46.4%) of 28 patients were classified as having HCC of an “other” etiology, most of whom (23/24 [95.8%]) did not have an identifiable cause of underlying liver disease. The proportion of this category decreased to 21.3% (10/47) in the third era. Overall, only 8 (26.7%) of 30 patients with HCC of an unknown etiology had evidence of cirrhosis. Although the proportion of patients with NAFLD increased recently, NAFLD accounted for only 5 (10.6%) of 47 cases of all HCC in the most recent era. Because patients with NAFLD may present as having cryptogenic cirrhosis, we compared patients with NAFLD (n=5) and those with HCC of unknown etiology (n=7). In the latter group, only 2 patients (28.6%) had evidence of cirrhosis, whereas 4 patients with NAFLD (80.0%) had cirrhosis. With regard to risk factors for NAFLD, the proportions with hypertension (80.0% [4/5] vs 57.1% [4/7]) and diabetes mellitus (60.0% [3/5] vs 42.9% [3/7]) and mean body mass index (35 vs 27) were higher in patients with NAFLD than in those with HCC of an unknown etiology.
Clinical Management and Outcome of HCC
There was a trend for the diagnosis to be made at an earlier stage (eg, fewer lesions and smaller size) and in patients with better liver function in the more recent era (Table 3). Subsequently, 14 (29.8%) of 47 patients received potentially curative surgical treatment, including resection and liver transplant in the most recent era.
TABLE 3.
Liver Dysfunction, Tumor Characteristics, and Primary Treatment for HCC in Olmsted County, Minnesota, Residents, 1976-2008a
| Variable | Era 1 (1976-1990) (n=29) | Era 2 (1991-2000) (n=28) | Era 3 (2001-2008) (n=47) | Total (N=104) | P value for trend |
|---|---|---|---|---|---|
| Laboratory datab | |||||
| INRc | 1.3 (1.3-1.4) | 1.2 (1.1-1.3) | 1.1 (1.0-1.2) | 1.1 (1.1-1.3) | <.01 |
| Albumin (g/dL) | 3.2 (2.7-3.4) | 3.3 (3.0-3.9) | 3.6 (3.1-3.8) | 3.3 (3.0-3.8) | .06 |
| Bilirubin (mg/dL) | 1.6 (0.8-4.7) | 1.3 (0.7-2.3) | 1.1 (0.6-1.8) | 1.3 (0.7-2.2) | .03 |
| Creatinine (mg/dL) | 1.0 (0.9-1.1) | 1.0 (0.9-1.2) | 1.1 (0.9-1.4) | 1.0 (0.9-1.3) | .06 |
| MELD | 11.0 (8.0-16.0) | 11.0 (9.0-14.5) | 10.0 (8.0-13.0) | 11.0 (8.0-14.0) | .47 |
| AFP (ng/mL) | 123 (6-13,830) | 25 (6-1900) | 33 (6-367) | 34 (6-658) | .37 |
| Tumor characteristics | |||||
| No. (range) of tumors | 2 (1-5) | 1.5 (1-5) | 1 (1-3) | 1 (1-5) | .07 |
| Size (range) of the largest tumor, cm | 5.0 (3.8-10.8) | 4.7 (3.0-7.0) | 3.9 (2.3-8.0) | 4.3 (2.7-7.8) | .15 |
| Metastasis (%) | 25 | 14 | 15 | 18 | .26 |
| Primary treatment, No. (%)d | .14e | ||||
| Resection | 4 (13.8) | 6 (21.4) | 6 (12.8) | 16 (15.4) | |
| Liver transplant | 0 | 2 (7.1) | 8 (17.0) | 10 (9.6) | |
| Local ablation | 1 (3.4) | 0 | 8 (17.0) | 9 (8.6) | |
| TACE or TARE | 0 | 1 (3.6) | 10 (21.3) | 11 (10.6) | |
| Systemic treatment | 7 (24.1) | 3 (10.7) | 2 (4.3) | 12 (11.5) | |
| Comfort care | 17 (58.6) | 15 (53.6) | 13 (27.7) | 45 (43.3) |
Continuous variables are presented as median (interquartile range). AFP = α-fetoprotein; INR = international normalized ratio; MELD = model for end-stage liver disease; TACE = transarterial chemoembolization; TARE = transarterial radioembolization.
To convert albumin to g/L, multiply by 10; to convert bilirubin to μmol/L, multiply by 17.1; to convert creatinine values to μmol/L, multiply by 88.4; to convert AFP values to μg/L, multiply by 1.
Thirteen of 29 patients in era 1 had missing INR data because INR was not available before 1985. Three patients in era 2 also had missing INR data.
For patients who had multiple treatments, treatments were counted once in the following order: liver transplant, resection, local ablation, TACE or TARE, systemic treatment, and comfort care.
Tested as curative (resection, orthotopic liver transplant) vs noncurative (all others). P for trend = .007 if local ablation is categorized as curative.
Figure 2 shows the survival probability after the HCC diagnosis for the 3 eras. The median survival was 3, 6, and 9 months in the first, second, and third eras, respectively. One-year survival rates were 28%, 43%, and 44%, and 5-year survival rates were 3%, 18%, and 15% in the 3 eras, respectively. Although the overall survival improved significantly over time (P=.01), prognosis was still poor.
FIGURE 2.
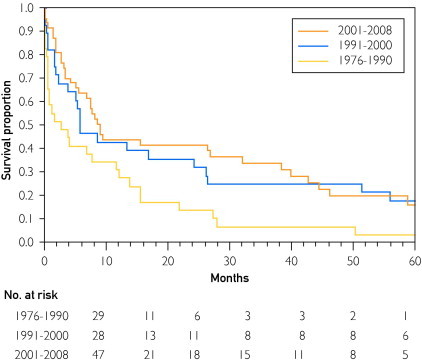
Trends in the survival of Olmsted County, Minnesota, residents with hepatocellular carcinoma, 1976-2008 (P=.01).
Of 104 patients, 90 (86.5%) had died as of December 31, 2009. With regard to the cause of death, most patients died of progressive HCC: 24 (85.7%) of 28 in the first era, 18 (72.0%) of 25 in the second era, and 21 (56.8%) of 37 in the third era. Conversely, the proportion of patients who died of liver failure while their HCC was under control increased from 3.6% (1/28) to 12.0% (3/25) to 18.9% (7/37) in the first, second, and third eras, respectively. In addition, in the most recent era, 9 (24.3%) of 37 HCC patients died of causes not related to HCC or liver disease (Supplemental Table 2, available online at http://www.mayoclinicproceedings.org).
Discussion
Several studies to date have shown that the incidence of HCC has increased in the United States.2,17,18 In a recent study based on the Surveillance, Epidemiology and End Results (SEER) data set, the incidence rate of HCC was estimated to have increased from 1.6 per 100,000 person-years in 1975 to 5.1 per 100,000 person-years in 2005.2 This increasing trend was replicated in our study, in which the HCC incidence increased 2-fold from 3.5 per 100,000 person-years before 2000 to 6.9 per 100,000 person-years between 2001 and 2008. These results from this midwestern, semirural community illustrate that the epidemiologic trends that underlie the increase in HCC incidence are pervasively affecting the United States. They also lend support for the generalizability and validity of our data in relation to the United States in general.
The incidence rate of HCC in Olmsted County documented in this study (6.9 per 100,000 person-years) for 2001-2008 is higher than that in the latest nationwide report based on the National Program of Cancer Registries and SEER data (3.0 per 100,000 person-years for the United States as a whole and 2.4 per 100,000 person-years in Minnesota) between 2001 and 2006.19 A large part of this difference stems from the fact that the study by O'Connor et al19 included only histologically diagnosed HCCs, whereas our study followed the current guidelines, which allow radiographic data to be used to make the diagnosis.13 When only HCCs determined by histologic diagnosis were included in the analysis, the incidence in Olmsted County at 4.0 (95% CI, 2.5-5.5) per 100,000 person-years was much closer to yet still higher than the National Program of Cancer Registries and SEER report. These findings highlight the important point that, unlike those for most other malignant neoplasms, epidemiologic data for HCC that are only based on histologically diagnosed cases underestimate the true burden of the disease. The extent of this underestimation is uncertain. In a recent European, population-based study for 1996-2005, only 41% of the HCCs were histologically confirmed,20 whereas in our data, the frequency of histologic diagnosis was 56.8% in the most recent era and decreasing over time. Thus, our data suggest that the true incidence and burden of HCC in the United States may be even larger than previously thought.
Although the increase in the incidence of HCC has been widely recognized, few conclusive data are available to explain what underlies this important epidemiologic trend. Our data clearly show that in this community, the main driver for the recent increase in the HCC incidence was HCV. A number of previous analyses have suggested that HCV has played an important role in the HCC trend. However, our results supplement this finding because those data were based on population subgroups, including Medicare recipients (biased toward an older population),21 veterans (biased toward a population with a higher risk of HCV),22,23 and tertiary care hospital patients (biased toward a population with better access to health care).22,23 Furthermore, our age-stratified analysis of HCV etiology showed that HCV accounts for most HCC cases that occur in patients younger than 60 years, especially in those with concomitant alcoholic liver disease. Currently, NAFLD is considered a major risk factor for HCC in developed countries, including the United States.7,8,24 However, population-based studies are still scarce regarding the contribution of NAFLD to HCC trends. In our data, obtained from a region where the prevalence of obesity is high, the proportion of NAFLD-associated HCC was only 10.6% in the most recent era. This proportion (10.6%) is similar to recent data from a US referral center (460 patients diagnosed as having HCC in 2007-2009), where 13% of HCC cases were attributed to NAFLD.25
It is encouraging to see that an increasing proportion of patients had their HCC diagnosed at an early stage, allowing application of potentially curative treatment modalities. As a result, improvement in survival was demonstrable. Although some of this increase in survival is attributable to lead-time bias, we believe that there was true improvement in survival because in the more recent era more patients underwent liver resection or transplant, whereas fewer patients died of cancer-related causes. Despite the encouraging trends in mortality, however, the overall survival of HCC patients is still poor and must improve further.2,26,27
Our study has several limitations. First, the data from Olmsted County may not be completely generalizable to the entire United States in terms of racial/ethnic distribution, disease patterns, and access to care. For example, in this semirural community in which the white race is overrepresented, the prevalence of HCV is lower than in the rest of the United States.28 Thus, compared with the United States as a whole, the HCC incidence, as well as the complications of HCV infection, would be expected to be lower in Olmsted County. However, as previously stated, our incidence estimate for HCC was higher than that from the national data, again suggesting that the nationwide burden of HCC in the United States has been underestimated. Second, our study is based on a relatively small number of cases, which is a function of the size of the local population. However, we cannot overemphasize the unique strength of the Rochester Epidemiology Project database, which allows complete identification of all HCC patients and the denominator population, both of which are needed for valid calculation of the incidence. Third, because the data were collected retrospectively, some of the exposure history could not be completely ascertained. For example, quantitative assessment of alcohol drinking would have strengthened our assessment of patients with alcoholic liver disease. Commonly, however, physicians made the diagnosis of alcoholic liver disease without a detailed documentation of lifetime alcohol use pattern. Finally, one might argue that our local patients had better access to state-of-the-art care for HCC, given the proximity to Mayo Clinic. That may have been the case for a few patients whose HCC was diagnosed early enough to be candidates for potentially curative treatment. Ultimately, however, our survival figures are comparable to other population-based data.2
Conclusion
In this community-based study, the incidence of HCC in Olmsted County increased significantly over time, mirroring the national statistics. Even in this midwestern community, HCV infection was the most important driver of the increase in HCC incidence, although alcohol use remained an important cause. An encouraging trend was seen over time, namely, detection of HCC at earlier stages and improvement in survival; however, the overall outcome remains poor.
Footnotes
For editorial comment, seepage 7
Grant Support: This study was funded by grants DK84832 and DK34238 from the National Institute of Diabetes and Digestive and Kidney Diseases; Rochester Epidemiology Project R01 AG034676 from the National Institute on Aging; and Clinical and Translational Science Award UL1 RR024150 from the National Center for Research Resources, a component of the National Institutes of Health.
The contents are solely the responsibility of the authors and do not necessarily represent the official views of the National Institutes of Health.
Potential Competing Interests: Dr Roberts has indicated research grants from Bristol Myers Squibb and MDS Nordion.
Supplemental Online Material
Author Interview Video
References
- 1.Yang J.D., Roberts L.R. Hepatocellular carcinoma: a global view. Nat Rev Gastroenterol Hepatol. 2010;7(8):448–458. doi: 10.1038/nrgastro.2010.100. [DOI] [PMC free article] [PubMed] [Google Scholar]
- 2.Altekruse S.F., McGlynn K.A., Reichman M.E. Hepatocellular carcinoma incidence, mortality, and survival trends in the United States from 1975 to 2005. J Clin Oncol. 2009;27(9):1485–1491. doi: 10.1200/JCO.2008.20.7753. [DOI] [PMC free article] [PubMed] [Google Scholar]
- 3.Kim W.R., Gores G.J., Benson J.T., Therneau T.M., Melton L.J., III Mortality and hospital utilization for hepatocellular carcinoma in the United States. Gastroenterology. 2005;129(2):486–493. doi: 10.1016/j.gastro.2005.05.001. [DOI] [PubMed] [Google Scholar]
- 4.Perz J.F., Armstrong G.L., Farrington L.A., Hutin Y.J., Bell B.P. The contributions of hepatitis B virus and hepatitis C virus infections to cirrhosis and primary liver cancer worldwide. J Hepatol. 2006;45(4):529–538. doi: 10.1016/j.jhep.2006.05.013. [DOI] [PubMed] [Google Scholar]
- 5.Bosch F.X., Ribes J., Diaz M., Cleries R. Primary liver cancer: worldwide incidence and trends. Gastroenterology. 2004;127(5 Suppl 1):S5–S16. doi: 10.1053/j.gastro.2004.09.011. [DOI] [PubMed] [Google Scholar]
- 6.Colvin H.M., Mitchell A.E. Institute of Medicine, The National Academies Press; Washington, DC: 2010. Hepatitis and Liver Cancer: A National Strategy for Prevention and Control of Hepatitis B and C. [PubMed] [Google Scholar]
- 7.Marrero J.A., Fontana R.J., Su G.L., Conjeevaram H.S., Emick D.M., Lok A.S. NAFLD may be a common underlying liver disease in patients with hepatocellular carcinoma in the United States. Hepatology. 2002;36(6):1349–1354. doi: 10.1053/jhep.2002.36939. [DOI] [PubMed] [Google Scholar]
- 8.Adams L.A., Lymp J.F., St Sauver J. The natural history of nonalcoholic fatty liver disease: a population-based cohort study. Gastroenterology. 2005;129(1):113–121. doi: 10.1053/j.gastro.2005.04.014. [DOI] [PubMed] [Google Scholar]
- 9.Mazzaferro V., Regalia E., Doci R. Liver transplantation for the treatment of small hepatocellular carcinomas in patients with cirrhosis. N Engl J Med. 1996;334(11):693–699. doi: 10.1056/NEJM199603143341104. [DOI] [PubMed] [Google Scholar]
- 10.Llovet J.M., Real M.I., Montana X. Arterial embolisation or chemoembolisation versus symptomatic treatment in patients with unresectable hepatocellular carcinoma: a randomised controlled trial. Lancet. 2002;359(9319):1734–1739. doi: 10.1016/S0140-6736(02)08649-X. [DOI] [PubMed] [Google Scholar]
- 11.Llovet J.M., Ricci S., Mazzaferro V. Sorafenib in advanced hepatocellular carcinoma. N Engl J Med. 2008;359(4):378–390. doi: 10.1056/NEJMoa0708857. [DOI] [PubMed] [Google Scholar]
- 12.Melton L.J., III History of the Rochester Epidemiology Project. Mayo Clin Proc. 1996;71(3):266–274. doi: 10.4065/71.3.266. [DOI] [PubMed] [Google Scholar]
- 13.Bruix J., Sherman M. Management of hepatocellular carcinoma. Hepatology. 2005;42(5):1208–1236. doi: 10.1002/hep.20933. [DOI] [PubMed] [Google Scholar]
- 14.Donato F., Tagger A., Gelatti U. Alcohol and hepatocellular carcinoma: the effect of lifetime intake and hepatitis virus infections in men and women. Am J Epidemiol. 2002;155(4):323–331. doi: 10.1093/aje/155.4.323. [DOI] [PubMed] [Google Scholar]
- 15.O'Shea R.S., Dasarathy S., McCullough A.J. Alcoholic liver disease. Hepatology. 2010;51(1):307–328. doi: 10.1002/hep.23258. [DOI] [PubMed] [Google Scholar]
- 16.Yang J.D., Kim W.R., Coelho R. Cirrhosis is present in most patients with hepatitis B and hepatocellular carcinoma. Clin Gastroenterol Hepatol. 2011;9(1):64–70. doi: 10.1016/j.cgh.2010.08.019. [DOI] [PMC free article] [PubMed] [Google Scholar]
- 17.El-Serag H.B., Davila J.A., Petersen N.J., McGlynn K.A. The continuing increase in the incidence of hepatocellular carcinoma in the United States: an update. Ann Intern Med. 2003;139(10):817–823. doi: 10.7326/0003-4819-139-10-200311180-00009. [DOI] [PubMed] [Google Scholar]
- 18.El-Serag H.B., Mason A.C. Rising incidence of hepatocellular carcinoma in the United States. N Engl J Med. 1999;340(10):745–750. doi: 10.1056/NEJM199903113401001. [DOI] [PubMed] [Google Scholar]
- 19.O'Connor S., Ward J.W., Watson M., Momin B., Richardson L.C., Centers for Disease Control and Prevention (CDC) Hepatocellular carcinoma - United States, 2001-2006. MMWR Morb Mortal Wkly Rep. 2010;59(17):517–520. [PubMed] [Google Scholar]
- 20.Guiu B., Minello A., Cottet V. A 30-year, population-based study shows improved management and prognosis of hepatocellular carcinoma. Clin Gastroenterol Hepatol. 2010;8(11):986–991. doi: 10.1016/j.cgh.2010.07.018. [DOI] [PubMed] [Google Scholar]
- 21.Davila J.A., Morgan R.O., Shaib Y., McGlynn K.A., El-Serag H.B. Hepatitis C infection and the increasing incidence of hepatocellular carcinoma: a population-based study. Gastroenterology. 2004;127(5):1372–1380. doi: 10.1053/j.gastro.2004.07.020. [DOI] [PubMed] [Google Scholar]
- 22.El-Serag H.B., Mason A.C. Risk factors for the rising rates of primary liver cancer in the United States. Arch Intern Med. 2000;160(21):3227–3230. doi: 10.1001/archinte.160.21.3227. [DOI] [PubMed] [Google Scholar]
- 23.Hassan M.M., Frome A., Patt Y.Z., El-Serag H.B. Rising prevalence of hepatitis C virus infection among patients recently diagnosed with hepatocellular carcinoma in the United States. J Clin Gastroenterol. 2002;35(3):266–269. doi: 10.1097/00004836-200209000-00013. [DOI] [PubMed] [Google Scholar]
- 24.Ascha M.S., Hanouneh I.A., Lopez R., Tamimi T.A., Feldstein A.F., Zein N.N. The incidence and risk factors of hepatocellular carcinoma in patients with nonalcoholic steatohepatitis. Hepatology. 2010;51(6):1972–1978. doi: 10.1002/hep.23527. [DOI] [PubMed] [Google Scholar]
- 25.Yang J.D., Harmsen W.S., Slettedahl S.W. Factors that affect risk for hepatocellular carcinoma and effects of surveillance. Clin Gastroenterol Hepatol. 2011;9(7) doi: 10.1016/j.cgh.2011.03.027. 617–623.e1. [DOI] [PubMed] [Google Scholar]
- 26.Marrero J.A., Fontana R.J., Barrat A. Prognosis of hepatocellular carcinoma: comparison of 7 staging systems in an American cohort. Hepatology. 2005;41(4):707–716. doi: 10.1002/hep.20636. [DOI] [PubMed] [Google Scholar]
- 27.El-Serag H.B., Mason A.C., Key C. Trends in survival of patients with hepatocellular carcinoma between 1977 and 1996 in the United States. Hepatology. 2001;33(1):62–65. doi: 10.1053/jhep.2001.21041. [DOI] [PubMed] [Google Scholar]
- 28.Yawn B.P., Wollan P., Gazzuola L., Kim W.R. Diagnosis and 10-year follow-up of a community-based hepatitis C cohort. J Fam Pract. 2002;51(2):135–140. [PubMed] [Google Scholar]
Associated Data
This section collects any data citations, data availability statements, or supplementary materials included in this article.
Supplementary Materials
Author Interview Video