Abstract
A first research development progress report of the Chromosome 19 Consortium with members from Sweden, Norway, Spain, USA, China and India, a part of the Chromosome-Centric Human Proteome Project (C-HPP) global initiative is presented (http://www.c-hpp.org). From the chromosome 19 peptide-targeted library constituting 6159 peptides, a pilot study was conducted using a sub-set with 125 isotope-labeled peptides. We applied an annotation strategy with triple quadrupole, ESI-Qtrap, and MALDI mass spectrometry platforms, comparing the quality of data within, and in-between these instrumental set-ups. LC-MS conditions were outlined by multiplex assay developments, followed by MRM assay developments. SRM was applied to biobank samples, quantifying kallikrein 3 (prostate specific antigen) in plasma from prostate cancer patients. The antibody production has been initiated for more than 1200 genes from the entire chromosome 19, and the progress developments are presented. We developed a dedicated transcript microarray, to serve as the mRNA identifier by screening cancer cell lines. NAPPA protein arrays were built to align with the transcript data with the Chromosome 19 NAPPA chip, dedicated to 90 proteins, as the first development delivery. We have introduced an IT-infrastructure utilizing a LIMS system that serves as the key interface for the research teams in order to share and explore data generated within the project. The cross-site data repository will form the basis for sample processing, including biological samples, as well as patient samples from national Biobanks.
Keywords: Proteins, Genes, Antibodies, mRNA, Mass spectrometry, Bioinformatics, Protein microarray, Human Disease
1. INTRODUCTION
In September 2010, during the Human Proteome Organization’s (HUPO) annual conference in Sydney, Australia, the world’s proteomics community officially launched the Human Proteome Project (HPP), at which the chromosome 19 outline and strategy was approved. The goals of the HPP are to map and characterize human proteins in their biological context, as well as to develop novel tools and reagents that the scientific community and, more specifically, the proteomics community can use to promote their understanding in the field 1–4. This activity forms an ambitious attempt to characterize the expression, abundance and localization of at least one representative isoform of each of the 20,300-odd protein-coding genes in the human genome (http://hupo.org/research/hpp/).
The HPP has been conceived as a multi-center, multi-technology coordinated effort, and the Chromosome 19 Consortium represents one such dedicated resource. As part of the HPP, the Chromosome 19 Consortium will investigate multiple levels of biology on different but complementary analysis platforms, to provide a genome-wide human protein resource consisting of a proteome “parts list”, the protein distribution atlas, and detailed maps of protein molecular pathways, interactions, and networks 5.
Currently most drug developments are based on the protein target-based concept, where these proteins have a key function in biological processes active in disease development 6. By alteration of this function, with a pharmaceutically active drug, the disease process can be altered, and in the best case stopped, thereby limiting disease morbidity in the patient. The development steps of this drug development process will heavily rely on the basic and detailed knowledge of:
The target protein sequence(s)
The target protein forms being expressed in disease and health
Target protein modifications – post translational modifications
Target expression variation throughout the disease evolvement
The need for protein assays in all of these drug development steps is crucial, and is directly linked to the success of novel drug introductions to the healthcare market. This will make the annotation and protein assay developments in the C-HPP initiative an important science task and challenge to complete.
The current Chromosome 19 Consortium multi-center study presents data and platform developments with a synergistic and complementary output, by combining several complementary methods in one framework. The aim of this study is to outline a complementary platform development, comprising transcript and protein arrays, as well as MRM quantitation pilot study data and the antibody resource capability. The goal of the consortium is also to provide a uniform IT-infrastructure that allows inter and intra-laboratory samples and data to be handled and processed throughout continents. The Nautilus LIMS provides a sample, and data safety in terns of a documentative archiving system that is traceable and that can give evidence of details that relates to the experimental events executed.
2. EXPERIMENTAL
2.1. CLINICAL SAMPLES
Blood plasma from prostate cancer patients (n=17) was obtained from the Malmö University Hospital, Sweden. Ethical approval was granted by the Lund University (approval number LU-532-03). The samples were first depleted for the seven most abundant proteins using a MARS Hu-7 spin column following the manufacturer’s instructions (Agilent Technologies) and then were reduced and alkylated. The start volume for the processed blood plasma was 10 μL and the final restored volume was 50 μL 5% acetonitrile (ACN) with 0.1% formic acid. Tryptic digestion was performed on both seminal and blood plasma samples by adding sequencing grade trypsin (Promega) at 1:100 molar ratio calculated and incubating at 37°C overnight on a block heater shaking at 900 rpm. The reaction was stopped by addition of 10 μL of 1% formic acid. The resulting protein digests were dried on speed vacuum centrifugation and re-suspended with 100 μL of 5% ACN prior injection. The samples were stored at −20°C until analysis. Internal standard peptides (AQUA, Thermo Scientific, Ulm, Germany) were used as quantification peptides for prostate specific antigen (PSA). They were isotope labeled with 15N and 13C in lysine (+8 in mass) and arginine (+10 in mass). These heavy peptides were spiked into the samples at known concentrations and the ratio between endogenous and heavy peptide was used to calculate the concentration in the samples.
Blood serum from a colon cancer patient was obtained from the University Hospital in Salamanca, Spain. Ethical approval was provided by ethical committee of Cancer Research Center and Hospital Universotario de Salamanca, reference FIS11/02114.
2.2. MASS SPECTROMETRIC ANALYSIS OF THE SYNTHETIC PEPTIDE STANDARDS
In order to evaluate the quality and usability of the synthetic peptides, we tested isotope labeled synthetic peptides with two different qualities using different mass spectrometric platforms. 95 randomly selected peptides from PEPotec SRM Peptide Library (crude peptide purity) and 31 AQUA QuantPro (peptide purity higher than 97%, concentration precision equal or better than ±25%) (Thermo Scientific) were analyzed at three sites and the data were shared and compared.
nLC-MS/MS analysis
We took 1 μL of each crude peptide stock solution (95 in total) and mixed them. Then we dried down the sample and re-suspended the 95 peptides in 10 μL. One μL of this solution was injected into the Orbitrap Velos Pro and analyzed during a 60-minute gradient. Data analysis was performed against the human SwissProt database by using Mascot search engine. Precursor and fragment mass tolerance were set to 15 ppm and 0.7 Da, respectively. Oxidation at methionine was used as dynamic modification; carbamidomethylation on cysteine residue, heavy labeled C-terminal K and R were used as static modifications. The filters allowed 1% false discovery rate.
MALDI-MS analysis
Crude peptides, supplied by Thermo Scientific as concentrated solutions, were analyzed by MALDI-TOF MS (Bruker Ultraflextreme, Bremen, Germany) in positive ion and reflectron mode using an automated acquisition method. Briefly, 0.5 μL of crude peptides were deposited on a MALDI target that had pre-spotted CHCA matrix (Bruker). Samples were allowed to dry and spectra from 500 laser shots were acquired. Spectra were processed and compared to the theoretical mass of the heavy peptide component of each sample.
MRM assay development
Three mixtures were created from the crude peptides, ca. 30 peptides in each mixture with a concentration of 50 fmol/μL and one mixture from the QuantPro peptides with a concentration of 10 fmol/μL of each peptide. The transition lists were created in Skyline v1.2 software (MacCoss Lab). Primarily, high numbers of transitions, all possible y-ion series that matches the criteria (from m/z > precursor-2 to last ion-2, precursor m/z exclusion window: 20 Th), were selected for each peptide at both 2+ and 3+ charge states. The peptide mixtures were analyzed by nanoLC-MS/MS using a TSQ Vantage triple quadrupole mass spectrometer equipped with an Easy n-LC II pump (Thermo Scientific, Waltham, MA). The samples were injected onto an Easy C18-A1 pre-column (Thermo Scientific, Waltham, MA), and following on-line desalting and concentration the tryptic peptides were separated on a 75 μm x 150 mm fused silica column packed with ReproSil C18 (3 μm, 120 Å from Dr. Maisch GmbH, Germany). Separations were performed in a 45-min linear gradient from 10 to 35% acetonitrile containing 0.1% formic acid; at the flow rate of 300 nL/min. The MS analysis was conducted in positive ion mode with the spray voltage and declustering potential were set to 1750 V and 0, respectively. The transfer capillary temperature was set to 270°C and tuned S-lens value was used. SRM transitions were acquired in Q1 and Q3 operated at unit resolution (0.7 FWHM), the collision gas pressure in Q2 was set to 1.2 mTorr. The cycle time was 2.5 s in the non-scheduled methods and 1.5 s in the scheduled methods. The best transitions (3-5 per precursor) were selected by manual inspection of the data in Skyline and scheduled transition lists were created for the final assays. The selected transitions were tested in real matrix also by spiking the heavy peptide mixtures into human plasma digests. From the peptides that provided bad or no signals in the first round, a new mixture with higher concentration was created and the complete workflow was repeated with the addition of a MALDI-MS analysis of these peptides.
2.3. mRNA MICROARRAY
Target preparation - RNA extraction and labeling, and microarray hybridization
Total RNA extracted and purified from defined glioma-derived stem cell lines was used as the substrate for RNA amplification and labeling using a procedure based on the Eberwine protocol 7. Specifically, reverse transcription of 5 μg RNA primed with an oligo(dT) primer bearing a T7 promoter is followed by in vitro transcription in the presence of amino-allyl dUTP. We used universal human reference RNA in our analyses and treated identical aliquots concurrently with the tissue samples. The Cy5-labeled (experimental) and purified Cy3-labeled (reference) amplified RNA (aRNA) targets were combined in an optimized hybridization solution, subsequently denatured and hybridized in a humidified hybridization chamber at 46°C for 16 h. Following sequential high-stringency washes, individual Cy3 and Cy5 fluorescence hybridization to each spot on the microarray was quantitated by a high resolution confocal laser scanner.
2.4. QUANTITATIVE PROTEOMIC ANALYSIS OF 46 GLIOMA CANCER STEM CELL LINES
The experiments were performed twice from single culture dishes of Glioma cancer stem cell (GSC) lines, exactly as described in 8. Following cell lysis, protein concentrations were measured by the Bradford assay.
TMT tagging
Each sample (100 μg protein) was adjusted to give a final volume of 100 μL with 45 μL 200 mM tetraethylammonium bromide (TEAB) and ultrapure water, as necessary. Five microliters of 200 mM tris(2-carboxyethyl)phosphine (TCEP) buffered with TEAB was added to each sample and incubated at 55°C for 1 h. Five microliters of 375 mM iodoacetamide (buffered with TEAB) was added and incubated in the dark for 30 min. Proteins were precipitated in 440 μL of ice-cold acetone for 2 h at −20°C. Samples were centrifuged at 10,000 g for 30 min at 4°C. The supernatants were discarded. Pellets were air-dried and re-suspended in 12.5 μL of 8 M urea. Trypsin (10 μg in 87.5 μL of TEAB buffer) was added, and the samples incubated for 24 h at 37°C. Five single 100 μg GSC extracts at a time were tagged by use of a Thermo Scientific TMTsixplex Isobaric Mass Tagging Kit (Thermo Fisher Scientific, Rockford, IL) according to the manufacturer’s instructions. A 100-μg sample of a mixture of four GSC line digests was also tagged in order to provide a reference channel. The chemically tagged samples were mixed and stored at −80°C.
HILIC fractionation
Samples were desalted, dried and reconstituted in 1.3 mL of 85% ACN/ 56 mM formic acid (aqueous), pH 3.0. Samples were fractionated by use of a hydrophilic interaction chromatography column (HILIC, PolyLC Polyhydroxyethyl A, PolyLC Inc., Columbia, MD), 200 x 4.6 mm, particle size 5 μm. Buffer A was 85% acetonitrile (ACN)/ 56 mM formic acid, pH 3.0, and buffer B was 8.5 mM ammonium formate/56 mM formic acid, pH 3.0. Twenty-four 1 mL fractions were collected.
LC-MS/MS analysis
Fractions were dried and reconstituted in 5% (v/v) ACN and 1% (v/v) formic acid in water and injected through a UPLC system equipped with an autoinjector (Proxeon EASY nLC) on a C18 capillary column (New Objective). The peptides were separated in a 180 min gradient and analyzed in positive ion mode. The LTQ-Orbitrap Elite system was operated in a top 5 configuration with monoisotopic precursor selection enabled, and +1 and unassigned charge states rejected. Fragmentation of ions was achieved by HCD fragmentation using an isolation window of 4.5, collision energy 45 and activation time of 30 ms.
Data analysis
LC-MS/MS data analysis was performed with Proteome Discoverer (Thermo Scientific) and combined MASCOT (Matrix Science) and Sequest searches of the human Swiss-Prot database. At least two peptides were required per protein. The filters allowed a 95% confidence level per protein identification (5% false discovery rate). Protein ratios were obtained for a given GSC line extract relative to the external GSC mixed standard. Through a “ratio of ratios” approach 9, relative protein expression between any of the GSC lines can be inferred.
3. RESULTS AND DISCUSSION
3.1. CHROMOSOME 19 WORKFLOW AND STRATEGY
The Chromosome 19 research team has worked out a detailed workplan whereby specific milestones of platform validation, data acquisition and analysis will be obtained throughout the project period (see Figure 1). Our strategy encompasses both observational and targeted approaches, quality control of data sets, data storage as well as data sharing. In the observational approach applied to ongoing proteomic studies, the presence of mRNA encoded by chromosome 19 genes is measured in cells and tissues. In quantitative proteomic and phosphoproteomic assays, relative quantitation by use of isobaric tagging reagents (TMT6™, Thermo-Fisher Scientific) enables assignment of chromosome 19 protein functions in disease and response to drug treatment.
Figure 1.
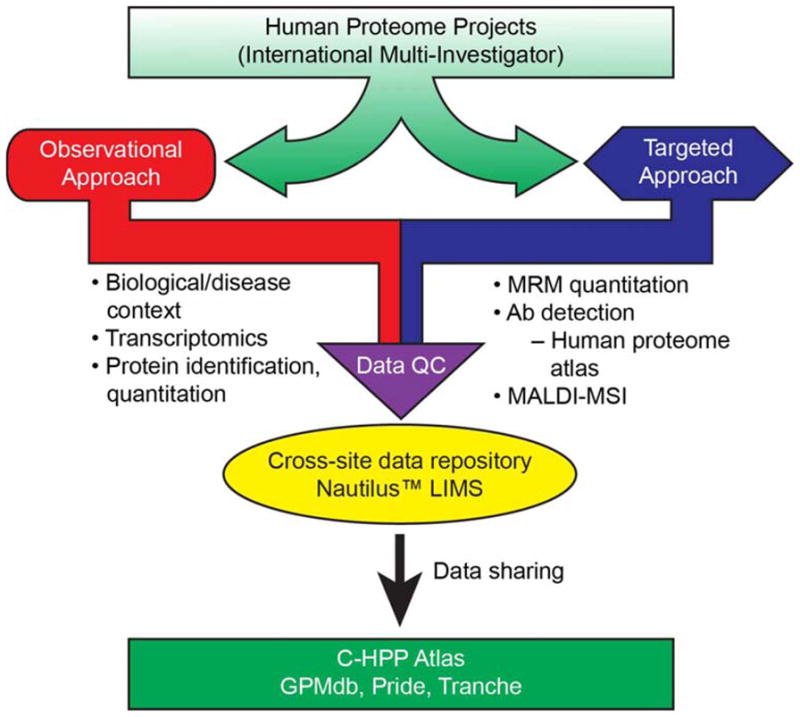
Illustration of the elements and workflow that will form the basis for the objectives and goals within the Chromosome 19 Consortium.
The C19C team is currently applying a targeted approach where we develop and outline validated assays with both mass spectrometry, and antibody based platforms in order to fulfill the annotation of all coded proteins. Simultaneously, we apply an observational approach, where we make protein discovery and identification, as well as characterization of antibodies in Biological and Diseased samples, i.e., the B/D-approach. In order to fulfill the goals of the project the Consortium has established a toolbox resource strategy outlined in Figure 1. This multipronged approach constitutes: synthesized peptide library to be used within the mass spectrometric platforms, antibody library for protein assessment and disease correlation, protein and transcript microarray platforms and IT infrastructure that interconnects the data flow and analysis output within the consortium.
3.2. BIOINFORMATIC ANNOTATIONS ON CHROMOSOME 19
3.2.1. Genomic Characteristics of Chromosome 19
Chromosome 19 is one of the 22 autosomal chromosomes in humans. Chromosome 19 spans about 64 million base pairs; this high number represents more than 2 percent of the total DNA in human cells. Because researchers use different approaches to predict the number of genes on each chromosome, the estimated number of genes varies.
In addition, chromosome 19 has the highest gene density of all human chromosomes. It is more than twice the genome-wide average. The characteristics of chromosome 19 also provide evidence of large clusteres of gene families, that corresponds to high G + C content, CpG islands and density of repetitive DNA indicate a chromosome rich in biological and evolutionary significance 10. Chromosome 19 is also unique in its density of repeat sequences. It was found that close to 55% of this chromosome consists of repetitive elements. Chromosomes 6, 7, 14, 20, 21 and 22 all have repeat contents ranging from 40% to 46%; the genome average is 44.8%. The characteristics of chromosome 19 (Table 1) are due mainly to an unusually high content of short interspersed nuclear elements (SINEs) 10.
Table 1.
Genomic data of chromosome 19
| Length (bps) | 59,128,983 |
| Known Protein-coding Genes | 1400 |
| Novel Protein-coding Genes | 18 |
| Pseudogene Genes | 180 |
| miRNA Genes | 110 |
| rRNA Genes | 13 |
| snRNA Genes | 29 |
| snoRNA Genes | 31 |
| Miscellaneous RNA Genes | 15 |
| SNPs | 987,809 |
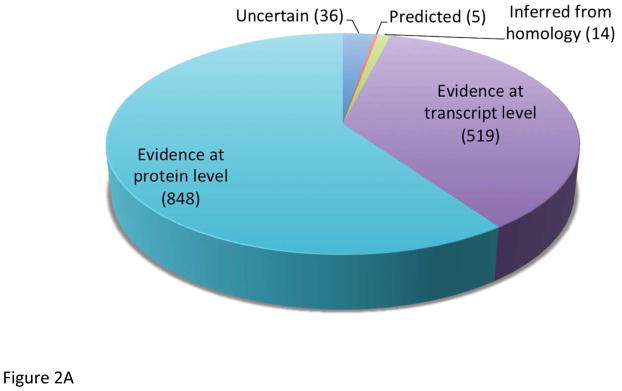
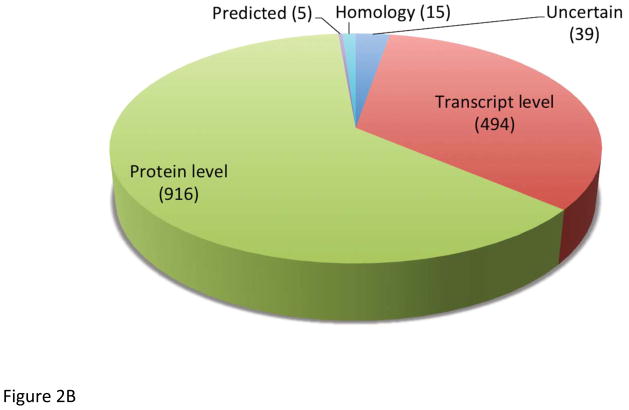
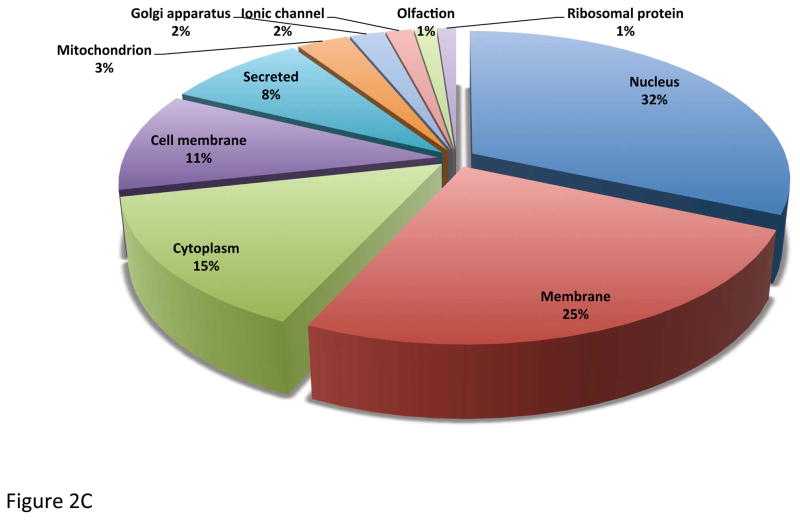
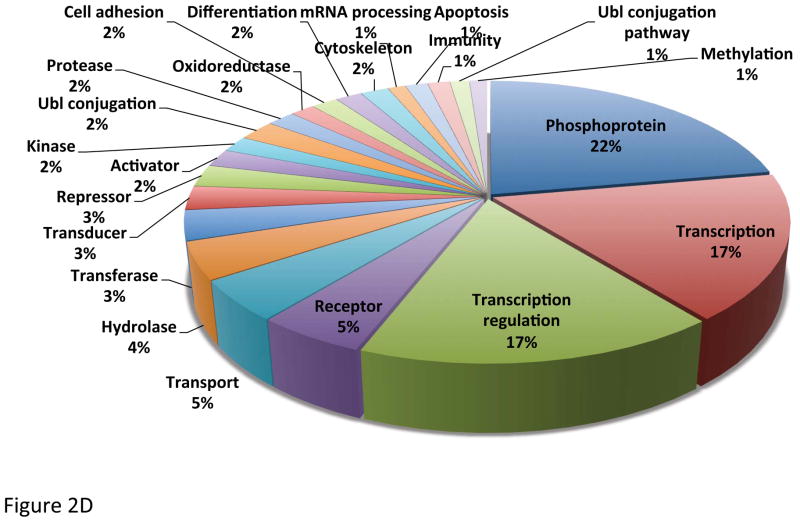
Chromosome 19 likely contains about 1,400 protein-coded genes, based on the database searches in UniProt and neXtProt (see Figure 2AB). More than 60% of chromosome 19 proteins have already been identified at expression level, whereas the about 36% is known from transcript data only and an additional small fraction (<4%) is predicted or unknown. Proteins coded on chromosome 19 are represented in all cellular compartments, mostly in nucleus, cytoplasm and membranes as shown in Figure 2C. Similarly, these proteins participate in a wide array of biological functions, including transcription, regulation and transport as the Protein Information and Knowledge Exchange (PIKE - http://proteo.cnb.csic.es/pike) has revealed (see Figure 2D). The number of genes clustered on chromosome 19 has been proven to have disease links, such as the kallikreins linked to prostate cancer, the zinc finger proteins linked to inflammatory diseases, as well as the apolipoproteins’ (C2 and E) functions that relate to cardiovascular diseases. The data and output generated within C19, will apply standards for mass spectrometry based proteomics 11–14.
Figure 2.
Identification of proteins by using (A) UniProt (version 2012_04 April 18, 2012) and (B) neXtProt database (version 2012_04_10). Localization (C) and functions (D) of proteins presented are based on database search in PRIDE.
3.2.2. Chromosome 19 Peptide Library
Selected target peptides for each chromosome 19 protein is a key requisite for our research teams in order to build assay platforms as well as verify expression levels of proteins in patient samples from biobank archives. This, in order to manage an efficient annotation of such a large number of proteins, and to outline the disease association and function, this peptide library is mandatory. We apply a strategy where we utilize target peptides to known proteins, as well as unknown proteins, as a tool function and resource to our research teams. The collection of peptides derived from proteins coded on chromosome 19 has been gathered, containing 6159 sequences. The corresponding number of proteins is 1374, i.e., 75% of which is represented by 2–6 sequences/protein, providing multiple choices for selecting signature peptides. Furthermore, the library has 241 sequences that are specific to isoforms of 182 proteins. Out of these, 101 peptides are specific to single-nucleotide polymorphism, which is also reflected in the protein sequence as an amino acid alteration. This becomes a unique possibility for the C19C to develop assays for identification of proteins coded on chromosome 19.
In order to develop specific assays for protein identification and quantification, we have recently purchased the Human SRM ATLAS Peptide Library (Thermo Scientific), developed at the Institute for System Biology (ISB), Seattle, WA, USA. The library contains 93,140 non-labeled, synthetic peptide sequences with crude quality, which correspond to 24,524 unique accession numbers. More information about the specification is available at the following webpage, www.thermoscientific.com/SRM-ATLAS. We have identified 6159 peptides in the Atlas that are uniquely associated with protein consensus sequences coded on chromosome 19 (Supplementary Table 1). Most of the chromosome 19 proteins have at least one, but usually two to six unique peptides in the Atlas, and only 46 proteins (based on search in UniProt DB) are not represented in our peptide repository. Our goal it to employ these Human SRM Atlas sequences to develop specific quantitative mass spectrometry assays. Perhaps the most challenging issue will be the detection and quantification of the almost 40% chromosome 19 proteins that have never been detected at the protein level.
3.3. PILOT STUDY – TARGETED 126 ISOTOPE LABELED PEPTIDES
Selecting a specific peptide library for a given chromosome is a real challenge, as it implies that in silico predictions are made as the basis for target peptide selections where in many cases, they do not hold any experimental evidence. Another challenge is the homology of peptide repeats in protein classes and families. It is also evident that diseases do not link to single chromosome only; rather it has multiple chromosome assignment. As the target peptides are the key link to biology, and disease signatures appearing in clinical samples, it is mandatory to fulfill the consortium objective to build a peptide library that holds the highest value. We have given high priority to establish and provide an extensive human peptide library covering most of the 20,300 proteins in 22 autosomal and YX chromosomes, and select the targeted 6159 peptides from chromosome 19, for sequences and details, see Supplement Table 1.
3.3.1. MS Survey of Peptide Library Samples
A dedicated peptide library is a key tool in our C-HPP activities, however in order to be able to follow up with quantitative data in biobank studies of protein expression, isotope labeled peptides are mandatory. We initiated an experimental study with isotope labeled peptides that represented chromosome 19 target peptides as well as peptides from many other chromosomes. The quality of the crude peptides, used in this pilot study is the same as in the SRM Atlas, except that these peptides were synthesized with a heavy labeled C-terminal Lysine or Arginine. Isotope labeled crude peptides are equally valid during the MRM assay development as the normally used non-labeled peptides, with additional benefits, such as the validation of the transitions in spiked biological samples and the possibility of relative quantitation.
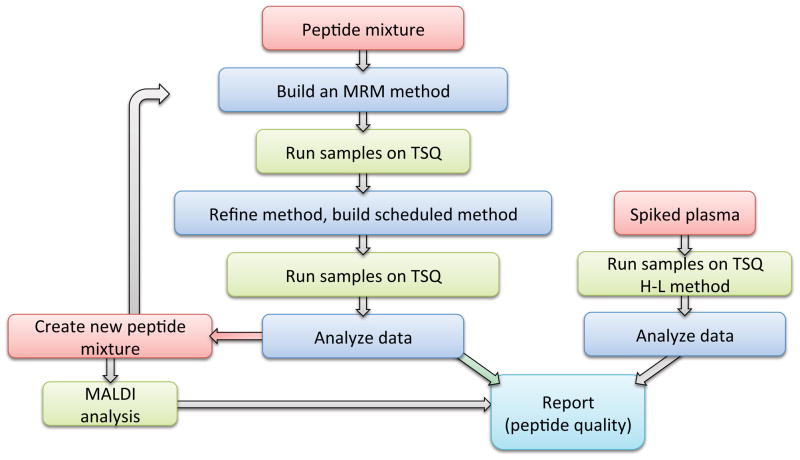
We utilized three different mass spectrometric platforms within this pilot study analyzing the subset of 126 peptides (shown in Table 2). In order to evaluate our planned targeted workflow, illustrated on Figure 3, we tested isotope labeled synthetic peptides with two different qualities. 95 randomly selected peptides from PEPotec SRM Peptide Library (crude peptide purity) and 31 AQUA QuantPro (peptide purity higher than 97%, concentration precision equal or better than ±25%) (Thermo Scientific) were analyzed (shown in Table 2).
Table 2A.
Comprehensive results of the MS analyses of synthetic peptides – QuantPro peptides
| Protein acc. number | Sequence | Mass [Da] | Quality | hydrophobicity | conc. [pmol/μL] | MRM signal |
|---|---|---|---|---|---|---|
| O46675 | AAGAPVVNEL[R] | 1106.3 | QuantPro | 24.8 | 5 | Excellent |
| Q95122 | LGAAQVPAQLLVAVL[R] | 1629.0 | QuantPro | 45.2 | 5 | Poor/No |
| P34955 | LSISETYDL[K] | 1176.3 | QuantPro | 29.6 | 5 | Excellent |
| P79105 | DQPTID[K] | 823.9 | QuantPro | 9.9 | 5 | No |
| P42819 | ADQFANEWG[R] | 1203.3 | QuantPro | 27.0 | 5 | Excellent |
| P17931 | IQVLVEPDHF[K] | 1332.6 | QuantPro | 30.8 | 5 | Good |
| P36925 | THSTPFHP[K] | 1059.2 | QuantPro | 4.9 | Poor | |
| Q58CQ9 | NLDLLEGAVTSAS[K] | 1425.6 | QuantPro | 37.1 | 5 | Excellent |
| P59693 | DVELAEEVLSE[K] | 1368.5 | QuantPro | 35.7 | 5 | Excellent |
| P51743 | AGGPQGS[R] | 738.8 | QuantPro | 3.0 | 5 | No |
| P01023 | LPPNVVEESA[R] | 1220.4 | QuantPro | 23.8 | 5 | Good |
| Q2MH07 | NSAYAHVFHDDDL[R] | 1669.8 | QuantPro | 22.0 | 5 | Good |
| Q58CQ9 | DSAPNTLSDLTTQAL[R] | 1712.9 | QuantPro | 33.6 | 5 | Good |
| P79105 | VGHFDTLN[K] | 1038.2 | QuantPro | 14.3 | 5 | Excellent |
| P02787/P02788 | YYGYTGAF[R] | 1107.2 | QuantPro | 26.4 | 5 | Good |
| P24627 | GEADALNLDGGYIYTAG[K] | 1836.0 | QuantPro | 37.4 | 5 | Good |
| P29622 | ADLSGIT[K] | 811.9 | QuantPro | 17.0 | 5 | Excellent |
| ETIQGITDPLF[K] | 1369.6 | QuantPro | 37.3 | 5 | Excellent | |
| P07288/P20151 | IVGGWE[Cys(CAM)]E[K] | 1085.2 | QuantPro | 32.9 | 5 | Good |
| SHDRSEEFLIAG[K] | 1496.6 | QuantPro | 22.9 | 5 | Good | |
| P02452 | SLSQQIENI[R] | 1197.3 | QuantPro | 23.5 | 5 | Excellent |
| P07288 | AV[Cys(CAM)]GGVLVHPQWVLTAAH[Cys(CAM)]I[R] | 2354.8 | QuantPro | 47.3 | 5 | Poor/No |
| P36980 | IT[Cys(CAM)]AEEGWSPTP[K] | 1483.7 | QuantPro | 35.4 | 5 | Excellent |
| Q64345 | APNQTDVLQ[K] | 1121.3 | QuantPro | 16.0 | 5 | Excellent |
| Q64345 | QFSVDAL[K] | 915.0 | QuantPro | 23.4 | 5 | Excellent |
| HAPEAQEPTQ[R] | 1273.4 | QuantPro | 7.5 | 5 | Good | |
| Q8C267 | A[Cys(CAM)]PLSSDGE[Cys(CAM)]AGY[K] | 1522.7 | QuantPro | 36.9 | 5 | Good |
| A6H5X4 | LSSGPPAQP[K] | 989.1 | QuantPro | 11.5 | 5 | Excellent |
| Q64282 | AITLYL[K] | 829.0 | QuantPro | 24.9 | 5 | Good |
| Q64282 | GQQDEALQSL[K] | 1224.3 | QuantPro | 23.1 | 5 | Excellent |
| Q64339 | ELLGEYGL[K] | 1029.2 | QantPro | 30.6 | 5 | Excellent |
Figure 3.
Schematic illustration of the workflow applied within the pilot study.
We performed MALDI-MS analysis, nLC-MS/MS analysis in order to get sequence identification and nLC-MRM/MS analysis to provide transition lists for each peptide. Data analyses were made at each site and then the records were shared within C19C to create a comprehensive report.
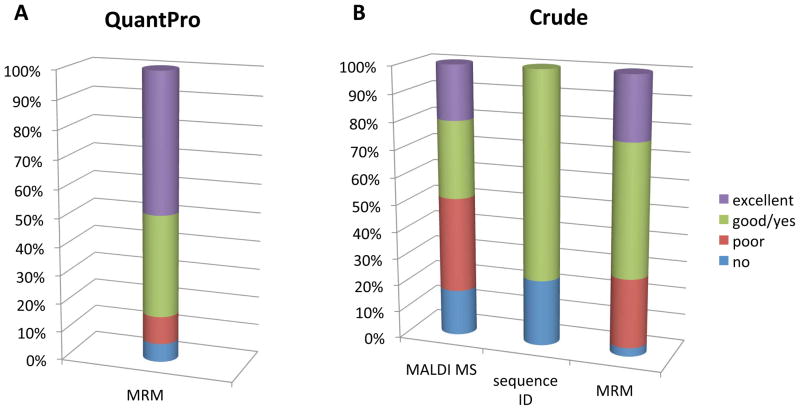
The higher quality peptides, QuantPro (peptide purity higher than 97%), were analyzed by nanoLC-MRM/MS, and only 4 out of the 31 peptides did not give a satisfactory signal in the MRM assay (Figure 4A). Two of them were highly hydrophobic (hydrophobicity higher than 45) and the other two were short, hydrophilic sequences. These four peptides would not be predicted to perform well as SRM standards. These findings underscore the importance of the use of intelligent design of standards through predictive software tools.
Figure 4.
The results from the comprehensive MS analysis of synthetic peptides used in the Pilot Study.
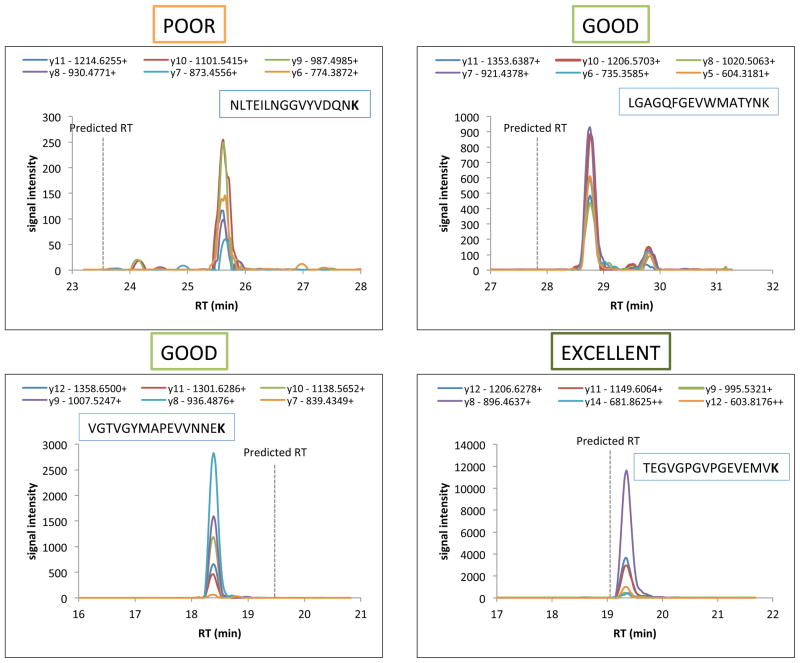
The 95 crude peptides were analyzed in all the three MS platforms. Satisfactory spectra were obtained from each case in the MALD-MS analysis, but the intensities of the heavy peptides were highly variable between samples. 20% of the peptides were not detectable using a MALDI-TOF instrument. The remaining peptides were divided into 3 groups based on the relation between the heavy peptide signal and the background (Table 2B and Figure 4B). More than 50% of the full set gave good, i.e., appropriate target peptide signal but in a complex background, or excellent responses, i.e., the target peptide signal is the major component in the spectrum. We could confirm 72 peptide sequences out of the 95 using nanoLC-MS/MS analysis together with database search, and only 24% of the peptides could not provide good quality MS/MS spectra. The crude peptides were divided into three groups for the MRM analysis, and we followed a two-round workflow, illustrated on Figure 3. We found that 85% of the crude peptides gave appreciable signal in the first round, which could be increased to 95% by increasing the concentration in the second round of analysis (Figure 4B and Table 2B). The five best transitions were selected for each precursor ion, and we kept both the doubly and the triply charged precursor ions, when the signals were equally good. We compared the experimental fragment ion distribution with the spectral library data, when it was available, and the dotp values were 0.9 or higher in most cases. Since many of the randomly selected sequences contained methionine we used methionine oxidation as variable modification, and followed the changed precursor and fragment ions, as well. We provided the collected MRM data in table format, containing the 5 best transitions for each precursor, with fragment ion ranks, collision energies, retention times, peak areas and injected volumes (Supplementary Table 2). We created three categories based on the quality of the acquired MRM signals, as demonstrated on Figure 5 with some representative examples. 24 out of the 95 peptides gave poor results, i.e., the group of transitions was identifiable, but with really low intensities, or clear signal was only detectable in the second round, with higher injected amounts. Nearly 50% of the peptides provided peaks close to the expected retention times with moderate or high signal intensities, categorized as good MRM signal; and 22 peptides represented with really high signals, which we named the excellent category.
Figure 5.
Categories of the MRM results illustrated by selected examples.
The transitions were further investigated in human plasma digest, as a clinical matrix. In pooled human plasma digest we were able to detect endogenous signals correspond to three monitored peptides (Supplementary Figure 1); in addition we could not find any matrix interference in the selected heavy transitions. Overall we analyzed six chromosome 19 related tryptic peptides (highlighted in bold in Table 2) in the pilot study, and four of them provided appropriate signal in the MRM assay. One peptide, IVGGWECE[K] was further investigated in the kallikrein assay analyzing the linearity range and LOQ.
The results obtained by these three MS platforms were in agreement in most cases, and it is quite obvious, that the most sensitive approach is the targeted LC-MRM/MS analysis. Despite the low purity of the crude peptides as proved by the MALDI-MS determinations, the peptides were found to be highly suitable for the development of MRM assays.
By using the workflow illustrated in Figure 3 of the pilot study analyzing randomly selected peptide sequences from the Human SRM ATLAS, we can confirm the statement of Dr. Robert Moritz that approximately 90% of the ATLAS peptides are usable in multiplex MRM assay developments.
3.4. SWEDISH BIOBANK CANCER PATIENT SAMPLES
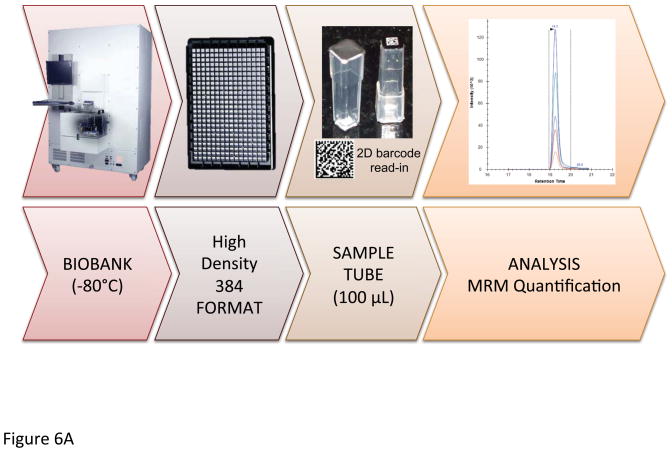
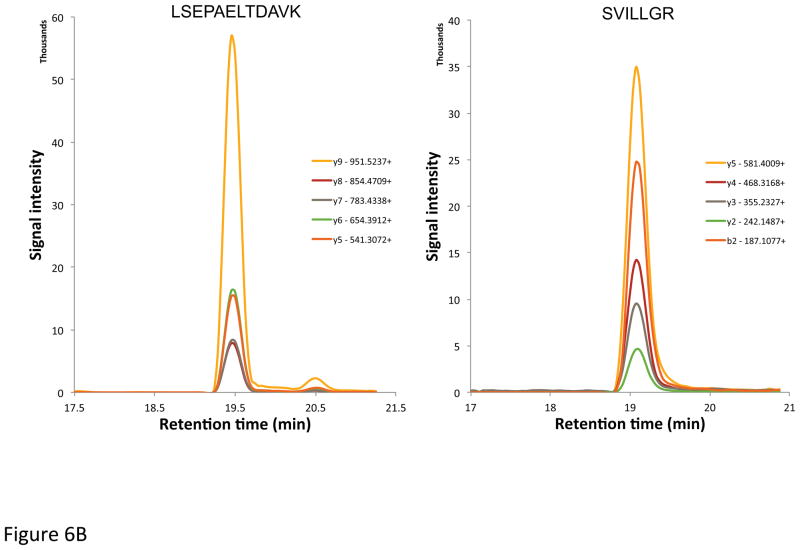
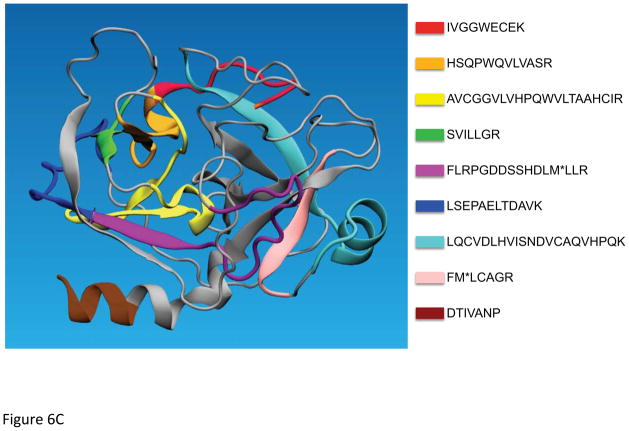
A selection of peptides was chosen to provide expression quantitations on kallikrein 3 (prostate specific antigen – PSA), a marker of prostate cancer. These data were generated from prostate cancer patients, where the plasma samples were retrieved from a local Swedish biobank. The sample workflow, utilizing patient samples retrieved from a biobank in Sweden is depicted in Figure 6A. In Figure 6B, the resulting MRM data are presented with the signals of the transitions of the respective PSA sequences of the most useful target peptides LSEPAELTDAVK and SVILLGR. Comparing PSA levels estimated by the MRM assay and ELISA tests, we could conclude that the concordance was remarkably high by comparing the peptides; LSEPAELTDAVK, FMLCAGR, HSQPWQVLVASR and FLRPGDDSSHDLMLLR. Figure 6C provides structure details of PSA where the color-coding is assigned to each tryptic peptide sequence that potentially are useful for the identification and quantification of PSA in the prostate cancer samples from the biobank. Due to the difference in digestion efficiency and ionization properties and furthermore due to the low endogenous level of PSA in clinical samples, typically the peptide sequences in the order of LSEPAELTDAVK, SVILLGR, FMLCAGR, HSQPWQVLVASR and FLRPGDDSSHDLMLLR appeared to be useful as signature peptides. However, the difficulties related to oxidation of methionine and tryptophan, the latter three sequences were excluded in developing a quantification assay of PSA. Notably, the tryptic peptide of IVGGWECEK (red color in Figure 6C) is not proteotypic as both kallikrein 2 (hK2) and PSA share this sequence. However, this common sequence provided a combined expression level of hK2 and PSA, where the low abundant level of hK2 can be disregarded in patient screening utilizing blood plasma.
Figure 6.
Illustration of the biobanking workflow (A). Selected MRM transitions of the signature peptides of PSA (B). PSA 3D structure with indication of the tryptic peptides used for identification (C).
3.5. ANTIBODY GENERATION
In order to annotate the presence of the chromosome 19-encoded proteins in tissues, antibodies targeting these proteins are generated. The process includes generation of antigens (Protein Epitope Signature Tags - PrESTs) and antibodies, analyses of selected biosamples, validation of the results and publication of the acquired data on an open web page (www.proteinatlas.org). The antibodies are used for immunohistochemistry (IHC) staining of tissue to visualize the protein expression patterns and thereby render tissue and cellular localization of proteins available, both at cellular and subcellular levels. Throughout the different steps in the process focus is put on the final selectivity of the raised antibody 15. The chromosome 19 team works closely with Human Protein Atlas to utilize common resources and platforms to build future values.
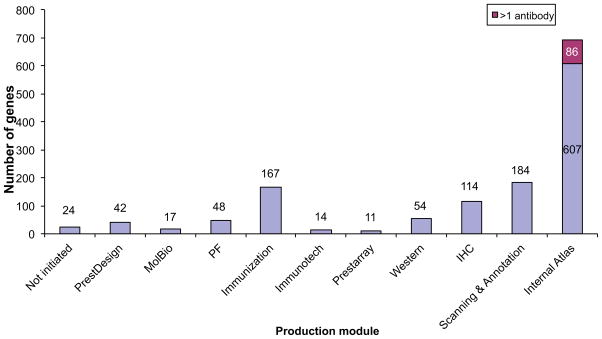
According to ENSEMBL, chromosome 19 consists of almost 1400 genes and antibody production has been initiated for more than 1200 of these (see Figure 7). These are currently in different production modules and all will eventually be processed until antibodies are achieved. For more than 85% of the genes, mRNA has been isolated from human RNA-pools and the DNA have been cloned into expression vectors. For most of these genes, PrESTs have already been produced. Antibodies have been raised against the protein product of almost 900 genes and more than 700 of these have been validated and the achieved expression patterns can be found on the Protein Atlas web page (www.proteinatlas.org). So far, about 150 genes have been further processed. Two antibodies have been produced directed to the same encoded protein and these antibodies have been used in tissue analysis (immunohistochemistry - IHC). This strategy gives the opportunity to compare the attained expression patterns and thereby a more accurate comprehension of the results can be achieved.
Figure 7.
Schematic overview of the workflow status of Chromosome 19 genes.
3.6. PROTEIN MICROARRAY
Nucleic Acids Programmable Protein Arrays (NAPPA) are utilized within C19C for high-throughput screening (HTS), validation and protein function conformations. Currently, most established method for HTS production of recombinant proteins relies on expression and purification in E. coli. However, not all human proteins can be accurately expressed in E. coli. To overcome these limitations, recent efforts aimed to sequence, annotate and clone full length open reading frames (ORFs) for several pathogens or human proteins have become successful and many of these reagents are currently widely available (www.dnasu.org and www.plasmid.med.harvard.edu).
Recombinant proteins from an expression library are often used and, while many can be expressed in cellular systems, there are many other proteins (including antibodies) for which expression can be made using cell-free expression systems from cDNA, using commercially available in vitro systems 16. We apply an alternative approach for microarray fabrication with cell-free protein production using in situ methods, in which proteins of different properties are simultaneously immobilized and produced, enabling arrays to be created on demand with very low initial concentration requirements with NAPPA, protein in situ array (PISA), or in situ puromycin capture from mRNA arrays.
In our Chromosome 19 Consortium, NAPPA arrays have been already implemented with a collection of cDNA around 500 human proteins encoded in chromosome 19, and sequence validated. Currently, a subset of 90-protein NAPPA microarray has been developed in cell-free expression vector system. The quantitative expression levels are related to the fluorescent readout from a colon cancer patient.
3.7. mRNA MICROARRAY
In order to address gene activity in cells and tissue, a chromosome 19 chip assay was devised (for gene representation, see Supplementary Table 3). All tissues and cells were analyzed for gene activity related to chromosome 19 at the Falk Center for Molecular Therapeutics in Evanston, IL. Understanding which parts of the chromosome genome are active in tissues in various experimental conditions can help guide us in the development of proteomic assays to identify proteins and their isoforms in the 30% of the chromosome 19 proteome that have not yet been detected. Expression data from a pilot chromosome 19 array, which contained 192 chromosome 19-specific transcripts (chosen at random), corroborated other focused arrays that we have designed, in that it produced approximately 65–75% measurable signals from transcripts expressed in the human GSC lines. Of particular interest, expression of four of the seven ORF transcripts encoding as yet unidentified proteins that were represented on this pilot array (~60%) was clearly detectable. Based on these results, we fully expect a similar proportion of positive signals on the full Chromosome 19 array platform, described below.
Microarray fabrication, validation, and quality control
The 1422 transcripts comprising our chromosome 19 microarrays were compiled from the Chromosome-Centric Human Proteome Project database (release: 2012.04 from 18Apr2012) and provided comprehensive representation from both defined and putative transcripts (see Supplementary Table 4). Individual 45-mer oligonucleotides complementary to these sequences were designed and prioritized based on combining very stringent selection criteria (minimal secondary structure, minimal homology to other genes in the available human genomic databases, no low complexity or repeat regions, defined Tm) with a statistical ranking algorithm 17. Control oligonucleotides representing the most traditionally accepted and commonly utilized housekeeping genes 18 were also be similarly designed, prioritized, and included on the array. These optimal oligonucleotides were individually synthesized in 96-well plates utilizing standard phosphoramidite chemistry. Each oligonucleotide was capped with a 5’-amino linker ensuring covalent attachment of only full-length, properly synthesized oligos to epoxy-treated glass microarray slides. Microarray manufacture utilized a robotic microarrayer to covalently link quadruplicate elements to epoxy-treated glass slides using previously optimized parameters. Each batch was quality controlled stringently prior to each analysis, exactly as described in 19, 20. Specifically, the dynamic range, discrimination power, accuracy, reproducibility, and specificity of the oligonucleotide microarrays used in these studies were evaluated by exogenous mRNA spiking experiments 21. We used discrimination power, or the ability to discriminate authentic signal from background at the low end of the dynamic range, to set appropriate cutoffs prior to statistical analysis of the data (described below). Any data obtained that are below this cutoff were excluded. The dynamic range of detection of our microarray platform, defined as the range of transcript abundance over, which hybridization intensity was linearly correlated, was found to be between two and three orders of magnitude in six independent experiments. The data from our pilot chromosome 19-centric chip fell within this dynamic range. Reproducibility levels using our microarray platform, as estimated by coefficients of variation, are typically CV=0.09. The accuracy of the microarray results, as determined by direct comparison to individual mRNA abundance determined by qRT-PCR analysis of the spiked mRNA samples, routinely produced Pearson correlation coefficients of greater than +0.92.
Data acquisition and statistical analysis
Arrays were scanned using two lasers (633 nm and 543 nm) at 5 μm resolution at the maximal laser power that produced no saturated spots. Data from these scans were then analyzed using the adaptive threshold method to differentiate the spot from the background. Spot intensity was determined using median pixel intensity. Prior to normalization, quality confidence measurements (spot diameter, spot area, array footprint, spot circularity, signal-to-noise ratio, spot uniformity, background uniformity, and replicate uniformity) were calculated for each scanned array to assess overall quality and to ensure that acceptable tolerance limits are not exceeded. Spots that did not pass stringent selection criteria were eliminated. The data from each channel were normalized using the locally weighted scatterplot smoothing (LOWESS) curve-fitting equation. Statistical analyses were performed using the significance analysis of microarrays (SAM) software package (Stanford University 22). This software utilizes an algorithm based on the Student’s t-test to derive statistically significantly differentially expressed genes between two groups of samples using a permutation-based determination of the median false discovery rate (FDR). The SAM algorithm reports the FDR as the percentage of genes in the identified gene list (rather than in the entire cohort of genes present on the microarray) that are falsely reported as showing statistically significant differential expression. The threshold of differential expression is adjusted to identify different sizes of sets of putatively significant genes, and FDRs modified accordingly. The cutoff for significance in these experiments was initially set at a FDR of <1% at a specified 1.1-fold change; stringent limits that are reproducibly achieved using this platform.
Corroborative quantitative RT-PCR (qRT-PCR) analysis
The expression levels of selected genes were analyzed by qRT-PCR. cDNA derived from reverse transcription of DNAsed, total RNA from logarithmic growth phase glioma stem cell cultures primed with oligo(dT) and random hexamers was used as the template for qRT-PCR analyses. All primer sets were designed across intron-exon boundaries, and individual primer concentrations and amplification conditions optimized for each gene. Dissociation curves were performed on all reactions to assure product purity. Original input RNA amounts were calculated by comparison to standard curves using purified PCR product as a template for the transcripts of interest and were normalized to amount of H3.3 mRNA. The minimum expression level of most genes detectable by qRT-PCR is approximately 1×10⁻⁸ pg, well below the limit of detectability on the microarrays. Although no qRT-PCR was done in this pilot study, we have designed primer pairs for over 300 transcripts selected from previous microarray experiments. Using our stringent primer design algorithms, we have quantified the expression 98–100% of these transcripts in a variety of tissues. In the majority of cases, qRT-PCR directly corroborates the microarray data. However, at very low levels of differential expression (around 12–18% difference, close to the limit of detection for qRT-PCR), this level of corroboration between the two datasets is extremely difficult to achieve.
3.8. DISEASE LINK WITHIN CHROMOSOME 19
The “Disease Link” experiments will be generated by the comparison of well-annotated samples obtained from patients matched to healthy control samples provided to the Consortium by specialized clinics. Strategically it is the view of the C19C that these disease link-related data are one of the most important deliverables that will be of high value and of cardinal importance for generating added values to new drug development and novel markers for diagnosing disease.
The goal for the outcome of the C19C initiative will consist not only of the Human Proteome Sequence Map of the chromosome 19, but also to deliver future advances in paradigms of disease understanding, new medical patient treatments, and tools for guiding personalized medicine at the individual patient level in for example the treatments of cancer and cardiovascular diseases. It is anticipated that the future health care will require high-density generated data-outs of both data and data comparisons in order to make accurate diagnosis in patients for targeted personalized medicine. It is also anticipated that high-end mass spectrometry sequencing and computational data-interpretation will be essential in the proficient treatment of the ever-increasing number of patients in the world. Improved understanding of the molecular alteration and mode of drug action in cancer cells in targeted tumor tissues is fueling the future development of efficient patient drug treatments. The future of biomedical sciences will be driven by the ability to adopt novel technologies, which will generate petabytes of data (peta=1015) to understand the disease and develop new treatments. This is especially relevant to diseases, such as cancer and cardiovascular diseases, which carry a huge mortality and cost to global health care systems. Advances in reducing mortality associated with these diseases are hampered by the lack of tools and data for early detection, modeling of disease progression and evaluation of treatment response.
In addition to the indubitable academic interest of unraveling the chromosome 19 sub-proteome it must be highlighted that nearly eighty human diseases and disorders have been related to alterations of genes/proteins of chromosome 19 (Supplementary Table 5). These diseases represent heterogeneous pathologies and effect many different organ systems, represent both inherited and non-inherited, and occur at various points throughout life, from congenital to childhood to late onset forms of clinical presentation.
Glioblastoma (GBM) is one such disease area that has been linked to aberrations in chromosome 19 proteins. GBM is the most prevalent form of brain tumor. Despite advances in chemotherapy and radiation treatments, the disease is nearly universally fatal. The firsthand treatment is surgical brain tumor removal, followed by radiation and chemotherapy. Despite reduction of the tumor size by 98% or more, recurrence is nearly inevitable. Glioma cancer stem cells (GSCs) are hypothesized to provide a repository of cells in GBM cell populations that can self renew and be refractory to radiation and chemotherapeutic agents developed for the treatment of differentiated tumor cells. The potential lack of response of GSCs to traditional cytotoxic and radiation therapies has significant implications for tumor biology and therapeutics.
Scientists at the University of Texas M.D. Anderson Cancer Center (MDACC), Houston, Texas, have isolated and genetically characterized forty-six GSC lines. All GSC lines have been characterized with the expectation that assignment of these different lines will potentially be classified according to previously described proneural, mesenchymal and classical phenotypes 23. The mesenchymal subtype carries the poorest clinical prognosis, is highly invasive and pro-angiogenic. The tumor cells have high mutation rates in NF1, relatively fewer EGFR mutations and relatively lower EGFR expression. In contrast, the classical subtype frequently carries increased copy numbers of the EGFR gene (chromosome 7), but TP53 (chromosome 17) mutations are unusual. Finally, proneural types have the best prognosis and have high mutation rates in TP53, PDGFRA (chromosome 4) and IDH1 (chromosome 2).
3.9. POST-TRANSLATIONAL MODIFICATIONS
More than one hundred post-translational modifications (PTMs) of proteins have been described and new types are still being discovered. Modifications of proteins by phosphorylation, glycosylation, acetylation and ubiquitination have dramatic effects on protein functions. Thus, any project that aims to assign protein function must take PTMs into consideration. By searches of the chromosome 19 Uniprot identifiers in Protein Information and Knowledge Extractor (PIKE, http://proteo.cnb.csic.es/pike) 24, roughly one-third of chromosome 19 proteins were identified as phosphoproteins. This figure is likely to grow once PTM characterization of chromosome 19 proteins is in an advanced stage of progress. The phosphorylation status of several chromosome 19 nuclear proteins was determined in our study of GSC11 25. Two sites of serine phosphorylation (S299 and S300) were detected on RNA polymerase II elongation factor ELL (P55199), three sites of phosphorylation (S284, S288, S301) were determined on Nuclear factor 1 X-type (Q14938) and four sites (S100, S103, S113, S114) on Transcriptional repressor p66-alpha (Q86YP4). Furthermore, about 5% of the proteins were identified as known regulators of ubiquitination and deubiquitination, and a large number of proteins were related to carbohydrate synthesis and degradation.
In the context of the C19C project, two deliverables related to PTMs are implicated. First, predicted functions of chromosome 19 proteins as kinases, glycosyltransferases etc., are verified and second, the PTMs of each protein characterized. The analytical platform includes enrichment, separation and tandem mass spectrometry. The choice of approach requires optimization, even in the case of phosphorylation, which is a single chemical entity26. The site localization and structural characterization of protein glycosylation is quite complex, but essential to understand protein function in human health and disease.
Initially, the proteomes of each of the GSC cell line were characterized and quantified. The transcriptomic and proteomic data will be correlated to determine the extent of chromosome 19 gene expression and coverage as a sub-proteome. Re-examination of an earlier phosphoproteomic study by this group performed on GSC118 identified 148 proteins encoded by chromosome 19 (Supplementary Table 4) out of >2,000 identified proteins. In that study, a quantitative phosphoproteomic approach was employed that used enrichment of phosphoproteins from differentially-treated GSC11 cells, chemical tagging with TMT6 reagents, separation by HILIC chromatography, metal-oxide-based enrichment of phosphopeptides and tandem mass spectrometry. Those proteins were uploaded into Ingenuity Pathways software and compared to the known proteins with association to cancer. That analysis revealed that roughly one quarter of the GSC11phosphoproteins (34) are associated with cancer.
3.10. BIOINFORMATICS OF CHROMOSOME 19 REPOSITORY
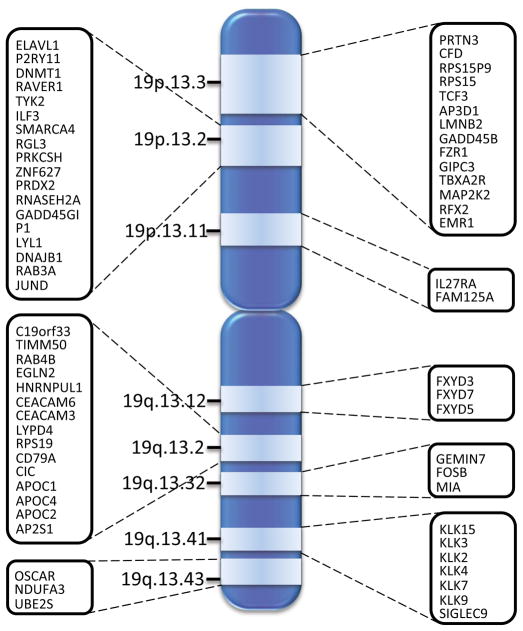
Gene expression profile data was mined to identify differentially expressed genes of chromosome 19 from Gene Expression Omnibus (GEO) repository 27. From the top 1000 differentially expressed experiments a total of 285 genes were identified which were linked to a cancer specific condition. The sub-set was further mined to identify 64 genes which are clustered based on proximity on chromosome 19, and mapped to specific locations on the chromosome as show in Figure 8.
Figure 8.
Clustering of chromosome 19 genes differentially expressed in breast cancer, prostate cancer, lung cancer, brain cancer and leukemia.
The IT infrastructure is crucial in order to allow all the research teams to interact and collaborate with clinical patient samples as well as biological samples where the sample-, and data sharing can be made in an efficient way in agreement with the highest ethical standards. Within the consortium we have developed an IT-infrastructure, utilizing FDA approved software for sample and data processing, as well as the link to clinical proteomic units, at three hospitals/universities, and with national biobank units.
The structure of the LIMS is built with an interactive module operation that allows any sample to be processed at any time point by multiple research teams. The LIMS will be tracking all time points that relates to sample processing and data file generation. The samples are all handled by 2D barcoding systems, where each research team uses their respective scanners when samples are analyzed.
There will be several data categories generated, such as the archiving of samples, that hierarchically are assigned to the patient identifier, that is related to the sample type e.g., tissue (type), blood fractions (EDTA, heparin and/or citrate) plasma, serum or whole blood, or any target cells isolated from blood or tissue samples. In addition, data categories will be built by linking each biobank sample to data file generation. This data management architecture system will be utilized by each research team within the Chromosome 19 Consortium, and we believe that the strategy and experience of data managements will bring extremely valuable overall structure to our research groups.
The LIMS unit in Lund is functioning as the hub and provides resource for participating groups to gather and harmonize acquired data, which is sorted and shared on the repository server. The network and links in-between the chromosome 19 research teams is depicted in (Supplementary Figure 2) that ensures an efficient and real-time access to the Chromosome 19 Database. Our IT structure allows us to work across research teams and interact on a daily basis where some of our teams are data generating with mass spec protein sequencing or protein quantitation files, while others are assigned to make statistical analysis. The IT infrastructure also allows analysis files to be copied and evaluated by other teams with an interactive work process. We have developed a work flow that manages all the data generation and curation to a final point where the bioinformatics team will be responsible to align with the C-HPP repository, and post all the chromosome 19 data, making them publicly available.
4. CONCLUSIONS
The C-HPP represents a dedicated and high-level attempt to relate human disease to specific gene expression and protein expression to loci present on the 23 pairs of human chromosomes. In this report the Chromosome 19 Consortium provides insight into its strategy and work platforms to discover what relationships exist between specific phenotypes of disease and the allelic forms of genes located on chromosome 19. Our research teams have developed transcript and protein microarray platforms that is used as a complement to the MRM quantitation capability and the antibody library, where the synergistic effects will be optimized to deliver value to the C-HPP repository as a global open access resource. These efforts at the start of our joint chromosome 19 project are in line with the C-HPP guideline 28. We have established a collaborative consensus within our consortium, where we have introduced respective responsible research tasks, associated with experimental approaches, including data production with quality control. The curation of data has been multi-tasked and processed in-between continents with resulting collaborative benefits. We also identified compelling gene sequences in human diseases such as cancers that will be mandatory in our search for the right biological material to identify the missing proteins. Similar investigations on all the other human chromosomes will result in a new understanding of human biology and new knowledge regarding possible targets of medical intervention to limit disease development. Along the way, many new ways of working with mega-data packages and analysis tools will also need to be obtained and validated throughout the community. The research, and healthcare societies will also need to support the development of integration systems that allows for standardization of sample collection and storage, search routines on sample collections, and as well as data sets of annotated clinical data that has been generated from these cohorts. In the end of the day, both the C-HPPs, as well as other global research activities are looking for tools that can bridge the data and deliverables that will be of major use in future drug development and patient treatments. Unifying the different disciplines will aid in the fulfilling of the aspiration provided in the concepts of personalized medicine and systems biology.
Supplementary Material
Supplementary Table 1. Peptide library. Subset.
Supplementary Table 2. MRM data of the synthetic peptides used in the Pilot Study.
Supplementary Table 3. Predicted cellular localization of chromosome 19 proteins.
Supplementary Table 4. Predicted function of chromosome 19 proteins.
Supplementary Table 5. Diseases (alphabetical order) that associate to genes and proteins within Chromosome19.
Endogenous signals found in blood plasma spiked with the synthetic peptide mixture from Pilot study.
Schematic illustration of the Chromosome 19 IT network. Tagged lines indicate the connections have yet to be established.
Table 2B.
Comprehensive results of the MS analyses of synthetic peptides – Crude peptides
| Protein acc. number | Sequence | Mass [Da] | Quality | hydrophobicity | estimated conc. [nmol/μl] | MALDI | LC-MS/MS Sequence ID | MRM |
|---|---|---|---|---|---|---|---|---|
| P51813 | VPDSVSLGNGIWEL[K] | 1621.85 | Crude | 43.5 | 1.04 | Poor | Yes | Good |
| P27448 | IADFGFSNEFTVGG[K] | 1596.76 | Crude | 38.9 | 1.20 | Good | Yes | Good |
| Q9BXU1 | AAAVDLTNHLEYTL[K] | 1666.9 | Crude | 34.8 | 0.79 | Good | Yes | Poor |
| P51841 | LLTQMLPPSVAESL[K] | 1635 | Crude | 41.5 | 1.47 | Poor | Yes | Good |
| Q9Y2H1 | LEVAMEEEGLADEE[K] | 1699.86 | Crude | 31.4 | 0.94 | Poor | Yes | Good |
| Q86Z02 | TVVGAAATTTTVTI[K] | 1429.63 | Crude | 21.0 | 0.99 | Poor | Yes | Excellent |
| Q02763 | FQDVIGEGNFGQVL[K] | 1658.85 | Crude | 38.8 | 0.55 | Poor | Yes | Excellent |
| Q9UHD2 | YQEYTNELQETLPQ[K] | 1892.06 | Crude | 29.9 | 0.84 | Good | Yes | Excellent |
| Q8NB16 | AHDPSVRPSVDEIL[K] | 1670.88 | Crude | 26.5 | 0.90 | No | No | Poor |
| P42680 | DSSQPGLYTVSLYT[K] | 1666.89 | Crude | 35.1 | 0.85 | Good | Yes | Excellent |
| P41240 | YNFHGTAEQDLPF[Cys(CAM)][K] | 1835.03 | Crude | 39.7 | 0.45 | No | Yes | Excellent |
| Q15772 | EPGEPPLFSRPSTP[K] | 1646.87 | Crude | 25.7 | 0.97 | Poor | No | Poor |
| Q8NER5 | HDSILNTIDIPQNP[K] | 1712.93 | Crude | 34.0 | 0.82 | No | Yes | Good |
| P04629 | VFLAE[Cys(CAM)]HNLLPEQD[K] | 1821.09 | Crude | 43.5 | 1.27 | Good | Yes | Poor |
| Q06418 | IEATLDSLGISDEL[K] | 1611.81 | Crude | 39.3 | 0.99 | Poor | Yes | Excellent |
| O75676 | VYGGEIVLALEHLH[K] | 1685.97 | Crude | 39.6 | 0.30 | Good | Yes | Poor |
| Q5TCY1 | SQEGAPSTLLADDQ[K] | 1567.66 | Crude | 23.8 | 1.48 | Poor | Yes | Good |
| Q13308 | QDVNITVATVPSWL[K] | 1678.95 | Crude | 40.3 | 1.49 | Poor | No | Poor |
| P42685 | HGSLQEYLQNDTGS[K] | 1684.78 | Crude | 20.7 | 1.67 | Excellent | Yes | Good |
| Q96PF2 | EMDILATVNHGSII[K] | 1648.93 | Crude | 33.1 | 1.21 | Good | Yes | Good |
| P15735 | LSDFGFS[Cys(CAM)]HLEPGE[K] | 1730.92 | Crude | 41.6 | 1.73 | Excellent | Yes | Good |
| Q7L7X3 | LQHQTELTNQLEYN[K] | 1867.06 | Crude | 24.3 | 0.58 | Good | Yes | Excellent |
| Q6SA08 | WFSQLTLGIAYLHS[K] | 1772.07 | Crude | 45.3 | 1.03 | Good | Yes | Poor |
| Q9NYV4 | VPLALHPVVGQPFL[K] | 1623 | Crude | 39.8 | 0.98 | Good | Yes | Good |
| Q00536 | GPLSSAPEIVHEDL[K] | 1599.8 | Crude | 29.7 | 1.51 | Excellent | Yes | Excellent |
| Q13263 | LDLDLTADSQPPVF[K] | 1666.89 | Crude | 39.6 | 0.95 | Excellent | Yes | Good |
| O00506 | NSPPTLEGQHS[K] | 1302.4 | Crude | 14.1 | 1.99 | No | Yes | No |
| Q13627 | VYNDGYDDDNYDYIV[K] | 1979.05 | Crude | 31.9 | 1.01 | No | Yes | Poor |
| P31749 | EAPLNNFSVAQ[Cys(CAM)]QLM[K] | 1858.17 | Crude | 47.3 | 1.03 | Poor | Yes | Good |
| Q13164 | EEDGEDGSAEPPGPV[K] | 1620.64 | Crude | 18.0 | 0.93 | No | Yes | Good |
| P36894 | DLEQDEAFIPVGESL[K] | 1798.02 | Crude | 41.2 | 0.88 | Good | Yes | Excellent |
| Q00534 | DLKPQNILVTSSGQI[K] | 1749.08 | Crude | 29.8 | 1.33 | Poor | Yes | Good |
| P11802 | DLKPENILVTSGGTV[K] | 1678.99 | Crude | 29.8 | 1.14 | Good | Yes | Excellent |
| Q14680 | SVELDLNQAHMEETP[K] | 1849.05 | Crude | 27.4 | 0.86 | Good | Yes | Good |
| Q15303 | NLTEILNGGVYVDQN[K] | 1784.98 | Crude | 35.7 | 1.07 | Poor | No | Poor |
| P05771 | NDFMGSLSFGISELQ[K] | 1781.01 | Crude | 46.2 | 0.89 | Poor | Yes | Good |
| P45985 | L[Cys(CAM)]DFGISGQLVDSIA[K] | 1730.99 | Crude | 50.1 | 0.63 | Good | Yes | Excellent |
| Q16816 | DLKPENILLDDNMNI[K] | 1893.25 | Crude | 38.0 | 0.96 | Good | Yes | Excellent |
| O15021 | SQALGQSAPSLTASL[K] | 1566.76 | Crude | 29.6 | 0.96 | Poor | No | Good |
| P29317 | VLEDDPEATYTISGG[K] | 1690.79 | Crude | 23.5 | 1.13 | No | Yes | Poor |
| Q13555 | GSTES[Cys(CAM)]NTTIEDEDL[K] | 1794.85 | Crude | 28.1 | 0.61 | Poor | No | Poor |
| P08922 | ESQNGMQVFDVDLEH[K] | 1884.04 | Crude | 33.3 | 0.89 | No | No | Poor |
| P41743 | ELVNDDEDIDWVQTE[K] | 1956.05 | Crude | 38.6 | 1.19 | No | Yes | Good |
| P33981 | DSQVGTVNYMPPEAI[K] | 1757.04 | Crude | 31.3 | 1.19 | No | Yes | Good |
| Q81Y84 | LHLVMEYAGGGELFG[K] | 1729.02 | Crude | 39.3 | 1.10 | Excellent | Yes | Good |
| P27361 | TEGVGPGVPGEVEMV[K] | 1592.81 | Crude | 30.2 | 1.00 | Poor | Yes | Excellent |
| Q5S007 | DYHFVNATEESDALA[K] | 1817.98 | Crude | 28.1 | 1.28 | Excellent | Yes | Excellent |
| P32298 | VGTVGYMAPEVVNNE[K] | 1714.96 | Crude | 30.3 | 1.35 | Poor | Yes | Good |
| Q9Y572 | DLKPSNVLLDPELHV[K] | 1825.18 | Crude | 34.8 | 0.92 | No | No | Good |
| Q8IWB6 | WLQPPEESVELQDLP[K] | 1916.16 | Crude | 40.9 | 0.95 | Poor | Yes | Good |
| Q16654 | HHNVVPTMAQGIIEY[K] | 1845.15 | Crude | 30.2 | 1.58 | Good | Yes | Poor |
| P05129 | DVIVQDDDVD[Cys(CAM)]TLVE[K] | 1871.08 | Crude | 45.8 | 0.97 | No | No | No |
| Q9UJY1 | V[Cys(CAM)]VNVHSFKPEELMV[K] | 1924.32 | Crude | 36.9 | 0.83 | Poor | No | Poor |
| Q15119 | HIGSIDPN[Cys(CAM)]NVSEVV[K] | 1776 | Crude | 34.1 | 1.07 | No | No | Poor |
| Q9UPZ9 | DLKPENLL[Cys(CAM)]MGPELV[K] | 1864.31 | Crude | 46.0 | 1.66 | Good | Yes | Good |
| P24941 | DLKPQNLLINTEGAI[K] | 1775.13 | Crude | 32.8 | 0.74 | No | No | Good |
| P16591 | TLAEELMQTQQMLLN[K] | 1899.26 | Crude | 42.0 | 0.79 | Poor | Yes | Poor |
| Q8WXR4 | TESAHLIVQHLTFLG[K] | 1802.09 | Crude | 42.1 | 1.34 | Good | Yes | Good |
| P08631 | LGAGQFGEVWMATYN[K] | 1780.04 | Crude | 41.8 | 0.79 | Good | Yes | Good |
| Q15831 | DIKPGNLLLTIGGTL[K] | 1649.01 | Crude | 35.6 | 0.55 | Excellent | Yes | Good |
| O15146 | APGLLPYEPFTMVAV[K] | 1741.13 | Crude | 45.2 | 0.52 | Good | Yes | Good |
| Q9BZL6 | HPGIVNLE[Cys(CAM)]MFETPE[K] | 1909.23 | Crude | 45.5 | 0.88 | Good | Yes | Good |
| Q8NFD2 | GMLSYIPPEMFLESN[K] | 1864.23 | Crude | 47.4 | 0.98 | Excellent | Yes | Good |
| P54646 | SVATLLMHMLQVDPL[K] | 1804.23 | Crude | 45.1 | 1.44 | No | Yes | Poor |
| Q5VST9 | ELQSVVLS[Cys(CAM)]DFRPAP[K] | 1854.15 | Crude | 43.3 | 0.71 | Poor | Yes | Good |
| Q9HBY8 | LTPPFNPNVTGPADL[K] | 1688.96 | Crude | 34.3 | 1.00 | Good | Yes | Good |
| Q13237 | DLKPENLILDAEGYL[K] | 1839.17 | Crude | 42.4 | 0.77 | Excellent | Yes | Excellent |
| Q38SD2 | ELTPHGVLVDAAVVA[K] | 1626.89 | Crude | 35.6 | 1.23 | Poor | Yes | Poor |
| O95382 | ASAQTLLGDPFLQPG[K] | 1650.89 | Crude | 37.4 | 1.10 | No | No | Poor |
| Q00526 | DLKPQNLLINELGAI[K] | 1787.18 | Crude | 41.7 | 0.79 | Good | Yes | Good |
| Q13164 | DLKPSNLLVNEN[Cys(CAM)]EL[K] | 1894.24 | Crude | 40.2 | 0.74 | Poor | No | Good |
| P50613 | DLKPNNLLLDENGVL[K] | 1803.14 | Crude | 37.0 | 0.50 | Good | Yes | Excellent |
| Q9UHY1 | VVLMQ[Cys(CAM)]NIESVEEGV[K] | 1842.16 | Crude | 46.6 | 0.72 | Poor | Yes | Good |
| Q8NB16 | VLGLIKPLEMLQDQG[K] | 1790.19 | Crude | 41.4 | 1.07 | Good | Yes | Poor |
| Q9UHY1 | AVFDNLIQLEHLNIV[K] | 1874.21 | Crude | 47.8 | 0.97 | Poor | No | Poor |
| Q96RR4 | DIKPSNLLVGEDGHI[K] | 1743.03 | Crude | 28.7 | 1.15 | Good | Yes | Good |
| Q8IVW4 | DIKPENILVSQSGIT[K] | 1750.07 | Crude | 30.5 | 1.48 | Good | No | Good |
| O75914 | LAKPLSSLTPLIIAA[K] | 1644.08 | Crude | 39.8 | 0.80 | Good | Yes | Good |
| P51812 | FSLSGGYWNSVSDTA[K] | 1726.86 | Crude | 34.0 | 1.11 | Excellent | Yes | Poor |
| Q9UQM7 | ESSESTNTTIEDEDT[K] | 1793.79 | Crude | 17.7 | 0.79 | Good | Yes | Excellent |
| Q9NSY1 | FPAAGLEQEEFDVFT[K] | 1836.03 | Crude | 42.3 | 1.04 | Excellent | Yes | Good |
| Q6A1A2 | FYTAEIVSALEYLHG[K] | 1849.11 | Crude | 47.3 | 1.03 | Excellent | Yes | Good |
| Q9P2K8 | DLKPVNIFLDSDDHV[K] | 1863.14 | Crude | 34.1 | 1.02 | Good | Yes | Excellent |
| P06493 | MALNHPYFNDLDNQI[K] | 1941.2 | Crude | 34.4 | 0.56 | Excellent | Yes | Good |
| O00141 | HPFLVGLHFSFQTAD[K] | 1852.12 | Crude | 38.9 | 0.71 | Excellent | Yes | Poor |
| Q02750 | LPSGVFSLEFQDFVN[K] | 1835.09 | Crude | 51.0 | 1.09 | Poor | Yes | Poor |
| Q86YV6 | WDLEDEEFQDISEEA[K] | 1991.06 | Crude | 39.6 | 0.96 | Good | Yes | Good |
| Q8NEV4 | TENAHLLVQQLTVLG[K] | 1772.06 | Crude | 41.3 | 0.28 | No | Yes | Good |
| P37173 | HINNDMIVTDNNGAV[K] | 1762.97 | Crude | 23.3 | 0.39 | No | No | Excellent |
| P42681 | LGNEGLIPSNYVTEN[K] | 1755.96 | Crude | 30.8 | 0.47 | Good | No | Excellent |
| Q7L7X3 | QQLQQELELLNAYQS[K] | 1941.17 | Crude | 43.1 | 0.82 | No | No | Poor |
| Q15119 | ATVESHESSLILPPI[K] | 1729.01 | Crude | 32.8 | 1.16 | Excellent | No | Excellent |
| Q05513 | HMDSVMPSQEPPVDD[K] | 1820.03 | Crude | 25.5 | 1.00 | Poor | No | Good |
| Q8IZX4 | TMSTEQAHSGEGPMS[K] | 1685.85 | Crude | 15.0 | 0.89 | Excellent | No | Excellent |
| Q52WX2 | EVSITNSLSSSPFII[K] | 1729.99 | Crude | 38.4 | 0.87 | Good | No | Good |
MALDI: No=no signal from the heavy peptide; Low=peptide signal was identifiable but a minor component overall; Good=good peptide signal but in a complex background; Excellent=peptide signal is major component in the spectrum with few other signals.
MRM: No=no signal from the heavy peptide; Low=peptide signal was identifiable but with low signal intensity; Good=good peptide signal; Excellent=peptide signal with really high intensity.
Acknowledgments
7. ACKNOWLEDGEMENT AND FUNDING
This work was supported by grants from the Swedish Academy of Pharmaceutical Sciences, Swedish Research Council, the Swedish Foundation for Strategic Research, Vinnova, Ingabritt & Arne Lundbergs forskningsstiftelse, the Crafoord Foundation and by Thermo Fisher Scientific for mass spectrometry instrument support. Thomas Fehniger is supported by the Mobilitas Program sponsored by the European Union Social Fund and administered by the Estonian Science Foundation. We gratefully acknowledge financial support to M.F. from Health Institute Carlos III of Spain (ISCIII, FIS PI02114) and María Gonzalez-Gonzalez is supported by a PhD scholarship of ISCIII FI08/00721. Carol L. Nilsson is supported by the Cancer Prevention and Research Institute of Texas and the University of Texas Medical Branch. Swedish Cancer Society [11-0624]; National Cancer Institute [R33 CA 127768-03, R01CA160816, and P50-CA92629]; Sidney Kimmel Center for Prostate and Urologic Cancers; and David H. Koch through the Prostate Cancer Foundation. The sponsors had no role in study design; in the collection, analysis, or interpretation of data; in the writing of the report; or in the decision to submit the paper for publication.
Footnotes
8. CONFLICT OF INTEREST
Dr. Hans Lilja holds patents for free PSA, intact PSA, and hK2 assays.
References
- 1.Hancock W, Omenn G, Legrain P, Paik YK. Proteomics, Human Proteome Project, and Chromosomes. J Proteome Res. 2011;10(1):210–210. doi: 10.1021/pr101099h. [DOI] [PubMed] [Google Scholar]
- 2.Legrain P, Aebersold R, Archakov A, Bairoch A, Bala K, Beretta L, Bergeron J, Borchers CH, Corthals GL, Costello CE, Deutsch EW, Domon B, Hancock W, He FC, Hochstrasser D, Marko-Varga G, Salekdeh GH, Sechi S, Snyder M, Srivastava S, Uhlen M, Wu CH, Yamamoto T, Paik YK, Omenn GS. The Human Proteome Project: Current State and Future Direction. Mol Cell Proteomics. 2011;10(7) doi: 10.1074/mcp.M111.009993. [DOI] [PMC free article] [PubMed] [Google Scholar]
- 3.Paik YK, Jeong SK, Omenn GS, Uhlen M, Hanash S, Cho SY, Lee HJ, Na K, Choi EY, Yan FF, Zhang F, Zhang Y, Snyder M, Cheng Y, Chen R, Marko-Varga G, Deutsch EW, Kim H, Kwon JY, Aebersold R, Bairoch A, Taylor AD, Kim KY, Lee EY, Hochstrasser D, Legrain P, Hancock WS. The Chromosome-Centric Human Proteome Project for cataloging proteins encoded in the genome. Nat Biotechnol. 2012;30(3):221–223. doi: 10.1038/nbt.2152. [DOI] [PubMed] [Google Scholar]
- 4.Uhlén M, Oksvold P, Älgenäs C, Hamsten C, Fagerberg L, Klevebring D, Lundberg E, Odeberg J, Pontén F, Kondo T, Sivertsson A. Antibody-based protein profiling of the human chromosome 21. Mol Cell Proteomics. 2011;11(3):M111.013458. doi: 10.1074/mcp.M111.013458. [DOI] [PMC free article] [PubMed] [Google Scholar]
- 5.A Gene-centric Human Proteome Project. Mol Cell Proteomics. 2010;9(2):427–429. doi: 10.1074/mcp.H900001-MCP200. [DOI] [PMC free article] [PubMed] [Google Scholar]
- 6.Marko-Varga G, Lindberg H, Lofdahl CG, Jonsson P, Hansson L, Dahlback M, Lindquist E, Johansson L, Foster M, Fehniger TE. Discovery of biomarker candidates within disease by protein profiling: Principles and concepts. J Proteome Res. 2005;4(4):1200–1212. doi: 10.1021/pr050122w. [DOI] [PubMed] [Google Scholar]
- 7.Van Gelder RN, von Zastrow ME, Yool A, Dement WC, Barchas JD, Eberwine JH. Amplified RNA synthesized from limited quantities of heterogeneous cDNA. Proc Natl Acad Sci USA. 1990;87(5):1663–1667. doi: 10.1073/pnas.87.5.1663. [DOI] [PMC free article] [PubMed] [Google Scholar]
- 8.Nilsson CL, Dillon R, Devakumar A, Rogers JC, Krastins B, Rosenblatt MM, Majo M, Kaboord BJ, Sarracino D, Rezai T, Prakash A, Lopez M, Ji Y, Priebe W, Colman H, Lang FF, Conrad CA. Quantitative phosphoproteomic analysis of STAT3/IL-6/HIF1α signaling network: An initial study in GSC11 glioblastoma stem cells. J Proteome Res. 2010;9(1):430–443. doi: 10.1021/pr9007927. [DOI] [PubMed] [Google Scholar]
- 9.Sihlbom C, Wilhelmsson U, Li L, Nilsson CL, Pekny M. 14-3-3 expression in denervated hippocampus after entorhinal cortex lesion assessed by culture-derived isotope tags in quantitative proteomics. J Proteome Res. 2007;6(9):3491–3500. doi: 10.1021/pr070108e. [DOI] [PubMed] [Google Scholar]
- 10.Grimwood J, Gordon LA, Olsen A, Terry A, Schmutz J, Lamerdin J, Hellsten U, Goodstein D, Couronne O, Tran-Gyamfi M, Aerts A, Altherr M, Ashworth L, Bajorek E, Black S, Branscomb E, Caenepeel S, Carrano A, Caoile C, Man Chan Y, Christensen M, Cleland CA, Copeland A, Dalin E, Dehal P, Denys M, Detter JC, Escobar J, Flowers D, Fotopulos D, Garcia C, Georgescu AM, Glavina T, Gomez M, Gonzales E, Groza M, Hammon N, Hawkins T, Haydu L, Ho I, Huang W, Israni S, Jett J, Kadner K, Kimball H, Kobayashi A, Larionov V, Leem SH, Lopez F, Lou Y, Lowry S, Malfatti S, Martinez D, McCready P, Medina C, Morgan J, Nelson K, Nolan M, Ovcharenko I, Pitluck S, Pollard M, Popkie AP, Predki P, Quan G, Ramirez L, Rash S, Retterer J, Rodriguez A, Rogers S, Salamov A, Salazar A, She X, Smith D, Slezak T, Solovyev V, Thayer N, Tice H, Tsai M, Ustaszewska A, Vo N, Wagner M, Wheeler J, Wu K, Xie G, Yang J, Dubchak I, Furey TS, DeJong P, Dickson M, Gordon D, Eichler EE, Pennacchio LA, Richardson P, Stubbs L, Rokhsar DS, Myers RM, Rubin EM, Lucas SM. The DNA sequence biology of human chromosome 19. Nature. 2004;428(6982):529–535. doi: 10.1038/nature02399. [DOI] [PubMed] [Google Scholar]
- 11.Taylor CF, Binz PA, Aebersold R, Affolter M, Barkovich R, Deutsch EW, Horn DM, Huhmer A, Kussmann M, Lilley K, Macht M, Mann M, Müller D, Neubert TA, Nickson J, Patterson SD, Raso R, Resing K, Seymour SL, Tsugita A, Xenarios I, Zeng R, Julian RK., Jr Guidelines for reporting the use of mass spectrometry in proteomics. Nat Biotechnol. 2008;26(8):860–861. doi: 10.1038/nbt0808-860. [DOI] [PubMed] [Google Scholar]
- 12.Martens L, Hermjakob H, Jones P, Adamski M, Taylor C, States D, Gevaert K, Vandekerckhove J, Apweiler R. PRIDE: The proteomics identifications database (vol. 5, Issue 13, ppabcxyzpp3537–3545) PROTEOMICS. 2005;5(15):4046–4046. doi: 10.1002/pmic.200401303. [DOI] [PubMed] [Google Scholar]
- 13.Martens L, Chambers M, Sturm M, Kessner D, Levander F, Shofstahl J, Tang WH, Römpp A, Neumann S, Pizarro AD, Montecchi-Palazzi L, Tasman N, Coleman M, Reisinger F, Souda P, Hermjakob H, Binz P-A, Deutsch EW. mzML—a Community Standard for Mass Spectrometry Data. Mol Cell Proteomics. 2011;10(1) doi: 10.1074/mcp.R110.000133. [DOI] [PMC free article] [PubMed] [Google Scholar]
- 14.Deutsch EW. The PeptideAtlas Project. Methods Mol Biol. 2010;604:285–296. doi: 10.1007/978-1-60761-444-9_19. [DOI] [PMC free article] [PubMed] [Google Scholar]
- 15.Uhlén M, Oksvold P, Fagerberg L, Lundberg E, Jonasson K, Forsberg M, Zwahlen M, Kampf C, Wester K, Hober S, Wernerus H, Björling L, Pontén F. Towards a knowledge-based Human Protein Atlas. Nat Biotechnol. 2010;28(12):1248–1250. doi: 10.1038/nbt1210-1248. [DOI] [PubMed] [Google Scholar]
- 16.Ramachandran N, Raphael JV, Hainsworth E, Demirkan G, Fuentes MG, Rolfs A, Hu Y, LaBaer J. Next-generation high-density self-assembling functional protein arrays. Nat Methods. 2008;5(6):535–538. doi: 10.1038/nmeth.1210. [DOI] [PMC free article] [PubMed] [Google Scholar]
- 17.Lockhart DJ, Dong H, Byrne MC, Follettie MT, Gallo MV, Chee MS, Mittmann M, Wang C, Kobayashi M, Horton H, Brown EL. Expression monitoring by hybridization to high-density oligonucleotide arrays. Nat Biotechnol. 1996;14(13):1675–1680. doi: 10.1038/nbt1296-1675. [DOI] [PubMed] [Google Scholar]
- 18.Lee PD, Sladek R, Greenwood CM, Hudson TJ. Control genes and variability: absence of ubiquitous reference transcripts in diverse mammalian expression studies. Genome Res. 2002;12(2):292–297. doi: 10.1101/gr.217802. [DOI] [PMC free article] [PubMed] [Google Scholar]
- 19.Kroes RA, Dawson G, Moskal JR. Focused microarray analysis of glyco-gene expression in human glioblastomas. J Neurochem. 2007;103(Suppl 1):14–24. doi: 10.1111/j.1471-4159.2007.04780.x. [DOI] [PubMed] [Google Scholar]
- 20.Kroes RA, Panksepp J, Burgdorf J, Otto NJ, Moskal JR. Modeling depression: social dominance-submission gene expression patterns in rat neocortex. Neuroscience. 2006;137(1):37–49. doi: 10.1016/j.neuroscience.2005.08.076. [DOI] [PubMed] [Google Scholar]
- 21.Baum M, Bielau S, Rittner N, Schmid K, Eggelbusch K, Dahms M, Schlauersbach A, Tahedl H, Beier M, Güimil R, Scheffler M, Hermann C, Funk JM, Wixmerten A, Rebscher H, Hönig M, Andreae C, Büchner D, Moschel E, Glathe A, Jäger E, Thom M, Greil A, Bestvater F, Obermeier F, Burgmaier J, Thome K, Weichert S, Hein S, Binnewies T, Foitzik V, Müller M, Stähler CF, Stähler PF. Validation of a novel, fully integrated and flexible microarray benchtop facility for gene expression profiling. Nucleic Acids Res. 2003;31(23):e151. doi: 10.1093/nar/gng151. [DOI] [PMC free article] [PubMed] [Google Scholar]
- 22.Tusher VG, Tibshirani R, Chu G. Significance analysis of microarrays applied to the ionizing radiation response. Proc Natl Acad Sci USA. 2001;98(9):5116–5121. doi: 10.1073/pnas.091062498. [DOI] [PMC free article] [PubMed] [Google Scholar]
- 23.Sulman E, Lang FF. 2012 [Google Scholar]
- 24.Medina-Aunon JA, Paradela A, Macht M, Thiele H, Corthals GL, Albar JP. Protein Information and Knowledge Extractor: Discovering biological information from proteomics data. PROTEOMICS. 2010;10(18):3262–3271. doi: 10.1002/pmic.201000093. [DOI] [PubMed] [Google Scholar]
- 25.Nilsson CL, Dillon R, Devakumar A, Shi SD, Greig M, Rogers JC, Krastins B, Rosenblatt M, Kilmer G, Major M, Kaboord BJ, Sarracino D, Rezai T, Prakash A, Lopez M, Ji Y, Priebe W, Lang FF, Colman H, Conrad CA. Quantitative phosphoproteomic analysis of the STAT3/IL-6/HIF1alpha signaling network: an initial study in GSC11 glioblastoma stem cells. J Proteome Res. 2010;9(1):430–443. doi: 10.1021/pr9007927. [DOI] [PubMed] [Google Scholar]
- 26.Nilsson CL. Advances in quantitative phosphoproteomics. Anal Chem. 2011 doi: 10.1021/ac202877y. [DOI] [PubMed] [Google Scholar]
- 27.Edgar R, Domrachev M, Lash AE. Gene Expression Omnibus: NCBI gene expression and hybridization array data repository. Nucleic Acids Res. 2002;30(1):207–210. doi: 10.1093/nar/30.1.207. [DOI] [PMC free article] [PubMed] [Google Scholar]
- 28.Paik YK, Omenn GS, Uhlen M, Hanash S, Marko-Varga G, Aebersold R, Bairoch A, Yamamoto T, Legrain P, Lee HJ, Na K, Jeong SK, He FC, Binz PA, Nishimura T, Keown P, Baker MS, Yoo JS, Garin J, Archakov A, Bergeron J, Salekdeh GH, Hancock WS. Standard Guidelines for the Chromosome-Centric Human Proteome Project. J Proteome Res. 2012;11(4):2005–2013. doi: 10.1021/pr200824a. [DOI] [PubMed] [Google Scholar]
Associated Data
This section collects any data citations, data availability statements, or supplementary materials included in this article.
Supplementary Materials
Supplementary Table 1. Peptide library. Subset.
Supplementary Table 2. MRM data of the synthetic peptides used in the Pilot Study.
Supplementary Table 3. Predicted cellular localization of chromosome 19 proteins.
Supplementary Table 4. Predicted function of chromosome 19 proteins.
Supplementary Table 5. Diseases (alphabetical order) that associate to genes and proteins within Chromosome19.
Endogenous signals found in blood plasma spiked with the synthetic peptide mixture from Pilot study.
Schematic illustration of the Chromosome 19 IT network. Tagged lines indicate the connections have yet to be established.


