Abstract
The fatty acid desaturase (FADS) genes code for the rate-limiting enzymes required for the biosynthesis of long-chain polyunsaturated fatty acids (LCPUFA). Here we report discovery and function of a novel FADS1 splice variant. FADS1 alternative transcript 1 (FADS1AT1) enhances desaturation of FADS2, leading to increased production of eicosanoid precursors, the first case of an isoform modulating the enzymatic activity encoded by another gene. Multiple protein isoforms were detected in primate liver, thymus, and brain. In human neuronal cells, their expression patterns are modulated by differentiation and result in alteration of cellular fatty acids. FADS1, but not FADS1AT1, localizes to endoplasmic reticulum and mitochondria. Ribosomal footprinting demonstrates that all three FADS genes are translated at similar levels. The noncatalytic regulation of FADS2 desaturation by FADS1AT1 is a novel, plausible mechanism by which several phylogenetically conserved FADS isoforms may regulate LCPUFA biosynthesis in a manner specific to tissue, organelle, and developmental stage.
Keywords: alternative splicing, arachidonic acid, fatty acid desaturases, fatty acid biosynthesis, gene expression
Alternative transcripts (AT) produced by RNA processing events, such as alternative splicing, alternative transcription initiation, and alternative polyadenylation, generate diverse mRNA isoforms cotranscriptionally from a single gene (1). These RNA processes are increasingly recognized as important gene regulatory mechanisms for expanding proteome diversity, mRNA stability, translation, localization, and transport in higher eukaryotes (2–4). Recent estimates suggest that >95% of multiexon genes are alternatively spliced (5) and that errors during splicing lead to several human diseases, including various cancers (6). For instance, during neuronal development, numerous functions such as cell-fate determination, axon guidance, and synaptogenesis are controlled by alternatively splicing mechanisms (7).
Protein isoforms lacking conserved domains generated via alternative splicing are reported to exert dominant negative or positive effects on classical forms of the same gene (8, 9). The Encyclopedia of DNA Elements (ENCODE) project consortium 2007 has shown that many AT have alternative transcription start sites (TSS) and that some of the TSS are >100 kb upstream of the gene, producing transcripts differing only in the 5′ UTRs (10). Alternative TSS and promoters have also been reported in E. coli (11). More than one polyadenylation [poly(A)] signal can generate AT with alternate polyadenylation sites; greater than 50% of human genes are alternatively polyadenylated (3).
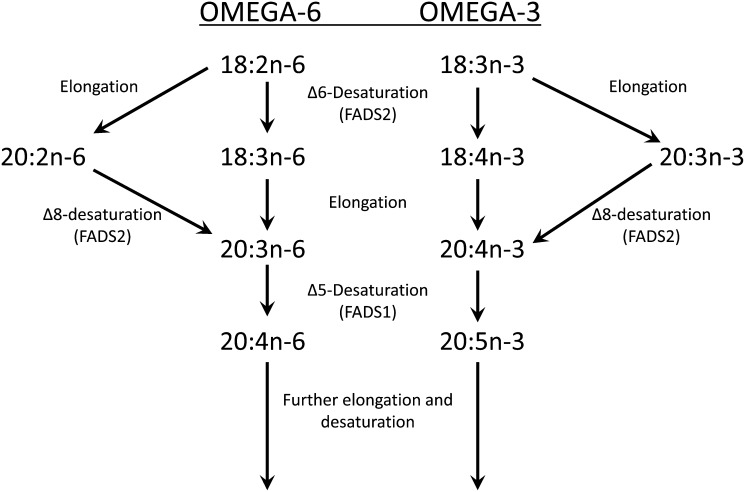
Omega-3 (ω3 or n-3) and omega-6 (ω6 or n-6) long-chain polyunsaturated fatty acids (LCPUFA) are nutrients and bioactive metabolites that are critical for growth and development. They are associated with human health and major diseases, specifically cardiovascular disease (CVD), neurological conditions, and metabolic syndrome (12–15). The nonheme, iron-containing, oxygen-dependent fatty acid desaturase enzymes coded by FADS1 and FADS2, and hypothetically by FADS3, are endoplasmic reticulum (ER) proteins introducing double bonds between two carbon atoms in LCPUFA biosynthesis (16, 17). FADS1 (Δ5-desaturase), FADS2 (Δ6-desaturase/Δ8-desaturase), and FADS3 arose evolutionarily by gene duplication events and are clustered within the 100 kb region on human chromosome 11. They share similar exon/intron organization and contain four well-conserved motifs (cytochrome b5 and three histidine boxes) (17, 18). In the LCPUFA biosynthetic pathway, FADS1 catalyzes endogenous synthesis of arachidonic acid (AA; 20:4n-6) and eicosapentaenoic acid (EPA; 20:5n-3) from dihomo-γ-linolenic acid (DGLA; 20:3n-6) and eicosatetraenoic acid (ETA; 20:4n-3), respectively (Fig. 1). AA and EPA serve as precursors for eicosanoids (19). Numerous meta-analyses and genome-wide association studies (GWAS) identified genetic variants at FADS1 loci to be associated with human phenotypes influencing glucose homeostasis, cholesterol and triglyceride levels, and resting heart rate (20–22).
Fig. 1.
Currently accepted pathway for LCPUFA synthesis from precursors. Alternating desaturation and elongation occurs on the ER. Δ8-desaturation of 20:2n-6 and 20:3n-3 yield 20:3n-6 and 20:4n-3, intermediates in the conventional pathway to 20:4n-6 and 20:5n-3 (18), which can be further elongated and desaturated.
Human FADS1 (23) spans 17.2 kb of genomic DNA, shares 61% and 52% identity with FADS2 and FADS3, respectively, and encodes a protein of 444 amino acids with a molecular mass of 52.0 kDa (24). The classical FADS1 transcript has been shown to be highly expressed in the liver, brain, and heart (23). Even though FADS1 operates on both n-6 and n-3 PUFA, only a single transcript has been identified to date. However, currently in the National Center for Bioinformatics Information (NCBI) database, human FADS1 (GenBank accession NM_013402) is represented with an open reading frame (ORF) that encodes a 501 amino acid peptide. This new larger peptide contains 65 amino acids more than the classical Δ5-desaturase protein (444 amino acids), yet the function of it is not known.
We recently showed the first alternative transcripts for FADS2 and FADS3, which were generated by alternative splicing events and expressed in a tissue-specific manner in a primate (neonate baboon) (25, 26). They are conserved in several mammals and the chicken, and they exhibit reciprocal changes in gene expression in response to human neuronal cell differentiation (25–27). To investigate whether FADS1 is also subject to alternative splicing, we performed both 5′ and 3′ rapid amplification of cDNA ends (RACE) using gene-specific primers from baboon FADS1 (GenBank accession EF531577). Here, we show unambiguous evidence of the existence of several FADS1 mRNA isoforms generated by alternative transcription initiation, alternative selection of poly(A) sites, and internal exon deletions resulting from alternative splicing. Our studies reveal that a FADS1 isoform enhances FADS2 activity, the first known function for a FADS isoform and the first example of an AT from one gene regulating the activity coded by an adjacent gene. These data are consistent with Δ6-desaturase enhancement of desaturase activity by a lipoprotein-like protein reported in the 1980s (28). Additionally, we present the detection of protein isoforms in neonate tissues and mammalian cells, protein isoform expression and fatty acid changes during cell differentiation, and isoform-specific subcellular localization, and findings that all three FADS genes are translated at similar levels in mouse embryonic fibroblasts.
MATERIALS AND METHODS
Studies on baboons were approved by the Cornell University and Texas Biomedical Research Institute (formerly the Southwest Foundation for Biomedical Research) Institutional Animal Care and Use Committees.
RNA isolation and preparation of RACE-ready cDNA
Neonate baboon liver tissue from a 12-week-old baboon treated with RNAlater and stored at −80°C since necropsy was used to isolate total RNA, and the RNA quality was assessed as described previously (25). First-strand 5′ RACE-ready cDNA and 3′ RACE-ready cDNA was prepared per the manufacturer's recommended protocol provided with SMARTerTM RACE cDNA amplification kit (Clontech Laboratories, Mountain View, CA).
Rapid amplification of cDNA ends
We performed both 5′ and 3′ RACE using baboon FADS1 (GenBank accession EF531577) gene-specific primers to identify the transcription initiation, splicing, and poly(A) sites. For the 5′ RACE reactions, we used the antisense primer 5′-TGGAAG TGCATGTGGTTCCACCAA-3′, and for the 3′ RACE reactions, we used the sense primer 5′-TGTGTTCTT CCTGC TGTA CCTG CT-3′. The PCR reactions were performed by using the Advantage 2 PCR enzyme system. 5′ and 3′ RACE-amplified products were run on 2% agarose gels. Several products were seen on the gel. Each amplified product was sliced carefully from the gel, and DNA was extracted using PureLinkTM gel extraction kit (Invitrogen, Carlsbad, CA). The gel-purified products were cloned into pGEM-T Easy vector (Promega) and sequenced at Cornell University Life Sciences Core Laboratories Center.
Cell culture
Three human cell lines, SK-N-SH neuroblastoma (NB), MCF7 breast cancer, and HepG2 hepatocellular carcinoma cells, were grown in DMEM/F-12, MEM-α, and MEM/EBSS media with 10% FBS (media and serum obtained from HyClone), respectively, at 37°C in a humidified environment with 5% CO2. At confluence, the cells were harvested for RNA and protein extraction. RNA was isolated using the QIAshredder and RNeasy Mini kit (Qiagen, Valencia, CA). Protein extract was carried out using RIPA lysis buffer (Thermo Scientific, IL). Protein concentrations were determined by a bicinchoninic acid (BCA) assay (Thermo Scientific). NB cell differentiation assays were carried out in serum free DMEM/F-12 with 1× N-2 supplement (Invitrogen) as described earlier (25).
Transfection assay
The open reading frame of FADS transcripts (FADS1, FADS2, FADS1AT1) were cloned into a pcDNA3.1 expression vector containing cytomegalovirus (CMV) promoter (Invitrogen). FADS1AT1 and empty vector stable MCF7 cells were dosed with 100 μM of albumin-bound 18:2n-6 or 20:3n-6 fatty acid and were incubated for 24 h. For cotransfection studies, MCF7 cells stably expressing FADS1AT1 or empty vector were transfected with equal amounts of FADS1 or FADS2 DNA using Lipofectamine LTX (Invitrogen). Twenty-four hours after cotransfection, the cells were incubated with 100 μM of albumin-bound 18:2n-6 or 20:3n-6 fatty acid for additional 24 h. After incubation, the cells were washed twice with 1× PBS and removed by trypsinization. Then fatty acids were analyzed.
Fatty acid analysis
Fatty acid methyl ester (FAME) preparation and structural identification of FAME was carried out as described earlier (18). Briefly, cells were isolated and total fatty acids hydrolyzed and converted to FAME by a one-step reaction mixture. Structures were identified by gas chromatography covalent adduct chemical ionization tandem mass spectrometry (GC-CACI-MS/MS), which provides positive structural assignments of double-bond positions for all monoene and homoallylic FAME, for low abundance FAME (29). Quantitative analysis was performed with GC coupled to a flame ionization detector using an equal weight mixture for response factor calibration.
FADS1 transcript expression in baboon tissues and human cells
Expression levels of FADS1 transcripts was measured using cDNA from nine normal tissues from a 12-week-old baboon neonate and three human cell lines by RT-PCR. cDNA from baboon tissues is from a previous study (25). RT-PCR analysis was performed using primers designed from unique regions specific for each transcript. (Primer sequences are provided upon request.) RT-PCR reactions were carried out using 1 μM of each primer, 0.25 mM each of dNTPs, 1.5 mM MgCl2, and AmpliTaq II (ABI, Foster City, CA) in a final volume of 30 μl. Thermal cycling conditions were as follows: initial denaturation at 95°C for 5 min followed by 35 cycles of denaturation at 95°C for 30 s, annealing at 65°C for 45 s, and extension at 72°C for 1 min, with a final extension at 72°C for 5 min. PCR products were separated on 2% agarose gels.
Immunoblot
Total protein from baboon neonate liver, brain, and thymus tissue lysates and cultured cells was resolved by SDS-PAGE (Bio-Rad, Hercules, CA). The samples were transferred to nitrocellulose membranes and probed with the FADS1 and β-actin antibodies. FADS1 antibody (cat. #AV42384) was purchased from Sigma-Aldrich (St. Louis, MO). β-actin and the secondary antibodies were from LiCor Biosciences (Lincoln, NE). Immuno blots were imaged and immunofluorescence signal was detected by using LiCor Odyssey infrared imaging system as directed by the manufacturer (LiCor Biosciences).
Subcellular localization of FADS1 isoforms
To determine the localization of FADS1 and FADS1AT1, the coding regions were cloned into pEGFP-N1 vector driven by the CMV promoter (pEFADS1 and pEFADS1AT1, respectively). NB cells were transfected with the constructed vectors using Lipofectamine 2000 reagent (Invitrogen, Carlsbad, CA), and organelle-specific stains MitoTracker Red CMXRos or ER-tracker Blue-White DPX (Molecular Probes, Invitrogen) were used to stain organelles. Live cells were visualized with an inverted Meta Confocal Microscope (LSM 510 META, Zeiss). Mitochondria were isolated from the transfected NB cells using mitochondria isolation kit (Thermo Scientific). Western blot was performed using GFP antibody (Abcam), COX IV (inner mitochondrial membrane-specific) antibody (Cell Signaling), and PDI (endoplasmic reticulum-specific) antibody (Cell Signaling).
Translation of FADS transcripts in mouse cells
MEF cells were first treated with cycloheximide (100 µg/ml) for 3 min at 37°C to free the translating ribosomes on mRNAs. Cells were then harvested by ice-cold polysome lysis buffer (10 mM HEPES, pH 7.4, 100 mM KCl, 5 mM MgCl2, 100 µg/ml cycloheximide, 5 mM DTT, 20 U/ml SUPERaseIn, and 2% Triton X-100) followed by profiling using 10–50% sucrose gradient. Polysome fractions were collected and treated with RNase I to digest the mRNA segments not protected by ribosomes. The ribosome-protected fragments were enriched and converted into a DNA library suitable for Illumina sequencing. Qualified sequencing reads were aligned to the cDNA database using SOAP2-based mapping software allowing up to two mismatches.
RESULTS
We cloned and sequenced the entire coding region of baboon FADS1 (GenBank accession EF531577). The baboon FADS1 coding sequence shares 97% identity with the human FADS1 sequence as well as exon architecture. The 5′ and 3′ RACE was performed using FADS1 gene-specific primers.
5′ RACE
5′ RACE PCR experiments generated four products. The long base pair (bp) product was prominent on the ethidium bromide-stained agarose gel, whereas the remaining three products were weakly visualized. All four gel-purified products were sequenced, and the Basic Local Alignment Search Tool (BLAST) confirmed the products (750 bp, 537 bp, 430 bp, and 403 bp) as FADS1 amplicons. Promoter and TSS prediction was performed using Neural Network Promoter Prediction software (30). For the 750 bp sequenced product, the promoter region ranging from −95 bp to −45 bp from the first translation start site was identified with a minimum promoter score of 0.54; the TSS (TSS1) is located at −55 bp from the first translation start site (“TSS1” for the classical transcript FADS1CS). The 750 bp amplicon closely corresponds to previously reported human sequences (GenBank accessions AK027522 and AF084558). The 537 bp amplicon arose because of internal splicing within the distal end of exon 1, followed by a 81 bp N-terminal or 5′ end sequence extension, resulting in an alternative exon (“E1A”). The promoter region (minimum promoter score of 0.27) for this amplicon ranged from −106 bp to −56 bp, and the TSS (TSS2) is located −66 bp from the first translation start site (“TSS2” for the alternative transcript FADS1AT1). In this amplicon, the initial 81 bases (−136 bp to −55 bp) from the first translational start site are strikingly similar to a newly identified sequence from the NEDO splicing variants project (GenBank accession AK299762), which is also highly similar to FADS2. Internal splicing within exon 2 gives rise to 430 bp and 403 bp amplicons. They are located at +224 and +251 of the baboon FADS1 gene (GenBank accession EF531577) and have very short 5′ UTR. We refer to this cluster as “TSS3.”
3′ RACE
We performed 3′ RACE to detect alternative selection of poly(A) sites and splice variants. Seven amplicons with varying lengths were detected on agarose gels. The sizes of the sequenced amplicons were 1114 bp, 1156 bp, 1460 bp, 1606 bp, 1620 bp, 2603 bp and 3750 bp. BLAST (http://www.ncbi.nlm.nih.gov/BLAST) searches confirmed the products as FADS1 amplicons. Six out of the seven amplicons differ only in the 3′ UTR length because of alternative use of poly(A) sites. The 2603 bp amplicon has several exon deletions resulting from internal exon splicing and closely (99% identity) resembles a Rhesus Macaque sequence (GenBank acc# AC194778).
In silico analysis
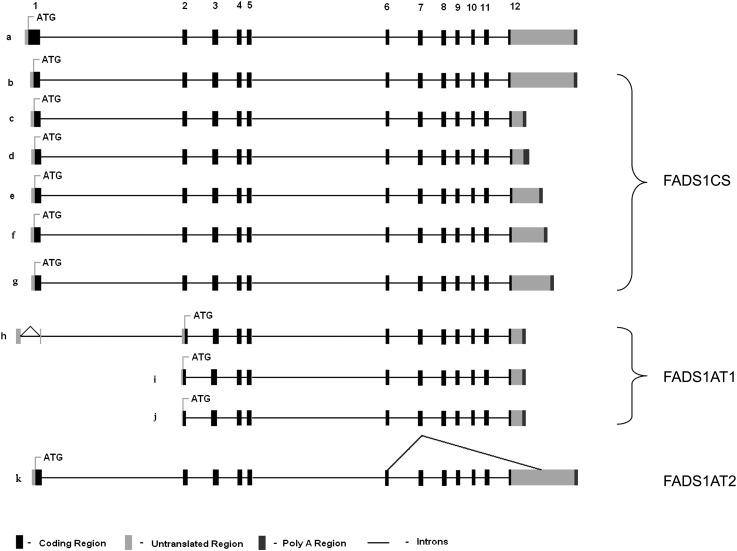
In silico analysis of the 5′/3′ RACE sequences for FADS1 show that they have at least four 5′ UTRs and several 3′ UTRs of varying lengths (GenBank accessions JF518968, JF518969, JF518970, JF518971, JF518972, JF518973, JF518974, and JF518975). Putative coding regions of these transcripts were predicted using ORF finder software. The four conserved functional features of most PUFA desaturases are an N-terminal cytochrome b5 domain and three histidine motifs (HXXXH, HXXHH, and QXXHH) conserved from humans to microalga (31). The amplicon that starts at TSS1 can uniquely be translated from the exon 1 to produce a protein product with 444 amino acids, retaining all four conserved desaturase domains: a cytochrome b5 domain and three histidine motifs. However, the in-frame translation start site for TSS2 and TSS3 amplicons, located within exon 2, all have identical protein-coding sequences. They produce 360 amino acid proteins lacking the N-terminal cytochrome b5 domain (Fig. 2).
Fig. 2.
Novel alternative mRNA isoforms of baboon FADS1 identified by RACE. Exons are numbered 1–12. Transcripts b, c, d, e, f, and g code for a 444 amino acid protein (collectively FADS1CS). Transcripts h, i, and j code for a 360 amino acid protein (collectively FADS1AT1). Transcript k (FADS1AT2) codes for 270 amino acid protein. (A) Transcripts a is a recent NCBI annotation. (B) Transcript b is the classical transcript (CS). (C–G) In transcripts c through g, the difference is in the length of 3′ UTR and poly(A) tail. (H) In transcript h, exon 1 is truncated and the 5′ UTR is altered. The three histidine motifs are retained but the cytochrome b5 domain is lost. (I, J) In transcripts i and j, exon 1 is deleted and exon 2 is truncated. The 5′ UTR region is embedded within exon 2; the three histidine motifs are retained but the cytochrome b5 domain is lost. (K) In transcript k, multiple exons are missing via alternative splicing. The ATG start site is within exon 1.
We also found a 2,603 bp transcript generated by internal exon deletions using 3′ RACE. This transcript had a truncated exon 6, skipped exons 7–11, and truncated exon 12. For this splice variant, ORF finder predicts a 270 amino acid protein using TSS1. The 270 amino acid protein retains the cytochrome b5 domain and the first two histidine motifs, losing the third due to splicing (Fig. 2). Our screening did not identify the novel NCBI-annotated transcript that codes for a predicted 501 amino acid protein.
Novel FADS1 isoform enhance FADS2 activity
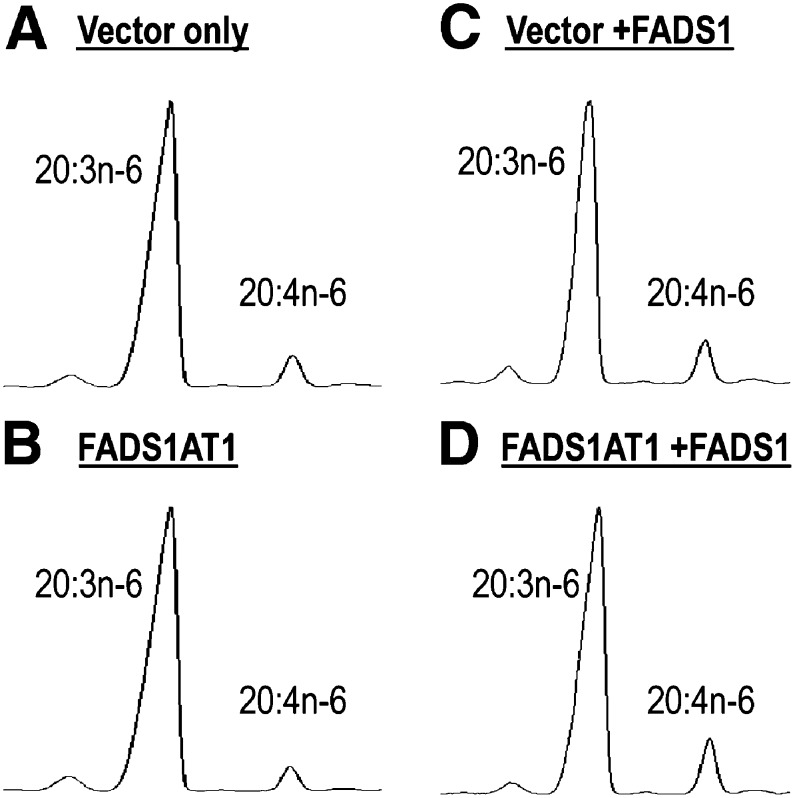
Stable FADS1AT1 MCF7 cells were generated to determine the functional role of novel FADS1AT1 isoform. When incubated for 24 h with 20:3n-6, a natural FADS1 substrate, cells stably expressing FADS1AT1 showed no catalytic activity toward 20:3n-6 (Fig. 3A, B). When transiently transfected with FADS1, these cells showed enhanced conversion of 20:3n-6 to 20:4n-6 compared with nontransfected cells, but FADS1AT1 had no effect on the activity of FADS1 (Fig. 3C, D). Table 1 shows that 20:3n-6 → 20:4n-6 was 10.35 ± 0.01% in FADS1 + vector cells, compared with 11.05 ± 0.04% in FADS1 + FADS1AT1 cells, yielding a ratio of 1.07-fold, not significantly different from 1.
Fig. 3.
GC results of transfection assay of MCF7 cells with 20:3n-6 substrate. Cells stably expressing (A) vector only or (B) FADS1AT1 show no desaturase activity. Cotransfection of both the (C) vector-only cells and (D) FADS1AT1 cells with FADS1 shows enhanced 20:4n-6 (via 20:3→20:4 catalyzed by FADS1) but no difference in 20:4n-6, indicating FADS1AT1 is not a modifier of FADS1 activity.
TABLE 1.
Conversion ratio of cotransfected vector-only and FADS1AT1 cells with FADS1
| Substrate | Reaction | Product/Substrate (%) Mean ± SD | Ratio | |
| FADS1 + Vector | FADS1 + FADS1AT1 | (FADS1 + FADS1AT1) / (FADS1 + Vector) | ||
| 20:3n-6 | Δ5-desaturase (20:3n-6 → 20:4n-6) | 10.35 ± 0.01 | 11.05 ± 0.04 | 1.07 |
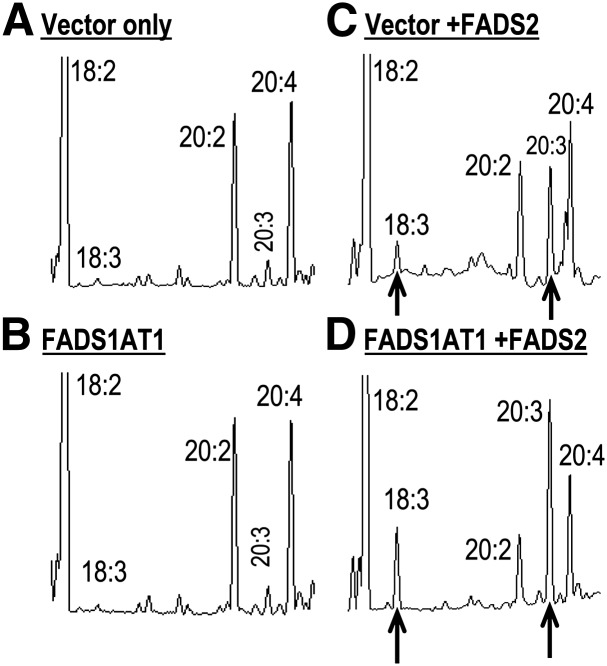
When stable FADS1AT1 MCF7 cells were incubated for 24 h with 18:2n-6, a natural FADS2 substrate, no desaturation activity was observed in either control (vector only), or FADS1AT1 cells (Fig. 4A, B). Control and stable FADS1AT1 cells were then transiently transfected with FADS2 DNA and incubated with 18:2n-6. FADS2-transfected vector-only cells gained Δ6-desaturase activity to generate the expected 18:3n-6 product, and also converted 20:2n-6 to 20:3n-6 via Δ8-desaturation (Fig. 4C). When FADS1AT1 cells were transfected with FADS2 DNA, production of 18:3n-6 via Δ6-desaturation more than doubled (Fig. 4D). Moreover, the Δ8-desaturation product 20:3n-6 synthesized via Δ8-desaturation of 20:2n-6 also increased significantly, while apparently depleting 20:2n-6 substrate. Table 2 shows that 18:2n-6 → 18:3n-6 was 3.1 ± 0.4% in FADS2 + vector cells compared with 7.8 ± 1.9% in FADS2 + FADS1AT1 cells, a ratio of 2.5-fold. We also found that 18:2n-6 is elongated to 20:2n-6 and Δ8-desaturated to 20:3n-6, with an apparent conversion of 45 ± 2% in FADS2 + vector cells compared with 71 ± 0.2% in FADS2 + FADS1AT1 cells, a ratio of 1.6-fold.
Fig. 4.
GC results of transfection assay of MCF7 cells with 18:2n-6. Transfection of (A) vector-only cells or (B) FADS1AT1 cells shows no desaturation activity (C) Cotransfection of the vector-only cells with FADS2 shows 18:3n-6 and 20:3n-6 product synthesis. (D) Cotransfection of FADS1AT1 with FADS2 produces 18:3n-6 and 20:3n-6 enhanced by more than 2-fold.
TABLE 2.
Conversion ratio of cotransfected vector-only and FADS1AT1 cells with FADS2
| Substrate | Reaction | Product/Substrate (%) Mean ± SD | Ratio | P | |
| FADS2 + Vector | FADS2 + FADS1AT1 | (FADS2 + FADS1AT1) / (FADS2 + Vector) | |||
| 18:2n-6 | Δ6-desaturase (18:2n-6 → 18:3n-6) | 3.1 ± 0.4 | 7.8 ± 1.9 | 2.5 | 0.08 |
| Δ8-desaturase (20:2n-6 → 20:3n-6) | 45 ± 2 | 70.5 ± 0.2 | 1.6 | 0.004 | |
Expression of FADS1 transcripts in neonate baboon tissues and human cells
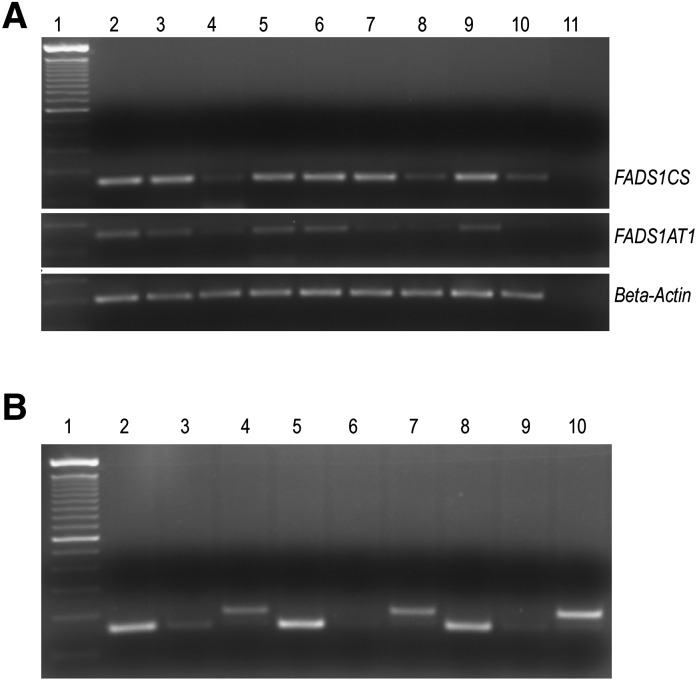
To determine tissue-specific expression levels of the transcripts initiated from TSS1 (FADS1CS) and TSS2 (FADS1AT1), we performed RT-PCR analysis using transcript-specific primers. The transcripts initiated from TSS3 have very short 5′ UTRs embedded within the exon 2; it was not possible to check the expression levels of these transcripts as the sequence overlaps with the TSS1 transcripts. FADS1CS expression was higher than FADS1AT1 in all the tissues and human cells examined (Fig. 5A, B). No amplification product was detected in skeletal muscle, and expression in spleen was very low for FADS1AT1. A trace FADS1AT1 band was visible in MCF7 and SK-N-SH (NB) cells.
Fig. 5.
(A) RT-PCR analysis of FADS1CS and FADS1AT1 expression shown in 9 baboon neonate tissues (lane 1, DNA 100 bp ladder; lane 2, liver; lane 3, kidney; lane 4, retina; lane 5, occipital lobe; lane 6, lung; lane 7, spleen; lane 8, pancreas; lane 9, ovary; lane 10, skeletal muscle; lane 11, no RT). The amplified products were resolved on 2% agarose gel and visualized with ethidium bromide. (B) FADS1CS and FADS1AT1 expression in HepG2, MCF7, and human SK-N-SH neuroblastoma (NB) cells (lane 1, DNA 100 bp ladder; lane 2, FADS1CSHepG2; lane 3, FADS1AT1HepG2; lane 4, β-actinHepG2; lane 5, FADS1CSMCF7; lane 6, FADS1AT1MCF7; lane 7, β-ActinMCF7; lane 8, FADS1CSNB; lane 9, FADS1AT1NB; lane 10, β-actinNB). The amplified products were resolved on 2% agarose gel and visualized with ethidium bromide. FADS1CS and FADS1AT1 generate 143 base pair (bp) products; β-actin, 200 bp products.
FADS1 protein detection by Immunoblot
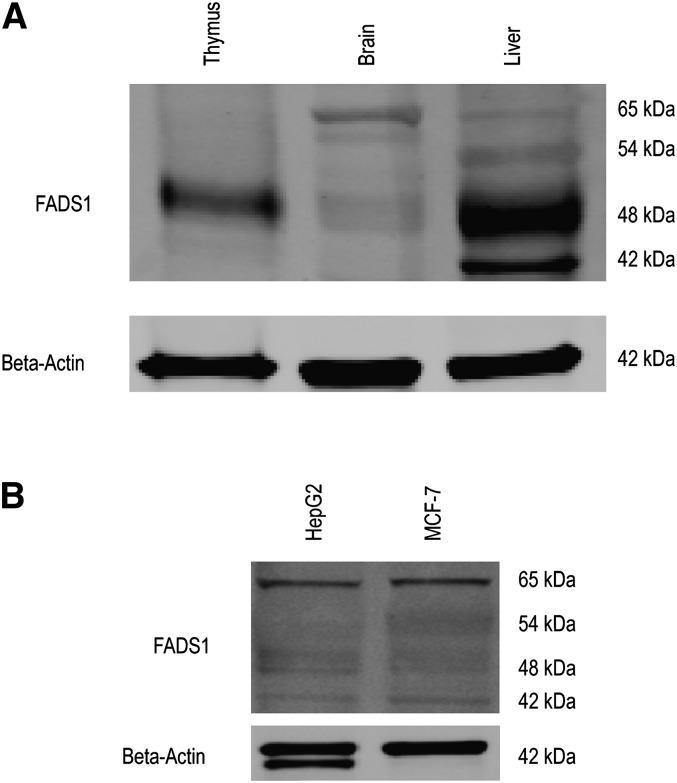
To determine whether the newly identified FADS1 mRNA transcripts encode a protein expressed in tissue, we performed immunoblot analysis using protein lysates extracted from baboon neonate liver, brain, and thymus tissues and three human transformed cells (HepG2, MCF7, and NB). An immunogen directed against the C-terminal third histidine motif was selected because the new putative protein isoform does not contain the N-terminal cytochrome b5 domain; this immunogen was predicted to recognize both the classical and the putative isoforms. We detected two prominent (42 and 48 kDa) and two faint (54 and 65 kDa) products in liver, two prominent (48 and 65 kDa) and one faint (60 kDa) product in brain, and one prominent (48 kDa) product in thymus (Fig. 6A). We also found 42 kDa and 48 kDa products in HepG2 and MCF7 human cells. A significant observation was increased expression of the 65 kDa product in the cells compared with the tissues (Fig. 6B).
Fig. 6.
FADS1 protein detection in neonate baboon tissues and mammalian cells. (A) Western blot analysis of FADS1 and β-actin (loading control) using total protein from thymus, brain, and liver tissues. (B) Western blot analysis of FADS1 and β-actin using total protein from HepG2 and MCF7 cells.
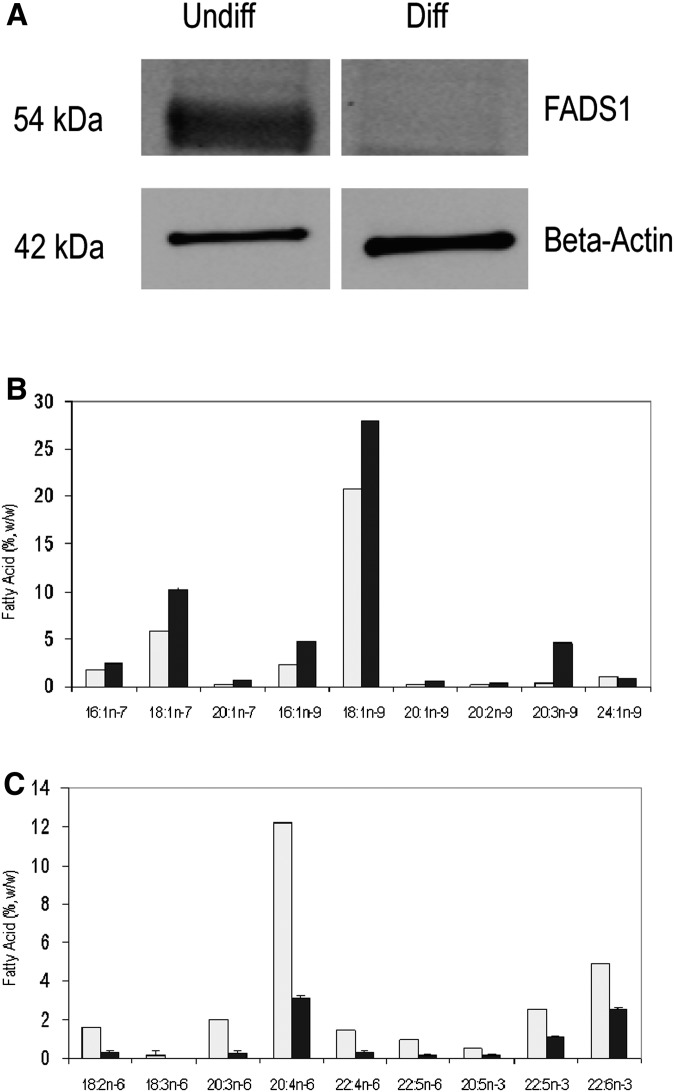
Previously, we showed reciprocal changes in FADS3 alternative transcript expression changes in undifferentiated versus differentiated NB cells (25). We carried out a similar cell differentiation experiment and performed Western blot to check for isoform expression differences. We detected 54 kDa FADS1 protein isoform to be highly expressed in undifferentiated cells, whereas no product was seen in differentiated cells (Fig. 7A). To establish a functional significance of 54 kDa isoform expression limited only to undifferentiated cells, the fatty acid composition of NB cells was analyzed. The fatty acid concentrations of undifferentiated versus differentiated NB cells showed reciprocal changes in the composition of polyunsaturated fatty acids (PUFA) compared with monounsaturated fatty acids (MUFA). The physiologically important LCPUFA [AA, EPA, and 22:6n-3 (docosahexaenoic acid)] was greater in undifferentiated NB cells compared with MUFA [18:1n-7 (vaccenic acid) and 18:1n-9 (oleic acid)]; an opposite pattern was found in differentiated cells (Fig. 7B). The most significantly increased fatty acid was AA (>4-fold change) in undifferentiated cells; the protein encoded by FADS1, the Δ5-desaturase, catalyzed the synthesis of AA.
Fig. 7.
FADS1 protein isoform expression and fatty acid changes upon NB cell differentiation. (A) Western blot analysis of FADS1 and β-actin using total protein from undifferentiated and differentiated NB cells. (B) Fatty acid analysis of undifferentiated (open bars) and differentiated (black bars) NB cells.
Subcellular localization
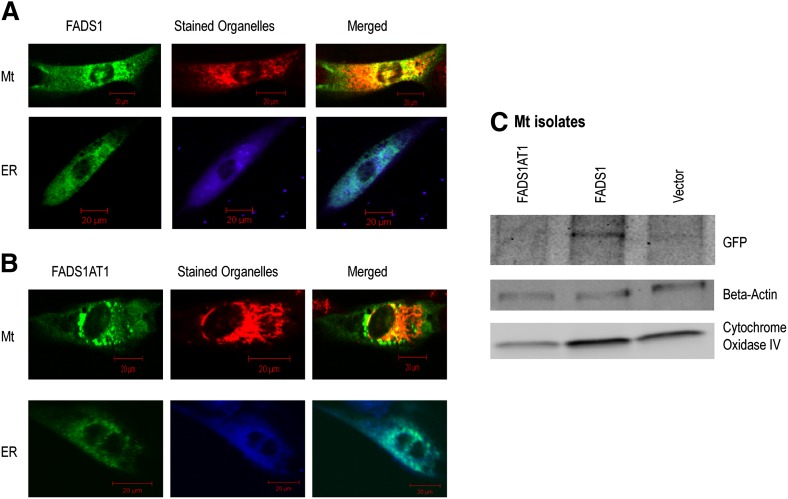
FADS are known to be ER proteins, but some evidence suggests they are active in other organelles, especially mitochondria (32, 33). To determine the subcellular localization of FADS1CS (444 amino acids) and FADS1AT1 (360 amino acids), we performed experiments using GFP tagging system. NB cells transfected with constructed vectors were analyzed after staining with MitoTracker Red and ER-tracker Blue-White DPX to specifically target the organelle localization. Imaging analysis suggests that both FADS1CS and FADS1AT1 localize to the ER; FADS1CS, but not FADS1AT1, localizes to the mitochondria (Fig. 8A, B). To confirm the mitochondrial localization, we isolated mitochondria from the NB cells and performed Western blot using GFP, COX IV, and PDI antibodies to detect FADS1 and confirm the purity of mitochondria. We detected a 75 kDa band for FADS1CS, but not for FADS1AT1, with the GFP antibody corresponding to the intact FADS1CS-GFP band (48 kDa FADS1CS; 27 kDa GFP). Clear bands were observed using COX IV antibody (Fig. 8C). No band was visible using PDI antibody, demonstrating that there is no ER contamination in the mitochondrial isolate and showing conclusively that FADS1CS localizes to mitochondria.
Fig. 8.
Subcellular localization of FADS1 isoforms. SK-N-SH NB cells were transfected with (A) pEFADS1 and (B) pEFADS1AT1; stained with MitoTracker Red (Mt) or ER-tracker Blue-White DPX (ER); and visualized with an inverted confocal microscope. (C) Western blot analysis using GFP, β-actin, and COXIV antibodies.
Active translation of FADS transcripts in mammalian embryonic cells
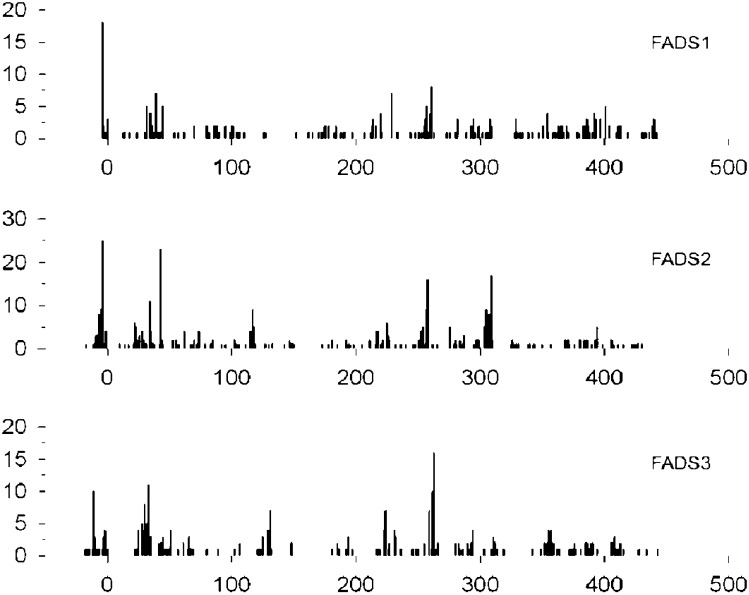
The range of alternative transcripts now identified for all three FADS genes prompted us to look for the translation of FADS mRNA in mouse embryonic fibroblast (MEF) cells using ribosome foot-printing technology. On the basis of a previously published protocol (34), we investigated the translation (mRNA → protein) of all three FADS mRNA in MEF cells. Briefly, MEF cell mRNA was isolated, retaining between 1 and 20 ribosomes attached in the process of translation, the mRNA resembling a string and the ribosomes resembling pearls. Bare mRNA was digested, leaving ribosomes protecting mRNA of length averaging 28 mers. Ribosomes were then proteolyzed, releasing mRNA for sequencing and assignment to genes. Fig. 9 presents a histogram of the results, showing the exact copy numbers of various 28 mers positioned along the coding regions of FADS1, FADS2, and FADS3. mRNA fragments with high copy numbers may reflect translational pausing. The total fragments appear at approximately the same abundance from each FADS gene, providing the first positive-sequence-specific proof that FADS1, FADS2, and FADS3 are translated at similar levels in mammalian embryonic stage cells.
Fig. 9.
Translation of all FADS trapped in ribosomes of mouse MEF cells. FADS1 mRNA is translated into protein at similar to levels FADS2-3.
DISCUSSION
Here we report that a novel human FADS1 alternative transcript, FADS1AT1, with no desaturase activity potentiates the function of the FADS2 classical transcript on its native substrates, 18:2n-6 and apparently 20:2n-6. The net process promotes the accumulation of the downstream eicosanoid precursor 20:3n-6 synthesized via rapid (not rate-limiting) elongation either subsequent or prior to Δ6- or Δ8-desaturation, respectively. Alternative transcripts are known to modulate the function of the classical transcript of their respective genes (e.g., the estrogen receptor); however, this is the first instance of the alternative transcript modifying the function of another gene.
Biochemical studies of Δ6-desaturation demonstrated that the microsomal activity required a low density protein (“lipoprotein-like” saline density 1.26–1.27 g/ml) from cytosol for normal activity (28). The reported protein bound fatty acids and fatty acid CoA, especially 18:2n-6 CoA, suggesting it is involved in transport and is noncatalytic; no other properties were reported. Speculation on mechanisms of action included binding and transport of product fatty acids away from the enzyme. The predicted FADS1AT1 protein is lipophilic and would likely bind fatty acids. We have described numerous AT of the FADS genes, particularly for FADS3, but we have been unable to establish a function through transfection studies. Extension of the present FADS1AT1 results leads to the plausible hypothesis that FADS3AT and FADS2AT (25, 26) play a noncatalytic role in desaturase activity that may be revealed by cotransfection studies.
FADS1AT1 lacks the conserved cytochrome b5 domain characteristic of front-end desaturases. Splice variants that lack conserved domains exert dominant negative or positive effects on the active forms (8, 9). A possible facilitator of this interaction may be the significant overlap of the 5′ UTR region of the FADS1AT1 sequence with the newly identified FADS2 isoform (GenBank accession AK299762), both sharing a common bidirectional promoter. For all human genes that are adjacent and transcribed from opposite strands of DNA, 10% are regulated by bidirectional promoters (35, 36). Moreover, bidirectional arrangements are conserved among orthologous gene pairs in the mouse genome (35).
We also report a complex functional gene structure of primate FADS1 resulting from alternative promoter usage and transcription initiation, alternative use of poly(A) sites, and alternative splicing generating multiple mRNA transcripts and protein isoforms. Previously, a single FADS1 transcript was known in mammals (24); we previously reported that FADS3 encodes several splice variants that arise from alternative splicing of internal exons and that a splice variant of FADS2 arises from deletion of internal exons. The majority (74%) of splicing events are reported to occur in coding regions, followed by the 5′ UTR (22%) and 3′ UTR (4%) (37).
UTR heterogeneity is striking, with identification of at least four 5′ UTR and seven 3′ UTR variants, whereas only one new transcript has internal exon deletions. 5′ UTR heterogeneity leads to alternative promoter usage, either encoding identical protein isoforms or different protein isoforms with distinct functional activities (38, 39). Alternative promoter usage and 5′ UTR heterogeneity can affect tissue-specific expression and translational efficiency and generate protein diversity (38, 40), and it is widely represented in genes that are involved in transcription regulation and development (41). Two FADS1 isoforms have very short 5′ UTR that are embedded in the exon 2 of baboon FADS1. Shorter 5′ UTR variants are translated more efficiently than longer variants in TGF-β, BRCA1, and Mdm2 (42).
We also identified at least seven distinct 3′ UTR variants for FADS1. In mammals, mRNA polyadenylation functions in mRNA stability, translation, transport, and processing (43). In mammals, several highly conserved hexamer sequence variants exist upstream of the polyadenylation sites (44), which mediate termination of transcription followed by polyadenylation (45). In our study, two amplicons (1,114 bp, and 1,156 bp) had a CATAAA poly(A) signal 11 bp upstream of the polyadenylation start site; one amplicon (1,460 bp) had a ACTAAA poly(A) signal 124 bp upstream of the polyadenylation start site; no proper poly(A) signal could be identified for two amplicons (1,606 bp and 1,620 bp); and two amplicons (2,603 bp and 3,750 bp) had AATAAA poly(A) signal 14 and 13 bp upstream of polyadenylation start site, respectively. Recently, Thomsen et al (46), proposed two hypotheses to explain the existence of distinct 3′ UTR during studies of the developmentally regulated Hox genes in Drosophila: i) miRNA avoidance, in which shorter 3′ UTR isoforms may have evolved from longer 3′ UTR isoforms to avoid miRNA targeting; and ii) miRNA “enhanced regulation,” in which longer isoforms evolved from shorter isoforms to interact with miRNAs at selected spatiotemporal coordinates thereby enhancing regulatory surfaces.
We queried DIANA-microT web server software (47) using Human FADS1 (GenBank accession NM_013402) to check for miRNA binding sites at the 3′ UTR (48). Three conserved miRNA (hsa-miR-511, hsa-miR-140-5P, and hsa-miR-150) binding sites were identified at the 3′ UTR position of the human FADS1. Two (2,603 bp and 3,750 bp) out of seven amplicons reported here have hsa-miR-140-5P and hsa-miR-150 binding sites. The hsa-miR-140-5P miRNA site at 3′ UTR position 2,401–2,429 bp is well conserved in rat, mouse, rabbit, and baboon. The hsa-miR-150 miRNA site at 3′ UTR position 1,145–1,173 bp is also well conserved in dog and baboon. Future studies may establish whether these miRNA regulate FADS1 mRNA degradation.
The tissue- and cell-specific expression of FADS1CS and FADS1AT1 transcripts can be attributed to utilization of distinct promoter elements. The ubiquitously expressed FADS1CS shows greater expression in most tissues than does FADS1AT1, possibly due to stronger promoter activity. Protein isoforms generated by alternative use of promoters can exhibit opposing biological functions. For instance, for tumor suppressor p53 gene, the full-length isoforms promote cell-cycle arrest and apoptosis, whereas the truncated isoforms promote proliferation (49).
Additionally, we detected multiple protein isoforms of FADS1 in primate tissue using a C-terminal human FADS1 antibody. Considering the protein coding cDNA sequence of baboon FADS1 (GenBank accession EF531577), we predicted a protein size of 52 kDa using a protein molecular weight calculator (http://www.sciencegateway.org/tools/proteinmw.htm). However, we found a smaller molecular size product of 48 kDa in all the three tissues, with highest expression in liver followed by thymus and brain. This shorter product may be due to protein degradation or cleavage. Similar observations were made by Pedrono et al. (50) using a FADS3 antibody. For the cDNA sequence of baboon FADS1AT1 (GenBank accession HQ440212), we predicted a protein size of 42 kDa. This 42 kDa protein is detected only in the liver tissue and closely resembles stearoyl-CoA desaturase (SCD), a key lipogenic enzyme that catalyses the biosynthesis of MUFA and is associated with metabolic syndrome (obesity and diabetes) (51). Both of them lack the cytochrome b5 domain but retain three well-conserved histidine motifs. The other significant products that we observed were 54 kDa, 60 kDa, and 65 kDa protein isoforms, but 5′ and 3′ RACE experiments did not successfully identify corresponding transcripts. A comprehensive analysis by using RNA-Seq technique may reveal FADS1 isoforms. However, in HepG2 and MCF7 cells, the 65 kDa isoform was preferentially expressed compared with the 48 kDa and 42 kDa isoforms; this expression pattern was not observed in undifferentiated and differentiated NB cells. The isoform expression pattern appears to be tissue- and cell type-dependent, presumably based on tissue- and cell-specific splicing mechanisms. In undifferentiated NB cells, the 54 kDa isoform induction is directly related to an increase in AA, the metabolic product of FADS1CS. This particular isoform may be under specific control based on developmental stage.
It is well known that desaturation and elongation steps localize to the ER (52), but they have been suggested over the years to occur in other organelles as well (32). Data implicating mitochondrial involvement in 22:6n-3 biosynthesis requiring FADS2 has been appeared periodically (33, 53), and desaturation has been reported in nuclei (54). Here we show for the first time molecular evidence that FADS1CS is localized to the mitochondria by live cell imaging and subcellular fractionation using a GFP tagging system and immunoblotting. The presence of N-terminal mitochondrial targeting sequence MAPDPVAAKTPVQGPTPRYFTWDEVAQ and the cleavage site at amino acid position 28 with a probability score of 0.1624 predicted by MitoProt II (55) for FADS1CS is consistent with mitochondria localization. Our failure to observe FADS1AT1 in the mitochondria may be because the N-terminal region is deleted due to splicing in FADS1AT1.
We show here that all three classical FADS transcripts are translated at similar levels in MEF cells, implying that they are essential components during early development. Recently, it has been shown that FADS1 is highly enriched in hatched blastocysts (56). Moreover, FADS2 and FADS3 were found to be upregulated greater than 2-fold at the implantation sites in mice (57). Though no biochemical function has been reported for FADS3, these data further support protein detection studies (50) showing that FADS3 is a functional gene, not a “cryptic” noncoding gene.
The first observation that FADS1 produces several mRNA isoforms shows that all three genes in the FADS gene cluster do so. The newly identified transcripts are generated by alternative transcription initiation, alternative selection of poly(A) sites, and internal exon deletions resulting from alternative splicing. We also show positive detection of FADS1 protein isoforms, differential tissue- and cell type-specific isoform expression patterns, differential isoform expressions during cell differentiation, isoform-specific subcellular localization, and translation of FADS transcripts in embryonic cells. A novel sequence encoding a 360 amino acid protein having no cytochrome b5 domain, similar to SCD was identified. We also show molecular evidence that the novel FADS1 isoform enhances the activity of FADS2 and increase the production of eicosanoid precursors, the first demonstration of an isoform of one gene enhancing the activity of another. Our results indicate that FADS isoforms have critical roles as mediators of LCPUFA biosynthesis, including enhanced eicosanoid precursor biosynthesis and/or regulation, depending on tissues, organelles, and developmental stage.
Acknowledgments
The authors thank Ian Downs, David Kaiser, and Andrea Kim for technical assistance. MCF7 cells and pEGFP-N1 vector were the kind gifts of Dr. Rui Hai Liu and Dr. Ling Qi, respectively, at Cornell University.
Footnotes
Abbreviations:
- AA
- arachidonic acid
- AT
- alternative transcript
- EPA
- eicosapentaenoic acid
- CMV
- cytomegalovirus
- ER
- endoplasmic reticulum
- FADS
- fatty acid desaturase
- FADS1AT1
- FADS1 alternative transcript 1
- FAME
- fatty acid methyl ester
- LCPUFA
- long chain polyunsaturated fatty acid
- ORF
- open reading frame
- poly(A)
- polyadenylation
- RACE
- rapid amplification of cDNA ends
- TSS
- transcription start site
This work was supported by the Cornell Division of Nutritional Sciences internal seed funding. H.T.R. was supported by a Ruth L. Kirchstein–NRSA predoctoral training fellowship in reproductive sciences and genomics (Grant T32-HD-052471) from the Eunice Kennedy Shriver National Institute of Child Health and Human Development (NICHD). Its contents are solely the responsibility of the authors and do not necessarily represent the official views of the National Institutes of Health.
REFERENCES
- 1.Poulos M. G., Batra R., Charizanis K., Swanson M. S. 2011. Developments in RNA splicing and disease. Cold Spring Harb. Perspect. Biol. 3: a000778. [DOI] [PMC free article] [PubMed] [Google Scholar]
- 2.Dennehey B. K., Leinwand L. A., Krauter K. S. 2006. Diversity in transcriptional start site selection and alternative splicing affects the 5′-UTR of mouse striated muscle myosin transcripts. J. Muscle Res. Cell Motil. 27: 559–575 [DOI] [PubMed] [Google Scholar]
- 3.Lutz C. S. 2008. Alternative polyadenylation: a twist on mRNA 3′ end formation. ACS Chem. Biol. 3: 609–617 [DOI] [PubMed] [Google Scholar]
- 4.Chen M., Manley J. L. 2009. Mechanisms of alternative splicing regulation: insights from molecular and genomics approaches. Nat. Rev. Mol. Cell Biol. 10: 741–754 [DOI] [PMC free article] [PubMed] [Google Scholar]
- 5.Nilsen T. W., Graveley B. R. 2010. Expansion of the eukaryotic proteome by alternative splicing. Nature. 463: 457–463 [DOI] [PMC free article] [PubMed] [Google Scholar]
- 6.Tazi J., Bakkour N., Stamm S. 2009. Alternative splicing and disease. Biochim. Biophys. Acta. 1792: 14–26 [DOI] [PMC free article] [PubMed] [Google Scholar]
- 7.Li Q., Lee J. A., Black D. L. 2007. Neuronal regulation of alternative pre-mRNA splicing. Nat. Rev. Neurosci. 8: 819–831 [DOI] [PubMed] [Google Scholar]
- 8.Stamm S., Ben-Ari S., Rafalska I., Tang Y., Zhang Z., Toiber D., Thanaraj T. A., Soreq H. 2005. Function of alternative splicing. Gene. 344: 1–20 [DOI] [PubMed] [Google Scholar]
- 9.Bryant W., Snowhite A. E., Rice L. W., Shupnik M. A. 2005. The estrogen receptor (ER)alpha variant Delta5 exhibits dominant positive activity on ER-regulated promoters in endometrial carcinoma cells. Endocrinology. 146: 751–759 [DOI] [PubMed] [Google Scholar]
- 10.Gerstein M. B., Bruce C., Rozowsky J. S., Zheng D., Du J., Korbel J. O., Emanuelsson O., Zhang Z. D., Weissman S., Snyder M. 2007. What is a gene, post-ENCODE? History and updated definition. Genome Res. 17: 669–681 [DOI] [PubMed] [Google Scholar]
- 11.Mendoza-Vargas A., Olvera L., Olvera M., Grande R., Vega-Alvarado L., Taboada B., Jimenez-Jacinto V., Salgado H., Juarez K., Contreras-Moreira B., et al. 2009. Genome-wide identification of transcription start sites, promoters and transcription factor binding sites in E. coli. PLoS ONE. 4: e7526. [DOI] [PMC free article] [PubMed] [Google Scholar]
- 12.Carlson S. E., Werkman S. H., Peeples J. M., Cooke R. J., Tolley E. A. 1993. Arachidonic acid status correlates with first year growth in preterm infants. Proc. Natl. Acad. Sci. USA. 90: 1073–1077 [DOI] [PMC free article] [PubMed] [Google Scholar]
- 13.Kris-Etherton P. M., Harris W. S., Appel L. J. 2002. Fish consumption, fish oil, omega-3 fatty acids, and cardiovascular disease. Circulation. 106: 2747–2757 [DOI] [PubMed] [Google Scholar]
- 14.Carpentier Y. A., Portois L., Malaisse W. J. 2006. n-3 fatty acids and the metabolic syndrome. Am. J. Clin. Nutr. 83: 1499S–1504S [DOI] [PubMed] [Google Scholar]
- 15.Joseph J., Cole G., Head E., Ingram D. 2009. Nutrition, brain aging, and neurodegeneration. J. Neurosci. 29: 12795–12801 [DOI] [PMC free article] [PubMed] [Google Scholar]
- 16.Meesapyodsuk D., Reed D. W., Savile C. K., Buist P. H., Ambrose S. J., Covello P. S. 2000. Characterization of the regiochemistry and cryptoregiochemistry of a Caenorhabditis elegans fatty acid desaturase (FAT-1) expressed in Saccharomyces cerevisiae. Biochemistry. 39: 11948–11954 [DOI] [PubMed] [Google Scholar]
- 17.Nakamura M. T., Nara T. Y. 2004. Structure, function, and dietary regulation of delta6, delta5, and delta9 desaturases. Annu. Rev. Nutr. 24: 345–376 [DOI] [PubMed] [Google Scholar]
- 18.Park W. J., Kothapalli K. S., Lawrence P., Tyburczy C., Brenna J. T. 2009. An alternate pathway to long-chain polyunsaturates: the FADS2 gene product Delta8-desaturates 20:2n-6 and 20:3n-3. J. Lipid Res. 50: 1195–1202 [DOI] [PMC free article] [PubMed] [Google Scholar]
- 19.Calder P. C. 2009. Polyunsaturated fatty acids and inflammatory processes: new twists in an old tale. Biochimie. 91: 791–795 [DOI] [PubMed] [Google Scholar]
- 20.Dupuis J., Langenberg C., Prokopenko I., Saxena R., Soranzo N., Jackson A. U., Wheeler E., Glazer N. L., Bouatia-Naji N., Gloyn A. L., et al. 2010. New genetic loci implicated in fasting glucose homeostasis and their impact on type 2 diabetes risk. Nat. Genet. 42: 105–116 [DOI] [PMC free article] [PubMed] [Google Scholar]
- 21.Illig T., Gieger C., Zhai G., Romisch-Margl W., Wang-Sattler R., Prehn C., Altmaier E., Kastenmuller G., Kato B. S., Mewes H. W., et al. 2010. A genome-wide perspective of genetic variation in human metabolism. Nat. Genet. 42: 137–141 [DOI] [PMC free article] [PubMed] [Google Scholar]
- 22.Eijgelsheim M., Newton-Cheh C., Sotoodehnia N., de Bakker P. I., Muller M., Morrison A. C., Smith A. V., Isaacs A., Sanna S., Dorr M., et al. 2010. Genome-wide association analysis identifies multiple loci related to resting heart rate. Hum. Mol. Genet. 19: 3885–3894 [DOI] [PMC free article] [PubMed] [Google Scholar]
- 23.Cho H. P., Nakamura M., Clarke S. D. 1999. Cloning, expression, and fatty acid regulation of the human delta-5 desaturase. J. Biol. Chem. 274: 37335–37339 [DOI] [PubMed] [Google Scholar]
- 24.Marquardt A., Stohr H., White K., Weber B. H. 2000. cDNA cloning, genomic structure, and chromosomal localization of three members of the human fatty acid desaturase family. Genomics. 66: 175–183 [DOI] [PubMed] [Google Scholar]
- 25.Park W. J., Kothapalli K. S., Reardon H. T., Kim L. Y., Brenna J. T. 2009. Novel fatty acid desaturase 3 (FADS3) transcripts generated by alternative splicing. Gene. 446: 28–34 [DOI] [PMC free article] [PubMed] [Google Scholar]
- 26.Park W. J., Reardon H. T., Tyburczy C., Kothapalli K. S., Brenna J. T. 2010. Alternative splicing generates a novel FADS2 alternative transcript in baboons. Mol. Biol. Rep. 37: 2403–2406 [DOI] [PMC free article] [PubMed] [Google Scholar]
- 27.Brenna J. T., Kothapalli K. S., Park W. J. 2010. Alternative transcripts of fatty acid desaturase (FADS) genes. Prostaglandins Leukot. Essent. Fatty Acids. 82: 281–285 [DOI] [PMC free article] [PubMed] [Google Scholar]
- 28.Leikin A. I., Brenner R. R. 1986. Regulation of linoleic acid delta 6-desaturation by a cytosolic lipoprotein-like fraction in isolated rat liver microsomes. Biochim. Biophys. Acta. 876: 300–308 [DOI] [PubMed] [Google Scholar]
- 29.Michaud A. L., Diau G. Y., Abril R., Brenna J. T. 2002. Double bond localization in minor homoallylic fatty acid methyl esters using acetonitrile chemical ionization tandem mass spectrometry. Anal. Biochem. 307: 348–360 [DOI] [PubMed] [Google Scholar]
- 30.Reese M. G. 2001. Application of a time-delay neural network to promoter annotation in the Drosophila melanogaster genome. Comput. Chem. 26: 51–56 [DOI] [PubMed] [Google Scholar]
- 31.Sperling P., Ternes P., Zank T. K., Heinz E. 2003. The evolution of desaturases. Prostaglandins Leukot. Essent. Fatty Acids. 68: 73–95 [DOI] [PubMed] [Google Scholar]
- 32.Infante J. P., Huszagh V. A. 1998. Analysis of the putative role of 24-carbon polyunsaturated fatty acids in the biosynthesis of docosapentaenoic (22:5n-6) and docosahexaenoic (22:6n-3) acids. FEBS Lett. 431: 1–6 [DOI] [PubMed] [Google Scholar]
- 33.Jakobsson A., Ericsson J., Dallner G. 1990. Metabolism of fatty acids and their incorporation into phospholipids of the mito chondria and endoplasmic reticulum in isolated hepatocytes determined by isolation of fluorescence derivatives. Biochim. Biophys. Acta. 1046: 277–287 [DOI] [PubMed] [Google Scholar]
- 34.Ingolia N. T., Ghaemmaghami S., Newman J. R., Weissman J. S. 2009. Genome-wide analysis in vivo of translation with nucleotide resolution using ribosome profiling. Science. 324: 218–223 [DOI] [PMC free article] [PubMed] [Google Scholar]
- 35.Trinklein N. D., Aldred S. F., Hartman S. J., Schroeder D. I., Otillar R. P., Myers R. M. 2004. An abundance of bidirectional promoters in the human genome. Genome Res. 14: 62–66 [DOI] [PMC free article] [PubMed] [Google Scholar]
- 36.Yang M. Q., Elnitski L. L. 2008. Diversity of core promoter elements comprising human bidirectional promoters. BMC Genomics. 9(Suppl. 2): S3. [DOI] [PMC free article] [PubMed] [Google Scholar]
- 37.Modrek B., Resch A., Grasso C., Lee C. 2001. Genome-wide detection of alternative splicing in expressed sequences of human genes. Nucleic Acids Res. 29: 2850–2859 [DOI] [PMC free article] [PubMed] [Google Scholar]
- 38.Courtois V., Chatelain G., Han Z. Y., Le Novere N., Brun G., Lamonerie T. 2003. New Otx2 mRNA isoforms expressed in the mouse brain. J. Neurochem. 84: 840–853 [DOI] [PubMed] [Google Scholar]
- 39.Goossens S., Janssens B., Vanpoucke G., De Rycke R., van Hengel J., van Roy F. 2007. Truncated isoform of mouse alphaT-catenin is testis-restricted in expression and function. FASEB J. 21: 647–655 [DOI] [PubMed] [Google Scholar]
- 40.Hughes T. A. 2006. Regulation of gene expression by alternative untranslated regions. Trends Genet. 22: 119–122 [DOI] [PubMed] [Google Scholar]
- 41.Baek D., Davis C., Ewing B., Gordon D., Green P. 2007. Characterization and predictive discovery of evolutionarily conserved mammalian alternative promoters. Genome Res. 17: 145–155 [DOI] [PMC free article] [PubMed] [Google Scholar]
- 42.Pickering B. M., Willis A. E. 2005. The implications of structured 5′ untranslated regions on translation and disease. Semin. Cell Dev. Biol. 16: 39–47 [DOI] [PubMed] [Google Scholar]
- 43.Guhaniyogi J., Brewer G. 2001. Regulation of mRNA stability in mammalian cells. Gene. 265: 11–23 [DOI] [PubMed] [Google Scholar]
- 44.Beaudoing E., Freier S., Wyatt J. R., Claverie J. M., Gautheret D. 2000. Patterns of variant polyadenylation signal usage in human genes. Genome Res. 10: 1001–1010 [DOI] [PMC free article] [PubMed] [Google Scholar]
- 45.Orozco I. J., Kim S. J., Martinson H. G. 2002. The poly(A) signal, without the assistance of any downstream element, directs RNA polymerase II to pause in vivo and then to release stochastically from the template. J. Biol. Chem. 277: 42899–42911 [DOI] [PubMed] [Google Scholar]
- 46.Thomsen S., Azzam G., Kaschula R., Williams L. S., Alonso C. R. 2010. Developmental RNA processing of 3′UTRs in Hox mRNAs as a context-dependent mechanism modulating visibility to microRNAs. Development. 137: 2951–2960 [DOI] [PubMed] [Google Scholar]
- 47.Maragkakis M., Reczko M., Simossis V. A., Alexiou P., Papadopoulos G. L., Dalamagas T., Giannopoulos G., Goumas G., Koukis E., Kourtis K., et al. 2009. DIANA-microT web server: elucidating microRNA functions through target prediction. Nucleic Acids Res. 37: W273–W276. [DOI] [PMC free article] [PubMed] [Google Scholar]
- 48.Bartel D. P. 2004. MicroRNAs: genomics, biogenesis, mechanism, and function. Cell. 116: 281–297 [DOI] [PubMed] [Google Scholar]
- 49.Dötsch V., Bernassola F., Coutandin D., Candi E., Melino G. 2010. p63 and p73, the ancestors of p53. Cold Spring Harb. Perspect. Biol. 2: a004887. [DOI] [PMC free article] [PubMed] [Google Scholar]
- 50.Pédrono F., Blanchard H., Kloareg M., D'Andrea S., Daval S., Rioux V., Legrand P. 2010. The fatty acid desaturase 3 gene encodes for different FADS3 protein isoforms in mammalian tissues. J. Lipid Res. 51: 472–479 [DOI] [PMC free article] [PubMed] [Google Scholar]
- 51.Flowers M. T., Ntambi J. M. 2008. Role of stearoyl-coenzyme A desaturase in regulating lipid metabolism. Curr. Opin. Lipidol. 19: 248–256 [DOI] [PMC free article] [PubMed] [Google Scholar]
- 52.Voss A., Reinhart M., Sankarappa S., Sprecher H. 1991. The metabolism of 7,10,13,16,19-docosapentaenoic acid to 4,7,10,13,16,19-docosahexaenoic acid in rat liver is independent of a 4-desaturase. J. Biol. Chem. 266: 19995–20000 [PubMed] [Google Scholar]
- 53.Hughes S., York D. A. 1985. Hepatic delta 6-desaturase activity in lean and genetically obese ob/ob mice. Biochem. J. 225: 307–313 [DOI] [PMC free article] [PubMed] [Google Scholar]
- 54.Ves-Losada A., Brenner R. R. 1995. Fatty acid delta 5 desaturation in rat liver cell nuclei. Mol. Cell. Biochem. 142: 163–170 [DOI] [PubMed] [Google Scholar]
- 55.Claros M. G., Vincens P. 1996. Computational method to predict mitochondrially imported proteins and their targeting sequences. Eur. J. Biochem. 241: 779–786 [DOI] [PubMed] [Google Scholar]
- 56.Rekik W., Dufort I., Sirard M. A. 2011. Analysis of the gene expression pattern of bovine blastocysts at three stages of development. Mol. Reprod. Dev. 78: 226–240 [DOI] [PubMed] [Google Scholar]
- 57.Chen Y., Ni H., Ma X. H., Hu S. J., Luan L. M., Ren G., Zhao Y. C., Li S. J., Diao H. L., Xu X., et al. 2006. Global analysis of differential luminal epithelial gene expression at mouse implantation sites. J. Mol. Endocrinol. 37: 147–161 [DOI] [PubMed] [Google Scholar]


