Abstract
APOBEC3G catalyzes deamination of cytosines in HIV-1 genome, and restricts the HIV-1 infection. Here, we propose a picomol-scale assay for a detection of DNA deamination catalyzed by APOBEC3G. Our results show the suite of the developed method for a time course analysis of enzyme-catalyzed DNA modifications.
APOBEC3G (A3G, apolipoprotein B mRNA-editing enzyme catalytic polypeptide-like 3G) is a human deaminase protein required for inhibition of human immunodeficiency virus type 1 (HIV-1) infection.1–3 A3G expressed in T lymphocytes is incorporated into newly assembled viral infectivity factor (Vif)-deficient HIV-1 virions, and is delivered to the target cell with the viral components. After entry of the HIV-1 virion into the target cell, A3G massively induces dC-to-dU deamination in synthesized minus-strand viral DNA, resulting in hypermutation of HIV-1 genome and possibly endonucleolytic cleavage by uracil-DNA glycosylase (UDG).2,4 Thus, the deamination activity of A3G plays a major role in the restriction of HIV-1 infection.
A3G has a tandem duplicated domain structure consisted of the N-terminal (NTD) and C-terminal domains (CTD).5 Although both domains include a conserved zinc-binding motif and a glutamic acid residue (E67 in NTD and E259 in CTD) required for the deamination reaction, only the zinc-coordination of CTD is essential for the deamination activity and the antiviral action of A3G.6,7 A3G preferentially deaminates the third cytosine in a hotspot motif 5′-CCC-3′ of single-stranded DNA (ssDNA), and the second cytosine in the motif could be targeted less efficiently.4,8,9 These preferences are also observed in the deamination catalyzed by A3G CTD,10 indicating that the CTD is responsible for the deamination activity and specificity.
To detect the A3G-catalyzed deamination of a ssDNA, a handful of assays have been developed; conventional DNA sequencing,2 the UDG-based assays with biotinylated2 and radioisotope-labeled nucleotides,4 and PCR-based assay.11 These assays require enzyme digestion and/or amplification of the target DNA prior to the deamination detection. In a large-scale (micro mole of analyte DNA) assay, Furukawa et al.10 directly monitored the deamination reaction using one-dimensional 1H NMR measurement.
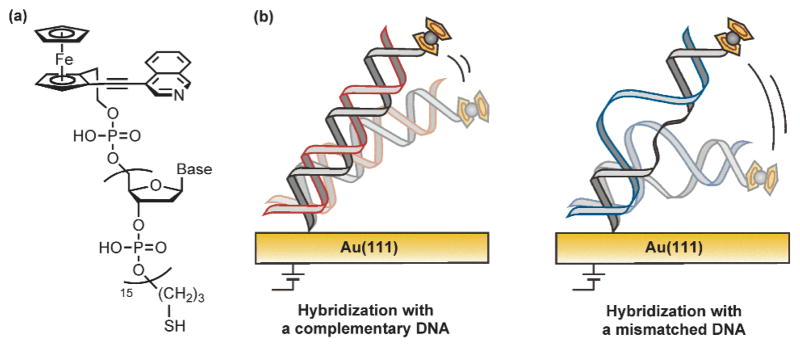
We explored a small-scale assay for a quantitative detection of deaminated DNA fragment using a molecular-based electrochemical technique. The electrochemical methods have been widely used for detection of a single-base modification in DNA; for example, methods to detect DNA methylation have been recently reported.12–15 For ssDNA deamination, no quantitative measurement using electrochemical technique has been developed, although Ostatná et al.16 reported an electrochemical measurement in an all-or-nothing manner. Our method includes hybridization of an analyte DNA with a probe DNA that is chemically modified with a ferrocene/isoquinoline (Fc).17 The hybridized DNA is immobilized on gold electrode and analyzed with an electrochemical technique, square-wave voltammetry (Fig. 1). When applying the pulse potential train on the electrode at an appropriate frequency, electron transfer occurs efficiently from the Fc-moiety of probe DNA to the electrode, resulting in a current peak. The frequency giving a peak is highly dependent on the elasticity of DNA hybrid immobilized on the electrode.17,18 Optimization of the applied frequency refines specificity of the obtained electrochemical signal, and enables us to detect the amount of target DNA. Using this method, we successfully traced the time-course of A3G-catalyzed deamination.
Fig. 1.
(a) The chemical structure of the ferrocene/isoquinoline conjugate-connected DNA probe. (b) Schematic representation of (left) complementary and (right) mismatched DNA hybrids on the electrode. In general, a complementary hybrid indicates a slower structural fluctuation than a mismatched hybrid.
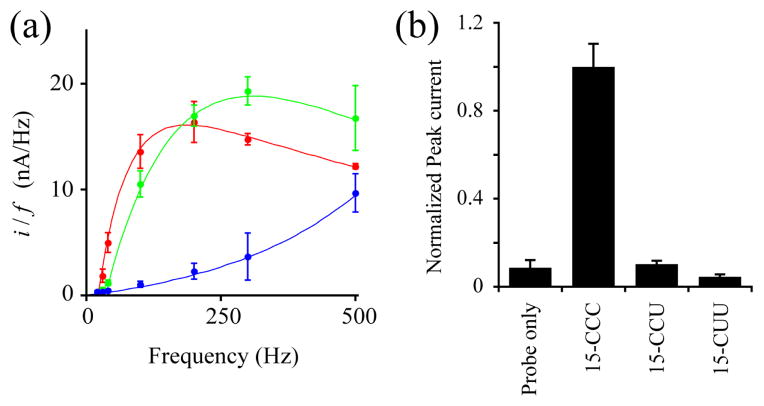
We first examined a specificity of electrochemical response to detect a specific analyte DNA. Prior to the measurement, the analyte DNA is hybridized with a probe DNA. For example, when using a probe DNA, Fc-GGG (for details, see Fig. 1a and Eletronic Supplementary Information), only an analyte 15-CCC can form a complementary hybrid, while other nucleotides such as 15-CCU and 15-CUU yield one and two mismatched hybrids, respectively. The hybrids immobilized on the electrode undergo structural fluctuations at varying frequencies; in general, complementary hybrids indicates a slower fluctuation than mismatched hybrids.17a When applied at a frequency synchronizing with a motional rate of the DNA hybrid, the pulse potential train induces a current peak on the electrogram. Therefore, a complementary hybrid generates a current peak when using a square-wave potential train at a relatively lower frequency, whereas a mismatched hybrid gives a signal peak at higher frequency. Fig. 2a shows a relationship between the frequency-normalized peak current and potential frequency in cases of hybrids, 15-CCC/Fc-GGG, 15-CCU/Fc-GGG, and 15-CUU/Fc-GGG. The complementary hybrid 15-CCC/Fc-GGG gave a peak at ~200 Hz, while mismatched hybrid 15-CCU/Fc-GGG indicated a peak at ~300 Hz. The hybrid 15-CUU/Fc-GGG is likely to give the current peak at a much higher frequency than that of 15-CCU/Fc-GGG. As expected, the hybrid 15-CCC/Fc-GGG gives a peak at a lower frequency than those of mismatched hybrids. More importantly, the square-wave voltammetry measurement enables us to unambiguously distinguish a complementary hybrid from mismatched hybrid at a lower potential frequency. In the case of Fc-GGG, the measurement at 40Hz generated a significant difference between the complementary and mismatched hybrids, and the 15-CCU/Fc-GGG and 15-CUU/Fc-GGG indicated a quite low signal as well as probe only (Fig. 2). Thus, the frequency was optimized for the square-wave voltammetry measurement with a probe DNA Fc-GGG to detect the target DNA 15-CCC specifically.
Fig. 2.
Optimization of a pulse potential frequency for the square-wave voltammetry. (a) Frequency (f) dependence of a peak current derived from a complementary, 15-CCC/Fc-GGG (red), and mismatched hybrids, 15-CCU/Fc-GGG (green) and 15-CUU/Fc-GGG (blue). (b) The normalized peak current derived from a complementary (15-CCC/Fc-GGG), mismatched hybrids (15-CCU/Fc-GGG), and probe only (Fc-GGG). The measurements were performed at 40 Hz, the optimized frequency for the probe Fc-GGG. The values denote the mean ± S.D. derived from five measurements.
The optimized frequency for each probe DNA was summarized in Table S1 (see Electronic Suplementary Inoration). In many cases examined, the obtained peak current showed roughly 10-fold differences between the complementary and mismatched hybrids at optimized potential frequencies. Comparing with the Fc-GGG probe, the measurements using probes Fc-GGA, Fc-GAG, and FC-AGA generated relatively higher normalized peak current for a negative control; the normalized peak current ratios of the mismatched hybrid to the complementary were 0.23 ± 0.19, 0.32 ± 0.06, and 0.20 ± 0.15, respectively (Table S1), which leads a narrower dynamic range to estimate the amount of analyte. However, those probes also are unambiguously distinguishable the target DNA (15-CCU, 15-CUC, and 15-UCU) from mismatched hydrids such as 15-CCC/Fc-GGA, 15-CCC/Fc-GAG, and 15-CCU/Fc-AGA (p < 0.05). We conclude that a specific target DNA is detectable by square-wave voltammetry measurement at an optimized potential frequency with an appropriate probe DNA.
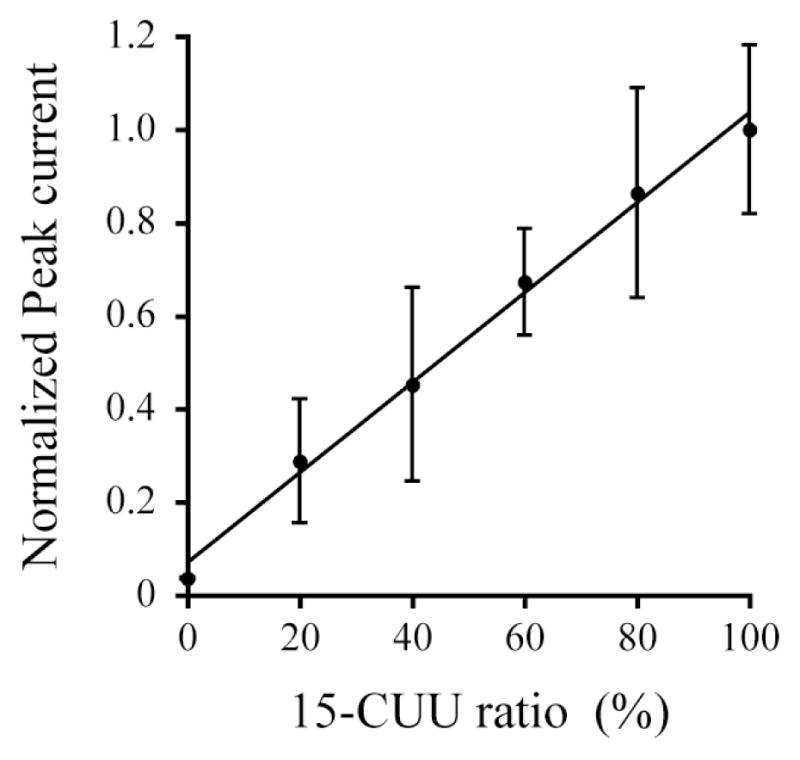
To investigate a relationship between observed peak currents and amounts of target DNA, square-wave voltammetry was performed using a mixture of complementary and mismatched hybrids with various ratios. Fig. 3 shows the peak current observed using a probe DNA Fc-GAA with a mixture of 15-CCU and 15-CUU at ratios of 100:0, 80:20, 60:40, 40:60, 20:80, and 0:100. The signal was progressively higher at increasing the amount of 15-CUU which can form a complementary hybrid with the probe DNA Fc-GAA. The observed peak current followed a linear function of the amount of the target DNA 15-CUU (r2 = 0.993, linear range = 10–50 pmol, and detection limit = 10 pmol). The electrochemical response clearly reflects the amount of target DNA although the current values indicated some variation at each data point. We therefore conclude that the target DNA is detectable semiquantitatively.
Fig. 3.

Relationship between the normalized peak current and the relative amount of target DNA. The peak current was measured using a probe DNA Fc-GAA with a mixture of 15-CCU and 15-CUU at a ratio of 100:0, 80:20, 60:40, 40:60, 20:80, and 0:100, respectively. The values denote the mean ± S.D. derived from five measurements.
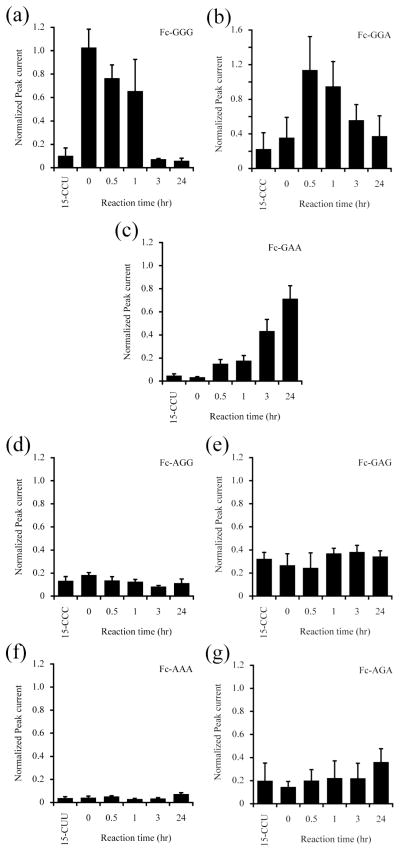
We monitored the A3G-catalyzed deamination of 15-CCC fragment using the square-wave voltammetry with a series of probe DNAs, Fc-GGG, Fc-GGA, Fc-GAA, Fc-GAG, Fc-AGG, Fc-AAA, and Fc-AGA. The full-length A3G is quite insoluble in any solution whereas the deaminase domain, i.e., CTD (residues 193–384) of A3G is soluble and has been tested its deaminase activity in vivo and in vitro.4,10,19 Therefore, we examined our method using this A3G CTD. The A3G CTD, spanning residues 193–384, was expressed and purified as described previously.19 As shown in Fig. 4a, the electrochemical peak current derived from 15-CCC/Fc-GGG hybrid was attenuated and reached to the same level of a negative control 15-CCU in the first 3 hours. Concomitantly, the Fc-GGA response to 15-CCU was enhanced in the first 30 min and then gradually weakened (Fig. 4b). Whereas no significant change was observed in the measurements using probes Fc-AGG and Fc-GAG during the reaction (Fig. 4d and 4e). These results clearly indicate that A3G protein deaminates 15-CCC fragment to yield 15-CCU exclusively. As the reaction proceeded further, the peak current derived from 15-CCU/Fc-GGA was reduced and reached to the initial level, showing that the produced 15-CCU was additionally deaminated by A3G. In addition, the current derived from 15-CUU/Fc-GAA hybrid continued to be elevated during the reaction for 24 hours (Fig. 4c). In addition, no significant change was observed in the measurements using Fc-AAA and Fc-AGA (Fig. 4f and 4g). These findings show that the 15-CUU is a final product of A3G-catalyzed deaminations, at least, under the reaction condition in this study. Taken together, A3G protein deaminates the third cytosine of the hotspot 5′-CCC-3′ to yield 5′-CCU-3′ and subsequently converts to 5′-CUU-3′. This result is consistent with the deamination assays reported previously.4,8–10 Thus, all of probe DNAs designed in this study could trace the time course of the substrate, intermediates, and product DNA, which enabled us to analyze all possible deaminations catalyzed by A3G.
Fig. 4.
Trace of A3G-catalyzed deamination. The normalized peak current was measured with probe DNAs, (a) Fc-GGG, (b) Fc-GGA, (c) Fc-GAA, (d) Fc-AGG, (e) Fc-GAG, (f) Fc-AAA, and (g) Fc-AGA. The values denote the mean ± S.D. derived from three measurements.
In conclusion, we demonstrated the sequence-specific and semiquantitative detection of DNA fragments using molecular-based electrochemical technique, and successfully traced the deamination reaction catalyzed by A3G. Our method does not require enzymatic digestion and/or amplification of the analyte DNA prior to the quantitative analysis. Additionally, we could analyze multiple steps of the A3G-catalyzed deamination by monitoring amount of substrate, intermediates, and product at the same time. In principle, any nucleotide change can be detected using the square-wave voltammetry measurement with a probe DNA designed properly. Taken together, we suggest that our method is applicable widely to a direct detection of a time-dependent nucleotide changes catalyzed by enzymes.
Supplementary Material
Acknowledgments
This work was supported by the National Institute of Health (AI073167 and GM091743 to H.M.) and the Ministry of Education, Culture, Sports Science and Technology, Japan.
Footnotes
Electronic Supplementary Information (ESI) available: Materials and methods for preparation of the A3G CTD protein and the gold electrdes modified with Fc-DNA probes, deamination reaction, and electrochemical measurements. See DOI: 10.1039/b000000x/
Contributor Information
Junya Chiba, Email: chiba@pha.u-toyama.ac.jp.
Takahide Kouno, Email: konox005@umn.edu.
Notes and references
- 1.Sheehy AM, Gaddis NC, Choi JD, Malim MH. Nature. 2002;418:646. doi: 10.1038/nature00939. [DOI] [PubMed] [Google Scholar]
- 2.Harris RS, Bishop KN, Sheehy AM, Craig HM, Petersen-Mahrt SK, Watt IN, Neuberger MS, Malim MH. Cell. 2003;113:803. doi: 10.1016/s0092-8674(03)00423-9. [DOI] [PubMed] [Google Scholar]
- 3.Albin JS, Harris RS. Expert Rev Mol Med. 2010;12:e4. doi: 10.1017/S1462399409001343. [DOI] [PMC free article] [PubMed] [Google Scholar]
- 4.Yu Q, König R, Pillai K, Chiles K, Kearney M, Palmer S, Richman D, Coffin JM, Landau NR. Nat Struct Mol Biol. 2004;11:435. doi: 10.1038/nsmb758. [DOI] [PubMed] [Google Scholar]
- 5.Jarmuz A, Chester A, Bayliss J, Gibourne J, Dunham I, Scott J, Navaratnam N. Genomics. 2002;79:285. doi: 10.1006/geno.2002.6718. [DOI] [PubMed] [Google Scholar]
- 6.MacGinnitie AJ, Anant S, Davidson NO. J Biol Chem. 1995;270:14768. [PubMed] [Google Scholar]
- 7.Navarro F, Bollman B, Chen H, König R, Yu Q, Chiles K, Landau NR. Virology. 2005;333:374. doi: 10.1016/j.virol.2005.01.011. [DOI] [PubMed] [Google Scholar]
- 8.Beale RCL, Petersen-Mahrt SK, Watt IN, Harris RS, Rada C, Neuberger MS. J Mol Biol. 2004;337:585. doi: 10.1016/j.jmb.2004.01.046. [DOI] [PubMed] [Google Scholar]
- 9.Chelico L, Pham P, Calabrese P, Goodman MF. Nat Struct Mol Biol. 2006;13:392. doi: 10.1038/nsmb1086. [DOI] [PubMed] [Google Scholar]
- 10.Furukawa A, Nagata T, Matsugami A, Habu Y, Sugiyama R, Hayashi F, Kobayashi N, Yokoyama S, Takaku H, Katahira M. EMBO J. 2009;28:440. doi: 10.1038/emboj.2008.290. [DOI] [PMC free article] [PubMed] [Google Scholar]
- 11.Nowarski R, Britan-Resich E, Shiloach T, Kotler M. Nat Struct Mol Biol. 2008;15:1059. doi: 10.1038/nsmb.1495. [DOI] [PubMed] [Google Scholar]
- 12.Drummond TG, Hill MG, Barton JK. Nat Biotechnol. 2003;21:1192. doi: 10.1038/nbt873. [DOI] [PubMed] [Google Scholar]
- 13.Hu X, Su J, Wang Y, Wang K, Ni X, Chen Z. Biosens Bioelectron. 2011;28:298. doi: 10.1016/j.bios.2011.07.035. [DOI] [PubMed] [Google Scholar]
- 14.Kato D, Goto K, Fujii S, Takatsu A, Hirono S, Niwa O. Anal Chem. 2011;83:7595. doi: 10.1021/ac201761c. [DOI] [PubMed] [Google Scholar]
- 15.Liu S, Wu P, Li W, Zhang H, Cai C. Chem Commun. 2011;47:2844. doi: 10.1039/c0cc05153e. [DOI] [PubMed] [Google Scholar]
- 16.Ostatná V, Dolinnaya N, Andreev S, Oretskaya T, Wang J, Hianik T. Bioelectrochemistry. 2005;67:205. doi: 10.1016/j.bioelechem.2004.07.008. [DOI] [PubMed] [Google Scholar]
- 17.(a) Ikeda R, Kobayashi S, Chiba J, Inouye M. Chem Eur J. 2009;15:4822. doi: 10.1002/chem.200802729. [DOI] [PubMed] [Google Scholar]; (b) Ikeda R, Kitagawa S, Chiba J, Inouye M. Chem Eur J. 2009;15:7048. doi: 10.1002/chem.200900368. [DOI] [PubMed] [Google Scholar]; (c) Chiba J, Akaishi A, Ikeda R, Inouye M. Chem Commun. 2010;46:7563. doi: 10.1039/c0cc02371j. [DOI] [PubMed] [Google Scholar]
- 18.(a) Anne A, Bouchardon A, Moiroux J. J Am Chem Soc. 2003;125:1112. doi: 10.1021/ja028640k. [DOI] [PubMed] [Google Scholar]; (b) Anne A, Demaille C. J Am Chem Soc. 2006;128:542. doi: 10.1021/ja055112a. [DOI] [PubMed] [Google Scholar]; (c) Lubin AA, Plaxco KW. Acc Chem Res. 2010;43:496. doi: 10.1021/ar900165x. [DOI] [PMC free article] [PubMed] [Google Scholar]
- 19.Chen KM, Harjes E, Gross PJ, Fahmy A, Lu Y, Shindo K, Harris RS, Matsuo H. Nature. 2008;452:116. doi: 10.1038/nature06638. [DOI] [PubMed] [Google Scholar]
Associated Data
This section collects any data citations, data availability statements, or supplementary materials included in this article.


