

Abstract
The Golgi apparatus has many important physiological functions, including sorting of secretory cargo and biosynthesis of complex glycans. These functions depend on the intricate and compartmentalized organization of the Golgi apparatus. To investigate the mechanisms that regulate Golgi architecture, we developed a quantitative morphological assay using three different Golgi compartment markers and quantitative image analysis, and performed a kinome- and phosphatome-wide RNAi screen in HeLa cells. Depletion of 159 signaling genes, nearly 20% of genes assayed, induced strong and varied perturbations in Golgi morphology. Using bioinformatics data, a large regulatory network could be constructed. Specific subnetworks are involved in phosphoinositides regulation, acto-myosin dynamics and mitogen activated protein kinase signaling. Most gene depletion also affected Golgi functions, in particular glycan biosynthesis, suggesting that signaling cascades can control glycosylation directly at the Golgi level. Our results provide a genetic overview of the signaling pathways that control the Golgi apparatus in human cells.
Keywords: glycosylation, Golgi, imaging, RNAi screening, signaling
Introduction
The Golgi apparatus is part of the secretory apparatus of all eukaryotic cells (Field and Dacks, 2009). This ubiquitous organelle has the critical function of sorting lipids, membrane-associated and lumenal proteins to their final destinations. The Golgi also carries out a host of post-translational modifications, most prominently the addition of glycans, which occurs through a multi-step biosynthetic process. Glycans have a critical part in the function of glycoproteins and glycolipids.
The basic structural unit of the Golgi is the cisterna, a flattened, membrane-bound compartment. In mammalian cells, four to seven cisternae are closely stacked together, resembling a pile of pancakes. On each face of the pile, stacks are flanked by a loose network of vesicles and tubules called the cis- and trans-Golgi networks (CGN and TGN). On their side, stacks are loosely connected with other stacks through tubular structures. Together, these interconnected stacks form the Golgi apparatus. In mammalian fibroblasts, this apparatus is localized near the centrosome and the nucleus (Shorter and Warren, 2002; Lowe, 2011).
The remarkable structure of the mammalian Golgi apparatus is relatively unique and a recent evolution. For example, plant and insect cells contain stacks not connected together but distributed throughout the cytoplasm. S. cerevisiae cells do not have stacks, their cisternae not being connected together.
While the reasons for this evolution are not entirely clear, it is tempting to speculate that the increase in structural complexity is linked to the parallel increase in the physiological functions carried out by this organelle. For example, glycans are much more diverse and complex in mammals than in simpler eukaryotes such as yeast (Bishop and Gagneux, 2007; Boscher et al, 2011). As glycans are the main products of the biosynthetic activity of the Golgi, it is possible that evolution of both Golgi structure and glycans are causally linked.
It is indeed well accepted that Golgi organization is essential for glycan synthesis. By contrast with other biopolymers, the synthesis of glycans is not template driven but dependent on the combined action of glycosyltransferases and glycosidases, aka glycosylation enzymes. Most of these enzymes function in specific compartments of the secretory apparatus, either the ER or a subset of Golgi cisternae (Dunphy et al, 1981; Freeze, 2006). In fact, most glycosylation enzymes are exquisitely distributed between cisternae (de Graffenried and Bertozzi, 2004) and evidence indicate that this is critical for the synthesis of glycans (Grabenhorst and Conradt, 1999; Stanley, 2011). Therefore, the glycans present at the surface of a given cell are the products of both the set of glycosylation enzymes expressed and their specific enzymatic compartmentalization.
Additionally, in recent years, it has become clear that the mammalian Golgi apparatus is involved in many other functions: the regulation of mitosis (Colanzi and Corda, 2007), cell migration (Yadav et al, 2009), apoptosis (Hicks and Machamer, 2005), the microtubule cytoskeleton (Efimov et al, 2007) and signal transduction (Farhan and Rabouille, 2011). Again, for these functions, Golgi organization is important. For example, perinuclear localization is probably essential for the control of cell migration (Yadav et al, 2009) and the regulation of the microtubule network (Efimov et al, 2007). The inter-stack connections seem to have a critical role in regulating the entry into mitosis (Colanzi and Corda, 2007).
In the last 10 years, regulatory mechanisms that control the organization and function of the Golgi apparatus have been discovered (Farhan et al, 2010; Mayinger, 2011). For example, ERK controls the re-orientation of the Golgi apparatus toward the leading edge during cell migration (Bisel et al, 2008), while PKD controls cargo flux out of the TGN (Liljedahl et al, 2001; Bossard et al, 2007). The regulation of glycosylation at the Golgi remains poorly understood. A recent report highlights that O-GalNAc glycan synthesis can be regulated through the relocalization of glycosylation enzymes from the Golgi to the ER. This relocation event is stimulated by growth factors such as EGF and mediated by Src tyrosine kinase (Gill et al, 2010, 2011).
These examples illustrate that the complex structure of the Golgi apparatus is likely under multiple regulatory controls. In order to identify the genetic basis of these controls in mammalian cells, RNAi screening is a method of choice. To assess Golgi morphology, high-throughput microscopy imaging is required. However, probing cisternal organization can be challenging by optical microscopy. Indeed, adjacent cisternae can be as close as 50 nm apart and the cis-to-trans dimension of Golgi stacks range between 200 and 400 nm (Shorter and Warren, 2002). However, simultaneous imaging and pattern comparison of different cisternae-specific markers could bypass this limitation and detect cisternal-specific effects.
In this study, we report the systematic analysis of the effect of kinases, phosphatases and related genes on the Golgi organization using markers of three different compartments of the Golgi apparatus. Surprisingly, ∼20% of the 948 signaling genes tested have a significant impact on Golgi organization. The morphological variety resulting from these knockdowns suggests that multiple regulatory mechanisms are at work. Several genes affected only one of the Golgi markers, indicating that they regulate Golgi subcompartments. Most of the knockdowns affected not only the organization of the Golgi but also its physiology, in particular glycan biosynthesis. Finally, several major regulators are cell surface membrane receptors and treatment with corresponding growth factors indicates a direct impact of extracellular signals on Golgi physiology.
In sum, we describe a collection of signaling genes having diverse effects on the organization of the Golgi apparatus, protein secretion and glycan biosynthesis, suggesting that multiple aspects of Golgi physiology are under the control of signal transduction cascades.
Results
A pilot siRNA screen on membrane trafficking regulators reveals three main Golgi morphologies
To assess Golgi organization and cisternal stacking, we used a different marker for each of the three main Golgi compartments. Staining with Helix pomatia lectin (HPL) was used as a cis compartment marker. HPL binds specifically terminal GalNAc residues added to cargo proteins by GalNAc-Ts, the O-GalNAc glycosylation initiation enzymes (Roth et al, 1994). Because GalNAc is rapidly modified by the galactosyltransferase C1GalT in subsequent Golgi compartments, HPL staining has been shown to be restricted to the cis Golgi (Pavelka and Ellinger, 1985). The medial Golgi was marked by expressing stably in HeLa cells a GFP fused to the first 100 amino acids of mannosidase II as targeting sequence (Duran et al, 2008). Staining for TGN46 revealed the trans Golgi and TGN. Nuclear DNA staining was used to identify individual cells. Under physiological conditions, all three markers co-localize very significantly at the immunofluorescence level using a × 100 objective. This is consistent with the resolution limit of conventional microscopy, which is unable to distinguish between cisternae (Figure 1A). However, despite this co-localization in normal cells, the three proteins have, in fact, different dynamics and compartmental distributions. On the cis side of the Golgi complex, HPL reveals the activity of GalNacTs, which cycle to the ER independently of other Golgi enzymes (Gill et al, 2010). While MannII-GFP is a medial Golgi marker expected to cycle at a slow rate between the Golgi complex and the ER (Storrie et al, 1998), TGN46 is distributed to the TGN compartment and has been reported to traffic continuously between the plasma membrane and the endosomes (Ghosh et al, 1998).
Figure 1.

An imaging-based screen to identify Golgi organization phenotypes. (A) HeLa MannII-GFP (medial Golgi) cells were stained with cis Golgi marker HPL and trans Golgi marker TGN46. Compartments co-localized extensively even at × 100 magnification. Scale bar: 10 μm. (B) Schematic overview of the screening process. A pilot screen of 63 genes and 4 drug treatments was imaged using a × 20 objective and visually screened for changes in Golgi organization. Three Golgi phenotypes (diffuse, fragmented and condensed) were identified and used to train a preliminary Support Vector Machine (SVM) for quantitative scoring of treatments. Images of selected genes from the signaling genes screen (see Supplementary Figure S2A) were used to refine SVM training and obtain a final score. (C) Examples of the three reference phenotypes. STX5 knockdown induces a diffuse phenotype specifically for the cis Golgi while STX3 and SNAP47 knockdown induces a fragmented and condensed Golgi in all three compartments, respectively. Scale bar: 30 μm. (D) Workflow of the siRNA screen. Screen plates were loaded with controls for the three phenotypes for quality control in each plate. GFP knockdown and STX5 knockdown demonstrate homogeneous gene depletions in all wells seeded with the siRNAs. Scale bar: 200 μm.
In order to explore the range of Golgi phenotypes that could be observed, we screened a custom-designed set of 63 known regulators of membrane traffic (Figure 1B). These regulators, such as SNAREs and Rabs, act in vesicle budding and fusion (Supplementary Figure S1A and B). We also tested drugs such as brefeldin A (BFA), nocodazole, monensin and latrunculin B, which are known to perturb the Golgi in different ways (Supplementary Figure S1C). For each perturbation, 2000 cells were reverse transfected with siRNAs spotted in 384-well imaging plates. Seventy-two hours after siRNA transfection, some untransfected wells were treated with the drugs for 1 h before fixing and staining for the nucleus, cis and trans Golgi compartments. The cells were then imaged using high-throughput confocal microscopy. Visual inspections of the cells revealed that depletion of several of these genes perturbed Golgi morphology. We defined three major classes of perturbed Golgi morphology that were visually identifiable and labeled them as ‘diffuse’, ‘fragmented’ and ‘condensed’ (Figure 1C). Diffuse Golgi morphology is typically observed after BFA treatment. This morphology usually reflects the relocation of Golgi markers to the ER (Dinter and Berger, 1998). With a fragmented Golgi, granular structures are still visible, but they appear no longer connected in a perinuclear half-moon shape. Fragmentation has been reported in multiple studies and occurs for example after nocodazole or monensin treatment (Dinter and Berger, 1998; Thyberg and Moskalewski, 1999). Fragmentation is sometimes attributed to a loss of the connections between Golgi stacks (Puthenveedu et al, 2006; Duran et al, 2008). With a condensed morphology, the Golgi usually appears compact and rounded in a perinuclear location. This morphology has been previously reported to occur upon latrunculin treatment (Valderrama et al, 2001) and upon various genetic perturbations (Bard et al, 2003; Young et al, 2005). Because of their prototypical effects on the Golgi apparatus, we selected three SNAREs to serve as controls for larger scale screens: Syntaxin 3 with a fragmented morphology, SNAP47 with a condensed morphology and Syntaxin 5 with a marked diffuse distribution for the cis marker HPL but almost unaffected MannII-GFP and TGN46 stainings (Figure 1C). Transfection efficiency was >80% of cells as evaluated by the reduction of MannII-GFP levels and the increase in HPL staining in cells after STX5 depletion (Figure 1D).
Golgi phenotypes can be automatically classified using nine phenotypic features
In order to quantify and classify the various Golgi phenotypes induced by gene knockdown, we developed an automated image analysis and classification approach. To obtain phenotypic analysis at the individual cell level, nuclei were segmented based on Hoechst DNA staining (Figure 2A). A cell territory was defined around the mass center of each nucleus (Figure 2B). Cell image features were then extracted for the nucleus and the three Golgi markers’ staining (Figure 2C and D). We found that a single image feature is insufficient to capture nuclei or Golgi phenotypes, therefore, we used Support Vector Machine (SVM) machine learning (Boser et al, 1992) to find combinations of image features that could discriminate phenotypes (see example in Supplementary Figure S2D). A first SVM was trained to recognize and exclude out-of-focus, badly segmented and mitotic cells (Figure 2E). Another SVM was thereafter trained to recognize the three types of morphology, diffuse, fragmented and condensed, using reference phenotypes that were visually detected in the pilot screen (Figure 2F; Supplementary Figure S2A). We found that selecting the 5 most discriminative image features from the pool of 22 computed features resulted in better discrimination (Supplementary Figure S2D–G). The SVM training was refined and reinforced with cell images from the signaling genes screen (Figure 1B; Supplementary Figure S2A). The Golgi morphology of individual cells was described by the SVM classifier as a set of nine binary phenotypic features, ranging from cis Condensed to trans Diffuse (Figure 2G; Supplementary Figure S2). At the gene level, the percentage of analyzed cells positive for each of the nine phenotypic features was computed (Figure 2H). As a result, each gene was assigned a signature with nine phenotypic scores. This signature is represented in a graphical manner by a color-coded pie chart (Figure 2I). Correlation analysis of the screens’ phenotypes indicated that the nine scores are non-redundant (see below and Figure 3E).
Figure 2.

An automated image analysis method for Golgi phenotypic classification. (A) Cells were stained for the nucleus and Golgi compartments and (B) identified based on their nuclear staining (colored masks). (C) Cell boundaries were defined from the centers of mass of the nuclei. (D) Multiple image features for each channel of each cell were extracted. (E) Mitotic, apoptotic or closely apposed cells were detected by a specific SVM and discarded from further analysis. (F) During SVM training, reference images for each phenotypic feature (see Supplementary Figure S2A) were used to select the five most discriminative image features to derive SVM functions that define phenotypic boundaries in this five-dimensional space. (G) To quantify Golgi phenotypes in test images, the three SVM functions are applied to each of the three Golgi staining: cis (shown), medial and trans, to determine phenotypic features. These features are binary (1=yes or 0=no) for individual cells and exclusive within one channel. For instance, the cis Golgi of one cell can only be fragmented, diffuse, condensed or normal. Individual cells are eventually attributed nine binary phenotypic features (PF), three for each of the three channels. (H) Illustration of phenotypic score calculation for a gene. Each of the nine phenotypic scores for a gene corresponds to the fraction of analyzed cells with the particular phenotypic feature. (I) The nine morphological scores constitute a phenotypic signature displayed in a color-coded pie-chart. White sectors represent cells with normal Golgi morphology.
Figure 3.

A large proportion of signaling genes regulate Golgi structure. (A) Schematic workflow of the signaling genes screen. Gene knockdowns having a total cell number of <200 were excluded from the final SVM classification. Thresholds for primary hit identification were defined using the derivative method for each of the nine phenotypic features. Hits were re-tested with the four individual siRNAs present in the pool (deconvoluted siRNA) that was used in the screen (see Supplementary Figure S4A), resulting in 159 validated hits, which were further screened for glycosylation (lectin intensity assay; Figure 8) and secretion (Met-luc secretion assay; Figure 7) changes. (B) Phenotypic scores of signaling genes (red) compared with membrane trafficking genes (blue) and control wells (gray). (C) Clustering of 181 hits using the nine phenotypic features. The range of phenotypic scores is represented by green (high score) to red (low score) in the heatmap. Six major morphological groups were identified and color-coded: condensed (blue), trans diffuse (pink), medial diffuse (purple), cis and trans diffuse (red), fragmented (yellow), diffuse and fragmented (orange). Enlarged version can be viewed in Supplementary Figure S4C. (D) Corresponding images of the genes highlighted in colored rectangles in (C). IGF1R depletion (blue) results in all Golgi compartments condensed; SCYL3 (pink) in strongly diffuse trans compartment; ITPKA (yellow) in all Golgi compartments fragmented; PIK4CA (orange) in a mix of diffuse and fragmented for all compartments. Scale bar: 30 μm. (E) Correlation plots of the nine phenotypic features. CD, MD, TD, CF, MF, TF, CC, MC and TC refer to cis diffuse, medial diffuse, trans diffuse, cis fragmented, medial fragmented, trans fragmented, cis condensed, medial condensed, and trans condensed, respectively. (F) Principal component analysis (PCA) of the nine phenotypic features. Color coding corresponds to the six morphological groups defined in (C).
The performance of the SVM classifier was bench-marked against three individuals at the cellular level with a representative set of 300 cells and found to be comparable to human classification (Supplementary Figure S2B). At the gene level, we compared SVM and experimenter classification with 120 wells displaying different phenotypes and found >90% agreement (Supplementary Figure S2C), indicating that our automated image analysis faithfully reproduces a human expert evaluation with the added benefit of quantification.
159 signaling genes regulate Golgi organization
To probe Golgi regulatory mechanisms, we next tested 948 signaling genes (Figure 3A). The morphological analysis gave highly reproducible results between the two replicates (Supplementary Figure S3A). To avoid quantifying effects associated with apoptosis or cell necrosis, we discarded genes with a significant effect on cell number (<200 nuclei detected, while average number for hit genes is 526) (Figure 3A). Furthermore, we found no correlation between any of the phenotypic scores with cell number (Supplementary Figure S3B), arguing against any bias induced by cell viability issues. Similarly, an absence of correlation between the intensities of the Golgi compartments and cell counts indicated that cell number did not affect staining intensities (Supplementary Figure S3C). Significance thresholds for each of the nine morphological features were determined based on the first derivative of ranked data as described in Moreau et al (2011). Each threshold corresponds to a z-score of 2 or more. Individual examination of the images confirmed that the 181 signaling genes classified as hits induced a visually significant perturbation of at least one Golgi compartment. We next tested if the phenotypes scored could be reproduced by at least two independent siRNAs out of the four used in the original pools (Supplementary Figure S4A). This validated 159 hits for which the possibility of off-target effect is greatly reduced (Figure 3A).
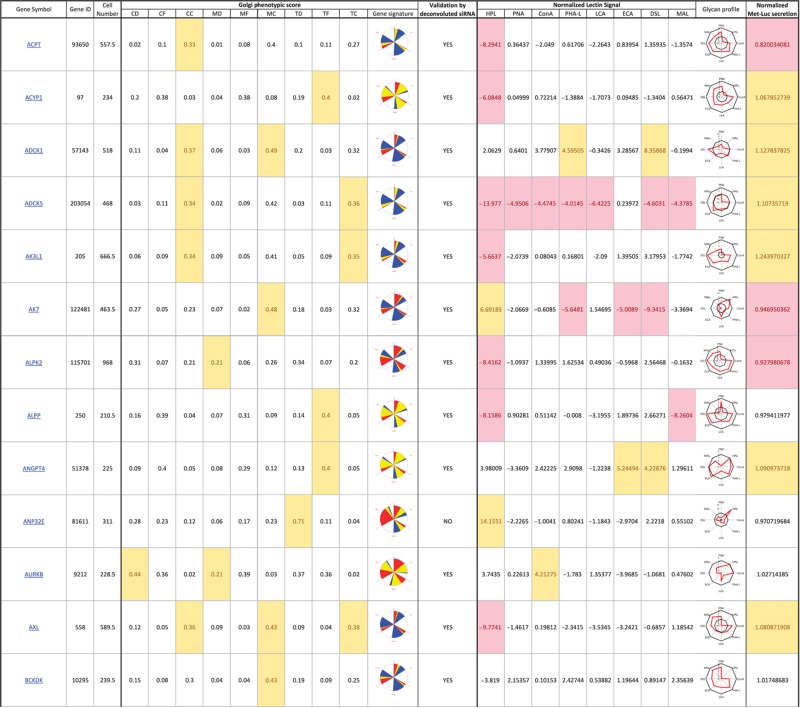
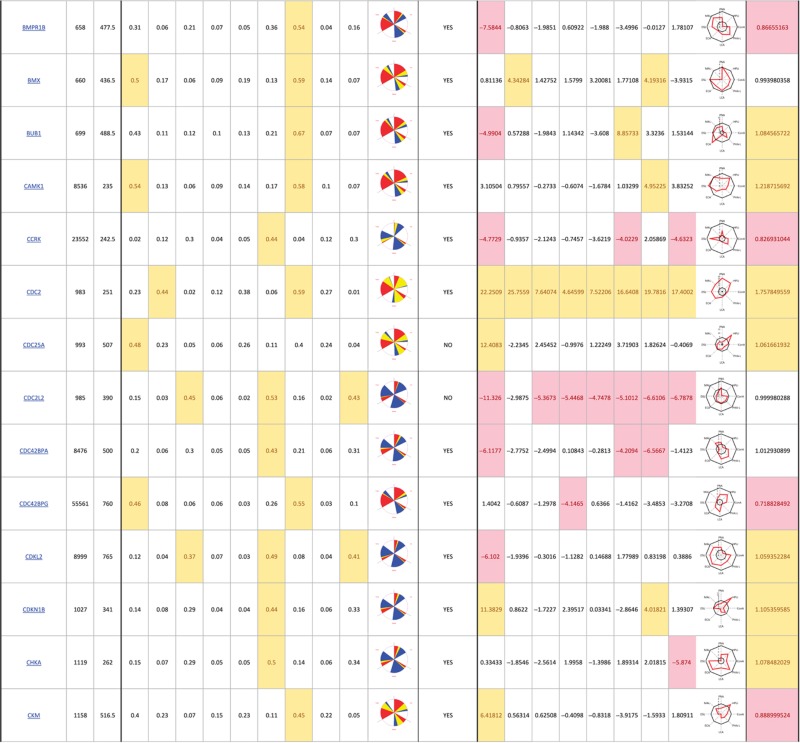
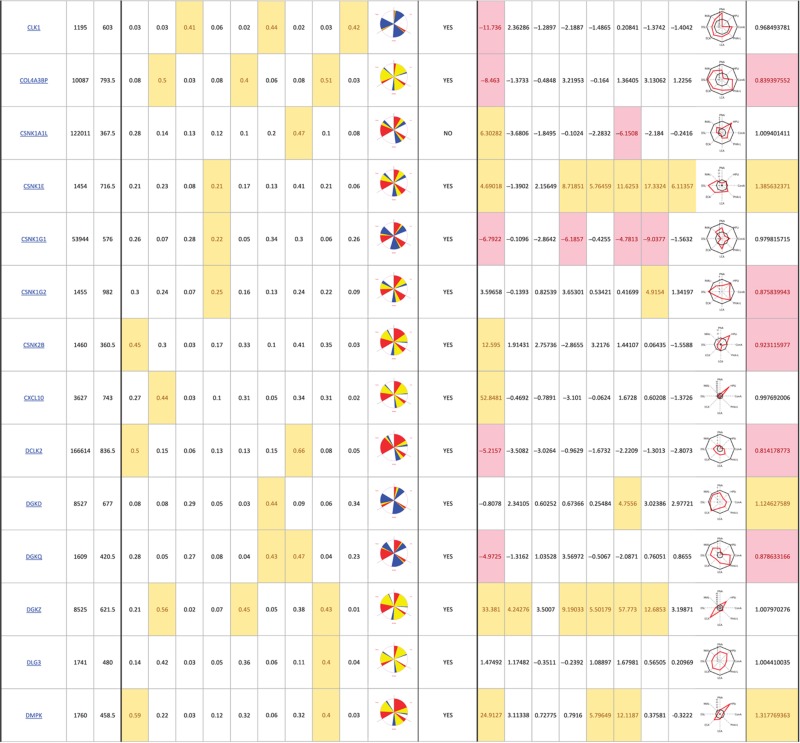
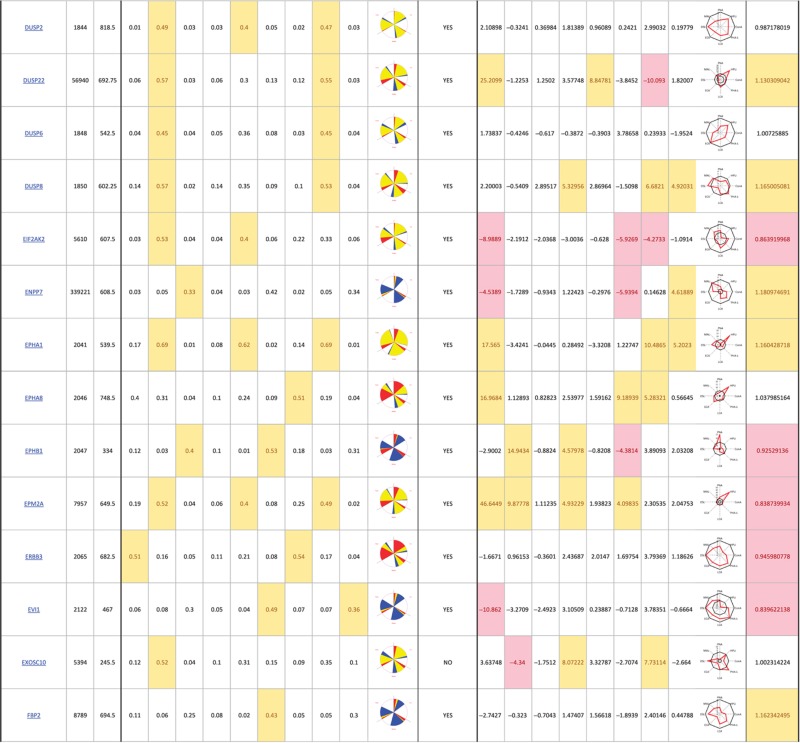
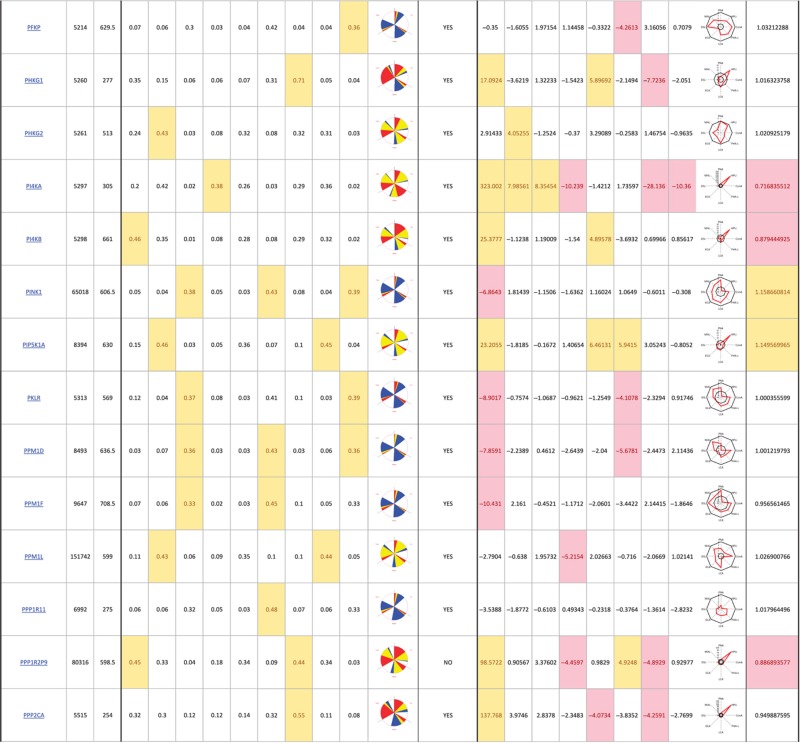
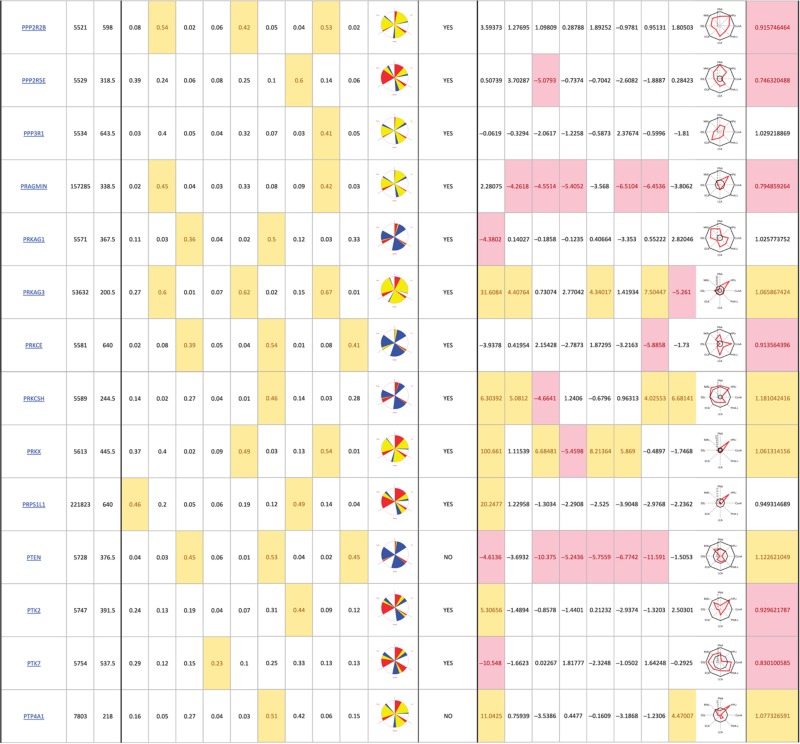
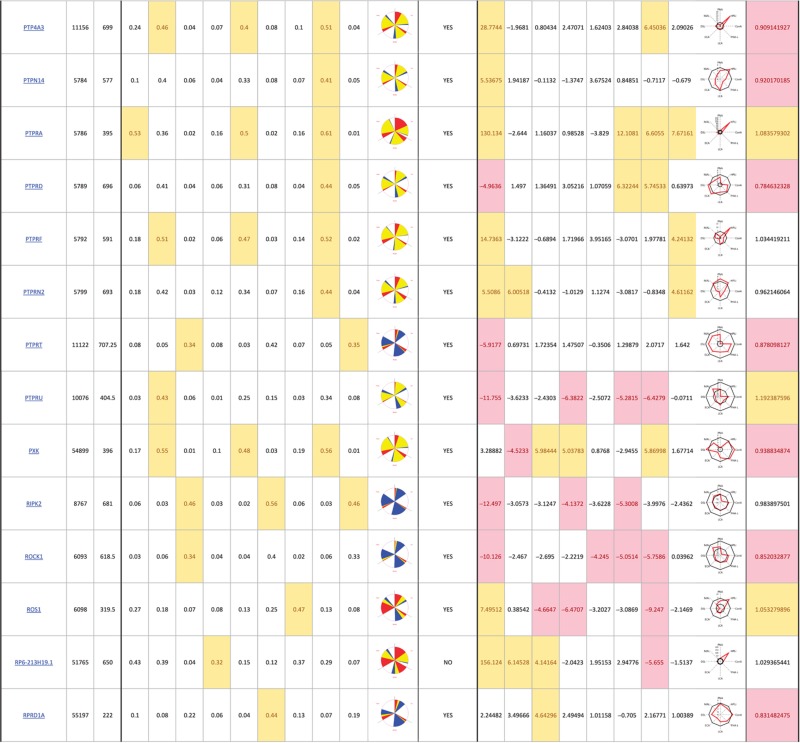
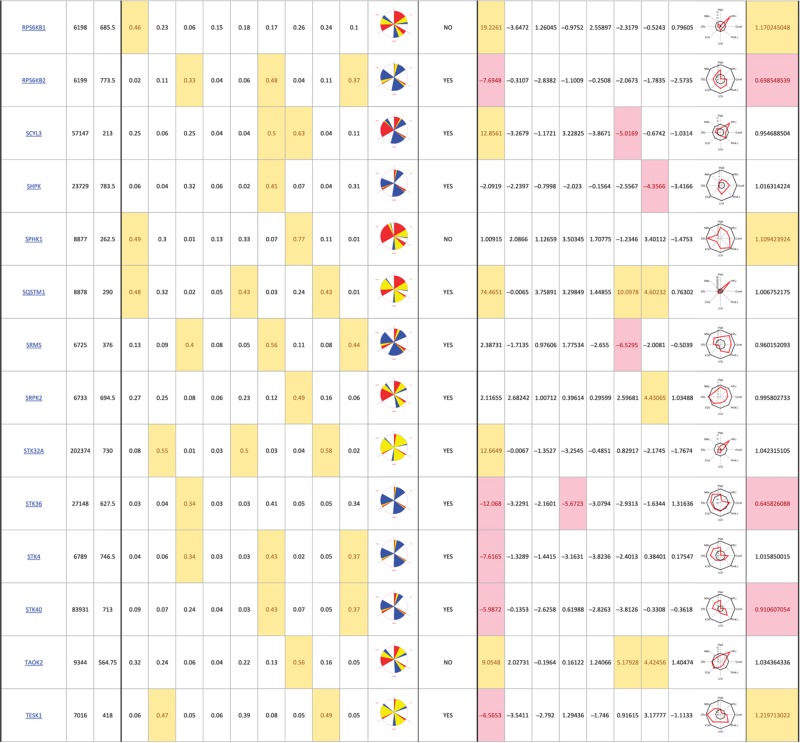
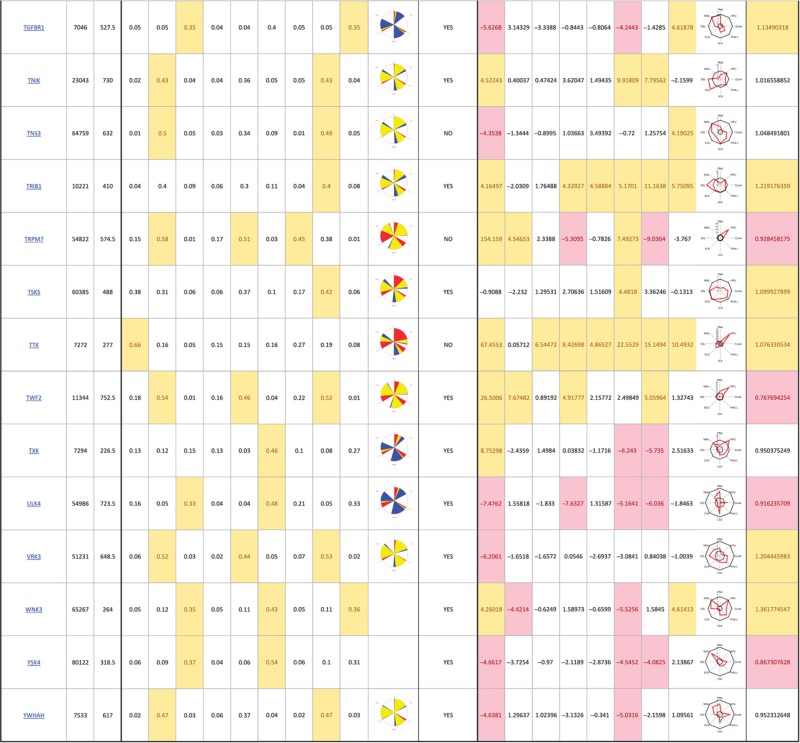
The primary screen revealed that numerous signaling genes are essential for the maintenance of normal Golgi organization (Table I, see pages 18–30). With our analysis method, the relative intensities of morphological perturbations are encoded in the percentage of cells classified as perturbed. Comparing the data from the membrane traffic and signaling genes screen, it is apparent that depletions of several signaling genes have an effect on the Golgi more pronounced than most well-known regulators such as the SNAREs (Figure 3B).
Table 1. 181 primary hits with 9 Golgi morphology scores and corresponding phenotypic signature pictogram, deconvolution validation status, 8 lectin-binding scores and corresponding glycan profile pictogram, and Met-Luc secretion score.
|
The perturbations of Golgi phenotypes observed were varied, ranging from perturbations specific for one cisternal marker mostly (SCYL3, trans Golgi) to perturbations affecting all three markers with a condensed (IGF1R), fragmented (ITPKA) or diffuse (PIK4CA) appearance (Figure 3C and D). Consistently and in accordance with results in the pilot screen, the morphological scores of each of the three Golgi markers did not correlate between each other for the diffuse morphology (Figure 3E). By contrast, most treatments resulting in fragmented or condensed phenotypes showed similar results for the three Golgi markers, which resulted in high correlation for these features in the screen (for example, cis fragmented and Medial fragmented: correlation coefficient of 0.95) (Figure 3E).
Diffuse morphology is reminiscent of an ER pattern, suggesting that the marker displaying this morphology has been relocalized at least partially to the ER. When we co-stained some of the diffuse cis Golgi hits with the ER marker calnexin, we could observe and quantify significant increase in co-localization (Supplementary Figure S3D and E). This indicates that the glycosylation enzymes GalNacTs, whose activity are revealed by HPL, have been relocalized to the ER. Interestingly, depletions of several genes induced specifically GalNacTs but not Mann-II-GFP ER relocation (Figure 3C). This is consistent with the notion that the trafficking of different Golgi enzymes is independently regulated, as we reported recently (Gill et al, 2010).
When the phenotypes were grouped using hierarchical clustering using the nine phenotypic features, six major groups were identified (Figure 3C). The two dominant groups display condensed Golgi (61 genes) or fragmented Golgi (53 genes) for all markers (Figure 3C). For these phenotypes, the three markers co-localize as much as in untreated cells, either in fragments or in a perinuclear condensed structure. A reduction of the nine morphological features in two dimensions by principal component analysis (PCA) resulted in these two groups appearing relatively compact (Figure 3F). In the other four groups (67 genes total), the phenotypes were at least partially diffuse and were more heterogeneous. Most genes presented a varied mix of fragmented and diffuse phenotypes, consequently they were more spread in the two-dimensional PCA phenotypic space (Figure 3F). For these phenotypic groups, staining of the three Golgi markers is generally less well co-localized than in the control (see for example SCYL3 in Figure 3D). Because each marker is specific for a different compartment, these phenotypes suggest a perturbation of cisternal organization. By contrast, condensed and fragmented phenotypes suggest rather an alteration of the network organization of the Golgi stacks, within which cisternal organization is maintained. By extension, the high number of genes in these two groups suggests that many signaling pathways affect the overall network structure of the Golgi rather than its cisternal organization.
A large signaling network regulates Golgi apparatus organization
The number of signaling gene depletions affecting Golgi organization is large. In fact, mapping the 111 hit kinases (out of 181 primary hits) from the screen on a phylogenetic tree of kinases (Manning et al, 2002) reveals that all the major families are involved in Golgi regulation (Figure 4A). If these enzymes act directly on the organelle, then one could expect a high number of phosphoproteins associated with Golgi membranes. To test this, we conducted a systematic search for proteins with a Gene Ontology (GO) Cellular Component (CC) containing the term ‘Golgi’ and found 854 proteins.
Figure 4.

Protein network analysis of hits reveals multiple connections between signaling molecules and Golgi proteins. (A) A map of 111 hit kinases on the phylogenetic tree of kinases. (B) Step-wise construction of the Golgi regulatory network. In all, 413 of the 854 proteins localized at the Golgi in the GO database are also found in the Phosphosite plus database. A functional filter using Biological Process GO yields 135 phosphorylated proteins present at the Golgi and functioning in membrane trafficking. Using protein–protein interaction information from 3 databases (String, Pathway Studio and HPRD), 37 of these Golgi Proteins were reported to have a direct interaction with 86 hits. (C) A preliminary map of the Golgi regulatory network arranged based on available Cellular Compartment GO for all 123 genes.
In the PhosphositePlus database, almost half (413) of these Golgi-associated proteins were found to carry at least one phosphorylated residue (Figure 4B). Additionally, to ensure that the network generated would be as stringent as possible, the additional filter of ‘membrane trafficking’ GO Biological Process (BP) term was applied, resulting in 135 out of 413 proteins being retained. Hence, 135 proteins are annotated in databases to be localized at the Golgi, to be phosphorylated and to regulate membrane traffic. We next evaluated how hits in our morphology screen could be associated with these 135 Golgi phosphoproteins. Using only experimental evidence in the STRING database, 37 are reported to interact with 86 of the hits found in our morphological screen. We used these interactions and the available GO Cellular Compartment annotations to draw a map of the Golgi regulatory network (Figure 4C). These results suggest that the effects that we observe are due to direct regulation through phosphorylation of Golgi-associated proteins.
New players in the Golgi phosphoinositide regulatory network
Phosphoinositides are known to regulate membrane dynamics at the Golgi level (Vicinanza et al, 2008). Phosphatidylinositol 4-phosphate (PIP4) in particular is enriched in Golgi membranes and is known to regulate multiple molecular events (De Matteis et al, 2005; Figure 5A). Depletion of both PIP4 kinases PIK4CA and PIK4CB, which phosphorylate PI, resulted in strong perturbations of Golgi organization. The lack of compensation and differences in phenotype suggest that both kinases regulate different pools of PIP4 as previously suggested (Weixel et al, 2005; Santiago-Tirado and Bretscher, 2011). Specifically, PIK4CA appears to regulate PIP4 at the level of ER exit sites as recently shown (Farhan et al, 2008), while PIK4CB appears to function at the Golgi itself (Godi et al, 1999). PIP4 can be phosphorylated into PI4,5P and it has been suggested that PI4,5P may have an important role in Golgi membrane dynamics, but the kinase responsible has remained unknown (Jones, 2000; Siddhanta et al, 2000; Sweeney, 2002). Here, we found that depletion of PIP5K1A, which produces PI4,5P, also resulted in a significant fragmentation of the Golgi (Figure 5A). We also observed a condensed Golgi phenotype upon depletion of PTEN, a phosphatase with specificity for the position 3 of PI3,4,5P (Figure 5A), consistent with a previous report that localized PTEN2 at the Golgi (Wu et al, 2001). Previous reports have also suggested a role for PI3,4,5P at the Golgi, identifying multiple possible effectors (Roth, 2004; De Matteis et al, 2005; Lindmo and Stenmark, 2006). A class I PI3 kinase, PIK3CA, has recently been found to localize at the TGN in macrophages and to be important for the release of cytokine-containing carriers at the TGN (Low et al, 2010). Depletion of the same kinase PIK3CA in our screen induced mild Golgi fragmentation, albeit below our threshold, suggesting that its role at the TGN is not limited to macrophages. Finally, we have also integrated in this subnetwork the diacylglycerol (DAG) kinase zeta (DGKZ), which produces a strong phenotype. Indeed, PI4,5P can be converted into DAG by the phospholipases C, PLCB2 and PLCE, which both have been localized at the Golgi (Blayney et al, 1998; Jin, 2001). These results demonstrate the screen’s capacity to identify known players and suggest novel regulators of the PI network operating at the Golgi.
Figure 5.

Various subnetworks of signaling molecules that regulate Golgi structure. (A) Phosphatidylinositol (PI) network regulators identified in the screen. Depletion of either PIK4CA or PIK4CB resulted in a highly diffuse and fragmented Golgi. PIP4 is possibly converted into PI4,5P by PIP5K1A as indicated by fragmentation of the Golgi upon knockdown. Depletion of PTEN, the phosphatase for PI3,4,5P, exhibited a condensed Golgi phenotype. Diacylglycerol (DAG), a downstream product of PI4,5P is converted into phosphatidic acid (PA) by DGKZ whose knockdown resulted in a fragmented Golgi. Different PI species can recruit various membrane trafficking effectors (green nodes). (B) Regulators of the actomyosin machinery also regulate Golgi organization. ROCK1 depletion resulted in a compact Golgi while PAK1 depletion resulted in a fragmented Golgi. (C) Link between cell-cycle kinases and trans Golgi-plasma membrane trafficking. Knockdown of mitotic checkpoint kinase BUB1 and cell-cycle control kinase CDC2 resulted in a specifically trans diffuse Golgi. (D) Multiple players from different tiers of the MAP kinase signaling pathway appear as hits in our screen and the screen by Farhan et al (2010), highlighting the importance of MAP kinases in the regulation of the secretory system. Tiers of the MAP kinase pathway are indicated on the left and the four main MAP kinase pathways are indicated at the top. Dark green nodes and light green nodes represent phosphorylated Golgi proteins and Golgi proteins, respectively. Orange nodes represent hit genes from Farhan et al (2010). Grey nodes represent non-hit genes in both screens. Red arrows indicate phosphorylation. Black arrows indicate non-phosphorylation based activation. Dashed lines indicate recruitment. Purple lines indicate confirmed protein–protein interaction curated in HPRD database. Black lines indicate protein–protein interaction based on the STRING database.
Regulators of acto-myosin dynamics at the Golgi apparatus
Another network of Golgi regulation appears to revolve around actin dynamics. A condensed Golgi phenotype was induced by depletion of the protein kinase ROCK1 and also, to a lesser extent, of ROCK2 (Figure 5B). Consistently, expression of an active form of ROCK1 was previously reported to induce Golgi fragmentation (Orlando and Pittman, 2006). In non-muscle cells, ROCKs regulate actomyosin contractility in two ways: phosphorylation of the regulatory myosin light chain (MLC) of motor protein myosin II and phosphorylation and activation of the LIMK1 and LIMK2 kinases, that in turn phosphorylate and inhibit the actin depolymerizing protein cofilin (CFL1). Interestingly, all these effectors have been localized at the Golgi complex (Foletta et al, 2004). It was reported recently that myosin II regulates the fission of transport carriers at the Golgi (Miserey-Lenkei et al, 2010). Regulation of actin dynamics by cofilin was also reported to regulate Golgi organization and export from the TGN (Bard et al, 2006; Salvarezza et al, 2009; von Blume et al, 2009). Treatment by Latrunculin and other drugs able to block actin polymerization have been reported to induce a compaction of the Golgi apparatus (Egea et al, 2006). Surprisingly, we also found that depletion of PAK1 induces a marked fragmented phenotype (Figure 5B). This is consistent with previous reports of PAK1 inhibition of actomyosin contractility by inactivation of MLCK (Sanders et al, 1999) and by phosphorylation and inactivation of myosin II heavy chain (MHC) (Even-Faitelson et al, 2005). Treatment of cells with IPA3, a PAK1 inhibitor (Deacon et al, 2008), also induced fragmentation of the Golgi (Supplementary Figure S5A) after 6 h of treatment. The effect was dose dependent (Supplementary Figure S5B). In agreement with our model of opposite action of ROCK1 and PAK1 at the Golgi, IPA3 could rescue at least partially the effect of ROCK1 knockdown while having no effect on PAK1-depleted cells (Supplementary Figure S5C).
Together, these data suggest that ROCK1 and PAK1 exert antagonistic forces on the structure of the Golgi apparatus through actomyosin processes. These processes are proposed to be required for the generation of transport carriers at the Golgi (Miserey-Lenkei et al, 2010). Consistent with this model, depletion of ROCK1 induces a significant reduction of constitutive secretion as measured by a secreted Metridia luciferase (Met-Luc) assay (Supplementary Figure S8).
A link between cell-cycle regulators and the TGN
Depletion of the mitotic checkpoint kinase BUB1 resulted in a strong diffuse morphology affecting more specifically the trans Golgi marker. A previous report indicated that BUB1 interacts with the β chains of the four heterotrimeric adaptor complexes AP1, AP2, AP3 and AP4 (Cayrol et al, 2002). AP complexes act at the TGN to promote sorting of cargo proteins into clathrin-coated transport carriers (Simmen et al, 2002). Phosphorylation of AP complexes has been proposed to regulate their interaction with clathrin coat and/or sorting signals on cargo proteins (Fingerhut et al, 2001). Consistently, the yeast homolog of BUB1, Bub1p, has been found to interact with the human Nexin-1 homolog, Vps5, which is required for trafficking from the prevacuolar/late endosomal compartments back to the Golgi apparatus (Vollert, 2004).
Consistent with a direct role of BUB1 at the TGN, two BUB1 interactors (Kanehisa et al, 2010), the CLIP-associated protein (CLASP) and microtubule-associated protein (MAPRE1) are Golgi-associated proteins, and have roles in nucleation and stabilization of a subset of microtubules that originate from the TGN (Efimov et al, 2007). These TGN-derived microtubules are required for maintaining Golgi structure, directional post-Golgi trafficking and cell migration (Miller et al, 2009).
Another key mitotic kinase, CDC2, alias Cdk1, known to regulate BUB1 (Qi et al, 2006), also results in a marked perturbation of the TGN. We hypothesize therefore that both kinases may function together at the TGN. Cdk1 has previously been reported to phosphorylate GRASP65 during mitosis (Wang et al, 2003). However, it is not clear whether this is related to the phenotype we observe, as GRASP65 is not known to localize at the TGN. Overall, this subnetwork suggests an intriguing link between cell-cycle kinases and post-Golgi traffic (Figure 5C) that may have to do with the dramatic changes in cell morphology and surface-to-volume ration observed at the onset of mitosis. Whether or not this link is related to the Golgi fragmentation observed during mitosis is hard to establish at present: judging by their DNA, the cells are not arrested in mitosis and their Golgi phenotype appears different from a mitotic Golgi, which would be clearly fragmented: for BUB1, the phenotype is mostly diffuse cis and trans and for CDC2 it is a mixture of diffuse and fragmented (Figure 5C).
Different MAPK cascades affect Golgi organization
The Mitogen Activated Protein Kinases (MAPK) family includes more than ∼30 different protein kinases that respond to various stimuli (Bandyopadhyay et al, 2010). MAPK cascade with typically in mammalian cells three or four levels going from MAP4K to MAPK (Plotnikov et al, 2011). Our screen’s results indicate a significant enrichment in the MAPK signaling pathway (Supplementary Figure S4B). This is consistent with the results of two recent screens looking at ER exit sites in mammalian cells and Golgi morphology in Drosophila S2 cells (Farhan et al, 2010; Zacharogianni et al, 2011).
Eight MAPK family kinases and thirteen closely related genes were identified, including four dual specificity phosphatases (DUSP) (Figure 5D). DUSP are proposed negative regulators of MAPK pathways. We verified that depletion of DUSP2, 6 and especially 8 resulted in a hyper-phosphorylation of ERK1/2 (Supplementary Figure S6A). This suggests that fragmentation of the Golgi apparatus results from the activation of ERK. Indeed, treatment of the DUSP2, 6 or 8 depleted cells with the ERK inhibitor FR180204 reverted the Golgi phenotype (Supplementary Figure S6B and C). ERK has been shown to phosphorylate the Golgi structural protein GRASP65 during the orientation of the Golgi toward the leading edge (Bisel et al, 2008). This phosphorylation event could be one of the underlying mechanisms of the observed Golgi fragmentation.
At present, four main MAPK cascades have been described, the classical pathway, which respond to mitogenic stimulation, the p38 and JNK cascades that tend to be activated by environmental stress and the lesser known Erk5 cascade. Based on results from our screen and previous RNAi screens (Farhan et al, 2010), it appears that all four cascades are involved in the regulation of Golgi organization.
Indeed, one of our hits, MECOM, aka Evi1, has been proposed to negatively regulate the JNK by direct binding (Kurokawa et al, 2000). JNK has been linked to Golgi-associated proteins, such as AKRL1/2 (Harada et al, 2003) or vesicular trafficking proteins such as JIP1/2/3 (Akhmanova and Iii, 2010). Consistent with the effect of Evi1 depletion being mediated by JNK, we find that treatment of the Evi1-depleted cells with the JNK inhibitor SP600125 reverts the Golgi condensed phenotype (Supplementary Figure S7A and B).
The Golgi proteins that could be mediating these changes of morphology remain relatively few at present. In addition to GRASP65, recent screens have demonstrated that the classical MAPK Erk1/2 and the atypical Erk7 phosphorylates the ER exit site component Sec16 to regulate export from the ER (Farhan et al, 2010). Given the variability of phenotypes and the number of kinases involved in our screens, it is likely several other substrates are engaged by different pathways.
Growth factors and cell surface receptors signal to the Golgi apparatus
Among the confirmed gene depletion affecting most significantly Golgi morphology, we found several cell surface receptors. FGFR2 and IGF1R displayed opposite phenotypes, fragmented and condensed, respectively, suggesting that different signaling cascades can balance each other’s effects on the Golgi apparatus (Figure 6A and B). These Golgi phenotypes suggest that cells modulate the secretory pathway in response to ligand binding to these receptors. To test this, we stimulated cells with Insulin-like Growth Factor 1 (IGF1) or the Transforming Growth Factor B1 (TGF-B1). Stimulation of serum-starved HeLa cells with 100 ng/ml of IGF1 or 2 ng/ml TGF-B1 induced significant fragmentation of the Golgi apparatus as early as 1 h and for as long as 4 h (Figure 6C and D). This relatively short time course suggests that the regulation of the secretory pathway by these cell surface receptors is relatively direct. This is further supported by the rapidity of response to the IGF1R inhibitor AG1024, which recapitulates IGF1R depletion (condensed Golgi apparatus) as early as 1 h after drug addition (Figure 6C).
Figure 6.

Cell surface receptors control Golgi organization. (A) Plot of cis fragmented against cis condensed phenotypic scores for signaling genes. (B) Golgi staining of different compartments in IGF1R and TGFRB1 depletion reveals a typical condensed Golgi phenotype. (C) Golgi staining after cell stimulation with IGF1R ligand IGF1 for 2 h (top) and TGFBR1 ligand TGF-B1 (bottom) or treatment with the IGF1R inhibitor AG1024 for 1 h (middle). Images acquired at × 60 magnification. (D) Quantification for Golgi fragmentation in IGF1 (left) and TGF-B1 stimulation (right) over various time points. Values on graphs indicate the mean±s.e.m. *P<0.05, **P<0.0001 by two-tailed unpaired t-test, relative to untransfected or GFP siRNA-treated cells.
110 Golgi organization regulators also affect general secretion
The Golgi apparatus has essential roles in protein sorting. To test whether some of the Golgi regulators we identified affect general protein secretion, we generated a HeLa cell line expressing secreted Metridia luciferase (Met-Luc). To test this reporter system, the cell line was subjected to RNAi by the pilot library of membrane trafficking regulators and the few drugs known to affect Golgi organization. Met-Luc was measured in the supernatant, cells were counted by DAPI staining and imaging, and secretion of Met-Luc was normalized to the number of nuclei. As expected, BFA treatment reduced significantly the Met-Luc secretion and several SNAREs were identified whose depletion significantly reduced Met-Luc secretion (Supplementary Figure S8A). We also identified several SNAREs whose depletion induced on the contrary an increase in Met-Luc secretion (Supplementary Figure S8A). This relatively surprising result was highly reproducible as the rest of the Met-Luc secretion data (Supplementary Figure S8D).
A possible explanation is that Met-Luc, being an exogenous substrate, is not secreted at full efficiency but is partially diverted to intracellular compartments such as lysosomes. A defect in the normal sorting machinery would then result in the observed increase in secretion. In support of this hypothesis, Syntaxin 16 depletion resulted in Met-Luc hyper-secretion (Supplementary Figure S8A). Syntaxin 16 (STX16) is known to regulate mostly retrograde trafficking from the endosomes to the TGN (Mallard et al, 2002; Amessou et al, 2007). Its knockdown could therefore be expected to perturb sorting from Golgi to lysosomes.
Next, the hits were screened for Met-Luc secretion. Both hypo- and hyper-secretion phenotypes were again observed and the amplitude of phenotype was comparable to the pilot library results (Supplementary Figure S8B). We found that 62 of the gene depletions caused a significant decrease in Met-Luc secretion, while 58 resulted in increased secretion (Table I). PIK4CA knockdown is among the strongest inhibitors of Met-Luc secretion (Supplementary Figure S8B), consistent with its critical role in maintaining functional Golgi membranes through PIP4 production. No clear correlation between morphological phenotype and secretion phenotype could be found (Supplementary Figure S8C), indicating that similar Golgi morphologies can reflect significantly different functional perturbations.
We further verified the secretion defect for nine hits using the well-established tsO45G transport assay (Zilberstein et al, 1980). By probing the co-localization of tsO45G with the Golgi marker MannII-GFP 15 min after release from the restrictive temperature (which induces retention of tsO45G in the ER), we could assess more specifically and quantitatively the ER to Golgi trafficking step. In agreement with the Met-Luc secretion data, depletion of six genes induced a significant reduction in ER to Golgi traffic (Supplementary Figure S9A and B).
146 Golgi organization regulators also affect glycan biosynthesis
We sought to evaluate whether the perturbations in Golgi organization resulted in changes in cell surface glycan patterns. The prominent glycans in most cell type cells are N-glycans and O-GalNAc glycans. Therefore, we selected eight fluorescent lectins with different specificities that are known to bind the main structures that are displayed by these glycans (Figure 7A). A description of these lectins and their binding specificities is available in Supplementary information.
Figure 7.

166 signaling proteins regulate Golgi morphology and glycans expression. (A) Schematic of the main glycan structures bound by the lectins used in the secondary screening. (B) ECA (left) and LCA (right) lectin staining after 3 days knockdown of the indicated negative (GFP) and positive (SLC35A3, Golgi UDP-GlcNAc transporter; and FUT8, fucosyltransferase 8) control genes. (C) DSL lectin intensity per cell (arbitrary units) against cell count for each of the primary hit genes (red) and control wells (black). Each data set is fit to a log equation (see Materials and methods) and the resulting fits (solid lines) represent the expected intensity under unperturbed conditions. A normalized lectin signal for each gene is then calculated in relation to the mean absolute deviation of control wells (see Materials and methods), as a measure of extent of perturbation. (D) Normalized lectin signals of control wells (black) in comparison with signaling genes (colored), for all lectins tested. Dotted lines indicate hit cutoff values of 4 and −4. (E) Complete zoomed out plot of (D), with some extreme genes labeled. Yellow filled circles represent the normalized lectin signal for control genes (indicated below lectin names). (F) Overview of the distribution of the number of lectin hits per gene. The corresponding numbers of genes are indicated on the chart. (G) Principal Component Analysis plot of the seven lectin scores (excluding HPL; see also Supplementary Figure S10C) for each hit gene. Genes are color coded according to the six Golgi morphology groups as indicated. Inset: Eigen vectors with the respective lectins labeled.
To evaluate the range of lectin staining variation that could be expected, various enzymes and sugar transporters were knocked down and lectin fluorescence signals were quantified (Supplementary Experimental Procedures). For each lectin, we could obtain a significant decrease or increase in staining upon specific knockdowns in a manner consistent with their expected specificity. For example, depletion of the Golgi-localized UDP-GlcNAc transporter SLC35A3 reduced staining by ECA, which binds mostly the common lactosamine disaccharide Gal-GlcNAc. Alternatively, knockdown of the fucosyltransferase 8 (FUT8) reduced staining with LCA, a fucosyl-specific lectin (Figure 7B).
Then, we performed a secondary screen in duplicate for the 181 primary Golgi morphology hits identified using the eight lectins on non-permeabilized fixed cells (Table I). Interestingly, several genes resulted in lectin staining changes similar to or more pronounced than our positive controls. For example, while knockdown of SLC35A3 induced an ∼35% reduction of ECA staining, FGFR1 depletion showed ∼40% reduction and DGKZ targeting resulted conversely in a dramatic, 3.5-fold increase (Figure 8A).
Figure 8.

Examples of signaling proteins regulating glycans expression. (A) Lectin staining and glycan profiles of representative hit genes. Top: Glycan profiles of respective hit genes. Axis values indicate normalized lectin signals. Solid lines delineate the cutoff values (4 and −4). Middle: Lectin staining of cells transfected with control GFP and hit gene siRNAs. Bottom: Main glycan structures recognized by the respective indicated lectins. (B) Model of Golgi organization and glycosylation regulation. Colored shapes populating the Golgi illustrate the variety of glycosylation enzymes.
For most lectins, we noted a trend of slightly higher staining intensity values per cell in wells with lower cell number (Figure 7C). We incorporated this systematic shift in the computation of a ‘normalized lectin signal’ (see Materials and methods).
The lectin fluorescence staining was highly reproducible in our experimental conditions as demonstrated by the tight distribution of the multiple control wells (Figure 7D). Based on this, we defined the thresholds of significance as a normalized lectin signal of >4 or <−4 (Figure 7D and E). The former indicates significantly increased lectin staining while the latter indicates significantly decreased lectin staining. Most (146/159) of the validated Golgi morphology hits resulted in a significant change of intensity for at least one lectin (Figure 7F).
Surprisingly, results for most of the lectins across the whole screen did not correlate significantly with each other (Supplementary Figure S10B). Yet, the effects were highly reproducible between replicates (Supplementary Figure S10A). Furthermore, two lectins, DSL and PHA-L, which are both proposed to bind tri- and tetra-antennary glycans did correlate well with each other (Supplementary Figure S10B). This indicates that the lack of correlation between lectin staining reflects a real biological phenomenon. It suggests that different signaling genes affect different glycosylation pathways.
This complexity is apparent in the PCA of the lectin staining data (Supplementary Figures 7G and S10C). PCA demonstrates consistency with the biology of glycans. Indeed, the Eigen vectors organizing the PCA (black arrows in Supplementary Figure 7G) are aligned in two groups, oriented at 90 degrees from each other. One corresponds roughly to short glycan structures, that is, ConA, PNA, ECA and LCA lectins and the other to elongated glycan structures, that is, MAL, PHA-L and DSL lectins. However, in contrast with the PCA of the morphological signatures (Figure 3F), the lack of clear groups formed by the signaling genes illustrates that their effects on glycan expression are quite diverse.
A complex interaction between signaling genes and the regulation of glycosylation
Glycan synthesis in the Golgi apparatus comprises several pathways functioning in parallel, mainly but not exclusively N- and O-GalNAc glycosylation (Stanley, 2011). Even within the N-Glycosylation pathway, it is unclear whether different glycosylation reactions such as fucosylation or sialylation are coordinated. Our results indicate that changes in the efficiency of glycosylation reactions can occur relatively independently of each other’s.
This variability of effects on glycan expression prompted us to define a glycan profile for each gene including data for the eight lectins in one plot (Figure 8A). Not surprisingly given their diversity, glycan profiles did not correlate tightly with specific Golgi morphological parameters. However, some trends surfaced: when the Golgi adopts a condensed morphology, the glycan profile tends to show a general decrease in lectin intensities whereas fragmentation tends to yield generally increased lectin intensities (Figure 7G).
The variety of glycan profiles is illustrated by some examples with one lectin staining and the overall glycophenotype displayed (Figure 8A) and the results for every individual gene are available in Table I.
Discussion
Our screen results reflect the morphological plasticity of the Golgi apparatus, with a great variety of phenotypes observed. Golgi plasticity was initially revealed through the effect of drugs such as BFA, which induces a dramatic dispersion of Golgi membranes in a short amount of time (Sciaky et al, 1997). This phenomenon is linked to the highly dynamic nature of this organelle, which is constantly receiving and dispatching membrane material (Sengupta and Linstedt, 2011).
As shown in our pilot screen, transient depletion of membrane trafficking-related proteins such as SNAREs can drive significant Golgi morphological modifications, presumably through the impairment of specific trafficking events. However, the precise mechanistic links between these protein depletions and the observed phenotypes are not clear at present. This is due in part to the difficulty in interpreting Golgi phenotypes. For example, fragmented Golgi phenotypes could reflect changes in the links between stacks and/or their interaction with the underlying cytoskeleton. Yet, it is clear that there are various types of fragmented phenotypes, which can be detected by a trained human eye. Fragmented phenotypes are also associated with various effects on constitutive secretion and glycan synthesis, suggesting different molecular perturbations at the Golgi level.
Nevertheless, Golgi morphological perturbations can help reveal the genetic regulation of this organelle. The signaling genes screen uncovered that 159 signaling genes, or 20% of the tested set, are implicated in the regulation of the Golgi apparatus. This proportion may appear surprisingly high, however, other evidence support this result. First, in public databases, over 850 different phosphoproteins are associated with Golgi membranes. Second, numerous signaling proteins have been localized on Golgi membranes, and their importance for this organelle is starting to be revealed through various screening approaches (Farhan et al, 2010; Farhan and Rabouille, 2011; Zacharogianni et al, 2011; Simpson et al, 2012). Third, several of our hits or their close homologs are validated by the previous literature. For example, SCYL3 display a clear diffuse trans Golgi phenotype in our screen, suggesting a possible redistribution of TGN46 to the ER. In recent years, it has been well established that a close homolog, SCYL1, binds the COPI coat and regulates both retrograde traffic and Golgi morphology (Burman et al, 2008, 2010). SCYL2, alias CVAK104, has been proposed to mediate clathrin-coated vesicles formation at the TGN (Düwel and Ungewickell, 2006). Together, these data suggest that the SCY-1-like family of catalytically inactive protein kinases have similar roles in regulating membrane traffic. To note, neither SCYL2 nor SCYL3 contains the COPI binding site identified in SCYL1 (Burman et al, 2008).
The Golgi apparatus is a complex but coordinated structure, which can be conceived as built up of various modules interacting with each other’s (Nakamura et al, 2012). The kinases, phosphatases, associated proteins and phosphoproteins that we identified are likely to regulate some of these modules and function to coordinate them. As the Golgi apparatus is relatively constant in shape and function in a given cell population, these signaling molecules acting on the Golgi can be conceived as a large interconnected regulatory network. For the most part, how this network is regulated and what it regulates remain mostly unknown.
An exception is the regulation of the phosphoinositide PIP4 and related lipids in Golgi membranes. PIP4 is known to have multiple effectors in Golgi membranes, its regulation is therefore critical for Golgi physiology (Cheong et al, 2010). Another exception is the regulation of acto-myosin dynamics, shown to be critical for the formation of transport intermediates both at the TGN and at the CGN (Miserey-Lenkei et al, 2010).
Some of the lipid and protein kinases and phosphatases present in these two subnetworks are known to respond to extracellular stimulations, which could therefore regulate Golgi physiology. Consistently, we also found that several cell surface receptors such as IGFR, TGFBIIR, EGFR or FGFR and their cognate ligands affect strongly Golgi organization. Cells appear, therefore, to respond to various stimuli by modulating membrane trafficking events at the Golgi level.
Cells also respond to endogenous signals to maintain homeostasis. Endogenous signaling in the secretory pathway has been well described for the unfolded protein response for example (Ron and Walter, 2007). Protein cargo load could also constitute a signal for transport carrier formation that could engage kinases such as PKD (Bard and Malhotra, 2006) or Src (Pulvirenti et al, 2008). Therefore, it is likely that the large regulatory network that we uncovered is responsible both for the maintenance of Golgi homeostasis and for adapting Golgi functions to changing extracellular conditions.
It has been shown recently that the flux of protein trafficking in the secretory pathway is under the control of a MAPK cascade at the level of the ER exit sites (Farhan et al, 2008, 2010; Zacharogianni et al, 2011). Additional layers of regulation of secretion probably function at the Golgi level as was shown recently in pancreatic β cells for insulin secretion (Sumara et al, 2009). This Golgi-localized regulation could possibly act through the modulation of sorting events, as suggested by the hyper-secretion of the Met-Luc reporter. An attractive hypothesis is that not all cargo will be similarly regulated, explaining perhaps partially the complexity of this regulatory network.
In addition, our results suggest that glycosylation is a major target of regulation by signaling networks. Although the precise mechanisms are not known at present, the extensive co-occurrence of perturbations in Golgi morphology and glycan expression argues that depletion of signaling genes affects glycan expression through Golgi organization modifications.
Golgi glycosylation is a complex process and signaling could affect multiple mechanisms (Stanley, 2011). For example, lumenal pH could be modulated; it has been shown to affect strongly some glycosylation reactions (Rivinoja et al, 2009). Alternatively, the organization of the Golgi stacks in a network could have a critical role in glycosylation, for example by regulating the kinetics of transport and therefore the interaction between substrates and enzymes (Puthenveedu et al, 2006). Another hypothesis is that glycosylation is regulated through the cisternal distribution of glycosylation enzymes. Indeed, our analysis did detect obvious changes in cisternal organization. This is exemplified by the dissociation of GalNAc-Ts from Mannosidase II (HPL and MannII-GFP markers) observed in various gene depletions leading to strong cis diffuse but normal medial Golgi.
As shown recently, GalNac-Ts’ activity can be regulated by affecting their intracellular distribution through inducible and specific COPI-dependent transport (Gill et al, 2010). By extension, it is possible that other Golgi proteins such as sugar transporters, anion channels or glycosylation enzymes are packaged and redistributed in a specific manner. In favor of this hypothesis, emerging evidence show that Golgi enzymes can be associated with specific adaptors to direct their trafficking (Tu et al, 2008). Furthermore, the cytoplasmic tails of different Golgi enzymes have been shown to interact with different cytosolic proteins (Yamaguchi and Fukuda, 1995; Wassler et al, 2001; Quintero et al, 2008; Schmitz et al, 2008), suggesting that they could be differentially trafficked.
The modulation of glycosylation enzymes expression is arguably the favored mechanism so far to explain changes in glycan expression (Comelli et al, 2006; Lauc et al, 2010). Golgi remodeling would represent an alternative, faster mechanism. It could explain the fast changes in glycan expression observed for example during stem cell differentiation programs (Lanctot et al, 2007). Golgi reorganization would also be an efficient and transient way to regulate cell-cell and cell-matrix adhesion as glycans have been shown to mediate these processes (Ohtsubo and Marth, 2006).
As signaling pathways are often modified in cancer cells, our results may help explain some of the abnormal Golgi morphologies commonly observed in cancer cell lines (Kellokumpu et al, 2002). Alterations in signaling pathways could also potentially explain some of the numerous perturbations of glycoprotein profiles observed in cancer and studied as biomarkers (Wollscheid et al, 2009; Narimatsu et al, 2010).
Overall, our data suggest a complex web of interaction between signaling cascades and the product of Golgi biosynthetic activity, the glycans. There is likely an exquisite regulation of Golgi organization by different signaling pathways leading to a diversity of glycan expression patterns, each having a unique, distinct role in mediating cellular biology (Figure 8B). The glycosylation of cell surface receptors is known to affect their stability and signaling potential (Boscher et al, 2011). Therefore, it is likely that the regulation of glycan expression will in turn impact signaling cascades (Figure 8B).
The cells from complex organisms such as mammals have evolved a capacity to integrate multiple extracellular signal inputs into their physiology, allowing for the coherent behavior of cellular assemblies. Cellular interactions are mainly controlled by cell surface glycoproteins, which are modified and sorted at the Golgi apparatus. Our study highlights that signaling cascades control Golgi physiology and provides a rich data set to further explore this question.
Materials and methods
Cell lines, antibodies and reagents
HeLa MannII-GFP was obtained from V Malhotra’s laboratory and was maintained in DMEM with 10% fetal bovine serum (FBS). All cells were grown at 37°C in a 10% CO2 incubator. Anti-TGN46 (#AHP1598) was purchased from AbD Serotec. Helix pomatia Lectin A (HPL) conjugated with 647 nm fluorophore (#L32454), Alexa Fluor secondary antibodies and Hoechst 33342 (#H3570) were purchased from Invitrogen. siRNAs were obtained from Dharmacon, now Thermo-Fisher. OptiMEM was purchased from Invitrogen and Hiperfect transfection reagent was purchased from Qiagen. Brefeldin A (BFA) (#B7651), Nocodazole (M1404), Monensin (#M5273) and Latrunculin B (#L5288) were purchased from Sigma-Aldrich Ltd. Recombinant human IGF1 (#291-G1) and TGF-B1 (#100-B) were purchased from R&D Systems Inc.
siRNA screening
siRNA transfection
In the primary screen, 2.5 μl of 500 nM siRNA was printed into black-walled 384-well plates (Grenier, #781091) with Velocity 11. siRNA plates for secondary screens were prepared by assembling cherry picked siRNA tubes. Deconvoluted siRNAs were custom-ordered from Thermo-Fisher. Both sets of siRNAs were robotically printed onto 384-well plates as for the primary screen. Reverse siRNA transfection was performed by pre-mixing 0.25 μl of Hiperfect (Qiagen, #301705) with 7.25 μl of Optimem (per well) for 5 min, then adding the mixture to the siRNA for complexation for 20 min, followed by addition of 2000 HeLa MannII-GFP cells per well with the Multidrop combi (Thermo-Fisher).
Golgi immunofluorescence and imaging
After 3 days of siRNA knockdown, the cells were fixed with 4% paraformaldehyde in D-PBS for 10 min, washed with D-PBS and permeabilized with 0.2% Triton X-100 for a further 10 min. The cells were then stained with TGN46 primary antibody diluted in 2%FBS in D-PBS for 2 h. Cells were subsequently washed three times for 5 min with 2% FBS in D-PBS and stained for 20 min with secondary anti-sheep conjugated with 594 nm fluorophore (Alexa Fluor, Invitrogen, #A11016), HPL and Hoechst 33342 diluted in 2% FBS in D-PBS. The cells were then washed three times for 5 min with D-PBS before high-throughput confocal imaging. siRNA plates were performed in duplicates.
Automated image acquisition and processing, single cell HCS data
Four sites (each imaged at four excitation wavelengths of 405, 488, 561 and 635 nm) per well were acquired sequentially with a × 20 Plan Apo 0.75 NA objective on a laser scanning confocal high-throughput microscope (ImageXpress Ultra, MDS Analytical Technologies). A web application was created to access links and meta-information on the proprietary database provided with the acquisition software (MDCStore, MDS) and to launch a dedicated image analysis application called HCSU (high content screening unit) which performs image segmentation and feature extraction. HCSU is composed of a set of optimized algorithms written in C and C++. On a single computer dedicated to image processing, a java application manages the parallelization of HCSU on multiple CPUs. Implementations of the algorithms are homemade when not stated. The resulting single cell level data with all raw features and SVM features is available on Dryad at http://dx.doi.org/10.5061/dryad.1m2p3. The data file ID is doi:10.5061/dryad.1m2p3.
Selection of primary and validated hits
Threshold determination was performed for each phenotypic score using the derivative method (Moreau et al, 2011). Specifically, this corresponds to cutoff phenotypic scores of 0.44 (cis diffuse), 0.43 (cis fragmented), 0.33 (cis condensed), 0.21 (medial diffuse), 0.4 (medial fragmented), 0.43 (medial condensed), 0.44 (trans diffuse), 0.4 (trans fragmented) and 0.35 (trans condensed). Each of the scores corresponds to a z-score of >2. Genes with one or more phenotypic scores above the cutoff values were selected as hits. Thresholds for the deconvoluted siRNA validation screen were defined as 50% of the primary screen cutoff scores.
Bioinformatics analysis
Most of the analyses were performed as described previously (Moreau et al, 2011). For the hierarchical clustering of phenotypes (Figure 3C), the ‘Agglomerative Hierarchical Clustering’ method was applied using ‘Euclidean Distance’ as distance metric and ‘Complete Linkage’ as the linkage criteria. We picked the clusters manually by visual analysis of the heatmap and thus identified six different groups of genes.
High-resolution fluorescence microscopy
Cells were seeded onto glass coverslips in 24-well dishes (Nunc). After the respective treatments, cells were fixed with 4% paraformaldehyde in D-PBS, permeabilized with 0.2% Triton-X and stained with the appropriate markers using the same procedure performed in the primary siRNA screen. Cells were mounted onto glass slides using FluorSave (Merck) and imaged at room temperature using an inverted confocal microscope (Olympus IX81) coupled with a CCD camera (model FVII) either with a × 60 objective (U Plan Super Apochromatic [UPLSAPO]; NA 1.35) or × 100 objective (UPLSAPO; NA 1.40) under Immersol oil. Images were acquired and processed using Olympus FV10-ASW software.
Growth factor and drug treatments
In the pilot siRNA screen, 3 days after siRNA transfection, the drugs BFA (2 μg/ml), nocodazole (6 μg/ml), monensin (1 μg/ml) and latrunculin B (1 μg/ml) were added to untreated cells for 1 h before fixing. For IGF1 and TGF-B1 stimulation, HeLa MannII-GFP cells were seeded into 96-well black-wall imaging plates (Falcon, #353219) overnight and serum-starved for 16 h before incubation with IGF1 (100 ng/ml) and TGF-B1 (2 ng/ml) in serum-free DMEM for various durations before fixing with 4% paraformaldehyde in D-PBS followed by subsequent staining.
Lectin secondary screen
Transfection and fluorescent staining
siRNA transfection on wild-type HeLa cells was performed as in the primary screen. Three days after siRNA transfection, cells were fixed with 4% paraformaldehyde in PBS for 10 min, washed with PBS, then incubated for 1–2 h at room temperature with the respective fluorescently labeled lectins (20 μg/ml) in D-PBS containing 2% FBS. Cells were then washed three times for 10 min each with 2% FBS in D-PBS, incubated with Hoechst dye (1 μg/ml) in PBS for 10 min to stain nuclei, and washed another two times for 10 min each with PBS. For biotin-conjugated lectins, the Hoechst staining was preceded by a 1-h incubation with streptavidin-FITC or streptavidin-Alexa594 (2 μg/ml) in 2% FBS/D-PBS. Cells were then imaged using the high-throughput ImageXpress Ultra or ImageXpress Micro imagers, with 2–4 sites imaged per well. Each lectin was assayed at least in duplicate.
Image analysis
Images of cells were analyzed using MetaXpress software (Molecular Devices). The Transfluor HT module was used to quantify the lectin intensity and cell number for each site, and the average intensity per cell obtained for each well. We found that for most lectins, there was a correlation between lectin intensity per cell and cell number (Figure 5C), hence for each plate of 180 genes, a plot of intensity per cell versus cell number was fit to a log equation (y=y0+a log x, where y0 and a are constants) to obtain the expected intensity per cell for no siRNA knockdown (red solid curve). The same fit was performed on the control transfection reagent-treated wells (TR) in the same plate (black solid curve), and the mean absolute deviation of the TR wells (mean |dtr|=mean |Itr−Ix,tr|, where Itr is the intensity per cell for the given well, and Ix,tr is the expected intensity per cell for the cell count of the given well) was calculated as a measure of the experimental variation in the assay. The deviation of each gene’s intensity per cell from the expected value at its given cell number was then calculated (di=Ii−Ix,i, where Ii is the intensity per cell for the given gene, and Ix,i is the expected intensity per cell for the cell count of the given gene), and expressed in terms of the mean absolute deviation of the TR wells, which we then call the ‘normalized lectin signal’. Finally, we defined significant perturbation of lectin staining (cutoff values) as a normalized lectin signal of at >4 or <−4 (solid black lines in Glycan Profiles).
Supplementary Material
Supplementary Figures S1-10
Acknowledgments
JC and SN conducted the pilot and primary morphology screens (Figures 1 and 3). VR developed the image analysis and phenotype classification algorithms (Figure 2). PK and JC conducted GO and pathway analysis (Figures 4 and 5). GG conducted the secondary screens with lectins (Figure 8). JC and GG conducted follow-up studies (Figures 6 and 7). We are grateful to IMCB COM-IT for their help with setting-up databases and file servers.
Footnotes
The authors declare that they have no conflict of interest.
References
- Akhmanova A, Iii JAH (2010) Linking molecular motors to membrane cargo. Curr Opin Cell Biol 22: 479–487 [DOI] [PMC free article] [PubMed] [Google Scholar]
- Amessou M, Fradagrada A, Falguières T, Lord JM, Smith DC, Roberts LM, Lamaze C, Johannes L (2007) Syntaxin 16 and syntaxin 5 are required for efficient retrograde transport of several exogenous and endogenous cargo proteins. J Cell Sci 120: 1457–1468 [DOI] [PMC free article] [PubMed] [Google Scholar]
- Bandyopadhyay S, Chiang C-Y, Srivastava J, Gersten M, White S, Bell R, Kurschner C, Martin CH, Smoot M, Sahasrabudhe S, Barber DL, Chanda SK, Ideker T (2010) A human MAP kinase interactome. Nat Methods 7: 801–805 [DOI] [PMC free article] [PubMed] [Google Scholar]
- Bard F, Casano L, Mallabiabarrena A, Wallace E, Saito K, Kitayama H, Guizzunti G, Hu Y, Wendler F, Dasgupta R, Perrimon N, Malhotra V (2006) Functional genomics reveals genes involved in protein secretion and Golgi organization. Nature 439: 604–607 [DOI] [PubMed] [Google Scholar]
- Bard F, Malhotra V (2006) The formation of TGN-to-plasma-membrane transport carriers. Annu Rev Cell Dev Biol 22: 439–455 [DOI] [PubMed] [Google Scholar]
- Bard F, Mazelin L, Péchoux-Longin C, Malhotra V, Jurdic P (2003) Src regulates Golgi structure and KDEL receptor-dependent retrograde transport to the endoplasmic reticulum. J Biol Chem 278: 46601–46606 [DOI] [PubMed] [Google Scholar]
- Bisel B, Wang Y, Wei J-H, Xiang Y, Tang D, Miron-Mendoza M, Yoshimura S-i, Nakamura N, Seemann J (2008) ERK regulates Golgi and centrosome orientation towards the leading edge through GRASP65. J Cell Biol 182: 837–843 [DOI] [PMC free article] [PubMed] [Google Scholar]
- Bishop JR, Gagneux P (2007) Evolution of carbohydrate antigens--microbial forces shaping host glycomes? Glycobiology 17: 23R–34R [DOI] [PubMed] [Google Scholar]
- Blayney L, Gapper P, Rix C (1998) Identification of phospholipase C beta isoforms and their location in cultured vascular smooth muscle cells of pig, human and rat. Cardiovasc Res 40: 564–572 [DOI] [PubMed] [Google Scholar]
- Boscher C, Dennis JW, Nabi IR (2011) Glycosylation, galectins and cellular signaling. Curr Opin Cell Biol 23: 383–392 [DOI] [PubMed] [Google Scholar]
- Boser BE, Guyon IM, Vapnik VN (1992) A training algorithm for optimal margin classifiers. In Proceedings of the Fifth Annual Workshop of Computational Learning Theory , Vol. 5, pp 144–152 [Google Scholar]
- Bossard C, Bresson D, Polishchuk RS, Malhotra V (2007) Dimeric PKD regulates membrane fission to form transport carriers at the TGN. J Cell Biol 179: 1123–1131 [DOI] [PMC free article] [PubMed] [Google Scholar]
- Burman JL, Bourbonniere L, Philie J, Stroh T, Dejgaard SY, Presley JF, McPherson PS (2008) Scyl1, mutated in a recessive form of spinocerebellar neurodegeneration, regulates COPI-mediated retrograde traffic. J Biol Chem 283: 22774–22786 [DOI] [PubMed] [Google Scholar]
- Burman JL, Hamlin JNR, McPherson PS (2010) Scyl1 regulates Golgi morphology. PLoS ONE 5: e9537. [DOI] [PMC free article] [PubMed] [Google Scholar]
- Cayrol C, Cougoule C, Wright M (2002) The beta2-adaptin clathrin adaptor interacts with the mitotic checkpoint kinase BubR1. Biochem Biophys Res Commun 298: 720–730 [DOI] [PubMed] [Google Scholar]
- Cheong FY, Sharma V, Blagoveshchenskaya A, Oorschot VMJ, Brankatschk B, Klumperman J, Freeze HH, Mayinger P (2010) Spatial regulation of Golgi phosphatidylinositol-4-phosphate is required for enzyme localization and glycosylation fidelity. Traffic 11: 1180–1190 [DOI] [PMC free article] [PubMed] [Google Scholar]
- Colanzi A, Corda D (2007) Mitosis controls the Golgi and the Golgi controls mitosis. Curr Opin Cell Biol 19: 386–393 [DOI] [PubMed] [Google Scholar]
- Comelli EM, Head SR, Gilmartin T, Whisenant T, Haslam SM, North SJ, Wong N-K, Kudo T, Narimatsu H, Esko JD, Drickamer K, Dell A, Paulson JC (2006) A focused microarray approach to functional glycomics: transcriptional regulation of the glycome. Glycobiology 16: 117–131 [DOI] [PubMed] [Google Scholar]
- de Graffenried CL, Bertozzi CR (2004) The roles of enzyme localisation and complex formation in glycan assembly within the Golgi apparatus. Curr Opin Cell Biol 16: 356–363 [DOI] [PubMed] [Google Scholar]
- De Matteis MA, Di Campli A, Godi A (2005) The role of the phosphoinositides at the Golgi complex. Biochim Biophys Acta 1744: 396–405 [DOI] [PubMed] [Google Scholar]
- Deacon SW, Beeser A, Fukui JA, Rennefahrt UEE, Myers C, Chernoff J, Peterson JR (2008) An isoform-selective, small-molecule inhibitor targets the autoregulatory mechanism of p21-activated kinase. Chem Biol 15: 322–331 [DOI] [PMC free article] [PubMed] [Google Scholar]
- Dinter A, Berger EG (1998) Golgi-disturbing agents. Histochem Cell Biol 109: 571–590 [DOI] [PubMed] [Google Scholar]
- Dunphy WG, Fries E, Urbani LJ, Rothman JE (1981) Early and late functions associated with the Golgi apparatus reside in distinct compartments. Proc Natl Acad Sci USA 78: 7453–7457 [DOI] [PMC free article] [PubMed] [Google Scholar]
- Duran JM, Kinseth M, Bossard C, Rose DW, Polishchuk R, Wu CC, Yates J, Zimmerman T, Malhotra V (2008) The role of GRASP55 in Golgi fragmentation and entry of cells into mitosis. Mol Biol Cell 19: 2579–2587 [DOI] [PMC free article] [PubMed] [Google Scholar]
- Düwel M, Ungewickell EJ (2006) Clathrin-dependent association of CVAK104 with endosomes and the trans-Golgi network. Mol Biol Cell 17: 4513–4525 [DOI] [PMC free article] [PubMed] [Google Scholar]
- Efimov A, Kharitonov A, Efimova N, Loncarek J, Miller PM, Andreyeva N, Gleeson P, Galjart N, Maia ARR, McLeod IX, Yates JR, Maiato H, Khodjakov A, Akhmanova A, Kaverina I (2007) Asymmetric CLASP-dependent nucleation of noncentrosomal microtubules at the trans-Golgi network. Dev Cell 12: 917–930 [DOI] [PMC free article] [PubMed] [Google Scholar]
- Egea G, Lázaro-Diéguez F, Vilella M (2006) Actin dynamics at the Golgi complex in mammalian cells. Curr Opin Cell Biol 18: 168–178 [DOI] [PubMed] [Google Scholar]
- Even-Faitelson L, Rosenberg M, Ravid S (2005) PAK1 regulates myosin II-B phosphorylation, filament assembly, localization and cell chemotaxis. Cell Signal 17: 1137–1148 [DOI] [PubMed] [Google Scholar]
- Farhan H, Rabouille C (2011) Signalling to and from the secretory pathway. J Cell Sci 124: 171–180 [DOI] [PubMed] [Google Scholar]
- Farhan H, Weiss M, Tani K, Kaufman RJ, Hauri H-P (2008) Adaptation of endoplasmic reticulum exit sites to acute and chronic increases in cargo load. EMBO J 27: 2043–2054 [DOI] [PMC free article] [PubMed] [Google Scholar]
- Farhan H, Wendeler MW, Mitrovic S, Fava E, Silberberg Y, Sharan R, Zerial M, Hauri H-P (2010) MAPK signaling to the early secretory pathway revealed by kinase/phosphatase functional screening. J Cell Biol 189: 997–1011 [DOI] [PMC free article] [PubMed] [Google Scholar]
- Field MC, Dacks JB (2009) First and last ancestors: reconstructing evolution of the endomembrane system with ESCRTs, vesicle coat proteins, and nuclear pore complexes. Curr Opin Cell Biol 21: 4–13 [DOI] [PubMed] [Google Scholar]
- Fingerhut A, von Figura K, Honing S (2001) Binding of AP2 to sorting signals is modulated by AP2 phosphorylation. J Biol Chem 276: 5476–5482 [DOI] [PubMed] [Google Scholar]
- Foletta VC, Moussi N, Sarmiere PD, Bamburg JR, Bernard O (2004) LIM kinase 1, a key regulator of actin dynamics, is widely expressed in embryonic and adult tissues. Exp Cell Res 294: 392–405 [DOI] [PubMed] [Google Scholar]
- Freeze HH (2006) Genetic defects in the human glycome. Nat Rev Genet 7: 537–551 [DOI] [PubMed] [Google Scholar]
- Ghosh RN, Mallet WG, Soe TT, McGraw TE, Maxfield FR (1998) An endocytosed TGN38 chimeric protein is delivered to the TGN after trafficking through the endocytic recycling compartment in CHO cells. J Cell Biol 142: 923–936 [DOI] [PMC free article] [PubMed] [Google Scholar]
- Gill DJ, Chia J, Senewiratne J, Bard F (2010) Regulation of O-glycosylation through Golgi-to-ER relocation of initiation enzymes. J Cell Biol 189: 843–858 [DOI] [PMC free article] [PubMed] [Google Scholar]
- Gill DJ, Clausen H, Bard F (2011) Location, location, location: new insights into O-GalNAc protein glycosylation. Trends Cell Biol 21: 149–158 [DOI] [PubMed] [Google Scholar]
- Godi A, Pertile P, Meyers R, Marra P, Di Tullio G, Iurisci C, Luini A, Corda D, De Matteis MA (1999) ARF mediates recruitment of PtdIns-4-OH kinase-beta and stimulates synthesis of PtdIns(4,5)P2 on the Golgi complex. Nat Cell Biol 1: 280–287 [DOI] [PubMed] [Google Scholar]
- Grabenhorst E, Conradt HS (1999) The cytoplasmic, transmembrane, and stem regions of glycosyltransferases specify their in vivo functional sublocalization and stability in the Golgi. J Biol Chem 274: 36107–36116 [DOI] [PubMed] [Google Scholar]
- Harada T, Matsuzaki O, Hayashi H, Sugano S, Matsuda A, Nishida E (2003) AKRL1 and AKRL2 activate the JNK pathway. Genes Cells 8: 493–500 [DOI] [PubMed] [Google Scholar]
- Hicks SW, Machamer CE (2005) Golgi structure in stress sensing and apoptosis. Biochim Biophys Acta 1744: 406–414 [DOI] [PubMed] [Google Scholar]
- Jin T-G (2001) Role of the CDC25 homology domain of phospholipase cepsilon in amplification of Rap1-dependent signaling. J Biol Chem 276: 30301–30307 [DOI] [PubMed] [Google Scholar]
- Jones DH (2000) Type I phosphatidylinositol 4-phosphate 5-kinase directly interacts with ADP-ribosylation factor 1 and Is responsible for phosphatidylinositol 4,5-bisphosphate synthesis in the golgi compartment. J Biol Chem 275: 13962–13966 [DOI] [PubMed] [Google Scholar]
- Kanehisa M, Goto S, Furumichi M, Tanabe M, Hirakawa M (2010) KEGG for representation and analysis of molecular networks involving diseases and drugs. Nucleic Acids Res 38: D355–360 [DOI] [PMC free article] [PubMed] [Google Scholar]
- Kellokumpu S, Sormunen R, Kellokumpu I (2002) Abnormal glycosylation and altered Golgi structure in colorectal cancer: dependence on intra-Golgi pH. FEBS Lett 516: 217–224 [DOI] [PubMed] [Google Scholar]
- Kurokawa M, Mitani K, Yamagata T, Takahashi T, Izutsu K, Ogawa S, Moriguchi T, Nishida E, Yazaki Y, Hirai H (2000) The evi-1 oncoprotein inhibits c-Jun N-terminal kinase and prevents stress-induced cell death. EMBO J 19: 2958–2968 [DOI] [PMC free article] [PubMed] [Google Scholar]
- Lanctot PM, Gage FH, Varki AP (2007) The glycans of stem cells. Curr Opin Chem Biol 11: 373–380 [DOI] [PMC free article] [PubMed] [Google Scholar]
- Lauc G, Rudan I, Campbell H, Rudd PM (2010) Complex genetic regulation of protein glycosylation. Mol Biosyst 6: 329–335 [DOI] [PubMed] [Google Scholar]
- Liljedahl M, Maeda Y, Colanzi A, Ayala I, Van Lint J, Malhotra V (2001) Protein kinase D regulates the fission of cell surface destined transport carriers from the trans-Golgi network. Cell 104: 409–420 [DOI] [PubMed] [Google Scholar]
- Lindmo K, Stenmark H (2006) Regulation of membrane traffic by phosphoinositide 3-kinases. J Cell Sci 119: 605–614 [DOI] [PubMed] [Google Scholar]
- Low PC, Misaki R, Schroder K, Stanley AC, Sweet MJ, Teasdale RD, Vanhaesebroeck B, Meunier FA, Taguchi T, Stow JL (2010) Phosphoinositide 3-kinase δ regulates membrane fission of Golgi carriers for selective cytokine secretion. J Cell Biol 190: 1053–1065 [DOI] [PMC free article] [PubMed] [Google Scholar]
- Lowe M (2011) Structural organization of the Golgi apparatus. Curr Opin Cell Biol 23: 85–93 [DOI] [PubMed] [Google Scholar]
- Mallard F, Tang BL, Galli T, Tenza D, Saint-Pol A, Yue X, Antony C, Hong W, Goud B, Johannes L (2002) Early/recycling endosomes-to-TGN transport involves two SNARE complexes and a Rab6 isoform. J Cell Biol 156: 653–664 [DOI] [PMC free article] [PubMed] [Google Scholar]
- Manning G, Whyte DB, Martinez R, Hunter T, Sudarsanam S (2002) The protein kinase complement of the human genome. Science (New York, NY) 298: 1912–1934 [DOI] [PubMed] [Google Scholar]
- Mayinger P (2011) Signaling at the Golgi. Cold Spring Harb Perspect Biol 3: a005314. [DOI] [PMC free article] [PubMed] [Google Scholar]
- Miller PM, Folkmann AW, Maia ARR, Efimova N, Efimov A, Kaverina I (2009) Golgi-derived CLASP-dependent microtubules control Golgi organization and polarized trafficking in motile cells. Nat Cell Biol 11: 1069–1080 [DOI] [PMC free article] [PubMed] [Google Scholar]
- Miserey-Lenkei S, Chalancon G, Bardin S, Formstecher E, Goud B, Echard A (2010) Rab and actomyosin-dependent fission of transport vesicles at the Golgi complex. Nat Cell Biol 12: 645–654 [DOI] [PubMed] [Google Scholar]
- Moreau D, Kumar P, Wang SC, Chaumet A, Chew SY, Chevalley H, Bard F (2011) Genome-wide RNAi screens identify genes required for ricin and PE intoxications. Dev Cell 21: 231–244 [DOI] [PubMed] [Google Scholar]
- Nakamura N, Wei J-H, Seemann J (2012) Modular organization of the mammalian Golgi apparatus. Curr Opin Cell Biol 24: 467–474 [DOI] [PMC free article] [PubMed] [Google Scholar]
- Narimatsu H, Sawaki H, Kuno A, Kaji H, Ito H, Ikehara Y (2010) A strategy for discovery of cancer glyco-biomarkers in serum using newly developed technologies for glycoproteomics. FEBS J 277: 95–105 [DOI] [PubMed] [Google Scholar]
- Ohtsubo K, Marth JD (2006) Glycosylation in cellular mechanisms of health and disease. Cell 126: 855–867 [DOI] [PubMed] [Google Scholar]
- Orlando KA, Pittman RN (2006) Rho kinase regulates phagocytosis, surface expression of GlcNAc, and Golgi fragmentation of apoptotic PC12 cells. Exp Cell Res 312: 3298–3311 [DOI] [PubMed] [Google Scholar]
- Pavelka M, Ellinger A (1985) Localization of binding sites for concanavalin A, Ricinus communis I and Helix pomatia lectin in the Golgi apparatus of rat small intestinal absorptive cells. J Histochem Cytochem 33: 905–914 [DOI] [PubMed] [Google Scholar]
- Plotnikov A, Zehorai E, Procaccia S, Seger R (2011) The MAPK cascades: signaling components, nuclear roles and mechanisms of nuclear translocation. Biochim Biophys Acta 1813: 1619–1633 [DOI] [PubMed] [Google Scholar]
- Pulvirenti T, Giannotta M, Capestrano M, Capitani M, Pisanu A, Polishchuk RS, San Pietro E, Beznoussenko GV, Mironov AA, Turacchio G, Hsu VW, Sallese M, Luini A (2008) A traffic-activated Golgi-based signalling circuit coordinates the secretory pathway. Nat Cell Biol 10: 912–922 [DOI] [PubMed] [Google Scholar]
- Puthenveedu MA, Bachert C, Puri S, Lanni F, Linstedt AD (2006) GM130 and GRASP65-dependent lateral cisternal fusion allows uniform Golgi-enzyme distribution. Nat Cell Biol 8: 238–248 [DOI] [PubMed] [Google Scholar]
- Qi W, Tang Z, Yu H (2006) Phosphorylation- and polo-box-dependent binding of Plk1 to Bub1 is required for the kinetochore localization of Plk1. Mol Biol Cell 17: 3705–3716 [DOI] [PMC free article] [PubMed] [Google Scholar]
- Quintero CA, Valdez-Taubas J, Ferrari ML, Haedo SD, Maccioni HJF (2008) Calsenilin and CALP interact with the cytoplasmic tail of UDP-Gal:GA2/GM2/GD2 beta-1,3-galactosyltransferase. Biochem J 412: 19–26 [DOI] [PubMed] [Google Scholar]
- Rivinoja A, Hassinen A, Kokkonen N, Kauppila A, Kellokumpu S (2009) Elevated Golgi pH impairs terminal N-glycosylation by inducing mislocalization of Golgi glycosyltransferases. J Cell Physiol 220: 144–154 [DOI] [PubMed] [Google Scholar]
- Ron D, Walter P (2007) Signal integration in the endoplasmic reticulum unfolded protein response. Nat Rev Mol Cell Biol 8: 519–529 [DOI] [PubMed] [Google Scholar]
- Roth J, Wang Y, Eckhardt AE, Hill RL (1994) Subcellular localization of the UDP-N-acetyl-D-galactosamine: polypeptide N-acetylgalactosaminyltransferase-mediated O-glycosylation reaction in the submaxillary gland. Proc Natl Acad Sci USA 91: 8935–8939 [DOI] [PMC free article] [PubMed] [Google Scholar]
- Roth MG (2004) Phosphoinositides in constitutive membrane traffic. Physiol Rev 84: 699–730 [DOI] [PubMed] [Google Scholar]
- Salvarezza SB, Deborde S, Schreiner R, Campagne F, Kessels MM, Qualmann B, Caceres A, Kreitzer G, Rodriguez-Boulan E (2009) LIM kinase 1 and cofilin regulate actin filament population required for dynamin-dependent apical carrier fission from the trans-Golgi network. Mol Biol Cell 20: 438–451 [DOI] [PMC free article] [PubMed] [Google Scholar]
- Sanders LC, Matsumura F, Bokoch GM, de Lanerolle P (1999) Inhibition of myosin light chain kinase by p21-activated kinase. Science (New York, NY) 283: 2083–2085 [DOI] [PubMed] [Google Scholar]
- Santiago-Tirado FH, Bretscher A (2011) Membrane-trafficking sorting hubs: cooperation between PI4P and small GTPases at the trans-Golgi network. Trends Cell Biol 21: 515–525 [DOI] [PMC free article] [PubMed] [Google Scholar]
- Schmitz KR, Liu J, Li S, Setty TG, Wood CS, Burd CG, Ferguson KM (2008) Golgi localization of glycosyltransferases requires a Vps74p oligomer. Dev Cell 14: 523–534 [DOI] [PMC free article] [PubMed] [Google Scholar]
- Sciaky N, Presley J, Smith C, Zaal KJ, Cole N, Moreira JE, Terasaki M, Siggia E, Lippincott-Schwartz J (1997) Golgi tubule traffic and the effects of brefeldin A visualized in living cells. J Cell Biol 139: 1137–1155 [DOI] [PMC free article] [PubMed] [Google Scholar]
- Sengupta D, Linstedt AD (2011) Control of organelle size: the Golgi complex. Annu Rev Cell Dev Biol 27: 57–77 [DOI] [PubMed] [Google Scholar]
- Shorter J, Warren G (2002) Golgi architecture and inheritance. Annu Rev Cell Dev Biol 18: 379–420 [DOI] [PubMed] [Google Scholar]
- Siddhanta A, Backer JM, Shields D (2000) Inhibition of phosphatidic acid synthesis alters the structure of the Golgi apparatus and inhibits secretion in endocrine cells. J Biol Chem 275: 12023–12031 [DOI] [PubMed] [Google Scholar]
- Simmen T, Höning S, Icking A, Tikkanen R, Hunziker W (2002) AP-4 binds basolateral signals and participates in basolateral sorting in epithelial MDCK cells. Nat Cell Biol 4: 154–159 [DOI] [PubMed] [Google Scholar]
- Simpson JC, Joggerst B, Laketa V, Verissimo F, Cetin C, Erfle H, Bexiga MG, Singan VR, Hériché J-K, Neumann B, Mateos A, Blake J, Bechtel S, Benes V, Wiemann S, Ellenberg J, Pepperkok R (2012) Genome-wide RNAi screening identifies human proteins with a regulatory function in the early secretory pathway. Nat Cell Biol 14: 1–13 [DOI] [PubMed] [Google Scholar]
- Stanley P (2011) Golgi glycosylation. Cold Spring Harb Perspect Biol 3: a005199. [DOI] [PMC free article] [PubMed] [Google Scholar]
- Storrie B, White J, Röttger S, Stelzer EH, Suganuma T, Nilsson T (1998) Recycling of golgi-resident glycosyltransferases through the ER reveals a novel pathway and provides an explanation for nocodazole-induced Golgi scattering. J Cell Biol 143: 1505–1521 [DOI] [PMC free article] [PubMed] [Google Scholar]
- Sumara G, Formentini I, Collins S, Sumara I, Windak R, Bodenmiller B, Ramracheya R, Caille D, Jiang H, Platt KA, Meda P, Aebersold R, Rorsman P, Ricci R (2009) Regulation of PKD by the MAPK p38delta in insulin secretion and glucose homeostasis. Cell 136: 235–248 [DOI] [PMC free article] [PubMed] [Google Scholar]
- Sweeney DA (2002) Fragmentation and re-assembly of the golgi apparatus in vitro. A requirement for phosphatidic acid and phosphatidylinositol 4,5-bisphosphate synthesis. J Biol Chem 277: 3030–3039 [DOI] [PubMed] [Google Scholar]
- Thyberg J, Moskalewski S (1999) Role of microtubules in the organization of the Golgi complex. Exp Cell Res 246: 263–279 [DOI] [PubMed] [Google Scholar]
- Tu L, Tai WCS, Chen L, Banfield DK (2008) Signal-mediated dynamic retention of glycosyltransferases in the Golgi. Science (New York, NY) 321: 404–407 [DOI] [PubMed] [Google Scholar]
- Valderrama F, Durán JM, Babià T, Barth H, Renau-Piqueras J, Egea G (2001) Actin microfilaments facilitate the retrograde transport from the Golgi complex to the endoplasmic reticulum in mammalian cells. Traffic 2: 717–726 [DOI] [PubMed] [Google Scholar]
- Vicinanza M, D’Angelo G, Di Campli A, De Matteis MA (2008) Function and dysfunction of the PI system in membrane trafficking. EMBO J 27: 2457–2470 [DOI] [PMC free article] [PubMed] [Google Scholar]
- Vollert CS (2004) The Phox Homology (PX) domain protein interaction network in yeast. Mol Cell Proteomics 3: 1053–1064 [DOI] [PubMed] [Google Scholar]
- von Blume J, Duran JM, Forlanelli E, Alleaume A-M, Egorov M, Polishchuk R, Molina H, Malhotra V (2009) Actin remodeling by ADF/cofilin is required for cargo sorting at the trans-Golgi network. J Cell Biol 187: 1055–1069 [DOI] [PMC free article] [PubMed] [Google Scholar]
- Wang Y, Seemann J, Pypaert M, Shorter J, Warren G (2003) A direct role for GRASP65 as a mitotically regulated Golgi stacking factor. EMBO J 22: 3279–3290 [DOI] [PMC free article] [PubMed] [Google Scholar]
- Wassler MJ, Foote CI, Gelman IH, Shur BD (2001) Functional interaction between the SSeCKS scaffolding protein and the cytoplasmic domain of beta1,4-galactosyltransferase. J Cell Sci 114: 2291–2300 [DOI] [PubMed] [Google Scholar]
- Weixel KM, Blumental-Perry A, Watkins SC, Aridor M, Weisz OA (2005) Distinct Golgi populations of phosphatidylinositol 4-phosphate regulated by phosphatidylinositol 4-kinases. J Biol Chem 280: 10501–10508 [DOI] [PubMed] [Google Scholar]
- Wollscheid B, Bausch-Fluck D, Henderson C, O’Brien R, Bibel M, Schiess R, Aebersold R, Watts JD (2009) Mass-spectrometric identification and relative quantification of N-linked cell surface glycoproteins. Nat Biotechnol 27: 378–386 [DOI] [PMC free article] [PubMed] [Google Scholar]
- Wu Y, Dowbenko D, Pisabarro MT, Dillard-Telm L, Koeppen H, Lasky LA (2001) PTEN 2, a Golgi-associated testis-specific homologue of the PTEN tumor suppressor lipid phosphatase. J Biol Chem 276: 21745–21753 [DOI] [PubMed] [Google Scholar]
- Yadav S, Puri S, Linstedt AD (2009) A primary role for Golgi positioning in directed secretion, cell polarity, and wound healing. Mol Biol Cell 20: 1728–1736 [DOI] [PMC free article] [PubMed] [Google Scholar]
- Yamaguchi N, Fukuda MN (1995) Golgi retention mechanism of beta-1,4-galactosyltransferase. Membrane-spanning domain-dependent homodimerization and association with alpha- and beta-tubulins. J Biol Chem 270: 12170–12176 [DOI] [PubMed] [Google Scholar]
- Young J, Stauber T, Del Nery E, Vernos I, Pepperkok R, Nilsson T (2005) Regulation of microtubule-dependent recycling at the trans-Golgi network by Rab6A and Rab6A&apos. Mol Biol Cell 16: 162–177 [DOI] [PMC free article] [PubMed] [Google Scholar]
- Zacharogianni M, Kondylis V, Tang Y, Farhan H, Xanthakis D, Fuchs F, Boutros M, Rabouille C (2011) ERK7 is a negative regulator of protein secretion in response to amino-acid starvation by modulating Sec16 membrane association. EMBO J 30: 3684–3700 [DOI] [PMC free article] [PubMed] [Google Scholar]
- Zilberstein A, Snider MD, Porter M, Lodish HF (1980) Mutants of vesicular stomatitis virus blocked at different stages in maturation of the viral glycoprotein. Cell 21: 417–427 [DOI] [PubMed] [Google Scholar]
Associated Data
This section collects any data citations, data availability statements, or supplementary materials included in this article.
Supplementary Materials
Supplementary Figures S1-10