

Background: Moderate concentrations of γ-secretase inhibitor increase Aβ production in different scenarios from cell lines to humans.
Results: A mathematical model, including α-, β-, and γ-secretases, is proposed describing Aβ rise.
Conclusion: The Aβ rise is decided by the interplay between the three secretases and not γ-secretase alone.
Significance: This has important implications for the development of drugs targeting Aβ production in Alzheimer disease.
Keywords: Alzheimer disease, Amyloid, Enzyme Kinetics, Mathematical Modeling, Secretases, Amyloid-β Production
Abstract
Amyloid-β (Aβ) is produced by the consecutive cleavage of amyloid precursor protein (APP) first by β-secretase, generating C99, and then by γ-secretase. APP is also cleaved by α-secretase. It is hypothesized that reducing the production of Aβ in the brain may slow the progression of Alzheimer disease. Therefore, different γ-secretase inhibitors have been developed to reduce Aβ production. Paradoxically, it has been shown that low to moderate inhibitor concentrations cause a rise in Aβ production in different cell lines, in different animal models, and also in humans. A mechanistic understanding of the Aβ rise remains elusive. Here, a minimal mathematical model has been developed that quantitatively describes the Aβ dynamics in cell lines that exhibit the rise as well as in cell lines that do not. The model includes steps of APP processing through both the so-called amyloidogenic pathway and the so-called non-amyloidogenic pathway. It is shown that the cross-talk between these two pathways accounts for the increase in Aβ production in response to inhibitor, i.e. an increase in C99 will inhibit the non-amyloidogenic pathway, redirecting APP to be cleaved by β-secretase, leading to an additional increase in C99 that overcomes the loss in γ-secretase activity. With a minor extension, the model also describes plasma Aβ profiles observed in humans upon dosing with a γ-secretase inhibitor. In conclusion, this mechanistic model rationalizes a series of experimental results that spans from in vitro to in vivo and to humans. This has important implications for the development of drugs targeting Aβ production in Alzheimer disease.
Introduction
AD2 is a progressive neurological disorder. It leads to a loss of neurons and cognitive function and ultimately to dementia. It is characterized by the deposition of insoluble plaques of aggregated Aβ in the brain (1, 2). Increased levels of amyloidogenic Aβ peptides and aggregates are believed to play a major role in the pathogenesis of the disease.
Aβ peptides are produced by sequential proteolysis of APP (3, 4). Mutations in APP have been genetically linked to cases of familial AD (5). The three main enzymes involved in APP proteolysis are the α-, β-, and γ-secretases. Initially, APP must be cleaved by α- or β-secretase, and then the cleavage products of both enzymes are further processed by γ-secretase. α-Secretase, believed to be one of the ADAM (a disintegrin and metalloproteinase) family of proteases, most likely ADAM-10 (6, 7), cleaves APP at position 17 to produce C83. This leads to the so-called non-amyloidogenic pathway with further processing of C83 by γ-secretase. β-secretase cleaves APP principally at position 1 to produce C99 (8). This leads to the amyloidogenic pathway with further processing by γ-secretase (4, 9, 10) producing different Aβ subspecies, in particular Aβ1–40 and Aβ1–42. In addition, α-secretase can cleave the product of β-secretase, C99, at position 17 to produce C83 (6, 11).
In the hunt for AD therapies, inhibition of Aβ production via γ-secretase has had a large focus (9, 12–15). Initial efforts focused on GSI, of which a number have reached the clinic.
Interestingly, the inhibition of γ-secretase generates contradictory behaviors depending on the system. As we expect, the addition of inhibitors of γ-secretase in cell-free assays produces a monotonic decrease in the production of Aβ (13, 16–20). However, in vitro concentration-response curves for a wide range of inhibitors show two types of behaviors consistently depending on the cell line used (13, 21). In some cell lines, the Aβ production decreases with inhibitor concentration as for the cell-free assay. Other cell lines show a biphasic behavior with a maximal production of Aβ at intermediate inhibitor concentrations. In line with the in vitro results, both behaviors have been observed in numerous animal models (22–25). Consistent with these observations, in clinical trials, a rise in Aβ plasma levels has also been reported (12, 26, 27).
Disappointingly, although γ-secretase inhibitors have reached late stage clinical trials, none have resulted in significant improvement for the patients. As the GSIs demonstrate biphasic behavior in vitro and in plasma, it is difficult to interpret the net impact on brain Aβ levels and so evaluate whether the lack of clinical efficacy is due to an Aβ increase or not (28). Understanding the mechanism of Aβ processing will not only help to understand the GSI-induced biphasic behavior but also help to assess whether other therapeutic approaches such as inhibition of β-secretase will have similar liability.
The present study has two aims. The first aim is to develop a mathematical model to describe Aβ dynamics based on the known interplay between these three secretases and to identify and analyze the factors in the amyloid processing pathway that contribute to the rise in Aβ levels at low inhibitor concentrations. We shall demonstrate that the degree of competition of the pathway intermediates, C99 and APP, for α-secretase determines this behavior. The second aim is to examine whether the Aβ formation model can quantitatively describe in vitro dose-response experiments in different cell lines as well as the temporal profile of plasma Aβ1–40 upon dosing of Semagacestat, a GSI, at different doses in healthy human volunteers.
MATERIALS AND METHODS
In Vitro Model Implementation and Simulation
Models were implemented as a system of linked ordinary differential equations using Mathematica 8 and the R language for statistical computing (version 2.14.1). Analytic solutions of equations were derived using Mathematica.
Parameter estimation in log space was conducted in R using the pso package. Numerical solutions to the ordinary differential equation system were computed using the deSolve library in R, with an analytical Jacobian calculated in Mathematica. Initial conditions for intermediate species were set to be their steady-state concentrations in the absence of GSI, with other species set to zero. The model was integrated for the same period of time spanned by experimental or clinical observations.
The objective function used is
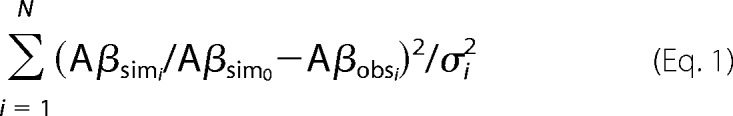 |
where Aβsim0 is the simulation in the absence of compound, Aβsimi is the amount of Aβ produced after adding compound at concentration Xi, Aβobsi is the corresponding experimentally observed amount relative to base line with standard deviation σi, and N is the number of concentrations observed.
We applied a traditional hypothesis testing approach to evaluate the fitting of the model to the experimental data. An F test was performed to calculate the difference between the full model and the reduced model, which accounts for the model without drug. Additionally, the residual errors of the model relative to the residual errors of the reduced model are reported, and the plot of the residuals is provided in the supplemental material.
Clinical Model Implementation and Simulation
A one-compartment pharmacokinetic model with absorption was fitted using the time profile of the compound in plasma. The pharmacokinetic model is described by a pair of ordinary differential equations, representing the rate of change of concentration of drug in the gut, Xg, and in plasma, Xp
where ka is the absorption parameter from the gut, V is the plasma volume distribution, and kCl represents clearance of the drug by the body. Because not all the drug is available to affect γ-secretase activity, the drug plasma concentration is scaled by the effective inhibitor fraction, feff, to form the concentration, X, modifying the activity of the pathway, i.e.
RESULTS
Building a Core Model That Accounts for the Generation of Aβ Peptides
The guiding principle for the development of the model was to discern the minimal relevant processes able to explain the majority of experimental data concerning the behavior of the modeled system. We built a minimal network of amyloid metabolism derived from published studies (3, 4, 6, 8–10), in particular around APP degradation leading to Aβ formation. The model encompasses the core steps in the synthesis of Aβ (Fig. 1); it does not distinguish between different Aβ subspecies, such as Aβ1–40 or Aβ1–42. In brief, the model contains six steps and five species, i.e. APP, C99 and C83, Aβ, and p3. Five of the six steps, i.e. r1 to r5, are catalyzed by α-, β-, and γ-secretase enzymes, and the sixth reaction, r0, accounts for the independent APP production. Additionally, we assumed that α- and β-secretase are the only enzymes that degrade APP. The α- and β-secretase cleavage products, C83 and C99, respectively, are degraded by γ-secretase. In addition, α-secretase can process C99 into C83. The reaction rates governing these reactions are unknown. We propose that the processing steps obey Michaelis-Menten kinetics and that there is a constant production rate for APP (Table 1). Equations 5–9 shows the mass balance for all the species represented in Fig. 1,
The symbol vri,j represents the rate of reaction ri catalyzed by the secretase j, i.e. with j = α, β, or γ. Meanwhile, vr0 represents the constant production rate of APP by reaction r0. It is assumed that the GSIs influence γ-secretase cleavage by mixed inhibition (Table 2).
FIGURE 1.
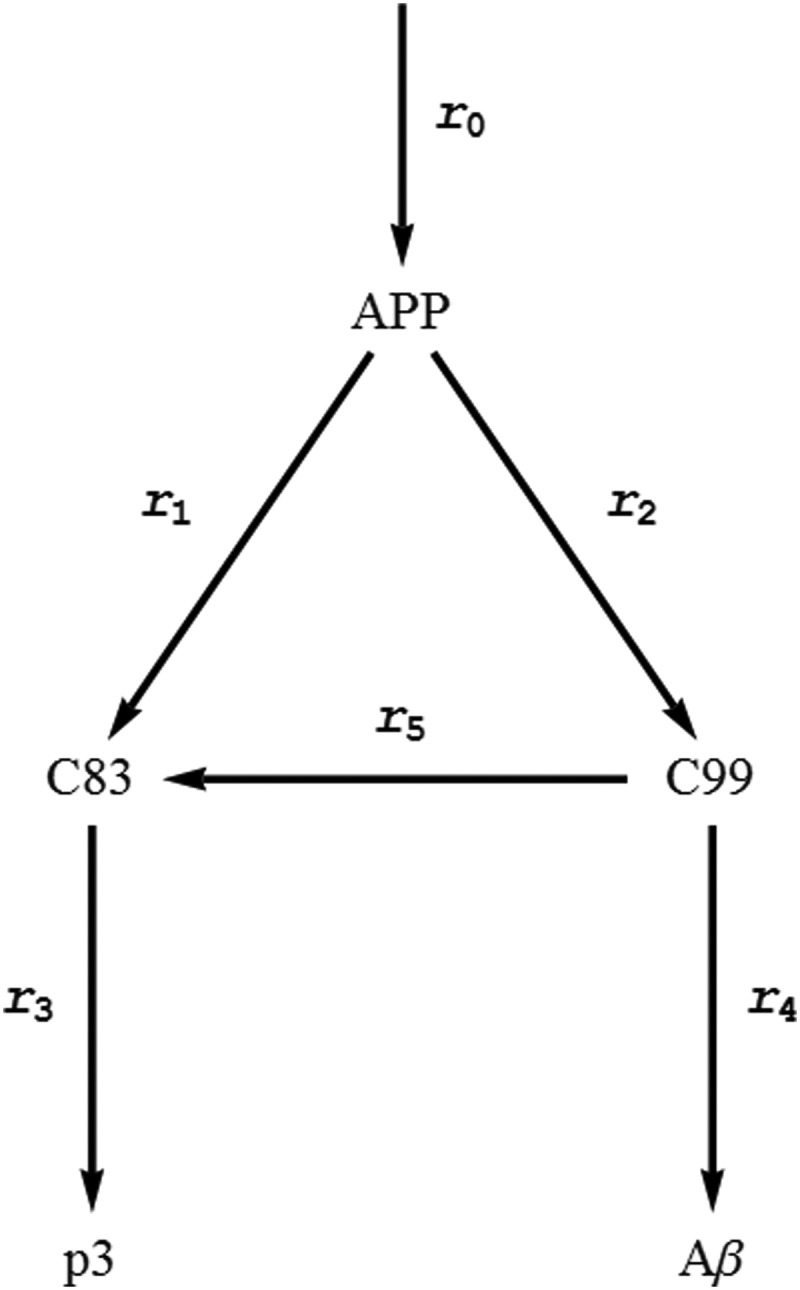
Schematic representation of the reactions leading to Aβ production. In the scheme, six reactions are represented. Three secretases, α, β, and γ, catalyze five of these reactions. Reactions r1 and r5 are catalyzed by α-secretase; r3 and r4 are catalyzed by γ-secretase; and r2 is catalyzed by β-secretase. In addition, the system has one reaction, r0, accounting for APP production. The final product of the non-amyloidogenic branch, reaction r3, is designated as p3.
TABLE 1.
Reactions and Rate equations included in the model
All the enzymatic steps follow a Michaelis-Menten mechanism. The parameters of the Michaelis-Menten equations are Vmi and Kmi where subscript i represents the reaction ri with i = 0 to 5. The reactions catalysed by α-secretase, r1 and r5, have a slightly more complicated rate equations (vr1,α and vr5,α) since there are two competing substrates, C99 and APP, that individually give Michaelis-Menten kinetics when studied separately (40, 41). The same applies for the rate equations depending on γ-secretase, vr3,γ and vr4,γ, where C99 and C83 are substrates competing for this enzyme. vr,j represents the rate of reaction ri catalyze by secretase j, with j = α, β or γ and i = 1 to 5. vr0 is the rate of reaction r0.
| Reaction | Secretase | Reaction rate |
|---|---|---|
| r0 (→ APP) | vr0 = constant | |
| r1 (APP → C83) | α | |
| r2 (APP → C99) | β | |
| r3 (C83 → p3) | γ | |
| r4 (C99 → Aβ) | γ | |
| r5 (C99 → C83) | α |
TABLE 2.
Rate equations describing the effect of a γ-secretase inhibitor on the steps catalyzed by γ-secretase
It is assumed that the inhibitor compounds act on γ-secretase via a mixed inhibition on γ-secretase. In the model, γ-secretase catalyzes the cleavage of two different substrates, i.e. C83 and C99. This leads to slightly more complicated equations where KX describes the dissociation constant of the free γ- secretase to the inhibitor X. On the other hand, Ki1, Ki2 stand for the dissociation constant of the enzyme complexes with the C83, C99 substrates respectively, to the inhibitor. As it is described in Table 1, the parameters of the Michaelis-Menten equations are Vmi and Kmi where subscript i represent the reaction ri.
| Reaction | Secretase | Reaction Rate in the presence of inhibitor (X) |
|---|---|---|
| r3 (C83 → p3) | γ | |
| r4 (C99 → Aβ) | γ |
a Den = 1 + C83/Km3(1 + X/Ki1)/(1 + X/KX) + C99/Km4(1 + X/Ki2)/(1 + X/K X).
First Order Kinetics Cannot Produce an Increase in Aβ in Response to a γ-Secretase Inhibitor
Mathematical equations can be derived to show that an increase in Aβ in response to a GSI cannot occur when the enzymes operate in the linear region. For convenience, assume that the γ-secretase enzyme is inhibited noncompetitively by the compound X, i.e. Ki1 = Ki2 = Ki3 = KX. In addition, assume that all the enzymes described in Table 1 operate in the unsaturated region where the Km values are much larger than the intermediate concentration values. Under these conditions, an analytical expression for the steady-state rate of production of Aβ, vr4,γ, is obtained by substituting these rate expressions into Equations 5–9 and solving for the Aβ production rate (see supplemental Section 1)
 |
where X is the inhibitor concentration and ki = Vmi/Kmi, with i = 1–5.
This expression decreases monotonically with increasing concentration of X for all parameter set values. Thus, with the three secretases operating in the linear kinetic regime, one can only observe a decrease in Aβ production for increasing concentrations of inhibitor, X. It can be shown that this result still applies if we relax the condition of linear kinetics for β- and γ-secretase (see supplemental Section 1).
Saturation Kinetics for α-Secretase Is Required to Display an Increase in Aβ
In the previous section, we showed that first order kinetics cannot produce the increase in Aβ production on application of a GSI. We therefore decided to investigate the impact of including saturation on α-secretase. To simplify the problem, we adopt the following simplifications. (i) β- and γ-Secretase follow linear kinetics. (ii) APP operates in the linear region of α-secretase (APP/Km1 ≪ 1), but this enzyme can display saturation with respect to C99. (iii) Reaction rates for reactions 1–4 have equal values for the ratios ki = Vmi/Kmi
 k; meanwhile, the ratio for step 5 (k5 = Vm5/Km5) can adopt any positive value with respect to k. Introducing these rate equations into Equations 5–9, we solve for the intermediates at steady state. More importantly, we derive an expression for the production rate of Aβ, vr4,γ
versus X (see supplemental Section 2), and the variation of the rate with respect to the inhibitor concentration is calculated. The resulting expression is shown in Fig. 2.
k; meanwhile, the ratio for step 5 (k5 = Vm5/Km5) can adopt any positive value with respect to k. Introducing these rate equations into Equations 5–9, we solve for the intermediates at steady state. More importantly, we derive an expression for the production rate of Aβ, vr4,γ
versus X (see supplemental Section 2), and the variation of the rate with respect to the inhibitor concentration is calculated. The resulting expression is shown in Fig. 2.
FIGURE 2.

Initial variation of Aβ production rate at low GSI concentration. On the y axis is shown the slope change of the production rate of Aβ in response to low inhibitor concentration for a range of Michaelis-Menten constant of α-secretase with respect to C99, Km5. The two families of curves shown were calculated using vr0 0.1 and 2, and for each value, different k5/k ratios uniformly distributed in the [0.1, 1] range. The positive (negative) values represent a rise (decrease) in Aβ rate production when a small amount of inhibitor is added into the system.
In this minimal kinetics model, an increase of Aβ production as a consequence of an inhibition of γ-secretase can only be achieved with α-secretase operating toward the low region of Michaelis-Menten constant values for C99, i.e. for low values of Km5. In fact, it can be observed that there exists a maximal positive slope of this rate for intermediate Km5 values (Fig. 2).
On the other hand, the ratio between the specificity constants for the two steps catalyzed by α-secretase (step 5 and 1), i.e. k5/k, and the ratio vr0/k also play a role in determining the magnitude of the Aβ induction, ∂vr4,γ/∂X|X→0. It is observed that a lower ratio, k5/k, contributes to a larger rise in Aβ in the presence of inhibitor. Furthermore, the larger the value of vr0/k, the more pronounced the effect. The minimal model thus leads us to the conclusion that saturation of α-secretase by C99 is required for Aβ induction through the inhibition of γ-secretase.
The above analysis was done with β- and γ-secretase operating in the linear regime. The kinetic conditions of the two secretases are important for the rise in Aβ. For γ-secretase, the linear regime allows the enzyme to increase its activity in the presence of a moderate concentration of GSI when enough C99 is accumulated. However, this window decreases and eventually disappears as the enzyme reaches saturation. In the case of β-secretase, saturation by APP would imply that the production of C99 remains constant irrespective of the GSI concentration. Consequently, the addition of GSI would produce a drop in Aβ production because no additional C99 could be produced. This is contrary to the situation where β-secretase operates in unsaturated conditions that allow any increase in APP to carry through to C99.
The Model Describes the Profile of Aβ in Response to γ-Secretase Inhibitors in HEK APPwt and HEK APPswe Cell Lines
In the previous section, we demonstrated that this simplified secretase network together with simple rate laws can generate the main qualitative behaviors of the Aβ profile in the presence of a GSI. Here, we demonstrate that the model can quantitatively recapitulate in vitro data. It has been reported that dose-response curves of Aβ1–40/Aβ1–42 against GSIs have two different behaviors depending on the cell type where the compounds are tested (13, 17, 21, 29). For example, it has been shown that in HEK cell lines stably transfected with wild-type APP (HEK APPwt), a biphasic response in the levels of Aβ occurs on treatment with increasing concentrations of GSI. Conversely, in HEK cell lines stably transfected with the Swedish mutation of APP (HEK APPswe), the same pharmacological agents and range of concentrations produce a monotonic decrease in Aβ levels (Fig. 3).
FIGURE 3.

Quantitative modeling of the Aβ response across a range of inhibitor concentrations in HEK APPwt and HEK APPswe cell lines. Experimental data are displayed as follows: HEK APPwt (closed symbols) and HEK APPswe (open symbols) with the inhibitors DAPT (circle) and DPH-111122 (square). The model simulation fits are shown as lines. Solid lines correspond to Aβ levels of HEK APPwt and HEK APPswe treated with DAPT, and the dashed lines correspond to the treatment with DPH-111122. The Aβ levels are represented as the percentage of change with respect to Aβ level at the reference steady state, i.e. AβX= 0. For model residual error, residual errors = 3.2%. F test statistics, F = 59, p value < 10−12. The residual plot shows a good fit (supplemental Fig. S1). The experimental data used were extracted from the literature (13). Error bars indicate S.E.
The vast majority of the parameters of the model (Tables 1 and 2) are not available in the literature. Even the influx and efflux to this system are unknown. We therefore decided to perform parameter estimation by fitting the model to all the data shown in Fig. 3. The rationale behind this decision is that if the model can reproduce the experimentally observed behaviors, it will increase our confidence that the underlying principles governing the Aβ profile under γ-secretase inhibition are explained by the model. The model parameters were classified into several groups for the purposes of fitting to the experimental data. The parameters associated with the inhibitor action (Kic, Ki1, Ki2) were classified as inhibitor parameters, and there is one inhibitor parameter set for each compound. The values of parameters describing the intrinsic system properties (Vmi and Kmi) depend on the particular cell line considered. However, the only significant difference between HEK APPwt and HEK APPswe is in the kinetic properties of β-secretase cleavage of APP (30). We therefore constrained the kinetic parameters of the system by representing the difference between these two cell lines solely through the kinetic parameter values of β-secretase, i.e. Vm2 and Km2.
All the parameter values were simultaneously adjusted until the model accurately reproduced the measurements shown in Fig. 3 (supplemental Table S1). It is observed that the model can quantitatively reproduce both wild-type and mutant behaviors for different inhibitors. According to the model, the parameters associated with the inhibition play an important role in determining the concentration at which the maximal amount of Aβ is produced as well as the range of concentrations across which rebound is observed. However, the existence of the rebound or its magnitude is determined by the intrinsic properties of the system.
To assess the predictive capacity of this model, we decided to compare the model results with additional independent experiments (13). In particular, it has been observed that HEK APPwt cells transfected with increasing amounts of C99 DNA construct show a decrease in Aβ rebound when they are treated with a range of inhibitor concentrations (Fig. 4A, inset). To model this, a constant production of C99 was added to the core model. Using the parameter set previously estimated for the APPwt system, we simulated the response of the system to increasing doses of inhibitor with differing levels of C99 production (Fig. 4A, supplemental Section 3). The model qualitatively describes the experimentally observed secreted Aβ dose response in the presence of increasing basal C99 concentrations.
FIGURE 4.

GSI dose-response curves for Aβ and p3. A, changes in the profile of Aβ at different initial C99 concentrations. The experimental data displayed in the inset shows that Aβ rise decreases with increasing initial concentration of C99 (13). The model simulations show that the same phenomenon is displayed by the proposed model when the initial C99 concentration is increased by including an independent C99 supply. B, predicted responses of p3 in the system to increasing GSI concentrations. The black line is the prediction for HEK APPwt for DAPT (solid line) and DPH-111122 (dashed line). Meanwhile, the gray line is the prediction for HEK APPswe to DAPT (solid line) and DPH-111122 (dashed line).
In addition, we can use the model to predict the profile of the non-amyloidogenic pathway and the response of this pathway to different GSI concentrations (Fig. 4B). First, it is observed that the pathway product (p3) is unable to display a rise in the presence of a GSI contrary to the amyloidogenic pathway (Fig. 3). Overall, the model displays a monotonic decrease in p3 levels by adding GSI. However, the simulations emulating the Aβ profile of HEK APPwt and APPswe show quantitative differences. p3 levels remain almost constant in the range of GSI concentrations where there is a rise in Aβ, for the HEK APPwt model. Meanwhile, this does not occur for the APPswe model.
Model Reproduces Clinical Aβ Profile in Response to Semagacestat
To capitalize on our success at fitting the in vitro data with our model, we decided to investigate whether the results from a clinical trial of a GSI, Semagacestat, could be reproduced (27). The trial data comprise measurements of plasma Aβ40 over a 24-h period following a dose of the compound in 25 healthy Japanese volunteers. The volunteers were dosed with 40, 100, or 140 mg of Semagacestat.
To describe these data, we use our in vitro model with some small modifications. 1) The time evolution of the compound concentration is modeled using a one-compartment pharmacokinetic model with absorption (see “Materials and Methods”). 2) Because produced Aβ will be broken down via physiological mechanisms, we augment the in vitro model (Equations 5–9) by incorporating a first order term representing the degradation of Aβ within the term describing the temporal variation of Aβ concentration. This leads to the following expression
where kdeg is a constant that accounts for the degradation of Aβ by physiological mechanisms.
Semagacestat in vitro dose-response data from Jamsa et al. (21) were used to fit the in vitro model, whereas the pharmacokinetic model was fitted using the concentration of the drug in plasma available from the trial data (supplemental Section 4 supplemental Fig. S2 and supplemental Tables S2 and S3). Finally, the in vitro parameter values for Semagacestat, i.e. Vmi and Kmi, were combined with the pharmacokinetic parameter values, i.e. ka, V, and kCl, and a third optimization was performed to determine the parameters unique to the combined model, i.e. feff and kdeg, by using the profile of Aβ in plasma at different concentrations of Semagacestat (Fig. 5).
FIGURE 5.

Changes in plasma Aβ profile in healthy human volunteers after a single oral administration of the GSI Semagacestat. Plasma Aβ40 levels were measured at three Semagacestat concentrations: 40 mg (■), 100 mg (●), and 140 mg (♦). The model quantitative describes Aβ40 levels at the three doses (40 mg, solid line; 100 mg, dashed line; and 140 mg, dot dashed line). The model also describes the profile of Semagacestat in plasma shown in the inset. For model residual error, residual errors = 11%. F test statistics, F = 10.7, p value < 10−5. The residual plot is shown in supplemental Fig. S3. Error bars indicate S.E.
By solely adjusting the remaining two parameters of the model and using the previously established fits to the in vitro observations and pharmacokinetic profile of Semagacestat, we were able to reproduce the clinical trial results (27), as shown in Fig. 5. The obtained estimates are 3.1 h for the half-life of Aβ in plasma and 0.05 h for the effective inhibitor fraction.
DISCUSSION
That γ-secretase inhibition can lead to an increase in the production rate of its Aβ product has been reported in several in vitro and in vivo systems (12, 13, 21–23, 27). However, no mechanism has been proposed to explain the origin of this paradoxical behavior by only inhibiting this enzyme.
In this study, we show that a basic network structure around γ-secretase allows the system to show Aβ rebound, or induction, at certain inhibitor doses. The three properties of the system that contribute to this behavior are: (i) γ-secretase operates at least in part in the first order kinetic region (i.e. it is not saturated in normal function); (ii) consumption of APP by α-secretase is inhibited by the intermediate C99; and (iii) β-secretase operates in the first order kinetic region (i.e. it is not saturated).
A simple explanation for the kinetic results is as follows. When a GSI is added to the normal, APPwt, system, it produces an increase in the concentration of the substrate, C99. In a simple linear system, this cannot lead to an increase of production because the increase in substrate is not enough to compensate for the reduction in available enzyme. However, in this system, such an increase in C99 will inhibit the consumption of APP by α-secretase (reaction r1) because C99 and APP are substrates that compete for α-secretase. Due to this drop in α-secretase cleavage of APP, an additional part of the APP produced is instead available for cleavage by β-secretase, leading to even more C99. This additional increase in C99 is able to overcompensate for the loss in activity of γ-secretase caused by low doses of inhibitor, leading to a greater production of Aβ under mild inhibition of γ-secretase. Eventually, at higher GSI concentration, the additional C99 produced is unable to compensate for the drop in enzymatic activity. In comparison, in the APPswe system, there is already a large pool of C99 as a consequence of the increase in β-secretase activity caused by the mutation. Thus, γ-secretase mediated cleavage of C99 is already saturated. In this situation, the buildup of C99 as a consequence of the γ-secretase inhibition cannot further increase its activity, and therefore, no rise is observed.
The predictions of our model are supported by in vitro experimental observations. As shown in Fig. 4, the model predicts a decrease in the magnitude of the Aβ rebound as the production of C99 increases in the system. This is in line with experiments where HEK APPwt cells were transfected with different levels of C99 DNA construct (13). As the C99 reference concentration increases, γ-secretase is further saturated, thereby decreasing the window of drug concentration where a rise in Aβ could be observed.
In addition, our minimal model shows that the output of the non-amyloidogenic pathway does not increase but remains almost constant in the range of GSI at which Aβ is rising. This is supported by recent reports showing that the products of the degradation of C83 by γ-secretase, p3 and amyloid intracellular domain (AICD), decrease slightly in this GSI concentration range (13, 31). In this pathway, the model shows that the inhibition of γ-secretase is accompanied by increased C83. The source of this increase is the C99 cleavage by α-secretase, step r5. We have also observed that in basal conditions, GSI = 0, the rate of production of the non-amyloidogenic branch, vr3,γ, is highly insensitive to changes in γ-secretase levels, which allows us to deduce that the intermediate C83 is controlling the rate of production of the end product (supplemental Section 5, supplemental Fig. S4). Supporting this observation, independent research groups have shown, using different cell line systems, that C83 is the limiting factor in the production of p3 and AICD (31). Additionally, the model shows the same qualitative behavior under the influence of combined β- and γ-secretase inhibition as reported in Ref. 21. When compared with only β-secretase inhibition, if the γ-secretase inhibition is in the promoting region of concentration, the β-secretase inhibitor potency is reduced, whereas a high level of γ-secretase inhibition increases the potency of the β-secretase inhibitor.
The model proposed imposes little restriction on the protease identity, as long as the function is conserved. That is to say that α-secretase cleaves both APP and C99 and that β-secretase cleaves APPswe with a greater efficiency than APPwt (5, 30). There have recently been suggestions that BACE1 is not the constitutive β-secretase and that this role belongs to one of the cathepsins (32, 33). These suggestions are compatible with our hypothesis; a cathepsin, or any other enzyme, can play the role of β-secretase, without altering the conclusions of the model.
In addition to the rise in Aβ, the shape of the profile is another interesting aspect to analyze. Using the model, we observed that the maximum Aβ production depends on the kinetic properties of the three secretases and the APP production rate but not on the GSI kinetic properties. This indicates that specific GSIs cannot be differentiated by their maximal Aβ rise. This is in accordance with numerous in vivo experiments using specific GSIs where it is shown that the rise is a 2-fold increase over basal levels.3 In contrast to this, it has been shown in in vitro studies in HEK APPwt that the magnitude of the Aβ rise is compound-dependent (13). The model observations are based on the fact that the only component modulated is γ-secretase and that all other properties of the system remain unaffected by compound. A small degree of nonspecificity in compounds could easily explain this apparent discrepancy between the model and experimental results.
This model is to our knowledge the first mathematical model that explains the Aβ rise with a direct mechanism between the GSI and γ-secretase using simple kinetic rate laws. The inhibitor only interacts with γ-secretase, and the inhibitor inhibits γ-secretase activity at any constant concentration of the substrate C99. Previous models have explained the rise by off-target effect, e.g. inhibiting Aβ clearance (34, 35). However, the fact that a wide structural variety of GSIs causes the rebound in different models favors a direct mechanism as the principle driver of the Aβ rise. A recent report proposed that presenilin, a γ-secretase component, is in a dimeric form in which at low concentration the inhibitor binds to one site, increasing the activity of the other site by conformational change (31). However, that model cannot account for the absence of rebound in HEK APPswe and for the slight decrease in the production rate of p3 and AICD. In addition, it has been consistently reported that the inhibition of solubilized human γ-secretase does not provoke the Aβ rise at low GSI concentrations (13, 17, 19, 20, 36). These pure γ-secretase enzyme assay results are in agreement with our model predictions, suggesting that it is not only the enzyme γ-secretase that dictates this paradoxical behavior. Our model does not distinguish between different Aβ species, but if desired, a simple extension of the γ-secretase kinetics should be sufficient to account for Aβ1–42 and Aβ1–40 profiles.
A current challenge in biology is the translation of in vitro findings to in vivo models and in particular to human studies. Having established a model describing the Aβ profile in HEK APPwt and APPswe cell lines, we next studied the ability of the model to recapitulate the Aβ plasma profile of human subjects that were treated with Semagacestat. We show that the model can account for the observed Aβ profile for the three administered GSI doses. The predicted Aβ plasma half-life is ∼3.1 h, although no human data have been published to confirm this. However, this value is consistent with the observed half-life of 8.4 h in cerebrospinal fluid in clinical subjects (37) because observations in preclinical species show a greater periphery clearance than cerebrospinal fluid clearance (38, 39).
This minimal model could have widespread impact on the development of drugs targeting Aβ production in AD. The fact that a GSI can induce Aβ production raises important questions for experimental and clinical investigation of Aβ processing and ultimately AD that are beyond the scope of this study. The model described herein can be used to inform decisions about in vitro cell lines and in vivo models used in such studies. It opens the way for more accurate predictions of effects in the brain from measurements of plasma and cerebrospinal fluid Aβ. It can be used to investigate the implications of alternative therapies, such as β-secretase inhibition or α-secretase promotion, as well as combination therapies. All in all, it paves the path for line of sight from the bench to the clinic.
Supplementary Material

This article contains supplemental Sections 1–5, Tables S1–S3, and Figs. S1–S4.
S. A. G. Visser, unpublished data.
- AD
- Alzheimer disease
- Aβ
- amyloid-β
- APP
- amyloid precursor protein
- GSI
- γ-secretase inhibitor
- AICD
- amyloid intracellular domain
- DAPT
- N-[N-(3,5-difluorophenacetyl)-l-alanyl]-(S)-phenylglycine t-butyl ester.
REFERENCES
- 1. Selkoe D. J., Schenk D. (2003) Alzheimer's disease: molecular understanding predicts amyloid-based therapeutics. Annu. Rev. Pharmacol. Toxicol. 43, 545–584 [DOI] [PubMed] [Google Scholar]
- 2. Korczyn A. D. (2008) The amyloid cascade hypothesis. Alzheimers Dement. 4, 176–178 [DOI] [PubMed] [Google Scholar]
- 3. De Strooper B. (2010) Proteases and proteolysis in Alzheimer disease: a multifactorial view on the disease process. Physiol. Rev. 90, 465–494 [DOI] [PubMed] [Google Scholar]
- 4. Prox J., Rittger A., Saftig P. (2012) Physiological functions of the amyloid precursor protein secretases ADAM10, BACE1, and Presenilin. Exp. Brain Res. 217, 331–341 [DOI] [PubMed] [Google Scholar]
- 5. Citron M., Oltersdorf T., Haass C., McConlogue L., Hung A. Y., Seubert P., Vigo-Pelfrey C., Lieberburg I., Selkoe D. J. (1992) Mutation of the β-amyloid precursor protein in familial Alzheimer's disease increases β-protein production. Nature 360, 672–674 [DOI] [PubMed] [Google Scholar]
- 6. Kuhn P. H., Wang H., Dislich B., Colombo A., Zeitschel U., Ellwart J. W., Kremmer E., Rossner S., Lichtenthaler S. F. (2010) ADAM10 is the physiologically relevant, constitutive α-secretase of the amyloid precursor protein in primary neurons. EMBO J. 29, 3020–3032 [DOI] [PMC free article] [PubMed] [Google Scholar]
- 7. Asai M., Hattori C., Szabó B., Sasagawa N., Maruyama K., Tanuma S., Ishiura S. (2003) Putative function of ADAM9, ADAM10, and ADAM17 as APP α-secretase. Biochem. Biophys. Res. Commun. 301, 231–235 [DOI] [PubMed] [Google Scholar]
- 8. Vassar R., Bennett B. D., Babu-Khan S., Kahn S., Mendiaz E. A., Denis P., Teplow D. B., Ross S., Amarante P., Loeloff R., Luo Y., Fisher S., Fuller J., Edenson S., Lile J., Jarosinski M. A., Biere A. L., Curran E., Burgess T., Louis J. C., Collins F., Treanor J., Rogers G., Citron M. (1999) β-Secretase cleavage of Alzheimer's amyloid precursor protein by the transmembrane aspartic protease BACE. Science 286, 735–741 [DOI] [PubMed] [Google Scholar]
- 9. Yagishita S., Morishima-Kawashima M., Tanimura Y., Ishiura S., Ihara Y. (2006) DAPT-induced intracellular accumulations of longer amyloid β-proteins: further implications for the mechanism of intramembrane cleavage by γ-secretase. Biochemistry 45, 3952–3960 [DOI] [PubMed] [Google Scholar]
- 10. Zhang L., Song L., Terracina G., Liu Y., Pramanik B., Parker E. (2001) Biochemical characterization of the γ-secretase activity that produces β-amyloid peptides. Biochemistry 40, 5049–5055 [DOI] [PubMed] [Google Scholar]
- 11. Jäger S., Leuchtenberger S., Martin A., Czirr E., Wesselowski J., Dieckmann M., Waldron E., Korth C., Koo E. H., Heneka M., Weggen S., Pietrzik C. U. (2009) α-Secretase mediated conversion of the amyloid precursor protein derived membrane stub C99 to C83 limits Aβ generation. J. Neurochem. 111, 1369–1382 [DOI] [PubMed] [Google Scholar]
- 12. Siemers E. R., Dean R. A., Friedrich S., Ferguson-Sells L., Gonzales C., Farlow M. R., May P. C. (2007) Safety, tolerability, and effects on plasma and cerebrospinal fluid amyloid-β after inhibition of γ-secretase. Clin. Neuropharmacol. 30, 317–325 [DOI] [PubMed] [Google Scholar]
- 13. Burton C. R., Meredith J. E., Barten D. M., Goldstein M. E., Krause C. M., Kieras C. J., Sisk L., Iben L. G., Polson C., Thompson M. W., Lin X. A., Corsa J., Fiedler T., Pierdomenico M., Cao Y., Roach A. H., Cantone J. L., Ford M. J., Drexler D. M., Olson R. E., Yang M. G., Bergstrom C. P., McElhone K. E., Bronson J. J., Macor J. E., Blat Y., Grafstrom R. H., Stern A. M., Seiffert D. A., Zaczek R., Albright C. F., Toyn J. H. (2008) The amyloid-β rise and γ-secretase inhibitor potency depend on the level of substrate expression. J. Biol. Chem. 283, 22992–23003 [DOI] [PubMed] [Google Scholar]
- 14. Wolfe M. S., Citron M., Diehl T. S., Xia W., Donkor I. O., Selkoe D. J. (1998) A substrate-based difluoro ketone selectively inhibits Alzheimer's γ-secretase activity. J. Med. Chem. 41, 6–9 [DOI] [PubMed] [Google Scholar]
- 15. Uemura K., Lill C. M., Li X., Peters J. A., Ivanov A., Fan Z., DeStrooper B., Bacskai B. J., Hyman B. T., Berezovska O. (2009) Allosteric modulation of PS1/γ-secretase conformation correlates with amyloid β42/40 ratio. PLoS One 4, e7893. [DOI] [PMC free article] [PubMed] [Google Scholar]
- 16. McLendon C., Xin T., Ziani-Cherif C., Murphy M. P., Findlay K. A., Lewis P. A., Pinnix I., Sambamurti K., Wang R., Fauq A., Golde T. E. (2000) Cell-free assays for γ-secretase activity. FASEB J. 14, 2383–2386 [DOI] [PubMed] [Google Scholar]
- 17. Martone R. L., Zhou H., Atchison K., Comery T., Xu J. Z., Huang X., Gong X., Jin M., Kreft A., Harrison B., Mayer S. C., Aschmies S., Gonzales C., Zaleska M. M., Riddell D. R., Wagner E., Lu P., Sun S. C., Sonnenberg-Reines J., Oganesian A., Adkins K., Leach M. W., Clarke D. W., Huryn D., Abou-Gharbia M., Magolda R., Bard J., Frick G., Raje S., Forlow S. B., Balliet C., Burczynski M. E., Reinhart P. H., Wan H. I., Pangalos M. N., Jacobsen J. S. (2009) Begacestat (GSI-953): a novel, selective thiophene sulfonamide inhibitor of amyloid precursor protein γ-secretase for the treatment of Alzheimer's disease. J. Pharmacol. Exp. Ther. 331, 598–608 [DOI] [PubMed] [Google Scholar]
- 18. Li Y. M., Xu M., Lai M. T., Huang Q., Castro J. L., DiMuzio-Mower J., Harrison T., Lellis C., Nadin A., Neduvelil J. G., Register R. B., Sardana M. K., Shearman M. S., Smith A. L., Shi X. P., Yin K. C., Shafer J. A., Gardell S. J. (2000) Photoactivated γ-secretase inhibitors directed to the active site covalently label presenilin 1. Nature 405, 689–694 [DOI] [PubMed] [Google Scholar]
- 19. Osenkowski P., Ye W., Wang R., Wolfe M. S., Selkoe D. J. (2008) Direct and potent regulation of γ-secretase by its lipid microenvironment. J. Biol. Chem. 283, 22529–22540 [DOI] [PMC free article] [PubMed] [Google Scholar]
- 20. Tian G., Sobotka-Briner C. D., Zysk J., Liu X., Birr C., Sylvester M. A., Edwards P. D., Scott C. D., Greenberg B. D. (2002) Linear non-competitive inhibition of solubilized human γ-secretase by pepstatin A methylester, L685458, sulfonamides, and benzodiazepines. J. Biol. Chem. 277, 31499–31505 [DOI] [PubMed] [Google Scholar]
- 21. Jämsä A., Belda O., Edlund M., Lindström E. (2011) BACE-1 inhibition prevents the γ-secretase inhibitor evoked Aβ rise in human neuroblastoma SH-SY5Y cells. J. Biomed. Sci. 18, 76. [DOI] [PMC free article] [PubMed] [Google Scholar]
- 22. Cook J. J., Wildsmith K. R., Gilberto D. B., Holahan M. A., Kinney G. G., Mathers P. D., Michener M. S., Price E. A., Shearman M. S., Simon A. J., Wang J. X., Wu G., Yarasheski K. E., Bateman R. J. (2010) Acute γ-secretase inhibition of nonhuman primate CNS shifts amyloid precursor protein (APP) metabolism from amyloid-β production to alternative APP fragments without amyloid-β rebound. J. Neurosci. 30, 6743–6750 [DOI] [PMC free article] [PubMed] [Google Scholar]
- 23. Lanz T. A., Hosley J. D., Adams W. J., Merchant K. M. (2004) Studies of Aβ pharmacodynamics in the brain, cerebrospinal fluid, and plasma in young (plaque-free) Tg2576 Mice using the γ-secretase inhibitor N2-[(2S)-2-(3,5-difluorophenyl)-2-hydroxyethanoyl]-N1-[(7S)-5-methyl-6-oxo-6,7-dihydro-5H-dibenzo[b,d]azepin-7-yl]-l-alaninamide (LY-411575). J. Pharmacol. Exp. Ther. 309, 49–55 [DOI] [PubMed] [Google Scholar]
- 24. Lu Y., Zhang L., Nolan C. E., Becker S. L., Atchison K., Robshaw A. E., Pustilnik L. R., Osgood S. M., Miller E. H., Stepan A. F., Subramanyam C., Efremov I., Hallgren A. J., Riddell D. (2011) Quantitative pharmacokinetic/pharmacodynamic analyses suggest that 129/SVE mouse is a suitable preclinical pharmacology model for identifying small molecule γ-secretase inhibitors. J. Pharmacol. Exp. Ther. 339, 922–934 [DOI] [PubMed] [Google Scholar]
- 25. Prasad C. V., Zheng M., Vig S., Bergstrom C., Smith D. W., Gao Q., Yeola S., Polson C. T., Corsa J. A., Guss V. L., Loo A., Wang J., Sleczka B. G., Dangler C., Robertson B. J., Hendrick J. P., Roberts S. B., Barten D. M. (2007) Discovery of (S)-2-((S)-2-(3,5-difluorophenyl)-2-hydroxyacetamido)-N-((S,Z)-3-methyl-4-oxo-4,5-dihydro-3H-benzo[d][1,2]diazepin-5-yl)propanamide (BMS-433796): a γ-secretase inhibitor with Aβ lowering activity in a transgenic mouse model of Alzheimer's disease. Bioorg. Med. Chem. Lett. 17, 4006–4011 [DOI] [PubMed] [Google Scholar]
- 26. Dockens R., Wang J. S., Castaneda L., Sverdlov O., Huang S. P., Slemmon R., Gu H., Wong O., Li H., Berman R. M., Smith C., Albright C. F., Tong G. (2012) Clin. Pharmacokinet. 51, 681–693 [DOI] [PubMed] [Google Scholar]
- 27. Kumamoto M., Nakano M., Uenaka K., Lowe S., Nishiuma S., Nakamichi N., Dean R., Siemers E., Mohs R. (2008) P4–379: Safety, tolerability, pharmacokinetics, and pharmacodynamics of multiple-dose administration of a γ-secretase inhibitor in Japanese subjects. Alzheimers Dement. 4, T785 [Google Scholar]
- 28. Niva C., Parkinson J., Olsson F., van Schaick E., Lundkvist J., Visser S. A. G. (2012) Has inhibition of Aβ production adequately been tested as therapeutic approach in mild AD? A model-based meta-analysis of γ-secretase inhibitor data. (2013) Eur. J. Clin. Pharmacol., in press [DOI] [PubMed] [Google Scholar]
- 29. Lanz T. A., Karmilowicz M. J., Wood K. M., Pozdnyakov N., Du P., Piotrowski M. A., Brown T. M., Nolan C. E., Richter K. E. G., Finley J. E., Fei Q., Ebbinghaus C. F., Chen Y. L., Spracklin D. K., Tate B., Geoghegan K. F., Lau L. F., Auperin D. D., Schachter J. B. (2006) Concentration-dependent modulation of amyloid-β in vivo and in vitro using the γ-secretase inhibitor, LY-450139. J. Pharmacol. Exp. Ther. 319, 924–933 [DOI] [PubMed] [Google Scholar]
- 30. Tomasselli A. G., Qahwash I., Emmons T. L., Lu Y., Leone J. W., Lull J. M., Fok K. F., Bannow C. A., Smith C. W., Bienkowski M. J., Heinrikson R. L., Yan R. (2003) Employing a superior BACE1 cleavage sequence to probe cellular APP processing. J. Neurochem. 84, 1006–1017 [DOI] [PubMed] [Google Scholar]
- 31. Barthet G., Shioi J., Shao Z., Ren Y., Georgakopoulos A., Robakis N. K. (2011) Inhibitors of γ-secretase stabilize the complex and differentially affect processing of amyloid precursor protein and other substrates. FASEB J. 25, 2937–2946 [DOI] [PMC free article] [PubMed] [Google Scholar]
- 32. Hook V. Y., Kindy M., Hook G. (2008) Inhibitors of cathepsin B improve memory and reduce β-amyloid in transgenic Alzheimer disease mice expressing the wild-type, but not the Swedish mutant, β-secretase site of the amyloid precursor protein. J. Biol. Chem. 283, 7745–7753 [DOI] [PubMed] [Google Scholar]
- 33. Hook V., Schechter I., Demuth H. U., Hook G. (2008) Alternative pathways for production of β-amyloid peptides of Alzheimer's disease. Biol. Chem. 389, 993–1006 [DOI] [PMC free article] [PubMed] [Google Scholar]
- 34. Durkin J. T., Murthy S., Husten E. J., Trusko S. P., Savage M. J., Rotella D. P., Greenberg B. D., Siman R. (1999) Rank-order of potencies for inhibition of the secretion of Aβ40 and Aβ42 suggests that both are generated by a single γ-secretase. J. Biol. Chem. 274, 20499–20504 [DOI] [PubMed] [Google Scholar]
- 35. Das R., Nachbar R. B., Edelstein-Keshet L., Saltzman J. S., Wiener M. C., Bagchi A., Bailey J., Coombs D., Simon A. J., Hargreaves R. J., Cook J. J. (2011) Modeling effect of a γ-secretase inhibitor on amyloid-β dynamics reveals significant role of an amyloid clearance mechanism. Bull. Math. Biol. 73, 230–247 [DOI] [PubMed] [Google Scholar]
- 36. Fraering P. C., Ye W., LaVoie M. J., Ostaszewski B. L., Selkoe D. J., Wolfe M. S. (2005) γ-Secretase substrate selectivity can be modulated directly via interaction with a nucleotide-binding site. J. Biol. Chem. 280, 41987–41996 [DOI] [PMC free article] [PubMed] [Google Scholar]
- 37. Bateman R. J., Munsell L. Y., Morris J. C., Swarm R., Yarasheski K. E., Holtzman D. M. (2006) Human amyloid-β synthesis and clearance rates as measured in cerebrospinal fluid in vivo. Nat. Med. 12, 856–861 [DOI] [PMC free article] [PubMed] [Google Scholar]
- 38. Cirrito J. R., May P. C., O'Dell M. A., Taylor J. W., Parsadanian M., Cramer J. W., Audia J. E., Nissen J. S., Bales K. R., Paul S. M., DeMattos R. B., Holtzman D. M. (2003) In vivo assessment of brain interstitial fluid with microdialysis reveals plaque-associated changes in amyloid-β metabolism and half-life. J. Neurosci. 23, 8844–8853 [DOI] [PMC free article] [PubMed] [Google Scholar]
- 39. Hone E., Martins I. J., Fonte J., Martins R. N. (2003) Apolipoprotein E influences amyloid-β clearance from the murine periphery. J. Alzheimers Dis. 5, 1–8 [DOI] [PubMed] [Google Scholar]
- 40. Ortega F., Acerenza L., Westerhoff H. V., Mas F., Cascante M. (2002) Product dependence and bifunctionality compromise the ultrasensitivity of signal transduction cascades. Proc. Natl. Acad. Sci. U.S.A. 99, 1170–1175 [DOI] [PMC free article] [PubMed] [Google Scholar]
- 41. Ortega F., Garcés J. L., Mas F., Kholodenko B. N., Cascante M. (2006) Bistability from double phosphorylation in signal transduction. FEBS J. 273, 3915–3926 [DOI] [PubMed] [Google Scholar]
Associated Data
This section collects any data citations, data availability statements, or supplementary materials included in this article.