

SUMMARY
The Staphylococcus aureus accessory gene regulator (agr) is a peptide signaling system that regulates the production of secreted virulence factors required to cause infections. The signal controlling agr function is a 7–9 residue thiolactone-containing peptide called an autoinducing peptide (AIP) that is biosynthesized from the AgrD precursor by the membrane peptidase AgrB. To gain insight into AgrB and AgrD function, the agrBD genes were mutagenized and screened for deficiencies in AIP production. In total, single-site mutations at 14 different residues in AgrD were identified and another 20 within AgrB. In AgrD, novel mutations were characterized in the N-terminal leader and throughout the central region encoding the AIP signal. In AgrB, most mutations blocked peptidase activity, but mutations in the K129-K131 residues were defective in a later step in AIP biosynthesis, separating the peptidase function from thiolactone ring formation and AIP transport. With the identification of residues in AgrB essential for AgrD processing, we reevaluated the membrane topology and the new model predicts four transmembrane helices and a potential reentrant loop on the cytoplasmic face. Finally, coimmunoprecipitation studies indicate that AgrB forms oligomeric structures within the membrane. These studies provide further insight into the unique structural and functional properties of AgrB.
INTRODUCTION
Staphylococcus aureus is a versatile bacterial pathogen responsible for significant disease burden in developed countries and throughout the world (Diekema et al., 2001). S. aureus lives as a commensal organism in approximately 30% of the healthy adult population and can transition into a formidable pathogen that can cause a diverse range of acute and chronic infections (Gorwitz et al., 2008, Lowy, 1998). Much of the acute pathogenic properties can be attributed to a secreted arsenal of virulence factors that includes toxins, immunomodulators, proteases, and other secreted enzymes that enable host invasion. Given that S. aureus secretes many destructive agents, careful regulation of their production is critical for the dual lifestyle as a commensal and a pathogen.
Like many Gram-positive pathogens, S. aureus contains a peptide-based quorum-sensing system that regulates gene expression (Novick & Geisinger, 2008, Thoendel et al., 2011). This system, named the accessory gene regulator (agr), is a prominent regulator of virulence factor production in S. aureus (Dunman et al., 2001). The important contribution of agr to pathogenesis has been confirmed in multiple animal models of infection (Bubeck Wardenburg et al., 2007, Heyer et al., 2002, Abdelnour et al., 1993, Montgomery et al., 2010, Wright et al., 2005). At the molecular level, the agr chromosomal locus is composed of two divergent transcripts called RNAII and RNAIII, driven by the action of the P2 and P3 promoters, respectively. The RNAII transcript encompasses the agrBDCA operon, encoding the core components of the quorum-sensing system, while the divergently transcribed RNAIII is a regulatory RNA and the primary effector of the agr system (Novick et al., 1995, Novick et al., 1993). In the agrBDCA operon, the AgrB and AgrD proteins are necessary for production of the peptide signal (also called autoinducing peptide or AIP) (Ji et al., 1995), while AgrC and AgrA form a two-component sensory pair that detects the signal (Novick et al., 1995). AgrD type I is the 46-residue peptide precursor of the AIP signal and is composed of three parts: an N-terminal amphipathic leader, a middle region of eight residues that becomes the final AIP structure, and a charged C-terminal tail. The active form of AIP is an eight-residue peptide with the last five residues constrained in a thiolactone ring through internal linkage to a cysteine side chain (Ji et al., 1995).
S. aureus has evolved an intriguing mechanism of processing AgrD into the final AIP structure, and the integral membrane endopeptidase AgrB is the primary contributor to this pathway. According to current proposals (Thoendel & Horswill, 2009), AgrB removes the AgrD C-terminal tail and forms an enzyme bound intermediate with the remaining portions of AgrD. Through a poorly understood mechanism, the AgrD internal cysteine (C28) catalyzes thiolactone ring formation through thioester exchange, and this new AIP-intermediate is transported across the cell membrane, presumably through AgrB action. On the extracellular face, the housekeeping SpsB signal peptidase removes the N-terminal amphipathic leader to release the active form of AIP (Kavanaugh et al., 2007). Once AIP accumulates to a critical concentration, the signal will bind to the AgrC surface receptor, activating the AgrC-AgrA two-component cascade (Novick et al., 1995, Lina et al., 1998). The result is an autoactivation of the agr system through upregulation of agrBDCA and parallel amplification of the RNAIII effector (Novick et al., 1993). The following reviews are available for a more complete picture of agr system components and function (Thoendel et al., 2011, Novick & Geisinger, 2008, Novick, 2003).
While it is known that AgrB, AgrD, and SpsB are needed for AIP production, many of the mechanistic details in the AIP biosynthesis pathway remain unclear. In particular, little is known about the essential regions of AgrB that contribute to the various steps in the biosynthetic pathway. To date, only two individual residues, H77 and C84, have been identified as being important for AgrB activity; these residues are proposed to form the protease catalytic center (Qiu et al., 2005). Since the cleavage of AgrD is the first catalytic step, it is not clear what regions of AgrB are important for other steps in AIP biosynthesis, such as cyclization and transport of AIP across the membrane.
To further our understanding of AIP biosynthesis, we developed a screening approach to identify new residues important for AgrB function. Numerous AgrD and AgrB mutations were uncovered that blocked AIP production and many of these reduced peptidase activity, but one AgrB region was identified that is essential for later steps in AIP biosynthesis. To complement these studies, we reassessed the AgrB membrane topology and performed preliminary studies to test whether AgrB assembles into an oligomer. Overall these studies provide further insight into the structure and function of AgrB and mechanism of AIP production.
RESULTS
Identification of essential AgrB and AgrD residues
To gain more insight into AIP biosynthesis, the agrBD genes were randomly mutagenized to identify residues essential for AIP production (Supplemental Figure S1). All studies in this report were performed using components from the agr type I system. Error-prone PCR was used to amplify the agrBD genes followed by ligation into the pEPSA5 shuttle vector (Forsyth et al., 2002). This approach allowed for expression of AgrB and AgrD in E. coli or S. aureus, and we previously demonstrated that heterologous expression of these proteins enables the synthesis and secretion of AIP (Thoendel & Horswill, 2009). A S. aureus lux-based reporter strain was used to test mutants for AIP production (Jensen et al., 2008). E. coli transformants containing mutated agrBD genes in pEPSA5 were grown individually in microtiter plates, and spent media was collected and tested for AIP production using the S. aureus reporter strain (Supplemental Figure S1). E. coli transformants that resulted in <10% of the bioassay bioluminescence were selected, the AIP production phenotype was confirmed in a retest, and the agrBD genes in the best candidates were sequenced to identify mutations.
A total of 6,240 colonies were screened for AIP production. Many of the non-producers possessed plasmids that did not contain agrBD, had nonsense mutations, or had agrBD genes with multiple mutations that complicated the downstream interpretation. A total of 35 single-site mutations at 20 different sites in AgrB were initially identified (Table 2), and another 34 mutations at 14 different sites in AgrD, all that prevented AIP production using the lux-based reporter strain.
Table 2.
AgrB and AgrD point mutations identified in this study
| Amino Acid Change | Nucleotide Change | # Isolates | % AIP in E. coli | % AIP in S. aureus | Cleavagec |
|---|---|---|---|---|---|
| AgrB a | |||||
| F26Y | T77A | 1 | 6 | 55 | Yes |
| G32V | G95T | 1 | 4 | 21 | N/Dd |
| Q34P | A101C | 2 | 3 | 19 | N/D |
| K38R | A113G | 1 | 6 | 58 | Yes |
| N39D | A115G | 2 | 7 | 67 | Yes |
| N39I | A116T | 2 | 4 | 12 | No |
| N39Y | A115T | 1 | 4 | 5 | No |
| M46K | T137A | 1 | 45 | 95 | N/D |
| N63S | A188G | 2 | 28 | 81 | Yese |
| R70G | A208G | 2 | 4 | 67 | No |
| R70K | G209A | 1 | 4 | 5 | Yese |
| G75C | G223T | 1 | 3 | 4 | No |
| G75S | G223A | 1 | 4 | 34 | No |
| H77R | A230G | 2 | 4 | 3 | No |
| A78C | C233T | 1 | 4 | 4 | No |
| C84R | T250C | 1 | 3 | 3 | No |
| P125H | C374A | 1 | 4 | 3 | No |
| T128I | C383T | 1 | 4 | 7 | No |
| K131E | A391G | 3 | 4 | 4 | Yes |
| Y144N | T430A | 1 | 70 | 88 | Yes |
| S149R | A445A | 1 | 3 | 3 | N/D |
| G170D | G509A | 1 | 5 | 60 | N/D |
| I173L | A517T | 1 | 100 | 191 | Yes |
| I176T | T527C | 1 | 6 | 77 | Yes |
| AgrD b | |||||
| Start-ACG | T568C | 1 | |||
| Start-ATA | G569A | 1 | |||
| G20D | G625A | 1 | 3 | No | |
| I22N | T631A | 1 | 11 | Yes | |
| Y25C | A640G | 2 | 2 | ||
| S26G | A642G | 1 | 8 | ||
| T27P | A645C | 1 | 1 | ||
| C28R | T648C | 2 | 2 | ||
| D29A | A652C | 1 | 1 | ||
| D29V | A652T | 1 | 1 | ||
| F30I | T654A | 1 | 2 | Yes | |
| F30L | T654C | 6 | 2 | Yes | |
| F30S | T655C | 2 | 2 | No | |
| I31T | T658C | 1 | 2 | Yes | |
| M32V | A660G | 1 | 2 | No | |
| D33V | A664T | 1 | |||
| E34D | A668T | 1 | |||
| E34G | A668G | 2 | |||
| E34K | G666A | 2 | |||
| E34V | A667T | 1 | |||
| L41S | T688C | 1 | |||
“% AIP” refers to the relative amount of AIP produced compared to wild-type agrB in E. coli or S. aureus. In the standard curve, 4% was the background level of luminescence in the AIP activation bioassay.
“% AIP” refers to the relative amount of AIP produced compared to wild-type agrD in E. coli. In the standard curve, 3% was the background level of luminescence in the AIP activation bioassay.
“Cleavage” column indicates whether an AgrD product was observed in the AgrB peptidase assay.
N/D indicates not detected. Neither full-length nor cleaved AgrD was observed in the peptidase assay.
Indicates that two prominent AgrD cleavage products were observed in the peptidase assay.
Mutations in AgrD
Thirty-four mutants were isolated with single residue changes in AgrD that prevented activation of the AIP reporter (Table 2 and Fig. 1A). These mutations were spread among 14 different residues located throughout all three regions of the peptide. Mutations in three residues in the C-terminal tail (D33, E34 and L41) were isolated, all three of which were previously reported as essential for AgrB cleavage (Thoendel & Horswill, 2009). Of interest, two mutations in the N-terminal leader (G20D and I22N) were also isolated that disrupted AIP production. While the AgrD N-terminal leader is known to be essential for AIP production (Zhang et al., 2004), G20 and I22 are the first specific residues identified in this leader as being important for function. G20 is the only leader residue that is absolutely conserved among all known staphylococcal AgrD peptides, while I22 is located in the –3 site of the putative signal peptidase cleavage site and is not well conserved (Thoendel et al., 2011). In subsequent testing, the G20D mutation completely blocked AIP production, while the I22N mutation reduced levels by 89% (Table 2 and Fig. 1B). To understand how these mutations inhibit AIP biosynthesis, the ability of AgrB to process these peptides was tested. We assessed AgrB cleavage of the AgrD C-terminal tail in the presence and absence of these mutations using an immunoblot assay (Thoendel & Horswill, 2009). When examining the immunoblot, the same unknown band that we previously observed at ~10 kDa (Thoendel & Horswill, 2009) is apparent in some AgrB reactions (Fig. 1C). In followup analysis using S. aureus as an expression host, we determined that the band is an artifact of performing the processing assays in E. coli (data not shown), and thus has no bearing on the results. Occasionally the product of the AgrB cleavage reaction also migrates as a doublet for reasons that are not clear (see WT lane, Fig. 1C). In testing the N-terminal AgrD mutations, the His6-AgrD(G20D) peptide was not cleaved by AgrB, while His6-AgrD(I22N) was cleaved in the same manner as the wild-type peptide (Fig. 1C). This observation suggests that the I22N mutation disrupts an AIP-processing step downstream of AgrB cleavage.
Figure 1.
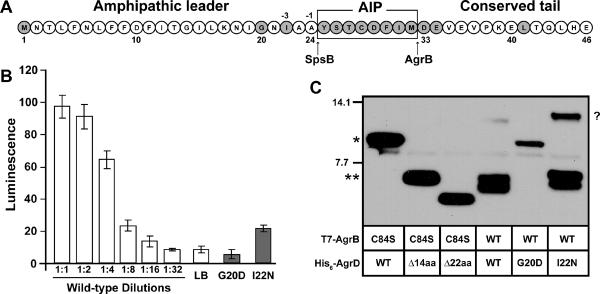
AgrD point mutations. A. Sequence of the AgrD peptide. Mutated residues identified in the screen are shaded gray. Arrows point to cleavage sites for AgrB and SpsB. B. AIP activation bioassay with the mutations in the N-terminal leader. T7-AgrB was expressed with wild-type, G20D or I22N His6-AgrD point mutants in E. coli using the pCOLA-Duet plasmid. Supernatants were collected and added to the ROJ143 AIP-lux reporter strain for one hour after which luminescence was measured. C. Peptidase assay of AgrD point mutants. AgrB cleavage of the AgrD C-terminus was tested by separating cell lysates from E. coli expressing T7-AgrB and His6-tagged AgrD mutations by SDS-PAGE and immunoblotting using anti-His antibodies. For interpretation of the cleavage assay, “*” indicates full-length His6-AgrD and the lane with T7-AgrB C84S combined with wild-type (WT) His6-AgrD is the positive control. “**” indicates cleaved His6-AgrD with C-terminal domain removed and the lane with T7-AgrB C84S combined with Δ14aa His6-AgrD is the positive control. The Δ22 lane is also shown to indicate T7-AgrB C84S combined with His6-AgrD with C-terminal domain and AIP residues removed. “?” indicates unknown band in immunoblot.
Most of the isolates (17 total) contained mutations in the eight-residue central portion that becomes the final AIP structure. Only one mutant (S26G) retained measurable AIP production as determined by the AIP activation bioassay (Fig 2A). Structure-activity relationship (SAR) studies have demonstrated that each of these eight residues is important for binding and activating the AgrC receptor (Lyon et al., 2002, McDowell et al., 2001). To understand how these AgrD mutations might inhibit AIP biosynthesis, the ability of AgrB to process these peptides was tested. AgrB cleavage of the mutant AgrD's was assessed using the immunoblot assay (Fig. 2B). The F30S and M32V mutants were not cleaved by AgrB, while three of the mutants (F30I, F30L and I31T) were cleaved. For the mutants susceptible to cleavage, either a later step in processing is disrupted or an AIP structure is produced that cannot bind productively to any of the four AgrC receptors. Similar as Figure 1C, the doublet migration of the AgrB cleavage product was observed in this experiment. Interestingly it was not observed using the characterized C28A mutant (Thoendel & Horswill, 2009), suggesting that it could be related to altered mobility of cyclized AIP, although further confirmation would be necessary.
Figure 2.
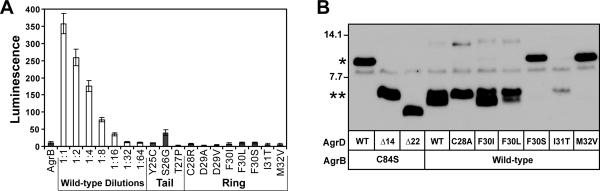
Point mutations in the AIP-encoding sequence of AgrD. A. AIP activation bioassay with the mutations in the AIP-encoding region of AgrD. AgrB and AgrD point mutants were expressed from pEPSA5 in E. coli, supernatants were added to the ROJ143 AIP-lux reporter, and luminescence was measured to detect the presence of AIP. B. Peptidase assay of select AIP point mutations. AgrB cleavage of the AgrD C-terminus was tested by separating cell lysates from E. coli expressing T7-AgrB and His6-tagged AgrD mutations by SDS-PAGE and immunoblotting using anti-His antibodies. “*” indicates full-length His6-AgrD and “**” indicates cleaved His6-AgrD with the C-terminus removed, and the control lanes are described in Figure 1.
Mutations in AgrB
To confirm the screening results, mutants were retested for the production of AIP in E. coli (Supplemental Figure S1 and Fig. 3A). The relative activity of the mutants compared to wild-type was calculated by creating a dose response curve from serial dilutions of control supernatant (Fig. 4A, bars on right). Due to background luminescence measurements, mutants with no AgrB activity (e.g. C84R or H77R) still had approximately 4% luminescence (Table 2). This reassessment demonstrated that some of the isolated mutants were only partially defective in AIP production. Eight mutants maintained some AIP production (5–70%), while another one (I173L) produced AIP at a level similar to wild-type AgrB.
Figure 3.
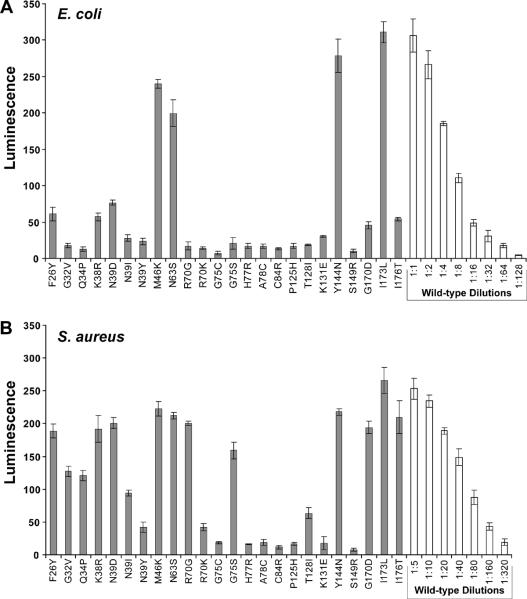
AIP activation bioassay with AgrB point mutants. A. Bioassay for AIP using supernatants from E. coli expressing mutated pEPSA5-agrBD. X-axis labels indicate the AgrB mutation being tested. Supernatants were filtered, added to the ROJ143 reporter strain for one hour and bioluminescence was measured. B. AIP bioassay of same AgrB point mutants expressed in S. aureus Δagr mutant strain AH1292. Supernatants from S. aureus were filtered and diluted 1:10 in TSB before being added to the ROJ143 reporter. Serial dilutions of wild-type supernatants were used to calculate the relative percent of AIP produced in each mutant compared to wild-type pEPSA5-agrBD (see Table 2). Experiments were performed in triplicate and bars represent the standard error of the mean.
Figure 4.
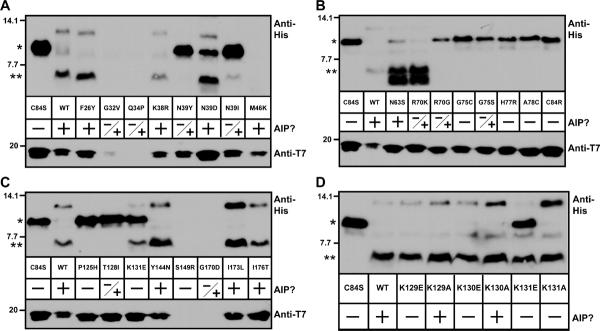
Peptidase assay results with AgrB point mutants. In each panel, T7-tagged AgrB mutants were expressed along with His6-AgrD in E. coli. Cleavage of His6-AgrD was determined through immunoblots for the His6 tag (upper blots). Lower blots show the presence of T7-AgrB as detected with anti-T7-HRP. Also in the panels, “+” indicates whether any AIP is detectable when the AgrB mutant is expressed in E. coli and S. aureus, “−“ indicates no AIP was made in either. “−/+” indicates that AIP is made in S. aureus but not E. coli. Panel A, AgrB mutations F26Y to M46K; panel B, N63S to C84R; panel C, P125H to I176T; and panel D, K129A/E to K131A/E. For interpretation of the cleavage assay, “*” indicates full-length His6-AgrD, and “**” indicates cleaved His6-AgrD with the C-terminal 14 residues removed.
The mutations in AgrB that impacted AIP production were spread throughout the protein (Table 2). Using the published topology map as a guide (Supplemental Fig. S2A) (Zhang et al., 2002), the mutations occurred in the well-conserved N-terminus, the transmembrane passes, and in the exposed cytoplasmic and extracellular loops. Supporting previous studies, the known catalytic residues H77 and C84 were each identified in the screen, both as mutations to arginine (Qiu et al., 2005). In some cases, the same amino acid position (N39, R70 and G75) was identified several times in the screen as different mutations. Not surprisingly, varying degrees of inhibition were observed depending on the amino acid substitution.
To confirm that the mutations identified were relevant to AIP production in S. aureus, we purified the plasmids containing mutated AgrB and transformed them into a USA300 LAC Δagr strain (AH1292) to test for AIP production (Supplemental Figure S1). Our goal in this retest was to eliminate artifacts that may have emerged from performing the screen in E. coli. AIP production was compared to USA300 LAC Δagr carrying the positive control pAgrD1 plasmid.
In S. aureus, some AgrB mutations behaved in an identical manner as in E. coli, while others displayed a new AIP production pattern (Table 2 and Fig. 3B). Seven of the mutants (G75C, H77R, A78C, C84R, P125H, K131E and S149R) retained their phenotype and continued to display an AIP production defect (≤4% vs. wild-type). In contrast, seven other mutations (G32V, Q34P, N39I, N39Y, R70G, R70K, G75S, T128I and G170D) were defective in E. coli but partially functional in S. aureus, producing between 5% and 67% AIP compared to wild-type levels. Some of these differences could be attributable to the sensitivity of the AIP assay. Based on dose-response curves with the lux reporter, S. aureus produced more AIP with this expression system than E. coli (comparing wild-type dilutions in Fig 3A vs. 3B), which may have dampened the AgrB mutant phenotypes in S. aureus.
Effect of AgrB mutations on protein stability
To understand how the various mutations were affecting AgrB function, AgrB stability was assessed by immunoblotting for an N-terminal T7 epitope (Fig. 4A–C, lower blots). These immunoblots indicated that some mutations did result in unstable AgrB protein. Interestingly, two mutations in the conserved N-terminal region (G32V and Q34P) resulted in destabilized AgrB. Further into the protein, two other mutations (S149R and G170D) introduced a charged residue within a transmembrane segment based on the published topology map ((Zhang et al., 2002) and Supplemental Figure 2A), potentially affecting the behavior of these regions in the membrane and destabilizing the protein.
Mutations that resulted in unstable AgrB revealed an interesting phenotype in which the AgrD propeptide is no longer detectable (Fig. 4A–C, upper blots). This phenomenon was also observed during previous studies when expressing full-length His6-AgrD or truncated variants in the absence of AgrB (data not shown).
Effect of AgrB mutations on proteolytic activity
Each mutant that blocked AIP production was tested in the immunoblot peptidase assay to assess AgrB peptidase activity. A range of phenotypes was observed in the immunoblots (Fig. 4A, upper blots). For AgrB mutants that resulted in AIP production that reached 5% or more of the USA300 LAC level (Table 2; shown as a “+” in Fig. 4), normal cleavage of AgrD was observed. Two of these mutants (N63S and R70K) consistently revealed a second, smaller cleavage product than the removed C-terminal tail (Fig. 4B). While this band is sometimes seen as a faint product using wild-type AgrB (Fig. 1C and 2B), in repeated side-by-side tests it is especially pronounced when expressing the AgrB N63S and R70K mutants (data not shown).
In AgrB mutants that did not produce AIP (Table 2, AIP levels 4% or less of wild-type), loss of peptidase activity on AgrD was a common phenotype. These mutants were located in either the N-terminal domain (N39Y and N39I; Fig. 4A), the transmembrane segments (R70G, G75C, G75S, P125H and T128I; Fig. 4B–C), or the first cytoplasmic loop between transmembrane regions 2 and 3 (H77R, A78C, C84R; Fig. 4B). Identifying mutations near this cytoplasmic loop was not surprising given catalytic residues (H77 and C84) are in close proximity.
The K131E mutant in particular had an interesting cleavage phenotype. AgrB K131E was able to cleave AgrD; however no AIP was detectable in the supernatant of E. coli or S. aureus cultures. This phenotype suggests that steps downstream of AgrD cleavage are being disrupted, either the cyclization of the peptide into a thiolactone or transport of AIP across the membrane. Notably, this mutant is the first example of a case where AgrB proteolytic activity was separated from later steps in AIP processing.
Mutations in lysines near K131 show similar phenotypes
To better understand the phenotype of the AgrB K131E mutant, we investigated the effects of mutations on nearby lysine residues. K131 is the third in a row of three consecutive lysines (K129–K131). To investigate whether these other residues (K129 and K130) had similar function as K131, site-directed mutations of K129 to a glutamate and an alanine (K129A, K129E) and K130 also to a glutamate and an alanine (K130A, K130E) were generated. To complete the set of mutations, we also constructed a K131A mutant. Coupled with the K131E mutant from the screen, these six residue substitutions in this region were characterized to assess the effect of swapping charge or changing the lysine to a neutral side chain. The AgrB K129E and K130E mutants showed a similar phenotype to the original K131E mutant with retained peptidase activity, but no ability to produce functional AIP (Fig. 4D). Altering these residues to alanines showed varying phenotypes, with all of the mutants retaining the ability to cleave AgrD, but only the K131A mutation prevented AIP production. These observations suggest that the K129–K131 residues share a similar function by operating in an AIP biosynthetic step that follows AgrD cleavage.
AgrB topology as determined by SCAM
In looking at the published AgrB topology map (Supplementary Figure 2A) (Zhang et al., 2002), the locations of some of the residues identified in the screen was unexpected. In particular, essential charged residues, such as R70 and K131, were reported as being buried in transmembrane spanning regions. In the absence of a three-dimensional structure for AgrB, we investigated the unusual topology using the prediction software TOPCONS (Bernsel et al., 2009), which compiles a consensus of five prediction algorithms. Surprisingly, the TOPCONS analysis was quite different from the published topology map (compare Supplemental Figure 2A and B). Most notably, the N-terminus was oriented toward the outside of the cell and the transmembrane spanning regions were adjusted to pull the buried charges into exposed loop regions, resulting in five predicted transmembrane regions rather than the reported six. While these computational predictions cannot substitute for experimental observations, the striking contrast raised questions. The original AgrB topology map was generated using alkaline phosphatase (PhoA) fusions in E. coli (Zhang et al., 2002), and we speculated that these large fusions could have resulted in some altered membrane arrangements. With our interest in understanding the role of the identified AgrB mutants, we decided to reevaluate the AgrB membrane topology using a mapping technique called substituted cysteine accessibility method (SCAM).
SCAM takes advantage of the spontaneous reactivity of the cysteine thiol side chain with maleimide reagents (Zhu & Casey, 2007, Bogdanov et al., 2005). These reagents are readily available coupled to biotin for straightforward detection with streptavidin horse radish peroxidase (Strep-HRP). In SCAM, proteins are engineered to contain a single cysteine in desired locations outside the cell, inside the cell, or in a transmembrane segment. In the case of AgrB, the protein is immunoprecipated with a T7 tag, and the labeling of maleimide-biotin reagent is detected using Strep-HRP (see Materials and Methods). Depending on the topology of the protein, the cysteine will be freely accessible to the extracellular environment, accessible only to permeable reagents, or inaccessible in the membrane. By detecting the presence of the bound reagent and analyzing the results, a topology map of the protein can be assembled. The advantage over phoA fusions is that SCAM has higher resolution and creates fewer structural perturbations, which should help clarify membrane topology questions.
Initial SCAM studies were carried out using T7-tagged AgrB expressed in E. coli and the native catalytic residue C84 was labeled. Cells were treated with low concentrations of MPB (Nα-(3-maleimidylpropionyl)biocytin; 50 μM) for extracellular cysteine labeling, and in parallel high concentrations (500 μM) to penetrate the cells and label both intracellular and extracellular cysteines. Following immunoprecipitation, Strep-HRP detection of the biotin label was only successful with the high MPB concentration (data not shown), suggesting an intracellular location as anticipated from the published topology map (Zhang et al., 2002) and our biosynthetic pathway predictions (Thoendel & Horswill, 2009). With this preliminary success, 25 cysteine substitutions were engineered into the AgrB C84S mutant. In selecting the positions, we targeted neutral residues whose substitutions would be less likely to interfere with AgrB structure. To control for negative effects on AgrB function, some of the cysteine substitutions were regenerated into the wildtype AgrB and tested in both the AIP production and peptidase assays. All tested substitutions (A73C, I133C, L137C, I188C and 190C) were still active in both assays, indicating that the substitutions were neutral and not altering AgrB topology (data not shown).
In presenting the SCAM findings on AgrB, the results from the experiments in E. coli are described first (Fig. 5A–D). Residues near the N-terminus (N2, A12, and L21) reacted with both low and high concentrations of MPB, indicating that this region is located outside of the cell. The next three residues (A37, L53, and L64) did not react with MPB, suggesting they are all buried in the membrane. The residues A73 and S80 near the catalytic cysteine C84 all reacted with only high concentrations of MPB (C84 not shown), indicating an intracellular location as anticipated from the proof-of-principle tests. Going further into AgrB, residues N101, H103, and V114 all failed to label with MPB, implying they are buried in the membrane, while I104 reacted with high concentrations of MPB, like other cytoplasmic facing residues. In the next region, A126, L137, and K142 labeled only with high concentrations of MPB, but in this same stretch T128, I133, and V135 also labeled with low MPB, suggesting an extracellular location. This discrepancy was further investigated by repeating SCAM in S. aureus (see below). In the later regions of AgrB, P162 and A164 labeled with both low and high MPB levels, indicating an extracellular location, while L169, A175, and I181 all failed to label. It should be noted that we experienced difficulties in labeling P162, A164, and L169 residues with consistency based on repeated tests (data not shown). Finally, the C-terminal residues L188 and 190 both labeled at each MPB concentration for an extracellular localization.
Figure 5.
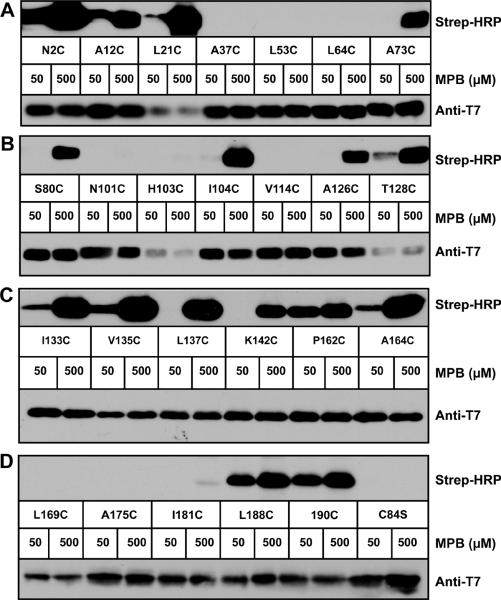
Mapping AgrB topology in E. coli using SCAM. In each panel, T7-tagged AgrB(C84S) containing indicated cysteine substitutions were expressed with His6-AgrD in E. coli. MPB was added at 50 μM to label extracellular cysteines or 500 μM to label extracellular and intracellular cysteines. Following immunoprecipitation using anti-T7 agarose, elutions were immunoblotted with Strep-HRP for the MPB label (top blots) and anti-T7-HRP to detect T7-AgrB (lower blots). Panel A, AgrB cysteine substitutions N2C to A73C; panel B, S80C to T128C; panel C, I133C to A164C; and panel D, L169C to C84S.
AgrB topology mapping in S. aureus
One of the advantages of SCAM is that the technique can be repeated in the native host S. aureus. Based on the E. coli results, a couple of the topology assignments needed clarification. To address this issue, we moved the constructs to a S. aureus Δagr deletion mutant to reevaluate the initial observations. For these experiments low levels of MPB (50 μM) were used in all conditions. MPB alone was used to label extracellular residues, while pretreatment of the cells with lysostaphin enabled labeling of both extracellular and intracellular residues. The house-keeping signal peptidase SpsB was selected as a positive control for labeling because of its well-established orientation within the membrane (Dalbey & Wickner, 1987), similar size to AgrB and lack of native cysteines (Cregg et al., 1996). A cysteine residue was inserted at amino acid position 26, placing it on the extracellular side near the transmembrane anchor, and this residue was labeled in all conditions even though expression levels were low compared to AgrB (Fig. 6A).
Figure 6.
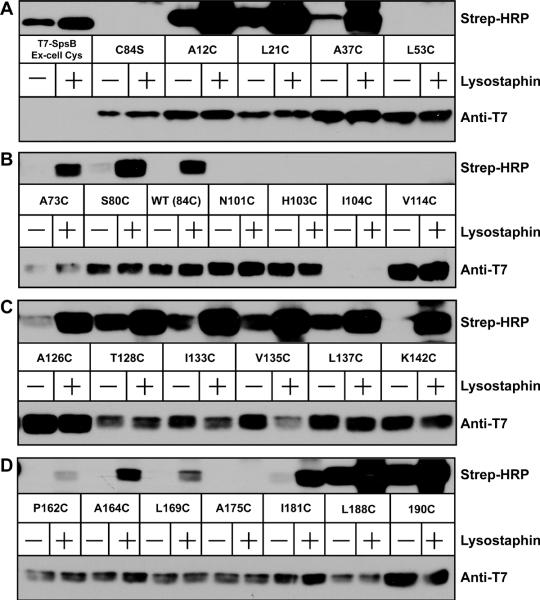
Mapping AgrB topology in S. aureus Δagr using SCAM. In each panel, T7-tagged AgrB (C84S) containing indicated cysteine substitutions were expressed in S. aureus Δagr (AH1292). Lanes marked with a “+” were pretreated with lysostaphin to expose intracellular cysteines prior to labeling. 50 μM MPB was used in untreated and pretreated conditions to label cysteines. Following immunoprecipitation using anti-T7 agarose, elutions were immunoblotted with Strep-HRP for the MPB label (top blots) and anti-T7-HRP to detect T7-AgrB (lower blots). T7-SpsB containing an extracellular cysteine was used as positive control for labeling. Panel A, T7-SpsB to L53C; panel B, A73C to V114C; panel C, A126C to K142C; and panel D, P162C to 190C.
Comparing the analysis of the first 100 AgrB residues, the only difference in behavior was A37, which failed to label in E. coli, but in S. aureus labeled in both conditions (Fig. 6A). In the next stretch, N101, H103, and V114 all behaved the same as E. coli, but I104 failed to label in S. aureus. However, this mutant construct turned out to be unstable in S. aureus, as shown by the T7 immunoblot (Fig. 6B). Comparing the region from A126–K142, only L137 behaved differently in S. aureus, labeling as an extracellular residue (Fig. 6C). In one of the only contrasts, P162, A164, L169 all labeled with only lysostaphin pretreatment in S. aureus (Fig. 6D), indicating an intracellular location. As noted above, this region did not label consistently in E. coli. Finally, the C-terminal region of AgrB behaved similar in both E. coli and S. aureus, except for I181, which labeled as an intracellular residue in S. aureus (Fig. 6D).
Considering all the SCAM findings, we created a hypothetical AgrB topology map shown in Figure 7A. Overall the model depicts AgrB as containing four transmembrane-spanning regions and one reentrant loop. Predictions from the TOPCONS analysis program were used as a guide to assign the lengths of the individual transmembrane spanning regions (Bernsel et al., 2009). Starting from the N-terminus, we have oriented AgrB residues 1–45 outside the cell. The only discrepancy here is that A37 did not label in E. coli and labeled poorly in S. aureus. It is possible that the stretch from A37–V45 should be buried in a transmembrane spanning region, or oriented as a reentrant loop. Next, we have depicted residues 46–66 as a transmembrane pass (Out-to-In) and residues 67–81 as an intracellular loop. SCAM findings from both E. coli and S. aureus are in agreement with this topology. To orient the rest of the AgrB protein topology, we relied on the striking extracellular reactivity of residues T128, I133, V135, and L137, coupled with the extracellular labeling of the C-terminus. Using these key features, stretches 106–126 (In-to-Out), 142–161 (Out-to-In), and 165–184 (In-to-Out) were depicted as transmembrane spanning regions using boundaries as predicted by TOPCONS analysis (Supplemental Fig. 2B). Based on the E. coli observations of I104, we oriented stretch 82–102 as a membrane reentrant loop, and I104 as the apex of a short intracellular exposed loop. Next, the stretch from 127–141 was oriented as an extracellular loop, although residue 137 did not label in this manner in E. coli. The mixed labeling of A126 and K142 are in conflict with this model, and at this time we cannot explain the behavior of these residues. Finally, we have oriented 162–164 as a short intracellular loop and 185-end as an extracellular exposed tail. While there are a few discrepancies in this new AgrB topology map, we believe this model is the most accurate representation of the SCAM results from both E. coli and S. aureus.
Figure 7.
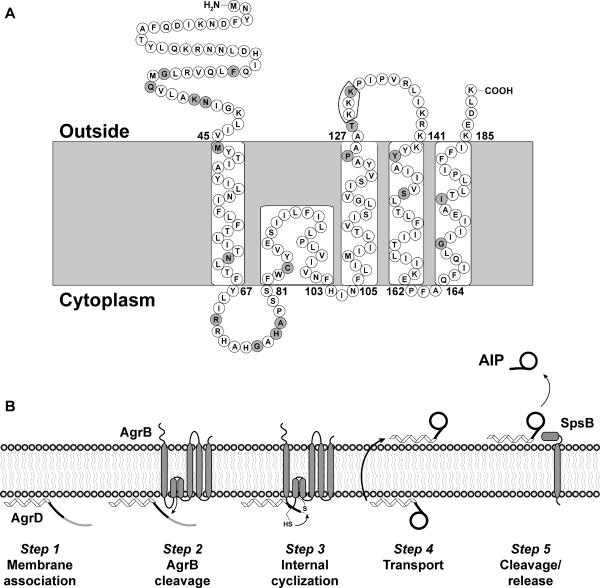
SCAM predicted membrane topology of AgrB and revised AIP biosynthesis model. Panel A, the topology model is based on interpretation of the SCAM assay results shown in Figures 5 and 6. Sites of mutations that decreased AIP production are shaded gray. Residues K129–K131, which disrupted a later step in AgrD processing, are boxed. Panel B, a model for AIP biosynthesis was previously reported (Thoendel & Horswill, 2009), and this model has been revised using the new AgrB topology assignments.
AgrB forms an oligomer
AgrB has been proposed in the biosynthesis pathway to mediate transport of AIP across the membrane (Fig. 7B). We hypothesize that AgrB oligomerizes to form a pore in order to carry out this process. To test this question, co-immunoprecipitations were performed using wild-type AgrB proteins tagged with either N-terminal T7 or His6 epitopes. If AgrB does form an oligomer, some of the T7-AgrB should form a complex with His6-tagged AgrB. In cell lysates immunoprecipitated with anti-T7 antibodies, blotting for the His6 tag demonstrated that His6-AgrB protein does interact and co-immunoprecipitate with T7-AgrB (Fig. 8). His6-AgrB did not immunoprecipitate when expressed by itself, indicating that complex formation was dependent on T7-AgrB protein. As another control, a His6 tag version of the membrane-bound sensor kinase SaeS was generated, and this protein failed to co-immunoprecipitate with T7-AgrB. In control experiments, His6-SaeS did express and was detectable by immunoblot for the His6 tag (data not shown). These findings indicate that the observed interaction between T7 or His6 versions of AgrB was specific and not due to experimental artifact. Taken together, these results demonstrate that AgrB complexes form an oligomer.
Figure 8.
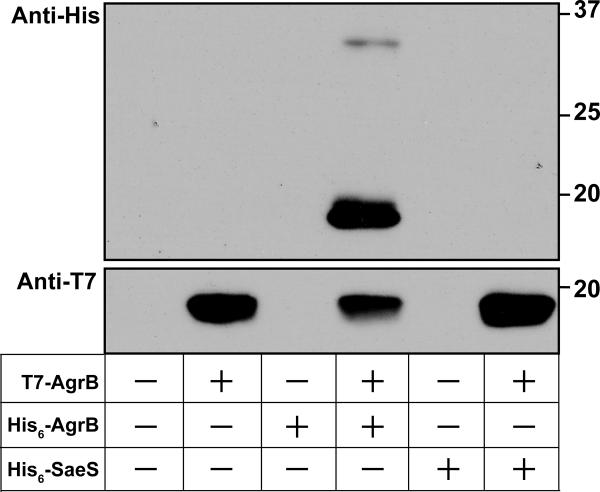
AgrB oligomerizes in the membrane. Results of co-immunoprecipitation studies using the combined expression of T7-AgrB and His6-AgrB. Lysates from S. aureus expressing indicated T7 or His6 tagged proteins were immunoprecipitated using anti-T7 agarose and immunoblotted using anti-T7-HRP or anti-His-HRP antibodies. The anti-T7 blot is shown on the top and the anti-His6 blot is shown on the bottom. As a control, His6-SaeS was substituted for AgrB in the constructs.
DISCUSSION
The S. aureus agr system is well recognized as a critical regulator of virulence factor production with numerous studies focusing on AIP-receptor interactions, AgrA transcriptional control, and RNAIII function. In contrast, comparatively few reports have examined earlier steps in the agr circuit, particularly on production of the AIP signal (Thoendel et al., 2011). In this study we carried out a genetic screen to identify AgrD and AgrB essential residues and followed this with structure-function studies.
By exploiting E. coli genetic tools, we successfully identified mutations in residues throughout AgrD that were essential for AIP production. Many of the identified residues were anticipated based on previous reports of site-directed mutations (Thoendel & Horswill, 2009) and AIP structure-activity analysis (McDowell et al., 2001), except for the two mutations in the N-terminal amphipathic leader. This leader targets AgrD to the cytoplasmic membrane and substitution of the leader with a transmembrane helix blocks AIP production (Zhang et al., 2004). In our own studies, we have observed that swapping the entire leader with one from a divergent AgrD blocks AIP production (data not shown), confirming that that leader is essential for AIP biosynthesis. Of the AgrD residues identified, G20 is completely conserved across N-terminal leaders in all staphylococcal species (Thoendel et al., 2011). The G20D mutation disrupted AgrB cleavage of AgrD, suggesting the change may influence interaction between AgrB and the AgrD propeptide. Unfortunately, binding assays are not available to assess this possibility despite attempts to develop this method (data not shown). Previously only the AgrD C-terminus was linked to AgrB cleavage (Thoendel & Horswill, 2009), suggesting the N-terminal leader may position the peptide for AgrB cleavage through some type of novel interaction.
The second essential residue identified in the AgrD N-terminus is I22. The I22N mutation fell into a different class where AgrB cleavage appeared normal, but no AIP was produced, suggesting a later step in the pathway was disrupted. Previously, we implicated signal peptidase as being important in mediating the removal of the AIP N-terminal leader (Kavanaugh et al., 2007), and the location of I22 is at the −3 position of the cleavage site. This position is typically occupied by alanine in the−3A-X-A−1 rule, but other small amino acids (glycine, serine, cysteine, isoleucine, valine or leucine) are allowed in the -3 wobble (Fikes et al., 1990, Shen et al., 1991). The mutation identified was an asparagine substitution (I22N), and this type of mutation at the −3 position inhibits E. coli signal peptidase activity by 93% (Fikes et al., 1990), similar to the 89% reduction in AIP synthesis that we observed (Table 2). Taken together, we speculate that the I22N substitution prevents signal peptidase cleavage, stalling AIP biosynthesis. Further experiments will be necessary to confirm the proposed functions of both AgrD G20 and I22.
AgrD mutations were isolated throughout the eight residues encoding AIP that blocked agr type I activation (Table 2). Mutations in the three residues of the AIP tail (Y25, S26, T27) did not disrupt signal production as evidenced by the agr interference activity of the supernatants (data not shown). This phenotype indicates that AgrB can process and secrete these AIP mutant structures in a normal manner, and the failure to activate agr type I is due to altered AgrC-I receptor binding. Overall these mutations in the AIP exocyclic tail are consistent with the general observation that this region is essential for agr activation (Thoendel et al., 2011).
Mutation of the AgrD residues that encode the AIP thiolactone ring provided additional insight into AgrB function. As anticipated, the C28R mutant was non-functional in an agr activation bioassay (Fig. 2A), consistent with previous results with a C28A mutant (Thoendel & Horswill, 2009). In follow-up tests, the F30I, F30L and I31T mutants were all cleaved by AgrB, indicating that either later processing steps in the biosynthetic pathway were blocked or that signal was produced that lost all antagonistic properties. In contrast, other AgrD mutations in the ring encoding region (F30S and M32V) eliminated AgrB peptidase activity. Like many proteases, the close proximity of these residues to the cleavage site could be alternating active site binding and/or function. While the F30 and M32 residues are located at the −3 and −1 positions relative to the cleavage site, we previously demonstrated that mutating the next two residues after the site, D33A and E34A (+1 and +2), eliminated AgrB peptidase activity and AIP production (Thoendel & Horswill, 2009). Taking these observations together, our findings suggests that AgrB requires a specific combination of residues flanking the cleavage site (−3, −1, +1 and +2) to recognize the AgrD substrate and cut the peptide at the correct position in order to produce a functional AIP.
In addition to AgrD, many novel mutations in AgrB were uncovered in the random mutagenesis screen, and these mutations can be grouped into several categories. Some mutations, particularly those in transmembrane regions, resulted in unstable AgrB proteins (Fig. 4A & 4C). This phenotype had the surprising effect of also destabilizing AgrD. In our experiments, we have observed that when full-length or truncated His6-AgrD is expressed by itself, it is rarely detectable by immunoblot. However, co-expression with an inactive form of AgrB (C84S mutant) stabilizes the peptide (data not shown). It is possible that interaction of AgrD with AgrB at the membrane protects the peptide from degradation from other proteases. Alternatively, the AgrD propeptide may be secreted from the cell via an alternative mechanism in the absence of AgrB, or the use of E. coli as an expression host could have unanticipated side effects.
A second group of AgrB mutants uncovered in the screen lacked peptidase activity (Fig. 4). As anticipated, the H77 and C84 catalytic residues were hit in the screen and others positioned near this catalytic dyad were also identified. Interestingly, a few mutations further away from the active site residues also inhibited cleavage of AgrD. Distal mutations N39I, N39Y, P125H and T128I all displayed a phenotype, perhaps through perturbation of tertiary structure in a manner that either disrupts AgrD binding or AgrB catalytic function.
A third and perhaps most interesting class of AgrB mutants were those able to cleave AgrD, but did not result in AIP production. This phenotype was observed when any of the lysine residues at positions 129–131 were mutated to a glutamate. To the best of our knowledge, these mutations are the first example of a separation of AgrB proteolytic activity from later steps in AIP biosynthesis. In our current pathway model (Fig. 7B), the thiolactone ring is formed after removal of the AgrD C-terminal tail, followed by transport of the AIP intermediate across the cell membrane. The lysine mutations could potentially interfere with either of these steps, but assay methods have not yet been developed to discriminate between transport and ring formation. Transport of a peptide such as the AIP intermediate would presumably require a pore for membrane passage, and we hypothesized that AgrB would need to oligomerize to create a pore of sufficient size. Indeed, our co-immunoprecipitation studies indicate that AgrB oligomerizes into a higher ordered state (Fig. 8), but the number of subunits in the oligomer remains unclear. We tested whether AgrB mutations that inhibited peptidase activity might display a phenotype by interfering with oligomerization. Nonproteolytic AgrBs with mutations distal to the active site (N39I, N39Y, M46K, R70G, P125H, T128I and K131E) were all able to co-immunoprecipitate as oligomers (data not shown), indicating that protein complex formation was not the reason for the loss of peptidase activity. However, it is also possible that single-site mutations are insufficient to disrupt oligomerization of the buried surface area.
To better understand AgrB function and the localization of our identified point mutations, the topology of the protein within the membrane was reevaluated. The SCAM technique was selected as a high resolution, less invasive approach to defining the topology. This approach also had the advantage of retesting in S. aureus to confirm orientation assignments in the native membrane environment. Our interpretation of the SCAM results led to the proposal of the AgrB topology shown in Figure 8. In this model, there are four transmembrane helices and both the N-and C-termini are located on the outside of the cell. Additionally, we predict a reentrant loop in which residues 82–102 (including the catalytic C84) are located in a section that enters and exits the membrane from the cytoplasmic face. Reentrant loops are increasingly being recognized as common features of integral membrane proteins with approximately 17% of transmembrane proteins in E. coli predicted to contain at least one reentrant loop (Viklund et al., 2006). Their presence has been detected in a variety of transport proteins including the aquaporin channels (Tornroth-Horsefield et al., 2006), glutamate transporters (Yernool et al., 2004) and protein conducting channels (Van den Berg et al., 2004).
While this topology map conforms to the SCAM findings, it does differ from computer-prediction models and the previously published map (Supplemental Figure 2A and B). Most topology prediction algorithms, including TOPCONS (Bernsel et al., 2009), TopPred (Claros & von Heijne, 1994), TMHMM (Krogh et al., 2001) and HMMTOP (Tusnady & Simon, 1998), indicate five transmembrane helices with the N-terminus located on the extracellular face and the C-terminus inside the cell. However, many of these programs do not take into account the possibility of reentrant loops.
The discrepancies between our model and the previously reported AgrB topology are noteworthy (Zhang et al., 2002). First, the new model orients the N-terminus on the outside of the cell, similar to many of the prediction algorithms. Second, residues Y67 through A76 are pulled out of the membrane and into a cytoplasmic-facing loop. Considering this stretch contains two arginines and two histidine residues, this repositioning seems probable and again prediction algorithms support this assignment. Third, we are proposing that the stretch from F82 to F102 forms a reentrant loop based on the SCAM results, while it was previously reported as a normal transmembrane helix. The primary reason for the reentry proposal is that regions T65-S81 and H103-F106 (due to properties of I104) behaved like cytoplasmic-facing loops, and T128-K141 acted as an extracellular-facing loop, forcing the consideration of alternative topology models. However, labeling studies on more substitutions would ultimately be necessary to confirm the reentry proposal. Fourth, we propose a contrasting orientation of the L107 to K141 region to the reported map, with F106-A126 acting as a transmembrane pass and A127-K141 as an extracellular loop. This orientation is in concordance with the SCAM findings and better positions the hydrophobic regions in the transmembrane helix and charged resides in the extracellular loop. Finally, the last stretch from K142 to the end of AgrB (K189) retains the same loops and transmembrane passes, but is inverted compared to the predictions and the reported model. Based on all our findings, we believe the new model more accurately reflects the AgrB membrane topology.
With a new topology model in hand, the location of the essential AgrB residues can be overlaid on the model to make functional predictions (shown in gray, Fig. 7A). Of interest, the important K129–131 residues are localized to the outside of the cell. If this region was involved in AIP secretion, this extracellular location might be plausible in the transport mechanism. Interestingly, nearby mutations at P125 and T128 disrupted AgrB cleavage activity, suggesting an alteration in tertiary structure could have long-range effects on active site function Mutations at N39 behaved in similar fashion, as this residue maps outside of the cell and triggers a dramatic reduction in AgrB cleavage activity. However, in each of these cases the actual distance to the active site is not known in the absence of a tertiary structure. Mutations at R70 and G75, which both blocked AgrB peptidase activity, are now mapped to a cytoplasmic loop rather than a transmembrane helix, consistent with these residues being involved in AgrD binding and or cleavage in the cytoplasm.
AgrB does not share any significant homology to other proteins besides predicted AgrBs in Gram-positive peptide-signaling systems (Novick et al., 1995). S. aureus AgrB (Type I) is the most extensively studied member of this group, and therefore, new findings regarding AgrB function have broad implications in understanding peptide signal biosynthesis across clinically significant pathogens. Comparison of the identified mutations with other AgrB family members supports this statement. Among all known AgrB sequences from Staphylococcus, Clostridium, and Listeria species, seven residues (G32, G75, H77, A78, C84, P125 and P132) are absolutely conserved (Supplemental Fig. 3). Our screen identified mutations in six of these seven residues (all except P132). While these residues have not been studied in other AgrB family members, their conservation implies they serve a similar and important function.
Altogether these studies provide new insights into the structure and function of AgrB. For the first time, mutations separating AgrB catalytic steps were identified, identifying protein regions important for later steps in AIP biosynthesis, which include both thiolactone ring formation and AIP transport. Evidence for AgrB oligomerization was also presented, further supporting the proposed role of this protein in signal transport. In parallel, essential residues in the N-terminus of AgrD were identified that separated out AIP synthesis steps. Taken together, these newly identified AgrB and AgrD residues will guide future studies to unravel the mechanistic details of AIP thiolactone ring formation and transport. As part of this study, the orientation of AgrB in the membrane was clarified using cysteine labeling, and we presented a new topology map to aid ongoing efforts to understand AgrB function. To the best of our knowledge, this is the first report of using this technique in S. aureus as a means of assessing membrane topology. Ultimately, an AgrB crystal structure will be necessary to accurately orient the protein in the membrane and further clarify topology discrepancies.
Experimental Procedures
Strains, Media, and Growth Conditions
E. coli cultures were maintained in Luria Broth (LB) at 37°C. S. aureus cultures were maintained in tryptic soy broth (TSB) at 37°C. Antibiotic concentrations for E. coli plasmids were 100 μg/ml for ampicillin (Amp) and 15 μg/ml for kanamycin (Kan). S. aureus plasmids were maintained with 10 μg/ml chloramphenicol (Cam). Cell growth was monitored using a Spectronic 20D+ spectrophotometer (Thermo Scientific).
Recombinant DNA and Genetic Techniques
Restriction and modification enzymes were obtained from New England Biolabs (Beverly, MA) and Promega Corporation (Madison, WI). All DNA manipulations were performed in E. coli strain ER2566 (New England Biolabs). Plasmids were transformed into S. aureus by electroporation as previously described (Schenk & Laddaga, 1992). Chromosomal markers were moved by bacteriophage 80α transduction (Novick, 1991). All plasmid constructs were confirmed by DNA sequencing performed at the DNA sequencing facility at the University of Iowa. Oligonucleotides were synthesized at Integrated DNA Technologies (Coralville, IA).
Error-Prone PCR
Error-prone PCR of agrBD was carried out according to the method of Matsumura and Ellington (Matsumura & Ellington, 2002). agrBD was amplified from pAgrD1 using oligonucleotides ARH60 (5 '-GTTGTTGAATTCGACAGTGAGGAGAGTGGTGTAAAATTGAAT-3') and MJT136 (5'-GTTGTTGGTACCCTCTCTATTTAAATTATTCGTGTAATTGTG-3'), Taq polymerase and 1.5–2.0 μl of 10× mutagenic buffer per 50 μl PCR reaction. A total of 24 separate PCR reactions were used to generate the mutants throughout the screen. The PCR products were purified, digested with EcoRI and KpnI, and cloned into pEPSA5 digested with the same enzymes.
Screening for AIP non-producers
pEPSA5-agrBD random mutants were generated as described above and transformed into E. coli strain ER2566. Colonies were inoculated into 96-well, 1 mL deep, microtiter plates (USA Scientific) containing 650 μl LB with Amp and grown overnight at 37°C. Bacteria were pelleted by centrifuging at 1,300 × g for 5 min. 15 μl of supernatant were collected for testing in the AIP activation bioassay (see below). For storage, 300 μl of 50% glycerol was added to the 96-well plates, mixed well and stored at −80°C. For retesting of AIP production in E. coli, strains were grown overnight in 5 ml LB containing Amp. Supernatants were filtered using 0.22-μm Spin-X microcentrifuge filters and 15 μl of supernatant was tested for AIP using the bioassay. For retesting of AIP production in S. aureus, pEPSA5-agrBD plasmids containing random mutations were purified and moved into strain AH1292. Overnight cultures of these strains grown in TSB Cam were diluted 1:50 in 5 ml TSB containing Cam and 1.0% xylose. Cultures were grown with shaking at 37°C to an optical density (OD) of 2.0 at 600 nm. Cells were filtered using 0.22-μm Spin-X microcentrifuge filters and supernatant dilutions were tested in the AIP activation bioassay.
AIP activation bioassay
AIP detection was performed with a bioassay as previously described with some modifications (Thoendel & Horswill, 2009, Jensen et al., 2008). Culture supernatants were prepared as described above. Overnight cultures of the reporter strain ROJ143 (Jensen et al., 2008) were diluted 1:50 in TSB containing Cam and grown to an OD of 1.0 at 600 nm. 15 μl of test supernatants (including 1:10 of supernatant in LB or TSB) were mixed with 135 μl of reporter in a 96-well plate and shaken at 200 rpm at 37°C for 1 hr. Luminescence was measured using a Tecan Infinite M200 microplate reader. Percent activity was calculated by creating serial dilutions of spent media from strains carrying the wild-type agrBD plasmid (pAgrD1) and measuring the activity. Relative activity was calculated by fitting the data to an exponential dose response curve determined from dilutions of supernatant from E. coli or S. aureus carrying the pAgrD1 plasmid.
AIP inhibition bioassay
We performed a bioassay based on AIP antagonism similar as previously described with some modifications (Thoendel & Horswill, 2009). Supernatants were prepared as outlined above. Reporter strains containing the pDB59 plasmid were diluted 1:250 in 50 ml TSB containing Cam and grown shaking at 37°C to an OD of 0.05 at 600 nm. 15 μl of supernatant was mixed with 135 μl of reporter in a 96-well plate and grown with shaking at 37°C. Plates were periodically monitored for OD at 595 nm and fluorescence at 485 nm excitation and 535 nm emission using a Tecan Infinite M200 plate reader.
Construction of plasmids
pCOLADuet plasmids with random mutants
To produce T7-tagged AgrB in E. coli, agrB variants were PCR amplified from the mutagenized pEPSA5-agrBD plasmids using oligonucleotides MJT80 (5'-TGTTCATATGGCTAGCATGACTGGTGGACAGCAAATGGGTCGGAATTATTTTGATAA TAAAATTGACGTC-3') and MJT46 (5'-GTTGTTCTCGAGTCATTTTAAGTCCTCCTTAA-3'). The PCR products were purified, digested with NdeI and XhoI, and ligated into pCOLADuet-His6agrD digested with the same enzymes. AgrD mutants were amplified using the mutagenized pEPSA5-agrBD plasmids as templates with oligonucleotides MJT61 (5'-GGTGTTGAATTCAATGAATACATTATTTAACTTATTT-3') and ARH57 (5'-GTTGTTAAGCTT-TTATTCGTGTAATTGTGTTAATTCTTTTGG-3'). The PCR products were purified, digested with EcoRI and HindIII and ligated in-frame with an N-terminal His6-tag in pCOLADuet-T7agrB, which had been digested with the same enzymes.
pCOLADuet plasmids with T7-AgrB cysteine substitutions
AgrB cysteine substitutions were generated using two-step overlap PCR. N-terminal T7-AgrB fragments were generated using pCOLADuet-His6agrD-T7agrB(C84S) as a template with oligonucleotide DuetFor2 (5'-TTGTACACGGCCGCATAATCGAAA-3') and a reverse primer containing a cysteine substitution (see Table S1). The C-terminal fragment was generated using pCOLADuet-His6agrD-T7agrB(C84S) as a template with oligonucleotide DuetRev2 (5'-GCTAGTTATTGCTCAGCGGTGGC-3') and a forward primer encoding a cysteine substitution (see Table S1). The PCR products were purified by agarose gel electrophoresis and mixed at a 1:1 ratio for templates in the second stage PCR with oligonucleotides DuetFor2 and DuetRev2. These PCR products were then digested with NdeI and XhoI and ligated into pCOLADuet-His6agrD that had been digested with the same enzymes.
Site-directed pCOLADuet mutants
Site-directed AgrB mutants at residues K129–K131 were constructed using two-step overlap PCR in the same method as the cysteine substitutions (above) but using overlapping primers consisting of substitutions to alanine or glutamate (Table S1).
pEPSA5-T7agrB with cysteine substitutions
To move T7-AgrB cysteine mutants into pEPSA5 two-step overlap PCR was employed. The N-terminal fragment consisting of the AgrB ribosome binding site and T7-tag was amplified using pAgrD1 as a template and oligonucleotides EPSAFor2 (5'-AGTTATAAAATAGATATCTCGGACCGTCAT-3') and MJT143 (5'-CCACCAGTCATGCTAGCCAATTTTACACCACTCTCCTCACTGTCGAATTC-3'). The C-terminal fragment consisting of the T7-tag and AgrB was amplified using pCOLADuet- His6agrD-T7agrB cysteine mutants (and wild-type) as templates and oligonucleotides MJT144 (5'-TTGGCTAGCATGACTGGTGGACAGCAAATGGGTCGGAATTATTTTGATAATAAAATT G-3') and MJT191 (5'-GTTGTTGGTACCCGCAGCAGCGGTTTCTTTACCAGA-3'). The N-and C-terminal PCR products were purified and mixed 1:1 as templates for the second stage PCR using oligonucleotides EPSAFor2 and MJT191. These PCR products were purified, digested with EcoRI and KpnI, and ligated into pEPSA5 digested with the same enzymes.
pEPSA5-T7spsB
T7-SpsB containing an extracellular cysteine insertion at amino acid position 26 was created using overlap extension PCR. The 5' fragment was created using LAC genomic DNA as a template with primers MJT262 (5'-GTTGTTGAATTCAAGAGGATGATTATTTATGGCTAGCATGACTGGTGGACAGCAAATGGGTCGGAAAAAAGAAATATTGGAATGGATTAT-3') and MJT221 (5'-ATATGGCGTAACACAAATAAATTTACC-3'). The 3' fragment was created using primers MJT220 (5'-GGTAAATTTATTTGTGTTACGCCATAT-3') and MJT211 (5'-GGTGGTGGTACCTTAATTTTTAGTATTTTCAGGATTGAA-3'). PCR products were purified and joined using PCR with primers MJT262 and MJT211. The PCR products were purified, digested with EcoRI and KpnI, and ligated into pEPSA5 digested with the same enzymes.
Co-immunoprecipitation constructs
pEPSA5-T7agrB-His6agrB was constructed by amplifying His6-agrB using pAgrD1 as a template and oligonucleotides MJT216 (5'-GTTGTTCTCGAGGAGGAGAGTGGTGTAAAATTGCATCATCACCATCATCATGGTAATTATTTTGATAATAAAATTG-3') and MJT215 (5'-GTTGTTGGTACCTCATTTTAAGTCCTCCTTAATAAAGAA-3'). The His6-agrB PCR product was purified, digested with XhoI and KpnI, and ligated into pEPSA5-T7agrB that had been digested with the same enzymes. pEPSA5-His6agrB was constructed by PCR amplifying His6agrB using pEPSA5-T7agrB as a template with oligonucleotides MJT242 (5'-GTTGTTGAATTCGAGGAGAGTGGTGTAAAATTGCATCATCACCATCATCATGGTAATTATTTTGATAATAAAATTG-3') and MJT215. The PCR product was purified, digested with EcoRI and KpnI, and ligated into pEPSA5 digested with the same enzymes. pEPSA5-T7agrB-His6saeS was constructed by PCR amplifying His6saeS using LAC genomic DNA as a template with oligonucleotides MJT248 (5'-GTTGTTCTCGAGGAGGAGAGTGGTGTAAAATTGCATCATCACCATCATCATGTGTTA TCAATTAGAAGTCAAAT-3') and MJT250 (5'-GTTGTTGGTACCATAAATAAATCGGATTATGACGTAATG-3'). The PCR product was purified, digested with XhoI and KpnI, and ligated into pEPSA5-T7agrB digested with the same enzymes. pEPSA5-His6saeS was constructed by amplifying His6saeS using LAC genomic DNA as a template witho ligonucleotides MJT249 (5'-GTTGTTGAATTCGAGGAGAGTGGTGTAAAATTGCATCATCACCATCATCATGTGTTATCAATTAGAAGTCAAAT-3') and MJT250. The PCR product was purified, digested with EcoRI and KpnI, and ligated into pEPSA5 digested with the same enzymes. All co-immunoprecipitation constructs were transformed into AH2157 (LAC spa∷kan).
AgrB Peptidase Assay
Testing for AgrB cleavage of His6-AgrD was carried out as previously reported (Thoendel & Horswill, 2009). Overnight E. coli cultures were diluted 1:50 in 5 ml LB containing Kan and grown to an OD of 1.0 at 600 nm. Protein expression was then induced with 1 mM IPTG for 1 hr. 1 ml of culture was collected and cells were pelleted at 13,000 × g for 1 min. Supernatants were filtered and stored at −20°C for testing AIP production in the AIP activation bioassay. Cell pellets were resuspended in 250 μl 1× Tris-tricine sample buffer, and heated at 100°C for 5 min. 5 μl of samples were used for SDS-PAGE and immunoblotting. To test for the presence of T7-AgrB, the cells were grown as above and induced with IPTG for 3 hrs. 1 ml of culture was collected, cells were pelleted at 13,000 × g for 1 min, and resuspended in 250 μl of SDS-PAGE sample buffer. Cell lysates were passed through a 25 gauge syringe needle to sheer chromosomal DNA and decrease viscosity for running SDS-PAGE gels. 10 μl of samples were used for SDS-PAGE and immunoblotting.
SDS-PAGE
His6-AgrD peptides were resolved using tricine-SDS-PAGE as previously reported with modifications (Schagger, 2006). Polyacrylamide gels were prepared using the Biorad Protean 3 system with a resolving gel containing 18% acrylamide and 6 M urea and a stacking gel containing 6% acrylamide. Following electrophoresis, proteins were transferred to PVDF-PSQ (Millipore) for 75 min at 75 mA. Larger proteins were resolved using glycine-SDS-PAGE as previously reported with resolving and stacking gels containing 12% and 4% acrylamide, respectively (Thoendel & Horswill, 2009). Proteins were separated using a Protean 3 system and transferred to PVDF-P at 170 mA for 60 min.
Immunoblotting
Immunoblotting for His6 tags and T7 tags were performed as previously reported (Thoendel & Horswill, 2009). Biotinylated proteins were detected by first blocking PVDF membranes with TBST (0.05% Tween-20) containing 3% bovine serum albumin for 1 hr at room temperature. Following three washes with TBST, Streptavidin-HRP (Thermo Scientific, 1 mg/ml) diluted 1:7,500 in TBST was added for 1 hr at room temperature. Membranes were washed three times for 10 min, followed by the addition of West Pico chemiluminescent substrate (Thermo Scientific) for 5 min. Membranes were then exposed to Classic X-Ray Film (Research Products International Corporation).
Cysteine labeling of AgrB
For AgrB cysteine labeling in E. coli, overnight cultures were diluted 1:50 in 25 ml LB containing Kan and grown shaking at 37°C until reaching an OD of 1.0 at 600 nm. Cultures were then induced with 1 mM IPTG for 3 hrs. Cells were pelleted and resuspended to an OD of 25 at 600 nm in buffer A (100 mM HEPES, 250 mM sucrose, 25 mM MgCl2, 0.1 mM KCl, pH 7.5) (Xie et al., 2006). 100 μl aliquots were collected and cysteines were labeled with 50 μM or 500 μM Nα-(3-maleimidylpropionyl)biocytin (MPB, Invitrogen) for 10 min at room temperature. Labeling was quenched with the addition of 750 μl buffer A containing 20 mM BME. Cells were washed twice with buffer A + BME and resuspended in 100 μl buffer A + BME. Cells were lysed with the addition of 100 μl solubilization buffer (50 mM Tris-HCl, pH 8.1, 2% SDS, 1 mM EDTA) and vortexing for 5 min. 300 μl of T7 bind/wash buffer (4.29 mM Na2HPO4, 1.47 mM KH2PO4, 2.7 mM KCl, 137 mM NaCl, 40 mM n-octyl-β-D-glucopyranoside, pH 7.3) was mixed, followed by 40 μl anti-T7 antibody agarose (Novagen). Proteins were immunoprecipitated by tumbling for 1 hr at room temperature followed by three 15 min washes with 600 μl T7 bind/wash buffer. Proteins were eluted with 60 μl T7 elution buffer (100 mM citric acid, pH 2.2, 1% SDS) for 15 min after which 55 μl was collected and neutralized with 5 μl 2 M Tris, pH 10.4. Samples were mixed 1:1 with 2× SDS-PAGE loading buffer and 5 μl was used for immunoblotting.
Cysteine labeling of AgrB in S. aureus was performed by diluting overnight cultures 1:50 in 25 ml TSB containing Cam and 1% xylose and growing the cultures shaking at 37°C until reaching an OD of 2.0 at 600 nm. Following centrifugation, the cells were resuspended in buffer A to an OD of 25 at 600 nm and 100 μl aliquots were removed. For samples that were to be pretreated with lysostaphin (AMBI Products), 20 μg lysostaphin and 2U DNase (Fermentas) were added and the cells were incubated for 30 min at 37°C. MPB was then added at 50 μM for 10 min, after which the labeling was quenched by adding BME to 73 mM. For samples that were not pretreated with lysostaphin, MPB was added to 50 μM for 10 min followed by quenching with 73 mM BME. These samples were then washed twice with buffer A containing 20 mM BME, resuspended in 100 μl, and 20 μg lysostaphin and 2U DNase were added at 37°C for 30 min. All samples were then solubilized with the addition of 100 μl solubilization buffer and 300 μl T7 bind/wash buffer. 40 μl anti-T7 agarose was added and incubated one hr at room temperature, followed by three 20 min washes with 600 μl T7 bind/wash buffer. Samples were eluted and prepared as above with the E. coli samples.
Co-immunoprecipitations
Co-immunoprecipitations were performed as previously reported with some modifications (George Cisar et al., 2009). Overnight cultures of S. aureus were diluted 1:50 in 25 ml TSB containing Cam and 1% xylose. Cultures were grown shaking at 37°C until reaching an OD of 2.0 at 600 nm. Cells were then pelleted and washed once with 10 ml wash buffer (10 mM Tris pH 7.4, 1.5 mM MgCl2, 10 mM KCl, 1.1 M sucrose) and resuspended in 1 ml wash buffer containing 100 μg/ml lysostaphin. Following incubation at 37°C for 45 min, samples were split into 200 μl aliquots and centrifuged at 8,000 × g for 30 min.
Supernatants were removed and the cells were resuspended in 500 μl lysis buffer (50 mM Tris pH 7.4, 150 mM NaCl, 1 mM EGTA, 1% nonidet-P40, and protease inhibitors). Lysed cells were incubated 10 min on ice and passed through a 30 gauge needle to sheer chromosomal DNA. Lysates were centrifuged at 13,000 × g for 20 min at 4°C to remove cell debris. Supernatants were collected and 40 μl of anti-T7 agarose (Novagen) was added. Lysates were immunoprecipitated by rotating at 4°C for 1 hr followed by three washes with 900 μl lysis buffer for 20 min each. Supernatants were removed and proteins were eluted by adding 60 μl T7 elution buffer (100 mM citric acid (pH 2.2) and 1% SDS) for 15 min. 55 μl of supernatant was collected and neutralized with 5 μl of 2 M Tris, pH 10.4. Samples were mixed 1:1 with 2× SDS-PAGE sample buffer and 5 μl of sample were used for immunoblotting.
Supplementary Material
Table 1.
Strains and plasmids used in this study.
| Strain or Plasmid | Genotype/Description | Resistance | Source or Ref. |
|---|---|---|---|
| Escherichia coli | |||
| ER2566 | Protein expression strain | None | New England Biolabs |
|
| |||
| Staphylococcus aureus | |||
| RN4220 | Restriction modification deficient | None | (Kreiswirth et al., 1983) |
| ROJ143 | Δagr∷Erm pAgr-lux / pAgrC1agrA | Cam | (Jensen et al., 2008) |
| AH845 | USA300 LAC | Tet | (Voyich et al., 2005) |
| AH1263 | USA300 LAC (Erythromycin sensitive) | Tet | (Boles et al., 2010) |
| AH1292 | AH1263 Δagr∷tetM | Tet | (Benson et al., 2011) |
| AH2157 | USA300 LAC spa∷kan | Kan, Erm | Tim Foster |
| AH1677 | AH845 / pDB59 (agr type I reporter) | Cam | (Kirchdoerfer et al., 2011) |
| AH430 | SA502a / pDB59(agr type II reporter) | Cam | (Malone et al., 2007) |
| AH1747 | MW2 / pDB59 (agr type III reporter) | Cam | (Kirchdoerfer et al., 2011) |
| AH1872 | MN EV / pDB59 (agr type IV reporter) | Cam | (Kirchdoerfer et al., 2011) |
|
| |||
| Plasmids | |||
| pEPSA5 | Xylose inducible shuttle vector | Amp, Cam | (Forsyth et al., 2002) |
| pAgrD1 | pEPSA5-agrBD | Amp, Cam | (Thoendel & Horswill, 2009) |
| pDB59 | agr P3-YFP | Amp, Cam | (Yarwood et al., 2004) |
| pCOLADuet-1 | Expression vector | Kan | Novagen |
| pCOLADuet-T7agrB-His6agrD | Wild-type tagged AgrB and AgrD | Kan | (Thoendel & Horswill, 2009) |
| pCOLADuet-T7agrB(C84S)-His6agrD | Non-proteolytic AgrB and AgrD | Kan | (Thoendel & Horswill, 2009) |
| pCOLADuet-agrB(C84S)-His6agrD(δ 14aa) | His6AgrD with C-terminal tail deleted | Kan | (Thoendel & Horswill, 2009) |
| pCOLADuet-T7agrB(C84S)-HiS6agrD(δ26aa) | His6AgrD with AIP and C-terminal tail deleted | Kan | (Thoendel & Horswill, 2009) |
| pCOLADuet-T7agrB-His6agrD(C28A) | Wild-type tagged AgrB and His6AgrD with AIP cysteine mutated | Kan | (Thoendel & Horswill, 2009) |
| pEPSA5-T7agrB | Xylose inducible T7-tagged AgrB | Amp, Cam | This study |
| pEPSA5-His6agrB | Xylose inducible His6-tagged AgrB | Amp, Cam | This study |
| pEPSA5-T7agrB-His6agrB | T7-tagged AgrB and His6-tagged AgrB | Amp, Cam | This study |
| pEPSA5-His6saeS | Xylose inducible His6-tagged SaeS | Amp, Cam | This study |
| pEPSA5-T7agrB-His6saeS | T7-tagged AgrB and His6-tagged SaeS | Amp, Cam | This study |
ACKNOWLEDGEMENTS
We thank Dr. Timothy Foster for proving the LAC spa mutant. M. Thoendel was supported by NIH Training Grant No. T32 AI07511. The project was supported by Award Number AI078921 from the National Institute of Allergy and Infectious Diseases.
REFERENCES
- Abdelnour A, Arvidson S, Bremell T, Ryden C, Tarkowski A. The accessory gene regulator (agr) controls Staphylococcus aureus virulence in a murine arthritis model. Infect. Immun. 1993;61:3879–3885. doi: 10.1128/iai.61.9.3879-3885.1993. [DOI] [PMC free article] [PubMed] [Google Scholar]
- Benson MA, Lilo S, Wasserman GA, Thoendel M, Smith A, Horswill AR, Fraser J, Novick RP, Shopsin B, Torres VJ. Staphylococcus aureus regulates the expression and production of the staphylococcal superantigen-like secreted proteins in a Rot-dependent manne. Mol. Microbiol. 2011 doi: 10.1111/j.1365-2958.2011.07720.x. In Press. [DOI] [PMC free article] [PubMed] [Google Scholar]
- Bernsel A, Viklund H, Hennerdal A, Elofsson A. TOPCONS: consensus prediction of membrane protein topology. Nucleic Acids Res. 2009;37:W465–468. doi: 10.1093/nar/gkp363. [DOI] [PMC free article] [PubMed] [Google Scholar]
- Bogdanov M, Zhang W, Xie J, Dowhan W. Transmembrane protein topology mapping by the substituted cysteine accessibility method (SCAM(TM)): application to lipid-specific membrane protein topogenesis. Methods. 2005;36:148–171. doi: 10.1016/j.ymeth.2004.11.002. [DOI] [PMC free article] [PubMed] [Google Scholar]
- Boles BR, Thoendel M, Roth AJ, Horswill AR. Identification of genes involved in polysaccharide-independent Staphylococcus aureus biofilm formation. PLoS One. 2010;5:e10146. doi: 10.1371/journal.pone.0010146. [DOI] [PMC free article] [PubMed] [Google Scholar]
- Bubeck Wardenburg J, Patel RJ, Schneewind O. Surface proteins and exotoxins are required for the pathogenesis of Staphylococcus aureus pneumonia. Infect. Immun. 2007;75:1040–1044. doi: 10.1128/IAI.01313-06. [DOI] [PMC free article] [PubMed] [Google Scholar]
- Claros MG, von Heijne G. TopPred II: an improved software for membrane protein structure predictions. Comput Appl Biosci. 1994;10:685–686. [Google Scholar]
- Cregg KM, Wilding I, Black MT. Molecular cloning and expression of the spsB gene encoding an essential type I signal peptidase from Staphylococcus aureus. J. Bacteriol. 1996;178:5712–5718. doi: 10.1128/jb.178.19.5712-5718.1996. [DOI] [PMC free article] [PubMed] [Google Scholar]
- Dalbey RE, Wickner W. Leader peptidase of Escherichia coli: critical role of a small domain in membrane assembly. Science. 1987;235:783–787. doi: 10.1126/science.3544218. [DOI] [PubMed] [Google Scholar]
- Diekema DJ, Pfaller MA, Schmitz FJ, Smayevsky J, Bell J, Jones RN, Beach M. Survey of infections due to Staphylococcus species: frequency of occurrence and antimicrobial susceptibility of isolates collected in the United States, Canada, Latin America, Europe, and the Western Pacific region for the SENTRY Antimicrobial Surveillance Program, 1997–1999. Clin. Infect. Dis. 2001;32(Suppl 2):S114–132. doi: 10.1086/320184. [DOI] [PubMed] [Google Scholar]
- Dunman PM, Murphy E, Haney S, Palacios D, Tucker-Kellogg G, Wu S, Brown EL, Zagursky RJ, Shlaes D, Projan SJ. Transcription profiling-based identification of Staphylococcus aureus genes regulated by the agr and/or sarA loci. J. Bacteriol. 2001;183:7341–7353. doi: 10.1128/JB.183.24.7341-7353.2001. [DOI] [PMC free article] [PubMed] [Google Scholar]
- Fikes JD, Barkocy-Gallagher GA, Klapper DG, Bassford PJ., Jr. Maturation of Escherichia coli maltose-binding protein by signal peptidase I in vivo. Sequence requirements for efficient processing and demonstration of an alternate cleavage site. J Biol Chem. 1990;265:3417–3423. [PubMed] [Google Scholar]
- Forsyth RA, Haselbeck RJ, Ohlsen KL, Yamamoto RT, Xu H, Trawick JD, Wall D, Wang L, Brown-Driver V, Froelich JM, C KG, King P, McCarthy M, Malone C, Misiner B, Robbins D, Tan Z, Zhu Zy ZY, Carr G, Mosca DA, Zamudio C, Foulkes JG, Zyskind JW. A genome-wide strategy for the identification of essential genes in Staphylococcus aureus. Mol. Microbiol. 2002;43:1387–1400. doi: 10.1046/j.1365-2958.2002.02832.x. [DOI] [PubMed] [Google Scholar]
- George Cisar EA, Geisinger E, Muir TW, Novick RP. Symmetric signalling within asymmetric dimers of the Staphylococcus aureus receptor histidine kinase AgrC. Mol Microbiol. 2009;74:44–57. doi: 10.1111/j.1365-2958.2009.06849.x. [DOI] [PMC free article] [PubMed] [Google Scholar]
- Gorwitz RJ, Kruszon-Moran D, McAllister SK, McQuillan G, McDougal LK, Fosheim GE, Jensen BJ, Killgore G, Tenover FC, Kuehnert MJ. Changes in the prevalence of nasal colonization with Staphylococcus aureus in the United States, 2001–2004. J Infect Dis. 2008;197:1226–1234. doi: 10.1086/533494. [DOI] [PubMed] [Google Scholar]
- Heyer G, Saba S, Adamo R, Rush W, Soong G, Cheung A, Prince A. Staphylococcus aureus agr and sarA functions are required for invasive infection but not inflammatory responses in the lung. Infect. Immun. 2002;70:127–133. doi: 10.1128/IAI.70.1.127-133.2002. [DOI] [PMC free article] [PubMed] [Google Scholar]
- Jensen RO, Winzer K, Clarke SR, Chan WC, Williams P. Differential recognition of Staphylococcus aureus quorum-sensing signals depends on both extracellular loops 1 and 2 of the transmembrane sensor AgrC. J Mol Biol. 2008;381:300–309. doi: 10.1016/j.jmb.2008.06.018. [DOI] [PubMed] [Google Scholar]
- Ji G, Beavis RC, Novick RP. Cell density control of staphylococcal virulence mediated by an octapeptide pheromone. Proc Natl Acad Sci U S A. 1995;92:12055–12059. doi: 10.1073/pnas.92.26.12055. [DOI] [PMC free article] [PubMed] [Google Scholar]
- Kavanaugh JS, Thoendel M, Horswill AR. A role for type I signal peptidase in Staphylococcus aureus quorum sensing. Mol Microbiol. 2007;65:780–798. doi: 10.1111/j.1365-2958.2007.05830.x. [DOI] [PubMed] [Google Scholar]
- Kirchdoerfer RN, Garner AL, Flack CE, Mee JM, Horswill AR, Janda KD, Kaufmann GF, Wilson IA. Structural basis for ligand recognition and discrimination of a quorum quenching antibody. J. Biol. Chem. 2011;286:17351–17358. doi: 10.1074/jbc.M111.231258. [DOI] [PMC free article] [PubMed] [Google Scholar]
- Kreiswirth BN, Lofdahl S, Betley MJ, O'Reilly M, Schlievert PM, Bergdoll MS, Novick RP. The toxic shock syndrome exotoxin structural gene is not detectably transmitted by a prophage. Nature. 1983;305:709–712. doi: 10.1038/305709a0. [DOI] [PubMed] [Google Scholar]
- Krogh A, Larsson B, von Heijne G, Sonnhammer EL. Predicting transmembrane protein topology with a hidden Markov model: application to complete genomes. J Mol Biol. 2001;305:567–580. doi: 10.1006/jmbi.2000.4315. [DOI] [PubMed] [Google Scholar]
- Lina G, Jarraud S, Ji G, Greenland T, Pedraza A, Etienne J, Novick RP, Vandenesch F. Transmembrane topology and histidine protein kinase activity of AgrC, the agr signal receptor in Staphylococcus aureus. Mol. Microbiol. 1998;28:655–662. doi: 10.1046/j.1365-2958.1998.00830.x. [DOI] [PubMed] [Google Scholar]
- Lowy FD. Staphylococcus aureus infections. N. Engl. J. Med. 1998;339:520–532. doi: 10.1056/NEJM199808203390806. [DOI] [PubMed] [Google Scholar]
- Lyon GJ, Wright JS, Muir TW, Novick RP. Key determinants of receptor activation in the agr autoinducing peptides of Staphylococcus aureus. Biochemistry. 2002;41:10095–10104. doi: 10.1021/bi026049u. [DOI] [PubMed] [Google Scholar]
- Malone CL, Boles BR, Horswill AR. Biosynthesis of Staphylococcus aureus autoinducing peptides by using the synechocystis DnaB mini-intein. Appl Environ Microbiol. 2007;73:6036–6044. doi: 10.1128/AEM.00912-07. [DOI] [PMC free article] [PubMed] [Google Scholar]
- Matsumura I, Ellington AD. Mutagenic polymerase chain reaction of protein-coding genes for in vitro evolution. Methods Mol Biol. 2002;182:259–267. doi: 10.1385/1-59259-194-9:259. [DOI] [PubMed] [Google Scholar]
- McDowell P, Affas Z, Reynolds C, Holden MT, Wood SJ, Saint S, Cockayne A, Hill PJ, Dodd CE, Bycroft BW, Chan WC, Williams P. Structure, activity and evolution of the group I thiolactone peptide quorum-sensing system of Staphylococcus aureus. Mol Microbiol. 2001;41:503–512. doi: 10.1046/j.1365-2958.2001.02539.x. [DOI] [PubMed] [Google Scholar]
- Montgomery CP, Boyle-Vavra S, Daum RS. Importance of the global regulators Agr and SaeRS in the pathogenesis of CA-MRSA USA300 infection. PLoS One. 2010;5:e15177. doi: 10.1371/journal.pone.0015177. [DOI] [PMC free article] [PubMed] [Google Scholar]
- Novick RP. Genetic systems in staphylococci. Methods Enzymol. 1991;204:587–636. doi: 10.1016/0076-6879(91)04029-n. [DOI] [PubMed] [Google Scholar]
- Novick RP. Autoinduction and signal transduction in the regulation of staphylococcal virulence. Mol. Microbiol. 2003;48:1429–1449. doi: 10.1046/j.1365-2958.2003.03526.x. [DOI] [PubMed] [Google Scholar]
- Novick RP, Geisinger E. Quorum sensing in staphylococci. Annu Rev Genet. 2008;42:541–564. doi: 10.1146/annurev.genet.42.110807.091640. [DOI] [PubMed] [Google Scholar]
- Novick RP, Projan SJ, Kornblum J, Ross HF, Ji G, Kreiswirth B, Vandenesch F, Moghazeh S. The agr P2 operon: an autocatalytic sensory transduction system in Staphylococcus aureus. Mol Gen Genet. 1995;248:446–458. doi: 10.1007/BF02191645. [DOI] [PubMed] [Google Scholar]
- Novick RP, Ross HF, Projan SJ, Kornblum J, Kreiswirth B, Moghazeh S. Synthesis of staphylococcal virulence factors is controlled by a regulatory RNA molecule. Embo. J. 1993;12:3967–3975. doi: 10.1002/j.1460-2075.1993.tb06074.x. [DOI] [PMC free article] [PubMed] [Google Scholar]
- Qiu R, Pei W, Zhang L, Lin J, Ji G. Identification of the putative staphylococcal AgrB catalytic residues involving the proteolytic cleavage of AgrD to generate autoinducing peptide. J. Biol. Chem. 2005;280:16695–16704. doi: 10.1074/jbc.M411372200. [DOI] [PubMed] [Google Scholar]
- Schagger H. Tricine-SDS-PAGE. Nat Protoc. 2006;1:16–22. doi: 10.1038/nprot.2006.4. [DOI] [PubMed] [Google Scholar]
- Schenk S, Laddaga RA. Improved method for electroporation of Staphylococcus aureus. FEMS Microbiol. Lett. 1992;73:133–138. doi: 10.1016/0378-1097(92)90596-g. [DOI] [PubMed] [Google Scholar]
- Shen LM, Lee JI, Cheng SY, Jutte H, Kuhn A, Dalbey RE. Use of site-directed mutagenesis to define the limits of sequence variation tolerated for processing of the M13 procoat protein by the Escherichia coli leader peptidase. Biochemistry. 1991;30:11775–11781. doi: 10.1021/bi00115a006. [DOI] [PubMed] [Google Scholar]
- Thoendel M, Horswill AR. Identification of Staphylococcus aureus AgrD residues required for autoinducing peptide biosynthesis. J. Biol. Chem. 2009;284:21828–21838. doi: 10.1074/jbc.M109.031757. [DOI] [PMC free article] [PubMed] [Google Scholar]
- Thoendel M, Kavanaugh JS, Flack CE, Horswill AR. Peptide signaling in the staphylococci. Chem Rev. 2011;111:117–151. doi: 10.1021/cr100370n. [DOI] [PMC free article] [PubMed] [Google Scholar]
- Tornroth-Horsefield S, Wang Y, Hedfalk K, Johanson U, Karlsson M, Tajkhorshid E, Neutze R, Kjellbom P. Structural mechanism of plant aquaporin gating. Nature. 2006;439:688–694. doi: 10.1038/nature04316. [DOI] [PubMed] [Google Scholar]
- Tusnady GE, Simon I. Principles governing amino acid composition of integral membrane proteins: application to topology prediction. J Mol Biol. 1998;283:489–506. doi: 10.1006/jmbi.1998.2107. [DOI] [PubMed] [Google Scholar]
- Van den Berg B, Clemons WM, Jr., Collinson I, Modis Y, Hartmann E, Harrison SC, Rapoport TA. X-ray structure of a protein-conducting channel. Nature. 2004;427:36–44. doi: 10.1038/nature02218. [DOI] [PubMed] [Google Scholar]
- Viklund H, Granseth E, Elofsson A. Structural classification and prediction of reentrant regions in alpha-helical transmembrane proteins: application to complete genomes. J Mol Biol. 2006;361:591–603. doi: 10.1016/j.jmb.2006.06.037. [DOI] [PubMed] [Google Scholar]
- Voyich JM, Braughton KR, Sturdevant DE, Whitney AR, Said-Salim B, Porcella SF, Long RD, Dorward DW, Gardner DJ, Kreiswirth BN, Musser JM, DeLeo FR. Insights into mechanisms used by Staphylococcus aureus to avoid destruction by human neutrophils. J Immunol. 2005;175:3907–3919. doi: 10.4049/jimmunol.175.6.3907. [DOI] [PubMed] [Google Scholar]
- Wright JS, 3rd, Jin R, Novick RP. Transient interference with staphylococcal quorum sensing blocks abscess formation. Proc. Natl. Acad. Sci. USA. 2005;102:1691–1696. doi: 10.1073/pnas.0407661102. [DOI] [PMC free article] [PubMed] [Google Scholar]
- Xie J, Bogdanov M, Heacock P, Dowhan W. Phosphatidylethanolamine and monoglucosyldiacylglycerol are interchangeable in supporting topogenesis and function of the polytopic membrane protein lactose permease. J Biol Chem. 2006;281:19172–19178. doi: 10.1074/jbc.M602565200. [DOI] [PMC free article] [PubMed] [Google Scholar]
- Yarwood JM, Bartels DJ, Volper EM, Greenberg EP. Quorum sensing in Staphylococcus aureus biofilms. J. Bacteriol. 2004;186:1838–1850. doi: 10.1128/JB.186.6.1838-1850.2004. [DOI] [PMC free article] [PubMed] [Google Scholar]
- Yernool D, Boudker O, Jin Y, Gouaux E. Structure of a glutamate transporter homologue from Pyrococcus horikoshii. Nature. 2004;431:811–818. doi: 10.1038/nature03018. [DOI] [PubMed] [Google Scholar]
- Zhang L, Gray L, Novick RP, Ji G. Transmembrane topology of AgrB, the protein involved in the post-translational modification of AgrD in Staphylococcus aureus. J. Biol. Chem. 2002;277:34736–34742. doi: 10.1074/jbc.M205367200. [DOI] [PubMed] [Google Scholar]
- Zhang L, Lin J, Ji G. Membrane anchoring of the AgrD N-terminal amphipathic region is required for its processing to produce a quorum-sensing pheromone in Staphylococcus aureus. J. Biol. Chem. 2004;279:19448–19456. doi: 10.1074/jbc.M311349200. [DOI] [PubMed] [Google Scholar]
- Zhu Q, Casey JR. Topology of transmembrane proteins by scanning cysteine accessibility mutagenesis methodology. Methods. 2007;41:439–450. doi: 10.1016/j.ymeth.2006.08.004. [DOI] [PubMed] [Google Scholar]
Associated Data
This section collects any data citations, data availability statements, or supplementary materials included in this article.