

Summary
Altered availability of the brain biochemical glutamate may contribute to the neural mechanisms underlying age-related changes in cognitive and motor functions. To investigate the contribution of regional glutamate levels to behavior in the aging brain, we used an in vivo Magnetic Resonance Spectroscopy (MRS) protocol optimized for glutamate detection in 3 brain regions targeted by cortical glutamatergic efferents—striatum, cerebellum, and pons. Data from 61 healthy men and women ranging in age from 20 – 86 years were used. Older age was associated with lower glutamate levels in the striatum, but not cerebellum or pons. Older age was also predictive of poorer performance on tests of visuomotor skills and balance. Low striatal glutamate levels were associated with high systolic blood pressure and worse performance on a complex visuomotor task, the Grooved Pegboard. These findings suggest that low brain glutamate levels are related to high blood pressure and that changes in brain glutamate levels might mediate the behavioral changes noted in normal aging.
Keywords: aging, cognition, frontostriatal circuitry, glutamate, human, imaging, spectroscopy
1. Introduction
The proportion of older adults in the general population continues to grow [49] with the United Nations estimating that by 2050, 16% of the world’s population will be age 65 and over [130]. Advanced age is associated with impairments in various cognitive and motor functions and structural and biochemical changes in selective brain regions [121]. A candidate substrate to contribute to decline in function with age is glutamate (Glu), a key molecule in cellular metabolism, the most abundant neurotransmitter in the mammalian nervous system, and the principal neurotransmitter of cortical efferents [41,129]. Alterations to the glutamatergic system have been shown to contribute to compromised cognitive performance in individuals with neuropsychiatric disorders [62,88,95,108] and may also contribute to altered cognitive function in healthy aging.
Estimates of brain Glu concentrations can be achieved with Magnetic Resonance Spectroscopy (MRS), which enables in vivo quantification of neurochemicals and changes in such metabolites that may occur over time in healthy aging and disease. Because Glu’s chemical structure gives rise to multiple resonances that overlap with signals from other brain metabolites, MRS studies have traditionally quantified the combined glutamate + glutamine signals (Glx). MRS investigations specifically measuring Glu alone show lower concentrations with older age in various brain regions including frontal white matter, parietal gray matter [21,113], motor cortex [56], anterior cingulate cortex, hippocampus [116], and basal ganglia [21,113]. We previously demonstrated, in a preliminary study, that MRS-detectable Glu was lower in healthy older adults than young adults in the striatum, but not cerebellum or pons [139].
The relation between Glu and cognitive and motor functions is seldom assessed using in vivo imaging techniques. Indeed, behavioral pharmacology has provided the mainstay of evidence for Glu’s role in cognition [108]. In rodents, blockade of Glu receptors impairs spatial working memory [85] and object recognition [136]. In healthy human volunteers, glutamatergic antagonists (e.g., ketamine) impair performance on tests of verbal [95] and nonverbal declarative memory [88], verbal fluency, and problem solving [61]. We provided initial validation of the functional relevance of MRS-derived Glu by showing that the levels of striatal Glu, but none of the other metabolites measured, correlated selectively with performance on cognitive tests showing age-related decline [139]. Similarly, a study in patients with human immunodeficiency virus (HIV) infection found relations between MRS-derived Glu and cognitive function [39].
Metabolites more commonly evaluated using proton MRS include N-acetylaspartate (NAA), choline-containing compounds (Cho), and total creatine (tCr). Despite their presence at relatively high concentrations, the metabolic and neurochemical functions of MRS-detectable metabolites are controversial. NAA, generally considered to be higher in gray than white matter [67,117] (but see [50]), and representative of the integrity of mature neurons [131], may be an osmolyte [127], a source of acetate for myelin lipid synthesis in oligodendrocytes [71,83], or may play a role in mitochondrial energy metabolism [7,47,97]. tCr, reflecting the substrates available for the brain’s high-energy phosphate metabolism [114], and higher in gray than white matter [128], may also be an osmolyte [110]. The MRS Cho signal derived from free choline, phosphocholine, and glycerophosphohcoline [5] is associated with cell membrane synthesis and turnover, and increases in acute multiple sclerosis lesions during active myelin breakdown [71] and in acute alcohol intoxication [140,141].
A meta-analysis of 20 MRS studies published between 1980 and 2006 compared results between healthy younger (under 60 years) and older (over 60 years) individuals [45]. Of 20 studies, 14 reported no age-related differences in NAA, 2 reported higher concentrations, while 4 reported lower concentrations with older age. For tCr and Cho, 13 studies reported no age-related changes, 7 higher levels of tCr, and 6 higher levels of Cho with older age [45]. Although the reports varied, the meta-analysis implicated a trend for lower NAA and higher tCr and Cho with older age. In healthy aging, lower NAA may represent a compromise in neuronal integrity due to changes in mitochondrial energy utilization or fluid balance [33]; abnormally high Cho might be attributed to membrane breakdown indicating demyelination [71]; high tCr levels may likewise indicate demyelination [18], but may also signify altered fluid balance, gliosis [18], or a shift to higher energy utilization [114].
The current study in individuals ranging in age from 20–86 years old used an in vivo MRS method optimized to detect Glu [75]. Three brain regions, the striatum, cerebellum, and pons, were chosen because they are targets of cortical glutamatergic efferents and their gross morphology is differentially affected by age [55,105,104,126]. Simultaneous measurement of NAA, tCr, and Cho with contemporaneously acquired cognitive and motor testing in healthy men and women across the adult age range allowed us to test the following hypotheses: 1) NAA and Glu would be negatively correlated and tCr and Cho would be positively correlated with older age; 2) age-related differences in Glu would be greater in basal ganglia than in cerebellum or pons; and 3) decline in cognitive and motor functions would be selectively related to decline in Glu of the basal ganglia over an above the contribution from variation in striatal gray matter volume. Whether the age effects would be modulated by sex was an open question.
2. Methods
2.1 Participants
Volunteers were healthy women (n=27, age range = 20 to 85 years) and men (n=34, age range = 20 to 86 years) recruited from the local community (Table 1); 24 of the 61 subjects were included in a previous study [139]. All subjects provided written, informed consent to participate in this study, which was approved by the Institutional Review Boards of SRI International and Stanford University. Participants underwent a thorough psychiatric interview by a trained research psychologist using the Structured Clinical Interview for the Diagnostic and Statistical Manual (DSM) IV-TR to detect diagnoses or medical conditions that can affect brain functioning (e.g., diabetes, head injury, epilepsy, uncontrolled hypertension, radiation, or chemotherapy) or preclude MR study (e.g., pacemakers).
Table 1.
Group Demographics: means, standard deviations, and ranges
| Age | SESb | |
|---|---|---|
| Female (n=27) | 48.8±22.3 (20.4 – 85.0) | 25.8±11.7 (11 – 54) |
| Male (n=34) | 48.1±19.4 (20.0 – 86.3) | 27.1±12.3 (11 – 58) |
| P valuea | 0.9006 | 0.6606 |
2-talied t-tests;
Socio-Economic Status;
National Adult Reading Test;
Dementia Rating Scale;
Body Mass Index;
Blood Pressure
Based on a quantitative handedness questionnaire (on which right-handed scores = 14–32 and left-handed scores = 50–70), all but 4 participants, who scored above 50, were right-handed (average score = 23.5±11.0)[31]. Older age was associated with higher socio-economic status (r=.53=, p ≤.0001)[51], more education (r=.46, p ≤.0002), and higher estimated general intelligence (r=.40, p =.0014) based on the National Adult Reading Test (NART)[86]. On the Dementia Rating Scale (DRS), all participants scored within the normal range for healthy individuals living in the community (cut-off for dementia ≤124 out of 144, average in this sample = 140.2±2.7, range = 133 – 144)[74,133]. Average Body Mass Index (BMI) was 25.4±4.3 kg/m2 and below the mean calculated from 5,200 subjects participating in the Cardiovascular Health Study (26.3±3.9 kg/m2)[54]. Higher systolic blood pressure was observed with older age (r=.35, p =.006) and men had a significantly higher systolic blood pressure than women (t(1,57)=3.27, p=.0018)[26]. Mean arterial pressure [((2 x diastolic)+systolic)/3] did not show age effects, but was higher in men than women (t(57)=2.75, p=.0081). Two men and 2 women were current smokers; 6 men and 1 woman were past smokers.
2.2 MRS acquisition
MRS was performed using constant time point-resolved spectroscopy (CT-PRESS; [37]) on a 3T GE MR scanner. Single voxels were manually positioned in left or right striatum, left or right cerebellum, and central pons; hemisphere of voxel placement was balanced across subjects and groups. The following voxel dimensions (medial/lateral × superior/inferior × anterior/posterior) were used: striatum, 18.7×19.5×29.1mm3= 10.6cc; cerebellum, 24.1×20.3×20.2mm3 = 9.8cc; and pons, 21.0×15.9×17.8mm3= 5.9cc. Because of variability in the size of the lateral ventricles, the striatal voxel was the least homogeneous among subjects. Depending on the individual, the voxel may have included, in addition to the head of the caudate and anterior putamen, portions of the lateral ventricles, internal capsule, globus pallidus, and thalamus. The acquisition time was ~9 min per voxel: average echo time (TE) = 139 ms, 129 chemical shift (CS) encoding steps, Δt1 /2 = 0.8 ms, repetition time (TR) = 2 s, 2 averages [76]. A scan without water suppression was acquired (17 CS encoding steps, Δt1 /2 = 6.4 ms, 2 averages) to measure the tissue water content used to normalize the metabolite signal intensities. Data acquired without water suppression aided in metabolite quantification and were apodized in t2 with a 5 Hz Gaussian line broadening and zero-filled up to 4K points for each TE.
After performing a fast Fourier transform (FFT) along t2, water spectra were evaluated by peak integration. The amount of CSF and tissue water was estimated by fitting a bi-exponential model to the data across the 17 TEs [77]. Apodization of the water-suppressed data entailed multiplication with sine-bell functions in both time dimensions and zero-filling up to 4K×1K data points. After performing a 2D FFT, effectively decoupled 1D CT-PRESS spectra were obtained by integrating the 2D spectrum in magnitude mode along f2 within a ±13 Hz interval around the spectral diagonal. The 3 single t resonances (NAA, tCr, and Cho) were fit simultaneously, and the Glu resonance fit independently, with a Gaussian function within a ±7.95 Hz window using a downhill simplex method (IDL AMOEBA). The integrated area under the fitted Gaussian was used for quantification. The quality of the spectra allowed evaluation of signals of the major proton metabolites: NAA (2.01 ppm), tCr (3.03 ppm and 3.93 ppm), Cho (3.20 ppm), and Glu (2.35 ppm)(Figure 1).
Figure 1.
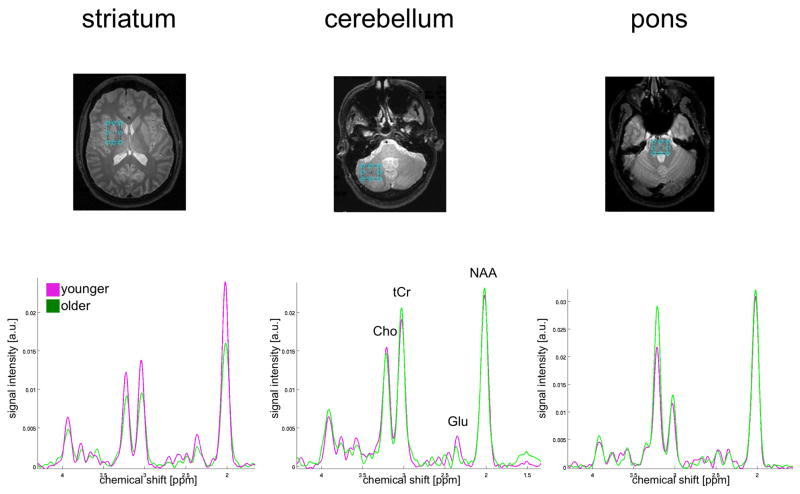
Representative spectra from younger (magenta) and older (green) women.
a.u. = arbitrary units. (striatum: younger = 22 years, older = 71 years; cerebellum: younger = 34 years, older = 85 years; pons: younger = 31 years, older = 79 years)
2.3 Structural MRI acquisition
An axial dual-echo Fast Spin Echo (FSE) MRI (field of view = 24 cm, frequency encodes = 256, TE1/TE2/TR = 17/102/7500 ms, phase encodes = 192, echo train length = 8, slice thickness = 2.5 mm, spacing = 0mm) was used for voxel placement and to quantify tissue and CSF volumes in each voxel. Signal-to-noise ratio was adequately robust to determine fractions of gray matter and white matter in the striatal voxel with an intensity-based segmentation routine [e.g., 66] to evaluate whether changes in metabolite levels were related to changes in the relative proportions of tissue volumes.
2.4 Subject motion detection
Accuracy of voxel placement is potentially affected by subject motion in the time interval between voxel placement and acquisition as well as during acquisition itself, which can result in reduced spatial overlap between the prescribed and the acquired voxel volumes. To exclude voxels with significantly reduced overlap, subject motion was detected by comparison of the FSE images acquired before MRS acquisition and a 3-plane anatomical localizer acquired thereafter.
To this end, pre-MRS FSE images were aligned with the post-MRS localizer by rigid image registration. Without motion, the resulting image-to-image coordinate transformation was identical to the ideal transformation, which was determined from the scanner image coordinates as recorded in the DICOM image files. The deviation of the actual from the ideal transformation (i.e., the difference transformation) represents subject motion between the FSE used for voxel prescription and the post-MRS localizer scan.
The effect of motion on a voxel depends not only on the detected motion but also on the location and size of that voxel (e.g., rotation around the center of a voxel has a smaller effect than rotation by the same angle around a point outside the voxel). To quantify this effect, binary masks of the prescribed voxel volumes were generated in the space of the FSE images. The aforementioned difference transformation was then applied to each prescribed voxel mask in FSE space, yielding a reformatted voxel mask, also in FSE space, which represented the voxel that was actually acquired. The overlap of prescribed and acquired voxel locations was then computed and expressed in percent of the voxel volume. When there was no motion detected, the difference transformation was the identity transformation, both voxel masks were identical, and overlap 100%.
There was a clear threshold for partitioning of the ideal-to-actual voxel overlap distribution at 62% for all 3 regions. MRS data of 1 or 2 voxels were excluded for 8 subjects: 5 cerebellar voxels because of poor spectral quality (2 women, 1 man) or poor overlap (1 woman, 1 man); 4 pontine voxels because of poor overlap (2 women and 2 men). Data from 1 pontine voxel (woman) was never acquired. Thus, data of adequate quality were analyzed for 61 striatal voxels, 56 cerebellar voxels, and 56 pontine voxels.
2.5 Cognitive / motor assessment
Because of well-known selective brain structure-function relations, tasks were chosen to be representative of functions subserved by our regions of interest, e.g., Grooved Pegboard for the striatum and a force platform task for the cerebellum. In addition, because each of the regions of interest receives cortical glutamatergic afferents, including projections from the frontal cortex, a variety of frontally-based tasks were also included. All administered tasks are described in detail below.
Three fluency tests were administered. Phonological fluency, dependent on frontal lobe areas [17,53], especially the left frontal lobe anterior to Broca’s area [4], required subjects to say, in one minute per letter, words beginning with the letters F, A, and then S [11]. Semantic fluency, which relies on the integrity of the temporal and parietal lobes, required subjects to say words, in one minute per category, that were inanimate objects, animals, and alternatingly birds or colors [87]. The Ruff figural fluency test measures right frontal and executive cognitive functioning and required that subjects draw unique designs, follow rules, and ignore distractors [111].
Working memory, subserved by frontostriatal and frontocerebellar systems [14,28,35,98], was evaluated using the modified Sternberg variable memory load test, for which subjects remembered 1, 3, or 6 letters over 5s. intervals; score was reaction time (RT) with the highest load, minus RT with lowest load when the stimulus was present [34,35].
Upper-limb motor tasks included Fine Finger Movements and Grooved Pegboard. The Fine Finger Movement test requires coordinated action of thumb and index finger. The subject rotated a small knob as quickly as possible, using thumb and index finger, which in turn advanced a counter [29]. This test provides an index of fine distal finger movement capacity, which has been shown to be unrelated to cognitive impairment resulting from cortical dementia [29]. The Grooved Pegboard test, which requires complex visual-motor coordination and unilateral function [48], is a manipulative dexterity test consisting of 25 holes with randomly positioned slots; pegs with a key along one side must be rotated to match each hole before they can be inserted. Since there was a strong correlation for right-handed and left-handed Grooved Pegboard performance (r=.75, p=.0001), all analyses used the average of right- and left-handed performances.
Balance was assessed with a Force Platform paradigm employed while subjects stood, without shoes, in the center of a Kistler Force Platform (model 9284; Amherst, NY). Subjects were tested with their feet together, arms relaxed at their sides, and eyes either open or closed. In the single-processing condition, subjects were asked to stand as still as possible on the platform while the sway path is measured. A secondary task then added to produce a dual-processing condition. In the dual-processing condition, subjects listened, through speakers mounted on either side of the force platform, to sets of pre-recorded digit strings (9 total). Strings were spoken in 4.5s epochs, followed by 0.5s intervals for the subject response (50s total= 2s before+45s+3s after). In the easier condition, subjects heard 3 digits and 2 operands followed by a correct (66%) or incorrect (33%) answer (e.g., 2+5−3 = 4; 3−1+8 = 11) to which they had to respond —yes or —no vocally. In the harder condition, subjects had to additionally respond —odd or —even in response to the given answer. Accuracy of answers was recorded while sway path was measured. Each condition was repeated 3 times. Score was sway path with eyes closed minus sway path with eyes open in each condition:
For all cognitive and motor measures, raw scores were used for analysis.
2.6 Statistical analysis
Laterality effects (i.e., voxel placement in the left or right hemisphere) on metabolite levels in striatal and cerebellar voxels were tested using paired t-tests. Multivariate analysis of variance (MANOVA) evaluated regional effects on metabolites (e.g., NAA in striatum, cerebellum, and pons). Multiple-regression analyses entering age and sex as simultaneous predictors were used to determine the unique variance contributed by each variable to each metabolite. Further multiple-regression analyses included additional variables of interest (e.g., systolic blood pressure). Significant effects (p ≤.05, 2-tailed) were followed up by simple regressions or paired t-tests, where appropriate.
3. Results
3.1 Effects of Hemisphere and Region on Metabolites
The effects of voxel placement (i.e., left or right hemisphere) on metabolite levels in the striatal and cerebellar regions of interest were evaluated (not applicable for the pons with its midline voxel placement). Paired t-tests showed that laterality of voxel placement did not predict metabolite levels in the striatum (NAA: t(59)=1.13, p=.2638; tCr: t(59)=1.07, p=.2868; Cho: t(59)=.15, p=.8817; Glu: t(59)=.38, p=.7036) or cerebellum (NAA: t(54)=.26, p=.7984; tCr: t(54)=.42, p=.6770; Cho: t(54)=.86, p=.3946; Glu; : t(54)=1.89, p=.0645); consequently, data across the 2 hemispheres were combined, and laterality effects were not considered further.
Separate MANOVAs for each metabolite compared levels across the 3 regions and revealed that the levels of all 4 metabolites varied regionally (NAA: F(2, 170)=418.41, p=.0001; tCr: F(2,170)=468.12, p=.0001; Cho: F(2,170)=489.42, p=.0001; Glu: F(2,170)=5.27, p=.006) (Figure 2). NAA and Cho showed a graded effect: pons>cerebellum>striatum (all comparisons p=.0001). Regional variability in tCr was also graded: cerebellum>pons> striatum (all comparisons p=.0001). Glu levels were higher in striatum than cerebellum (p=.0095) or pons (p=.0038) but were not different between the cerebellum and pons (p=.7600). Such variability precluded collapsing of metabolite data across the 3 regions; consequently, all further analyses were conducted separately for each region.
Figure 2.
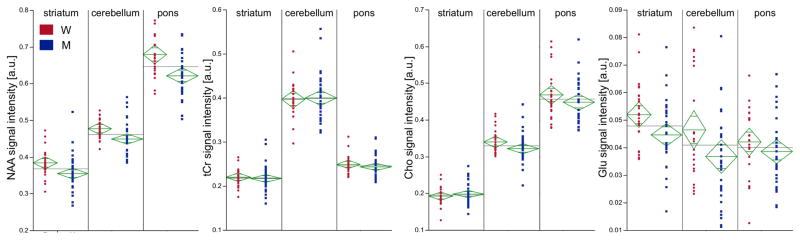
Metabolite levels by region: red circles represent women, blue squares represent men. The green diamonds represent the means and standard errors for each group while the gray lines indicate the mean across the 2 groups. W = women, M = men, a.u. = arbitrary units.
3.2 Effects of Sex and Age on Metabolites
Multiple-regression analyses included sex and age to predict levels of each of the 4 metabolites in each of the 3 regions (Figure 3). Sex differences were present for NAA (striatal: t(3,57)=2.91, p=.0052; cerebellar: t(3,52)=2.71, p=.0091; pontine: t(3,52)=3.39, p=.0013) and Glu (striatal t(3,57)=2.64, p=.0108); cerebellar t(3,52)=2.09, p=.0420); in all cases, women had higher values than men: NAA striatum: t(59)=2.64, p=.0106, Cohen’s d=.69; cerebellum: t(54)=2.66, p=.0104, Cohen’s d=.74; pons: t(54)=3.46, p=.0011, Cohen’s d=.94; Glu striatum: t(59)=2.38, p=.0207, Cohen’s d=.62; cerebellum: t(54)=2.09, p=.0413, Cohen’s d=.56. After correcting for multiple comparisons (i.e., 3 regions, requiring a p≤.0167), sex differences in metabolite levels persisted for NAA in all 3 regions, but not for Glu in either the striatum or cerebellum.
Figure 3.
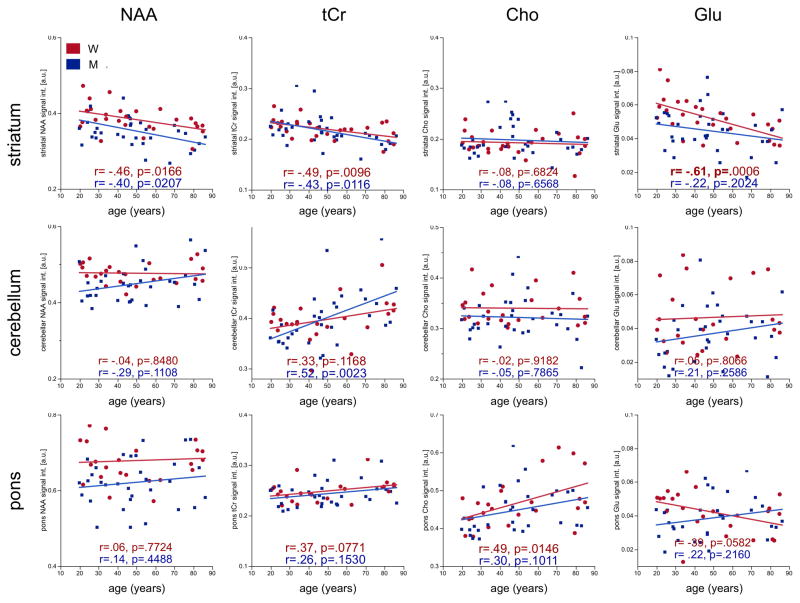
Linear-regression plots of metabolite levels by age in either women (red) or men (blue). W = women, M = men, a.u. = arbitrary units.
Of the 12 comparisons, 6 showed significant age effects on metabolite levels: striatal NAA (t(3,57)=−3.43, p=.0011), tCr (t(3,57)=−3.69, p=.0005), and Glu (t(3,57)=−3.29, p=.0017) were lower with older age; cerebellar tCr (t(3,52)=3.53, p=.0009), pontine tCr (t(3,52)=2.28, p=.0270), and pontine Cho (t(3,52)=3.09, p=.0032) were higher with older age. Only Glu in the pons showed an age-by-sex interaction (t(3,52)=−2.28, p=.0264), although neither sex nor age alone predicted levels. After correcting for multiple comparisons, age effects persisted for 5 of the 6 metabolites (all but pontine tCr).
Sex was a significant predictor of NAA levels in all 3 regions over and above contributions from either systolic blood pressure or mean arterial pressure. Similarly, age was a significant predictor of the relevant metabolite levels (i.e., striatal NAA, tCr, cerebellar tCr, pontine Cho) over and above the contribution from systolic blood pressure with the exception of striatal Glu. Age (t(3,55)=−2.29, p=.0262), systolic blood pressure (t(3,55)=−2.55, p=.0134), and their interaction (t(3,55)=2.33, p=.0237) significantly predicted striatal Glu levels.
3.4 Effects of Tissue Fraction on Age and Sex Correlates of Striatal Metabolites
Only the striatal voxel could be adequately segmented for tissue fraction [66]. Age but not sex contributed significantly to the variance in striatal CSF (t(3,56)=3.63, p=.0006), striatal gray matter (t(3,56)=−3.02, p=.0038), and total striatal tissue volume (t(3,56)=−2.54, p=.0139). Both age (t(3,54)=−2.04, p=.0464) and systolic blood pressure (t(3,56)=−2.08, p=.0423) significantly predicted striatal gray matter volume. Age significantly predicted striatal CSF and total tissue volume over and above the contribution from systolic blood pressure. Smaller striatal gray matter volumes correlated with lower levels of striatal NAA (r=.28, p=.0295) and Glu (r=.28, p=.0299).
3.5 Effects of Sex, Age, and Blood Pressure on Neuropsychological Test Performance
Performance was worse in older than younger participants on tests of visuomotor skills and balance, but not on any of the fluency or working memory measures. A multiple-regression model (predicting 45.1% of the variance) showed that age (t(3,54)=4.90, p=.0001) and systolic blood pressure (t(3,54)=2.10, p=.0408), but not sex accounted for significant unique variance for Grooved Pegboard performance. A multiple-regression model explaining 13.7% of the variance showed that age (t(3,53)=2.13, p=.0377) but neither sex nor systolic blood pressure contributed unique variance to sway path in the single-processing condition. Although performance in the dual-processing, easy condition was sensitive to age (r=28.1, p=.0308), a multiple-regression model including age, sex, and systolic blood pressure was not significant. Force platform performance in the dual-processing, difficult condition was independent of age, sex, and systolic blood pressure.
3.6 Behavioral and Physiological Correlates of Metabolites
For Grooved Pegboard performance, a multiple-regression model including the metabolites showing age effects revealed that together the 5 metabolites contributed to 22.7% of the variance in performance, but that none contributed independently. Thus, multiple-regression analyses were run repeatedly, each time removing the metabolite contributing least to variance based on p-values. After striatal NAA and tCr were removed, striatal Glu (t(3,48)=−2.29, p=.0268) endured as a significant and independent predictor of Grooved Pegboard performance over and above the contributions from either cerebellar tCr or pontine Cho (the 3 together contributing 22.1% to the variance in performance).
Age, systolic blood pressure, striatal gray matter volume, and striatal Glu together accounted for 45.8% of the variance in Grooved Pegboard performance. Age and systolic blood pressure were significant predictors over and above the contributions of striatal gray matter and striatal Glu. Removing age and systolic blood pressure as predictors from the multiple-regression model showed that striatal gray matter volume (t(2,56)=−2.21, p=.0310) and striatal Glu (t(2,56)=−2.13, p=.0377) each significantly predicted Grooved Pegboard performance. Parsing the variance indicated that striatal Glu (7.1%) and striatal gray matter volume (7.2%) accounted for similar proportions of the variance considered (Figure 4a).
Figure 4.
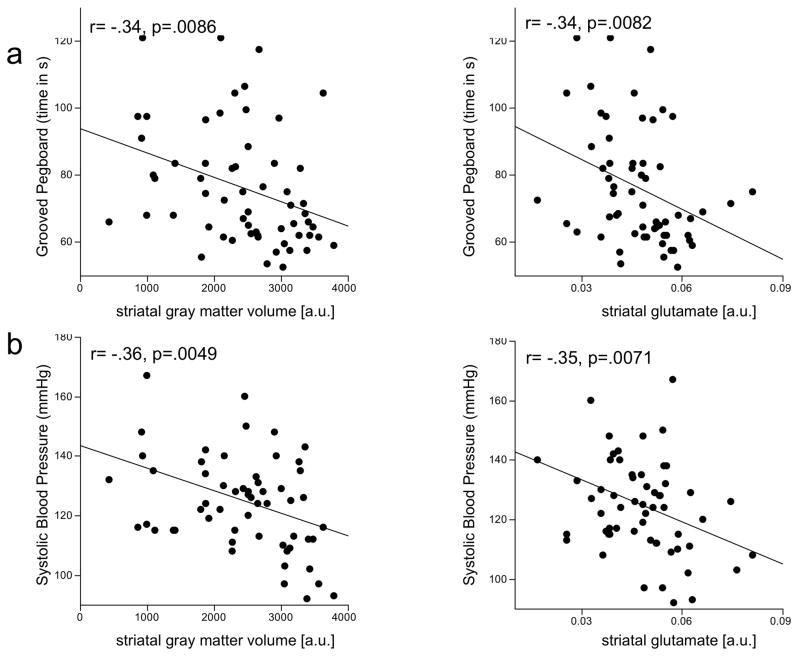
Linear-regression plots of striatal gray matter and glutamate correlates of Grooved Pegboard performance and systolic blood pressure. a.u. = arbitrary units.
For sway path in the single-processing condition, a multiple-regression model indicated that the 5 metabolites showing age effects together accounted for 26.3% of the variance in performance and that striatal NAA (t(5,46)=−2.32, p=.0249) was a significant independent predictor of performance over and above the contributions of the other metabolites. Striatal NAA (t(4,53)=−2.54, p=.0140) was also a significant independent predictor of sway path over and above the contributions of age, sex, and striatal gray matter volume (together accounting for 23.3% of variance in performance); by itself, striatal NAA accounted for 20.5% of the variance considered.
Age (t(2,56)=3.21, p=.0022) and sex (t(2,56)=−3.59, p=.0007), together accounting for 28.9% of the variance, each significantly predicted systolic blood pressure. Systolic blood pressure, in turn, significantly predicted striatal Glu levels (t(1,57)=−2.79, p=.0071) and striatal gray matter volume (t(1,56)=−2.93, p=.0049)(Figure 4b).
4. Discussion
Normal aging, that is, aging without concomitant neurological disorders, is associated with a specific profile of cognitive decline. Alterations to Glu homeostasis have been hypothesized to contribute to such decline [120]. Because Glu’s chemical structure gives rise to multiple MRS resonances that overlap with signals from other metabolites, namely glutamine and NAA, there are relatively few reports that quantify Glu independently. As a consequence, few studies have focused on the functional significance of age-related alterations to the glutamatergic system. Evidence for age-linked cognitive changes to the glutamatergic system has been derived primarily from correlations between rodent behavior and Glu receptor levels measured with in vitro autoradiography [e.g., 90,91]. Our previous in vivo results, however, yielded a spectroscopic Glu signal with adequate signal-to-noise ratio to demonstrate a substantial correlation between lower levels of striatal Glu and poorer performance on cognitive tests showing age-related decline [139].
The current results in 61 healthy individuals (age range 20–86) corroborate our earlier MRS study that included data from 12 young (25.5±4.34 years) and 12 older (77.67±4.94 years) healthy participants [139]. The regional metabolite variation (highest NAA and Cho in the pons, tCr in the cerebellum, and Glu in the striatum) and the pattern of metabolite changes with older age (lower tCr and Glu in the striatum, higher tCr in the cerebellum, and higher Cho in the pons) in this larger sample replicated the pattern observed in the discontinuous-age comparison study. The present findings extend previous results by demonstrating sex differences: relative to women, men had lower NAA in the striatum, cerebellum, and pons. These sex differences persisted after accounting for the potential confounding effects of systolic blood pressure or mean arterial pressure. Furthermore, the current study revealed that striatal Glu levels were predicted by systolic blood pressure and in turn predicted performance on a complex visuo-motor task.
4.1 Effects of Laterality and Region on Metabolites
Statistical analyses comparing voxel placement in left versus right striatum or left versus right cerebellar hemisphere demonstrated that laterality of placement did not predict metabolite levels; consequently, data across the 2 hemispheres was combined. Consistent with a number of human MRS studies [e.g., 3,42,59,94], the current report reveals regional neurochemical heterogeneity. The pons, dense in both nuclei and white matter fiber tracts, has been shown in several MRS studies in healthy normal adults to have higher levels of NAA and Cho than other brain regions [3,72,79,84,112]. The cerebellum, relative to other brain regions, has high levels of tCr [3,79,101,128] and high levels of creatine kinase (which catalyzes the production of ATP) [52], possibly due to its higher energy demands compared with other brain regions [57]. A previous study showed regional variability of Glu with higher levels in the motor cortex than corona radiata [56], while another, comparing frontal, parietal, and occipital gray matter, did not [101].
4.2 Effects of Sex on Metabolites
Higher levels of NAA in striatum, cerebellum, and pons of women than men were independent of the effects of systolic blood pressure or mean arterial pressure and may be related to intrinsic sex differences in the brain such as a greater density of neurons (higher number of viable neurons per unit of gray matter) in some brain regions of women than men [137]. In general, however, MRS studies have not identified sex differences in NAA levels (cortical gray matter [10,23,36,59,101,109,112], subcortical gray matter [23], supraventricular white matter [23,36,101,103], thalamus [59,101,112], hippocampus [36,59], cerebellum [101], or basal ganglia [8,36,59,112,134] but see [42]).
4.3 Effects of Age on Metabolites
Whereas striatal NAA levels showed only a statistical trend towards lower levels in our previous study, they were significantly lower with older age in the current, larger study. Previous studies reported either significant [2,45,67,103] or negligible [1,9,24,42,43,64,100,115,119,122] age-related differences in NAA in healthy men and women. In some brain regions, there is evidence both for and against the vulnerability of NAA to age (e.g., frontal: for [16,38], against [20,22,46,56,109]; occipital: for [27], against [109,115]; and basal ganglia: for [22,46], against [6,8,134]), while in other brain regions, evidence is generally consistently for (temporal regions [2], hippocampus [38,118], and midbrain [84]) or consistently against (parietal white matter [46,65,78,115] and pons [30,84]) age-related compromise in NAA levels. Lower levels of striatal NAA with older age might reflect the vulnerability of the striatum to volume loss as suggested by results of in vivo structural imaging [13,44] and postmortem evaluation [107]. An alternative interpretation for decreased striatal NAA with older age is altered metabolic activity. Metabolic compromise in older age [e.g., 58,73,81] may result from age-related mitochondrial dysfunction [68] as recently suggested by a 13C/1H MRS study showing that mitochondria can lose oxidative capacity with advancing age [12]. Indeed, lower levels of striatal NAA may represent a compromise in mitochondrial energy metabolism [7,47,97].
In our study, levels of tCr in the striatum were lower in older than younger individuals while levels in the cerebellum were higher in older than younger individuals. Much of the available evidence suggests that tCr levels are higher in older age [45] in specific regions including cortical (e.g., frontal and parietal) white [2,24,65,99,100,115,119] and gray matter [20,99,100], temporal lobes [2], and pons [84]. While age-related increases in tCr levels have been proposed to reflect gliosis, available pathological data do not support this interpretation [69]. Instead, higher and lower levels of tCr with age may reflect changes in cellular energy metabolism [24]. The current results hint at the intriguing possibility that as striatal function is compromised, activity and energy utilization (reflected by higher levels of tCr) in the cerebellum increase in compensation [125].
Cho in the pons was higher in older than younger participants [123], consistent with other MRS studies of aging in regions including cortical gray matter [2,99,100], temporal [2] and parietal [56,65] regions, and the pons [84]. Abnormally high pontine Cho may reflect membrane breakdown [71] or age-related demyelination [93].
Striatal Glu levels were lower in older than younger individuals. The direction of change is consistent with other human MRS studies, that succeeded in isolating the Glu peak. Those studies observed lower Glu concentrations in older age in the hippocampus, anterior cingulate cortex [116], motor cortex [56], frontal white matter, parietal gray matter, and basal ganglia [21,113].
Glu is found predominately in neurons [92,96]; glial and extracellular Glu levels are relatively low [138]. NAA, like Glu, is also localized primarily in neurons and is considered to be a marker of mature neurons and neuronal integrity [82,131]. The present study showed a strong positive correlation between lower levels of striatal NAA and Glu and smaller striatal gray matter volumes. These relations support the contention that the MRS-derived Glu signal is primarily neuronal.
There are at least two potential sources of neuronal Glu in the striatum. One is the population of medium spiny neurons, which account for 95% of cells in the striatum. Although Glu might be expected to be present in GABAergic medium spiny neurons in a metabolic pool and as a precursor of GABA, immunohistochemical studies have shown that Glu concentration is low in GABAergic neurons [92,124]. The second, more likely source of neuronal Glu in the striatum is in axon terminals of corticostriatal projections. Corticofugal connectivity is interrupted in aging [70], and the amplitude and clearance of K+-evoked Glu release in the striatum is significantly decreased in aged as compared to middle-aged and young Fischer rats [89]. These findings support the contention that lower striatal Glu levels might represent fewer or less effective corticostriatal projections. This interpretation is also supported by evidence for age-related striatal volume loss that has not been shown as attributable to loss of medium spiny neurons [13,32,60,106]. If striatal volume loss with age is not due to loss of medium spiny neurons, it might instead reflect volume loss due to fewer cortical glutamatergic fibers in the striatum. Autoradiography of postmortem rodent and human tissue demonstrating lower Glu receptor binding with older age in basal ganglia regions [80,132] may also reflect a decrease with age in cortical innervation of the striatum.
To confirm that cortical fibers are indeed the source of MRS-derived Glu in the striatum, additional experiments are necessary. Spectroscopic imaging, which permits whole-brain quantification of proton metabolites, would enable measurement of Glu in cortical regions and striatum simultaneously. If spectroscopic imaging demonstrated that Glu levels in both cortical regions and the striatum are lower with older age, this would suggest that corticostriatal fibers are the source of striatal Glu. MRS-derived quantification of GABA would also be helpful in distinguishing whether Glu in the striatum is derived from cortical projections or from intrinsic medium spiny neurons. Lower striatal GABA levels with age would support the latter possibility, i.e., that lower striatal Glu with age reflects loss of GABAergic medium spiny neurons in the striatum.
4.4 Behavioral and Physiological Correlates of Metabolites
Striatal NAA predicted balance performance in the single-processing condition. A relation between postural balance and integrity of basal ganglia structures has been reported in the context of Parkinson’s disease [e.g., 15], but relatively little work has explored the relationship in healthy controls. Additional studies are necessary to interpret the relevance of striatal NAA to postural stability.
Predictors of Grooved Pegboard performance included age, systolic blood pressure, striatal gray matter volume, and striatal Glu. After age and systolic blood pressure were removed from the multiple-regression model, it was found that both striatal gray matter and Glu contributed to the variance in performance on the Grooved Pegboard. These results are notable in that striatal Glu superseded NAA as a correlate of performance on the Grooved Pegboard. A previous study demonstrated a relationship between lower Glu in parietal gray matter and worse performance on the Grooved Pegboard task in individuals with HIV infection [39]. Such results indicate a biologically relevant significance to the MRS-derived Glu signal.
Age and sex were significant predictors of systolic blood pressure. Higher systolic blood pressure was associated with lower striatal gray matter volume and striatal Glu. A similar inverse relationship was recently demonstrated between mean arterial pressure and hippocampal Glu levels [135]. Lenticulostriate arteries supply the head of the caudate nucleus, anterior internal capsule, and putamen [63], which are all regions included in the striatal voxel. A significant decrease in the number of lenticulostriate arteries was observed in patients with hypertension compared with nonhypertensive volunteers [25]. In a sample of 500 patients, 33% presented with silent infarctions in the territory of the lenticulostriate arteries and were noted to have high systolic and diastolic blood pressure [19]. Infarcts involving the lenticulostriate arteries result in motor abnormalities characterized by facial and upper extremity weakness in 2/3 of patients [63]. Importantly, while hypertension and consequent cerebral atherosclerosis has often been associated with cognitive decline, hypertensive patients can suffer from cognitive decline even with no in vivo signs of cerebrovascular disease [102]. The current study suggests that high blood pressure may be a mechanism whereby cognitive function is compromised. Indeed, systolic blood pressure was better than striatal Glu inpredicting performance on the Grooved Pegboard.
4.5 Limitations
A significant difference between the current study and our earlier one based on a smaller sample [139] was the attenuation of correlations between striatal Glu and the various cognitive and motor measures. A possible explanation is that whereas in the initial study, age-related decline was demonstrated for cognitive domains including fluency and working memory, few age effects on behavior were forthcoming in this larger sample. Our key MRS results in the current sample (decreased striatal NAA, increased cerebellar tCr and pontine Cho) corroborate the results of a meta-analysis of MRS findings in aging [45], but a distinction between this and several other MRS studies was the detection, herein, of sex differences in the levels of NAA. Such discrepancies may be due to a variety of factors, including regional variation in NAA, voxel size, voxel placement (affecting gray matter/white matter/CSF distribution), whether tissue (gray matter, white matter, CSF) fraction is considered, method of metabolite quantification, including the spectral fitting method used, quality of the data, and quality of shimming and water suppression.
Despite our consideration of many such variables in the acquisition and quantification of the current data, there were limitations we were unable to overcome. For example, partial volume effects within the voxel due to mixed contributions of brain tissue and CSF were accounted for by normalizing the metabolite data to the amount of tissue water as estimated from MRS data acquired without water suppression. Tissue was not further differentiated, but gray (0.745) and white (0.615) matter have insignificantly different water content [40], so differing contributions should only have had minor effects on metabolite quantification.
Furthermore, due to the relatively long average TE of 139ms in CT-PRESS, transverse relaxation (T2) could have significantly influenced metabolite signal intensities and the reported changes could be due to changes in metabolite T2s. Because CT-PRESS data are acquired at different TEs, T2 information encoded in the data could potentially be extracted. However, the signal-to-noise ratio of the current MRS dataset was insufficient for a reliable estimate of metabolite T2s.
Finally, in contrast to using creatine as an internal reference, correcting for voxel tissue water requires an additional acquisition of a data set without water suppression. This increases the risk for motion between the 2 acquisitions, which could affect metabolite quantification. The acquisition of a localizer scan at the end of the MRS acquisition, however, allowed us to screen for motion and indicated insignificant misregistrations between the vast majority of acquisitions.
4.6 Conclusion
Single voxel, proton MRS revealed brain regional, sex, and age variations in a sample of 61 healthy individuals aged from 20 to 86 years old. Notable findings include an age-related decline in striatal Glu that is potentially the consequence of high blood pressure. Selective correlations between low striatal Glu levels and poor performance on the Grooved Pegboard test provide evidence for age-related decline in selective functions mediated by striatal glutamatergic substrates.
Acknowledgments
AA017347, AG017979, AA017168, EB008381
Footnotes
In-house image registration software is available in source code as part of the Computational Morphometry Toolkit, http://nitrc.org/projects/cmtk/.
Disclosure statement: None of the authors have any actual or potential conflicts of interest.
Publisher's Disclaimer: This is a PDF file of an unedited manuscript that has been accepted for publication. As a service to our customers we are providing this early version of the manuscript. The manuscript will undergo copyediting, typesetting, and review of the resulting proof before it is published in its final citable form. Please note that during the production process errors may be discovered which could affect the content, and all legal disclaimers that apply to the journal pertain.
References
- 1.Adalsteinsson E, Sullivan EV, Kleinhans N, Spielman DM, Pfefferbaum A. Longitudinal decline of the neuronal marker N-acetyl aspartate in Alzheimer’s Disease. The Lancet. 2000;355:1696–7. doi: 10.1016/s0140-6736(00)02246-7. [DOI] [PubMed] [Google Scholar]
- 2.Angelie E, Bonmartin A, Boudraa A, Gonnaud PM, Mallet JJ, Sappey-Marinier D. Regional differences and metabolic changes in normal aging of the human brain: proton MR spectroscopic imaging study. Ajnr. 2001;22(1):119–27. [PMC free article] [PubMed] [Google Scholar]
- 3.Baker EH, Basso G, Barker PB, Smith MA, Bonekamp D, Horska A. Regional apparent metabolite concentrations in young adult brain measured by (1)H MR spectroscopy at 3 Tesla. J Magn Reson Imaging. 2008;27(3):489–99. doi: 10.1002/jmri.21285. [DOI] [PMC free article] [PubMed] [Google Scholar]
- 4.Baldo JV, Shimamura AP, Delis DC, Kramer J, Kaplan E. Verbal and design fluency in patients with frontal lobe lesions. J Int Neuropsychol Soc. 2001;7(5):586–96. doi: 10.1017/s1355617701755063. [DOI] [PubMed] [Google Scholar]
- 5.Barker PB, Breiter SN, Soher BJ. Quantitative proton spectroscopy of canine brain: in vivo and in vitro correlations. Magn Reson Med. 1994;32:157–63. doi: 10.1002/mrm.1910320202. [DOI] [PubMed] [Google Scholar]
- 6.Bartres-Faz D, Junque C, Clemente IC, Lopez-Alomar A, Bargallo N, Mercader JM, Moral P. Relationship among (1)H-magnetic resonance spectroscopy, brain volumetry and genetic polymorphisms in humans with memory impairment. Neuroscience letters. 2002;327(3):177–80. doi: 10.1016/s0304-3940(02)00424-x. [DOI] [PubMed] [Google Scholar]
- 7.Bates TE, Strangward M, Keelan J, Davey GP, Munro PMG, Clark JB. Inhibition of N-acetylaspartate production: Implications for H-1 MRS studies in vivo. Neuroreport. 1996;7(8):1397–400. [PubMed] [Google Scholar]
- 8.Ben Salem D, Walker PM, Aho S, Tavernier B, Giroud M, Tzourio C, Ricolfi F, Brunotte F. Brain flexibility and balance and gait performances mark morphological and metabolic abnormalities in the elderly. J Clin Neurosci. 2008;15(12):1360–5. doi: 10.1016/j.jocn.2008.01.010. [DOI] [PubMed] [Google Scholar]
- 9.Benedetti B, Rigotti DJ, Liu S, Filippi M, Grossman RI, Gonen O. Reproducibility of the whole-brain N-acetylaspartate level across institutions, MR scanners, and field strengths. Ajnr. 2007;28(1):72–5. [PMC free article] [PubMed] [Google Scholar]
- 10.Bernard D, Walker PM, Baudouinpoisson N, Giroud M, Fayolle H, Dumas R, Martin D, Binnert D, Brunotte F. Asymmetric metabolic profile in mesial temporal lobes: localized h-1 MR spectroscopy in healthy right-handed and non-right-handed subjects. Radiology. 1996;199(2):381–9. doi: 10.1148/radiology.199.2.8668782. [DOI] [PubMed] [Google Scholar]
- 11.Borkowski JG, Benton AL, Spreen O. Word fluency and brain damage. Neuropsychologia. 1967;5:135–40. [Google Scholar]
- 12.Boumezbeur F, Mason GF, de Graaf RA, Behar KL, Cline GW, Shulman GI, Rothman DL, Petersen KF. Altered brain mitochondrial metabolism in healthy aging as assessed by in vivo magnetic resonance spectroscopy. J Cereb Blood Flow Metab. 2010;30(1):211–21. doi: 10.1038/jcbfm.2009.197. [DOI] [PMC free article] [PubMed] [Google Scholar]
- 13.Brabec J, Kraseny J, Petrovicky P. Volumetry of striatum and pallidum in man--anatomy, cytoarchitecture, connections, MRI and aging. Sb Lek. 2003;104(1):13–65. [PubMed] [Google Scholar]
- 14.Braver TS, Cohen JD, Nystrom LE, Jonides J, Smith EE, Noll DC. A parametric study of prefrontal cortex involvement in human working memory. Neuroimage. 1997;5(1):49–62. doi: 10.1006/nimg.1996.0247. [DOI] [PubMed] [Google Scholar]
- 15.Bronte-Stewart HM, Minn AY, Rodrigues K, Buckley EL, Nashner LM. Postural instability in idiopathic Parkinson’s disease: the role of medication and unilateral pallidotomy. Brain. 2002;125(Pt 9):2100–14. doi: 10.1093/brain/awf207. [DOI] [PubMed] [Google Scholar]
- 16.Brooks JC, Roberts N, Kemp GJ, Gosney MA, Lye M, Whitehouse GH. A proton magnetic resonance spectroscopy study of age-related changes in frontal lobe metabolite concentrations. Cereb Cortex. 2001;11(7):598–605. doi: 10.1093/cercor/11.7.598. [DOI] [PubMed] [Google Scholar]
- 17.Butler RW, Jenkins MA, Braff DL. The abnormality of normal comparison groups: The identification of psychosis proneness and substance abuse in putatively normal research subjects. Am J Psychiatry. 1993;150(9):1386–91. doi: 10.1176/ajp.150.9.1386. [DOI] [PubMed] [Google Scholar]
- 18.Caramanos Z, Narayanan S, Arnold DL. 1H-MRS quantification of tNA and tCr in patients with multiple sclerosis: a meta-analytic review. Brain. 2005;128(Pt 11):2483–506. doi: 10.1093/brain/awh640. [DOI] [PubMed] [Google Scholar]
- 19.Chamorro A, Saiz A, Vila N, Ascaso C, Blanc R, Alday M, Pujol J. Contribution of arterial blood pressure to the clinical expression of lacunar infarction. Stroke; a journal of cerebral circulation. 1996;27(3):388–92. doi: 10.1161/01.str.27.3.388. [DOI] [PubMed] [Google Scholar]
- 20.Chang L, Ernst T, Poland RE, Jenden DJ. In vivo proton magnetic resonance spectroscopy of the normal aging human brain. Life sciences. 1996;58(22):2049–56. doi: 10.1016/0024-3205(96)00197-x. [DOI] [PubMed] [Google Scholar]
- 21.Chang L, Jiang CS, Ernst T. Effects of age and sex on brain glutamate and other metabolites. Magnetic resonance imaging. 2009;27(1):142–5. doi: 10.1016/j.mri.2008.06.002. [DOI] [PMC free article] [PubMed] [Google Scholar]
- 22.Chang L, Lee PL, Yiannoutsos CT, Ernst T, Marra CM, Richards T, Kolson D, Schifitto G, Jarvik JG, Miller EN, Lenkinski R, Gonzalez G, Navia BA. A multicenter in vivo proton-MRS study of HIV-associated dementia and its relationship to age. Neuroimage. 2004;23(4):1336–47. doi: 10.1016/j.neuroimage.2004.07.067. [DOI] [PubMed] [Google Scholar]
- 23.Charles HC, Lazeyras F, Krishnan KR, Boyko OB, Patterson LJ, Doraiswamy PM, McDonald WM. Proton spectroscopy of human brain: effects of age and sex. Progress in neuro-psychopharmacology & biological psychiatry. 1994;18(6):995–1004. doi: 10.1016/0278-5846(94)90125-2. [DOI] [PubMed] [Google Scholar]
- 24.Charlton RA, McIntyre DJ, Howe FA, Morris RG, Markus HS. The relationship between white matter brain metabolites and cognition in normal aging: the GENIE study. Brain research. 2007;1164:108–16. doi: 10.1016/j.brainres.2007.06.027. [DOI] [PubMed] [Google Scholar]
- 25.Chen YC, Li MH, Li YH, Qiao RH. Analysis of correlation between the number of lenticulostriate arteries and hypertension based on high-resolution MR angiography findings. Ajnr. 2011;32(10):1899–903. doi: 10.3174/ajnr.A2667. [DOI] [PMC free article] [PubMed] [Google Scholar]
- 26.Chobanian AV, Bakris GL, Black HR, Cushman WC, Green LA, Izzo JL, Jr, Jones DW, Materson BJ, Oparil S, Wright JT, Jr, Roccella EJ. Seventh report of the Joint National Committee on Prevention, Detection, Evaluation, and Treatment of High Blood Pressure. Hypertension. 2003;42(6):1206–52. doi: 10.1161/01.HYP.0000107251.49515.c2. [DOI] [PubMed] [Google Scholar]
- 27.Christiansen P, Toft P, Larsson HBW, Stubgaard M, Henriksen O. The concentration of N-Acetyl aspartate, creatine+phosphocreatine, and choline in different part of the brain in adulthood and senium. Magn Reson Imaging. 1993;11:799–806. doi: 10.1016/0730-725x(93)90197-l. [DOI] [PubMed] [Google Scholar]
- 28.Cohen JD, Perlstein WM, Braver TS, Nystrom LE, Noll DC, Jonides J, Smith EE. Temporal dynamics of brain activation during a working memory task. Nature. 1997;386(6625):604–8. doi: 10.1038/386604a0. [DOI] [PubMed] [Google Scholar]
- 29.Corkin S, Growdon JH, Sullivan EV. Dissociation of sensorimotor function in Alzheimer’s disease (abs) American Aging Association Conference Abstracts. 1981;11:20. [Google Scholar]
- 30.Costa MO, Lacerda MT, Garcia Otaduy MC, Cerri GG, Da Costa Leite C. Proton magnetic resonance spectroscopy: normal findings in the cerebellar hemisphere in childhood. Pediatr Radiol. 2002;32(11):787–92. doi: 10.1007/s00247-002-0777-5. [DOI] [PubMed] [Google Scholar]
- 31.Crovitz HF, Zener KA. Group test for assessing hand and eye dominance. Am J Psychol. 1962;75:271–6. [PubMed] [Google Scholar]
- 32.de Jong LW, Wang Y, White LR, Yu B, van Buchem MA, Launer LJ. Ventral striatal volume is associated with cognitive decline in older people: a population based MR-study. Neurobiology of aging. 2010;33(2):424, e1–10. doi: 10.1016/j.neurobiolaging.2010.09.027. [DOI] [PMC free article] [PubMed] [Google Scholar]
- 33.Demougeot C, Garnier P, Mossiat C, Bertrand N, Giroud M, Beley A, Marie C. N-Acetylaspartate, a marker of both cellular dysfunction and neuronal loss: its relevance to studies of acute brain injury. Journal of neurochemistry. 2001;77(2):408–15. doi: 10.1046/j.1471-4159.2001.00285.x. [DOI] [PubMed] [Google Scholar]
- 34.Desmond JE, Chen SH, De Rosa E, Pryor MR, Pfefferbaum A, Sullivan EV. Increased fronto-cerebellar activation in alcoholics during verbal working memory: An fMRI study. Neuroimage. 2003;19:1510–20. doi: 10.1016/s1053-8119(03)00102-2. [DOI] [PubMed] [Google Scholar]
- 35.Desmond JE, Gabrieli JD, Wagner AD, Ginier BL, Glover GH. Lobular patterns of cerebellar activation in verbal working-memory and finger-tapping tasks as revealed by functional MRI. J Neurosci. 1997;17(24):9675–85. doi: 10.1523/JNEUROSCI.17-24-09675.1997. [DOI] [PMC free article] [PubMed] [Google Scholar]
- 36.Doelken MT, Mennecke A, Stadlbauer A, Kloska S, Struffert T, Engelhorn T, Thuerauf N, Doerfler A, Stefan H, Hammen T. Multi-voxel magnetic resonance spectroscopy of cerebral metabolites in healthy adults at 3 Tesla. Acad Radiol. 2009;16(12):1493–501. doi: 10.1016/j.acra.2009.07.025. [DOI] [PubMed] [Google Scholar]
- 37.Dreher W, Leibfritz D. Detection of homonuclear decoupled in vivo proton NMR spectra using constant time chemical shift encoding: CT-PRESS. Magnetic resonance imaging. 1999;17(1):141–50. doi: 10.1016/s0730-725x(98)00156-8. [DOI] [PubMed] [Google Scholar]
- 38.Driscoll I, Hamilton DA, Petropoulos H, Yeo RA, Brooks WM, Baumgartner RN, Sutherland RJ. The aging hippocampus: cognitive, biochemical and structural findings. Cereb Cortex. 2003;13(12):1344–51. doi: 10.1093/cercor/bhg081. [DOI] [PubMed] [Google Scholar]
- 39.Ernst T, Jiang CS, Nakama H, Buchthal S, Chang L. Lower brain glutamate is associated with cognitive deficits in HIV patients: a new mechanism for HIV-associated neurocognitive disorder. J Magn Reson Imaging. 2010;32(5):1045–53. doi: 10.1002/jmri.22366. [DOI] [PMC free article] [PubMed] [Google Scholar]
- 40.Ernst T, Kreis R, Ross BD. Absolute quantitation of water and metabolites in the human brain: I. Compartments and water. J Magn Reson. 1993;102:1–8. [Google Scholar]
- 41.Fonnum F. Glutamate: a neurotransmitter in the mammalian brain. J Neurochem. 1984;42:1–11. doi: 10.1111/j.1471-4159.1984.tb09689.x. [DOI] [PubMed] [Google Scholar]
- 42.Grachev ID, Apkarian AV. Chemical heterogeneity of the living human brain: a proton MR spectroscopy study on the effects of sex, age, and brain region. Neuroimage. 2000;11(5 Pt 1):554–63. doi: 10.1006/nimg.2000.0557. [DOI] [PubMed] [Google Scholar]
- 43.Grachev ID, Swarnkar A, Szeverenyi NM, Ramachandran TS, Apkarian AV. Aging alters the multichemical networking profile of the human brain: an in vivo (1)H-MRS study of young versus middle-aged subjects. Journal of neurochemistry. 2001;77(1):292–303. doi: 10.1046/j.1471-4159.2001.t01-1-00238.x. [DOI] [PubMed] [Google Scholar]
- 44.Gunning-Dixon FM, Head D, McQuain J, Acker JD, Raz N. Differential aging of the human striatum: a prospective MR imaging study. Ajnr. 1998;19(8):1501–7. [PMC free article] [PubMed] [Google Scholar]
- 45.Haga KK, Khor YP, Farrall A, Wardlaw JM. A systematic review of brain metabolite changes, measured with (1)H magnetic resonance spectroscopy, in healthy aging. Neurobiology of aging. 2009 doi: 10.1016/j.neurobiolaging.2007.07.005. [DOI] [PubMed] [Google Scholar]
- 46.Harada M, Miyoshi H, Otsuka H, Nishitani H, Uno M. Multivariate analysis of regional metabolic differences in normal ageing on localised quantitative proton MR spectroscopy. Neuroradiology. 2001;43(6):448–52. doi: 10.1007/s002340000513. [DOI] [PubMed] [Google Scholar]
- 47.Heales SJ, Davies SE, Bates TE, Clark JB. Depletion of brain glutathione is accompanied by impaired mitochondrial function and decreased N-acetyl aspartate concentration. Neurochemical research. 1995;20(1):31–8. doi: 10.1007/BF00995149. [DOI] [PubMed] [Google Scholar]
- 48.Heaton RK, Miller SW, Taylor MJ, Grant I. In: Revised comprehensive norms for an expanded Halstead-Reitan Battery: Demographically adjusted neuropsychological norms for African American and Caucasian adults. Lutz, editor. Florida: 2004. [Google Scholar]
- 49.Heron M, Hoyert DL, Murphy SL, Xu J, Kochanek KD, Tejada-Vera B. Deaths: final data for 2006. Natl Vital Stat Rep. 2009;57(14):1–134. [PubMed] [Google Scholar]
- 50.Hetherington HP, Pan JW, Mason GF, Adams D, Vaughn MJ, Tweig DB, Pohost GM. Quantitative 1H spectroscopic imaging of human brain at 4. 1 T using image segmentation. Magn Reson Med. 1996;36:21–9. doi: 10.1002/mrm.1910360106. [DOI] [PubMed] [Google Scholar]
- 51.Hollingshead A. Four-Factor Index of Social Status. New Haven, CT: Yale University, Department of Sociology; 1975. [Google Scholar]
- 52.Holtzman D. Brain creatine kinases and phosphocreatine: an update. Developmental neuroscience. 1996;18(5–6):522–3. doi: 10.1159/000111449. [DOI] [PubMed] [Google Scholar]
- 53.Janowsky JS, Shimamura AP, Kritchevsky M, Squire LR. Cognitive impairment following frontal lobe damage and its relevance to human amnesia. Behav Neurosci. 1989;103:548–60. doi: 10.1037//0735-7044.103.3.548. [DOI] [PubMed] [Google Scholar]
- 54.Janssen I, Katzmarzyk PT, Ross R. Body mass index is inversely related to mortality in older people after adjustment for waist circumference. Journal of the American Geriatrics Society. 2005;53(12):2112–8. doi: 10.1111/j.1532-5415.2005.00505.x. [DOI] [PubMed] [Google Scholar]
- 55.Jernigan TL, Archibald SL, Berhow MT, Sowell ER, Foster DS, Hesselink JR. Cerebral structure on MRI .1. Localization of age-related changes. Biol Psychiatry. 1991;29(1):55–67. doi: 10.1016/0006-3223(91)90210-d. [DOI] [PubMed] [Google Scholar]
- 56.Kaiser LG, Schuff N, Cashdollar N, Weiner MW. Age-related glutamate and glutamine concentration changes in normal human brain: 1H MR spectroscopy study at 4 T. Neurobiology of aging. 2005;26(5):665–72. doi: 10.1016/j.neurobiolaging.2004.07.001. [DOI] [PMC free article] [PubMed] [Google Scholar]
- 57.Kaldis P, Hemmer W, Zanolla E, Holtzman D, Wallimann T. ‘Hot spots’ of creatine kinase localization in brain: cerebellum, hippocampus and choroid plexus. Developmental neuroscience. 1996;18(5–6):542–54. doi: 10.1159/000111452. [DOI] [PubMed] [Google Scholar]
- 58.Kalpouzos G, Chetelat G, Baron JC, Landeau B, Mevel K, Godeau C, Barre L, Constans JM, Viader F, Eustache F, Desgranges B. Voxel-based mapping of brain gray matter volume and glucose metabolism profiles in normal aging. Neurobiology of aging. 2009;30(1):112–24. doi: 10.1016/j.neurobiolaging.2007.05.019. [DOI] [PubMed] [Google Scholar]
- 59.Komoroski RA, Heimberg C, Cardwell D, Karson CN. Effects of gender and region on proton MRS of normal human brain. Magnetic resonance imaging. 1999;17(3):427–33. doi: 10.1016/s0730-725x(98)00186-6. [DOI] [PubMed] [Google Scholar]
- 60.Krishnan KR, Husain MM, McDonald WM, Doraiswamy PM, Figiel GS, Boyko OB, Ellinwood EH, Nemeroff CB. In vivo stereological assessment of caudate volume in man: effect of normal aging. Life sciences. 1990;47(15):1325–9. doi: 10.1016/0024-3205(90)90196-x. [DOI] [PubMed] [Google Scholar]
- 61.Krystal JH, D’Souza DC, Karper LP, Bennett A, Abi-Dargham A, Abi-Saab D, Cassello K, Bowers MB, Jr, Vegso S, Heninger GR, Charney DS. Interactive effects of subanesthetic ketamine and haloperidol in healthy humans. Psychopharmacology. 1999;145(2):193–204. doi: 10.1007/s002130051049. [DOI] [PubMed] [Google Scholar]
- 62.Krystal JH, D’Souza DC, Petrakis IL, Belger A, Berman RM, Charney DS, Abi-Saab W, Madonick S. NMDA agonists and antagonists as probes of glutamatergic dysfunction and pharmacotherapies in neuropsychiatric disorders. Harv Rev Psychiatry. 1999;7(3):125–43. [PubMed] [Google Scholar]
- 63.Kumral E, Evyapan D, Balkir K. Acute caudate vascular lesions. Stroke; a journal of cerebral circulation. 1999;30(1):100–8. doi: 10.1161/01.str.30.1.100. [DOI] [PubMed] [Google Scholar]
- 64.Kwo-On-Yuen PF, Newmark RD, Budinger TF, Kaye JA, Ball MJ, Jagust WJ. Brain N-acetyl-L-aspartic acid in Alzheimer’s disease: A proton magnetic resonance spectroscopy study. Brain Res. 1994;667(2):167–74. doi: 10.1016/0006-8993(94)91494-x. [DOI] [PubMed] [Google Scholar]
- 65.Leary SM, Brex PA, MacManus DG, Parker GJ, Barker GJ, Miller DH, Thompson AJ. A (1)H magnetic resonance spectroscopy study of aging in parietal white matter: implications for trials in multiple sclerosis. Magnetic resonance imaging. 2000;18(4):455–9. doi: 10.1016/s0730-725x(00)00131-4. [DOI] [PubMed] [Google Scholar]
- 66.Lim KO, Pfefferbaum A. Segmentation of MR brain images into cerebrospinal fluid spaces, white and gray matter. J Comput Assist Tomogr. 1989;13:588–93. doi: 10.1097/00004728-198907000-00006. [DOI] [PubMed] [Google Scholar]
- 67.Lim KO, Spielman DM. Estimating NAA in cortical gray matter with applications for measuring changes due to aging. Magn Reson Med. 1997;37:372–7. doi: 10.1002/mrm.1910370313. [DOI] [PubMed] [Google Scholar]
- 68.Lin MT, Beal MF. Mitochondrial dysfunction and oxidative stress in neurodegenerative diseases. Nature. 2006;443(7113):787–95. doi: 10.1038/nature05292. [DOI] [PubMed] [Google Scholar]
- 69.Long JM, Kalehua AN, Muth NJ, Calhoun ME, Jucker M, Hengemihle JM, Ingram DK, Mouton PR. Stereological analysis of astrocyte and microglia in aging mouse hippocampus. Neurobiology of aging. 1998;19(5):497–503. doi: 10.1016/s0197-4580(98)00088-8. [DOI] [PubMed] [Google Scholar]
- 70.Luebke J, Barbas H, Peters A. Effects of normal aging on prefrontal area 46 in the rhesus monkey. Brain research reviews. 2010;62(2):212–32. doi: 10.1016/j.brainresrev.2009.12.002. [DOI] [PMC free article] [PubMed] [Google Scholar]
- 71.Mader I, Rauer S, Gall P, Klose U. (1)H MR spectroscopy of inflammation, infection and ischemia of the brain. European journal of radiology. 2008;67(2):250–7. doi: 10.1016/j.ejrad.2008.02.033. [DOI] [PubMed] [Google Scholar]
- 72.Mascalchi M, Brugnoli R, Guerrini L, Belli G, Nistri M, Politi LS, Gavazzi C, Lolli F, Argenti G, Villari N. Single-voxel long TE 1H-MR spectroscopy of the normal brainstem and cerebellum. J Magn Reson Imaging. 2002;16(5):532–7. doi: 10.1002/jmri.10189. [DOI] [PubMed] [Google Scholar]
- 73.Matsuda H, Ohnishi T, Asada T, Li ZJ, Kanetaka H, Imabayashi E, Tanaka F, Nakano S. Correction for partial-volume effects on brain perfusion SPECT in healthy men. J Nucl Med. 2003;44(8):1243–52. [PubMed] [Google Scholar]
- 74.Mattis S. Dementia Rating Scale (DRS) Professional Manual. Odessa, FL: Psychological Assessment Resources, Inc; 2004. [Google Scholar]
- 75.Mayer D, Spielman DM. Detection of glutamate in the human brain at 3 T using optimized constant time point resolved spectroscopy. Magn Reson Med. 2005;54(2):439–42. doi: 10.1002/mrm.20571. [DOI] [PubMed] [Google Scholar]
- 76.Mayer D, Spielman DM. Detection of glutamate in the human brain at 3 T using optimized constant time point resolved spectroscopy. Magn Reson Med. 2005;54(2):439–42. doi: 10.1002/mrm.20571. [DOI] [PubMed] [Google Scholar]
- 77.Mayer D, Zahr NM, Sullivan EV, Pfefferbaum A. In vivo metabolite differences between the basal ganglia and cerebellum of the rat brain detected with proton MRS at 3T. Psychiatry Res. 2007;154(3):267–73. doi: 10.1016/j.pscychresns.2006.11.005. [DOI] [PMC free article] [PubMed] [Google Scholar]
- 78.Meyerhoff DJ, MacKay S, Constans JM, Norman D, Van Dyke C, Fein G, Weiner MW. Axonal injury and membrane alterations in Alzheimer’s disease suggested by in vivo proton magnetic resonance spectroscopic imaging. Ann Neurol. 1994;36(1):40–7. doi: 10.1002/ana.410360110. [DOI] [PubMed] [Google Scholar]
- 79.Michaelis T, Merboldt KD, Bruhn H, Hanicke W, Frahm J. Absolute concentrations of metabolites in the adult human brain in vivo - quantification of localized proton MR spectra. Radiology. 1993;187(1):219–27. doi: 10.1148/radiology.187.1.8451417. [DOI] [PubMed] [Google Scholar]
- 80.Mitchell JJ, Anderson KJ. Age-related changes in [3H]MK-801 binding in the Fischer 344 rat brain. Neurobiology of aging. 1998;19(3):259–65. doi: 10.1016/s0197-4580(98)00058-x. [DOI] [PubMed] [Google Scholar]
- 81.Moeller JR, Ishikawa T, Dhawan V, Spetsieris P, Mandel F, Alexander GE, Grady C, Pietrini P, Eidelberg D. The metabolic topography of normal aging. J Cereb Blood Flow Metab. 1996;16(3):385–98. doi: 10.1097/00004647-199605000-00005. [DOI] [PubMed] [Google Scholar]
- 82.Moffett JR, Namboodiri MA. Differential distribution of N-acetylaspartylglutamate and N-acetylaspartate immunoreactivities in rat forebrain. Journal of neurocytology. 1995;24(6):409–33. doi: 10.1007/BF01181604. [DOI] [PubMed] [Google Scholar]
- 83.Moffett JR, Ross B, Arun P, Madhavarao CN, Namboodiri AM. N-Acetylaspartate in the CNS: from neurodiagnostics to neurobiology. Progress in neurobiology. 2007;81(2):89–131. doi: 10.1016/j.pneurobio.2006.12.003. [DOI] [PMC free article] [PubMed] [Google Scholar]
- 84.Moreno-Torres A, Pujol J, Soriano-Mas C, Deus J, Iranzo A, Santamaria J. Age-related metabolic changes in the upper brainstem tegmentum by MR spectroscopy. Neurobiology of aging. 2005;26(7):1051–9. doi: 10.1016/j.neurobiolaging.2004.09.009. [DOI] [PubMed] [Google Scholar]
- 85.Morris RG, Anderson E, Lynch GS, Baudry M. Selective impairment of learning and blockade of long-term potentiation by an N-methyl-D-aspartate receptor antagonist, AP5. Nature. 1986;319(6056):774–6. doi: 10.1038/319774a0. [DOI] [PubMed] [Google Scholar]
- 86.Nelson HE. The National Adult Reading Test (NART) Windsor, Canada: Nelson Publishing Company; 1982. [Google Scholar]
- 87.Newcombe F. Missile Wounds of the Brain: A Study of Psychological Deficits. London: Oxford University Press; 1969. [Google Scholar]
- 88.Newcomer JW, Farber NB, Jevtovic-Todorovic V, Selke G, Melson AK, Hershey T, Craft S, Olney JW. Ketamine-induced NMDA receptor hypofunction as a model of memory impairment and psychosis. Neuropsychopharmacology. 1999;20(2):106–18. doi: 10.1016/S0893-133X(98)00067-0. [DOI] [PubMed] [Google Scholar]
- 89.Nickell J, Pomerleau F, Allen J, Gerhardt GA. Age-related changes in the dynamics of potassium-evoked L-glutamate release in the striatum of Fischer 344 rats. J Neural Transm. 2005;112(1):87–96. doi: 10.1007/s00702-004-0151-x. [DOI] [PubMed] [Google Scholar]
- 90.Nicolle MM, Baxter MG. Glutamate receptor binding in the frontal cortex and dorsal striatum of aged rats with impaired attentional set-shifting. The European journal of neuroscience. 2003;18(12):3335–42. doi: 10.1111/j.1460-9568.2003.03077.x. [DOI] [PubMed] [Google Scholar]
- 91.Nicolle MM, Bizon JL, Gallagher M. In vitro autoradiography of ionotropic glutamate receptors in hippocampus and striatum of aged Long-Evans rats: relationship to spatial learning. Neuroscience. 1996;74(3):741–56. doi: 10.1016/0306-4522(96)00147-9. [DOI] [PubMed] [Google Scholar]
- 92.Ottersen OP, Zhang N, Walberg F. Metabolic compartmentation of glutamate and glutamine: morphological evidence obtained by quantitative immunocytochemistry in rat cerebellum. Neuroscience. 1992;46(3):519–34. doi: 10.1016/0306-4522(92)90141-n. [DOI] [PubMed] [Google Scholar]
- 93.Pannese E. Morphological changes in nerve cells during normal aging. Brain structure & function. 2011;216(2):85–9. doi: 10.1007/s00429-011-0308-y. [DOI] [PubMed] [Google Scholar]
- 94.Parks MH, Dawant BM, Riddle WR, Hartmann SL, Dietrich MS, Nickel MK, Price RR, Martin PR. Longitudinal brain metabolic characterization of chronic alcoholics with proton magnetic resonance spectroscopy. Alcoholism: Clinical and Experimental Research. 2002;26(9):1368–80. doi: 10.1097/01.ALC.0000029598.07833.2D. [DOI] [PubMed] [Google Scholar]
- 95.Parwani A, Weiler MA, Blaxton TA, Warfel D, Hardin M, Frey K, Lahti AC. The effects of a subanesthetic dose of ketamine on verbal memory in normal volunteers. Psychopharmacology. 2005;183(3):265–74. doi: 10.1007/s00213-005-0177-2. [DOI] [PubMed] [Google Scholar]
- 96.Patel AJ, Hunt A, Gordon RD, Balazs R. The activities in different neural cell types of certain enzymes associated with the metabolic compartmentation glutamate. Brain research. 1982;256(1):3–11. doi: 10.1016/0165-3806(82)90091-8. [DOI] [PubMed] [Google Scholar]
- 97.Patel TB, Clark JB. Synthesis of N-acetyl-L-aspartate by rat brain mitochondria and its involvement in mitochondrial/cytosolic carbon transport. The Biochemical journal. 1979;184(3):539–46. doi: 10.1042/bj1840539. [DOI] [PMC free article] [PubMed] [Google Scholar]
- 98.Petrides M, Alivisatos B, Meyer E, Evans AC. Functional activation of the human frontal cortex during the performance of verbal working memory tasks. Proc Natl Acad Sci U S A. 1993;90(3):878–82. doi: 10.1073/pnas.90.3.878. [DOI] [PMC free article] [PubMed] [Google Scholar]
- 99.Pfefferbaum A, Adalsteinsson E, Spielman D, Sullivan EV, Lim KO. In vivo brain concentrations of N-acetyl compounds, creatine and choline in Alzheimer’s disease. Arch Gen Psychiatry. 1999;56(2):185–92. doi: 10.1001/archpsyc.56.2.185. [DOI] [PubMed] [Google Scholar]
- 100.Pfefferbaum A, Adalsteinsson E, Spielman D, Sullivan EV, Lim KO. In vivo spectroscopic quantification of the N-acetyl moiety, creatine, and choline from large volumes of brain gray and white matter: effects of normal aging. Magn Reson Med. 1999;41(2):276–84. doi: 10.1002/(sici)1522-2594(199902)41:2<276::aid-mrm10>3.0.co;2-8. [DOI] [PubMed] [Google Scholar]
- 101.Pouwels PJ, Frahm J. Regional metabolite concentrations in human brain as determined by quantitative localized proton MRS. Magn Reson Med. 1998;39(1):53–60. doi: 10.1002/mrm.1910390110. [DOI] [PubMed] [Google Scholar]
- 102.Qiu C, Winblad B, Fratiglioni L. The age-dependent relation of blood pressure to cognitive function and dementia. Lancet Neurol. 2005;4(8):487–99. doi: 10.1016/S1474-4422(05)70141-1. [DOI] [PubMed] [Google Scholar]
- 103.Raininko R, Mattsson P. Metabolite concentrations in supraventricular white matter from teenage to early old age: A short echo time 1H magnetic resonance spectroscopy (MRS) study. Acta Radiol. 2010;51(3):309–15. doi: 10.3109/02841850903476564. [DOI] [PubMed] [Google Scholar]
- 104.Raz N, Gunning-Dixon F, Head D, Williamson A, Acker JD. Age and sex differences in the cerebellum and the ventral pons: a prospective MR study of healthy adults. American Journal of Neuroradiology. 2001;22(6):1161–7. [PMC free article] [PubMed] [Google Scholar]
- 105.Raz N, Rodrigue KM, Kennedy KM, Dahle C, Head D, Acker JD. Differential age-related changes in the regional metencephalic volumes in humans: a 5-year follow-up. Neurosci Lett. 2003;349:163–6. doi: 10.1016/s0304-3940(03)00820-6. [DOI] [PubMed] [Google Scholar]
- 106.Raz N, Rodrigue KM, Kennedy KM, Head D, Gunning-Dixon F, Acker JD. Differential aging of the human striatum: longitudinal evidence. American Journal of Neuroradiology. 2003;24:1849–56. [PMC free article] [PubMed] [Google Scholar]
- 107.Raz N, Torres IJ, Acker JD. Age, gender, and hemispheric differences in human striatum: a quantitative review and new data from in vivo MRI morphometry. Neurobiology of learning and memory. 1995;63(2):133–42. doi: 10.1006/nlme.1995.1013. [DOI] [PubMed] [Google Scholar]
- 108.Robbins TW, Murphy ER. Behavioural pharmacology: 40+ years of progress, with a focus on glutamate receptors and cognition. Trends in pharmacological sciences. 2006;27(3):141–8. doi: 10.1016/j.tips.2006.01.009. [DOI] [PMC free article] [PubMed] [Google Scholar]
- 109.Ross AJ, Sachdev PS, Wen W, Brodaty H. Longitudinal changes during aging using proton magnetic resonance spectroscopy. J Gerontol A Biol Sci Med Sci. 2006;61(3):291–8. doi: 10.1093/gerona/61.3.291. [DOI] [PubMed] [Google Scholar]
- 110.Ross B, Bluml S. Magnetic resonance spectroscopy of the human brain. The Anatomical record. 2001;265(2):54–84. doi: 10.1002/ar.1058. [DOI] [PubMed] [Google Scholar]
- 111.Ruff RM, Light RH, Evans RW. The Ruff Figural Fluency Test: A normative study with adults. Developmental Neuropsychology. 1987;3:37–51. [Google Scholar]
- 112.Safriel Y, Pol-Rodriguez M, Novotny EJ, Rothman DL, Fulbright RK. Reference values for long echo time MR spectroscopy in healthy adults. Ajnr. 2005;26(6):1439–45. [PMC free article] [PubMed] [Google Scholar]
- 113.Sailasuta N, Ernst T, Chang L. Regional variations and the effects of age and gender on glutamate concentrations in the human brain. Magn Reson Imaging. 2008;26(5):667–75. doi: 10.1016/j.mri.2007.06.007. [DOI] [PMC free article] [PubMed] [Google Scholar]
- 114.Sartorius A, Lugenbiel P, Mahlstedt MM, Ende G, Schloss P, Vollmayr B. Proton magnetic resonance spectroscopic creatine correlates with creatine transporter protein density in rat brain. Journal of neuroscience methods. 2008;172(2):215–9. doi: 10.1016/j.jneumeth.2008.04.028. [DOI] [PubMed] [Google Scholar]
- 115.Saunders D, Howe F, van den Boogaart A, Griffiths J, Brown M. Aging of the adult human brain: In vivo quantitation of metabolite content with proton magnetic resonance spectroscopy. J Magn Reson Imaging. 1999;9(5):711–6. doi: 10.1002/(sici)1522-2586(199905)9:5<711::aid-jmri14>3.0.co;2-3. [DOI] [PubMed] [Google Scholar]
- 116.Schubert F, Gallinat J, Seifert F, Rinneberg H. Glutamate concentrations in human brain using single voxel proton magnetic resonance spectroscopy at 3 Tesla. NeuroImage. 2004;21(4):1762–71. doi: 10.1016/j.neuroimage.2003.11.014. [DOI] [PubMed] [Google Scholar]
- 117.Schuff N, Amend D, Meyerhoff D, Tanabe J, Norman D, Fein G, Weiner M. Alzheimer disease: Quantitative H-1 MR spectroscopic imaging of frontoparietal brain. Radiology. 1998:91–102. doi: 10.1148/radiology.207.1.9530304. [DOI] [PMC free article] [PubMed] [Google Scholar]
- 118.Schuff N, Amend DL, Knowlton R, Norman D, Fein G, Weiner MW. Age-related metabolite changes and volume loss in the hippocampus by magnetic resonance spectroscopy and imaging. Neurobiology of aging. 1999;20(3):279–85. doi: 10.1016/s0197-4580(99)00022-6. [DOI] [PMC free article] [PubMed] [Google Scholar]
- 119.Schuff N, Ezekiel F, Gamst AC, Amend DL, Capizzano AA, Maudsley AA, Weiner MW. Region and tissue differences of metabolites in normally aged brain using multislice 1H magnetic resonance spectroscopic imaging. Magn Reson Med. 2001;45(5):899–907. doi: 10.1002/mrm.1119. [DOI] [PMC free article] [PubMed] [Google Scholar]
- 120.Segovia G, Porras A, Del Arco A, Mora F. Glutamatergic neurotransmission in aging: a critical perspective. Mechanisms of ageing and development. 2001;122(1):1–29. doi: 10.1016/s0047-6374(00)00225-6. [DOI] [PubMed] [Google Scholar]
- 121.Seidler RD, Bernard JA, Burutolu TB, Fling BW, Gordon MT, Gwin JT, Kwak Y, Lipps DB. Motor control and aging: links to age-related brain structural, functional, and biochemical effects. Neuroscience and biobehavioral reviews. 2010;34(5):721–33. doi: 10.1016/j.neubiorev.2009.10.005. [DOI] [PMC free article] [PubMed] [Google Scholar]
- 122.Sijens PE, den Heijer T, Origgi D, Vermeer SE, Breteler MM, Hofman A, Oudkerk M. Brain changes with aging: MR spectroscopy at supraventricular plane shows differences between women and men. Radiology. 2003;226(3):889–96. doi: 10.1148/radiol.2263011937. [DOI] [PubMed] [Google Scholar]
- 123.Soher BJ, van Zijl PCM, Duyn JH, Barker PB. Quantitative proton MR spectroscopic imaging of the human brain. Magn Reson Med. 1996;35:356–63. doi: 10.1002/mrm.1910350313. [DOI] [PubMed] [Google Scholar]
- 124.Storm-Mathisen J, Leknes AK, Bore AT, Vaaland JL, Edminson P, Haug FM, Ottersen OP. First visualization of glutamate and GABA in neurones by immunocytochemistry. Nature. 1983;301(5900):517–20. doi: 10.1038/301517a0. [DOI] [PubMed] [Google Scholar]
- 125.Sullivan EV. Compromised pontocerebellar and cerebellothalamocortical systems: speculations on their contributions to cognitive and motor impairment in nonamnesic alcoholism. Alcoholism, clinical and experimental research. 2003;27(9):1409–19. doi: 10.1097/01.ALC.0000085586.91726.46. [DOI] [PubMed] [Google Scholar]
- 126.Sullivan EV, Rosenbloom M, Serventi KL, Pfefferbaum A. Effects of age and sex on volumes of the thalamus, pons, and cortex. Neurobiology of aging. 2004;25(2):185–92. doi: 10.1016/s0197-4580(03)00044-7. [DOI] [PubMed] [Google Scholar]
- 127.Taylor DL, Davies SE, Obrenovitch TP, Doheny MH, Patsalos PN, Clark JB, Symon L. Investigation into the role of N-acetylaspartate in cerebral osmoregulation. Journal of neurochemistry. 1995;65(1):275–81. doi: 10.1046/j.1471-4159.1995.65010275.x. [DOI] [PubMed] [Google Scholar]
- 128.Tedeschi G, Bertolino A, Righini A, Campbell G, Raman R, Duyn JH, Moonen CTW, Alger JR, Di Chiro G. Brain regional distribution pattern of metabolite signal intensities in young adults by proton magnetic resonance spectroscopic imaging. Neurology. 1995;45(7):1384–91. doi: 10.1212/wnl.45.7.1384. [DOI] [PubMed] [Google Scholar]
- 129.Thangnipon W, Taxt T, Brodal P, Storm-Mathisen J. The corticopontine projection: axotomy-induced loss of high affinity L-glutamate and D-aspartate uptake, but not of gamma-aminobutyrate uptake, glutamate decarboxylase or choline acetyltransferase, in the pontine nuclei. Neuroscience. 1983;8(3):449–57. doi: 10.1016/0306-4522(83)90191-4. [DOI] [PubMed] [Google Scholar]
- 130.UN. Development in an Ageing World. New York: 2007. [Google Scholar]
- 131.Urenjak J, Williams SR, Gadian DG, Noble M. Proton nuclear magnetic resonance spectroscopy unambiguously identifies different neural cell types. J Neurosci. 1993;13(3):981–9. doi: 10.1523/JNEUROSCI.13-03-00981.1993. [DOI] [PMC free article] [PubMed] [Google Scholar]
- 132.Villares JC, Stavale JN. Age-related changes in the N-methyl-D-aspartate receptor binding sites within the human basal ganglia. Experimental neurology. 2001;171(2):391–404. doi: 10.1006/exnr.2001.7737. [DOI] [PubMed] [Google Scholar]
- 133.Vitaliano PP, Breen AR, Albert MS, Russo J, Prinz PN. Memory, attention, and functional status in community-residing Alzheimer type dementia patients and optimally healthy aged individuals. J Gerontol. 1984;39(1):58–64. doi: 10.1093/geronj/39.1.58. [DOI] [PubMed] [Google Scholar]
- 134.Walker PM, Ben Salem D, Giroud M, Brunotte F. Is NAA reduction in normal contralateral cerebral tissue in stroke patients dependent on underlying risk factors? J Neurol Neurosurg Psychiatry. 2006;77(5):596–600. doi: 10.1136/jnnp.2005.078238. [DOI] [PMC free article] [PubMed] [Google Scholar]
- 135.Westhoff TH, Schubert F, Wirth C, Joppke M, Klar AA, Zidek W, Gallinat J. The impact of blood pressure on hippocampal glutamate and mnestic function. J Hum Hypertens. 2011;25(4):256–61. doi: 10.1038/jhh.2010.51. [DOI] [PubMed] [Google Scholar]
- 136.Winters BD, Bussey TJ. Glutamate receptors in perirhinal cortex mediate encoding, retrieval, and consolidation of object recognition memory. J Neurosci. 2005;25(17):4243–51. doi: 10.1523/JNEUROSCI.0480-05.2005. [DOI] [PMC free article] [PubMed] [Google Scholar]
- 137.Witelson SF, Glezer, Kigar DL. Women have greater density of neurons in posterior temporal cortex. J Neurosci. 1995;15(5 Pt 1):3418–28. doi: 10.1523/JNEUROSCI.15-05-03418.1995. [DOI] [PMC free article] [PubMed] [Google Scholar]
- 138.Yudkoff M, Nissim I, Daikhin Y, Lin ZP, Nelson D, Pleasure D, Erecinska M. Brain glutamate metabolism: neuronal-astroglial relationships. Developmental neuroscience. 1993;15(3–5):343–50. doi: 10.1159/000111354. [DOI] [PubMed] [Google Scholar]
- 139.Zahr NM, Mayer D, Pfefferbaum A, Sullivan EV. Low striatal glutamate levels underlie cognitive decline in the elderly: Evidence from in vivo molecular spectroscopy. Cereb Cortex. 2008;18(10):2241–50. doi: 10.1093/cercor/bhm250. [DOI] [PMC free article] [PubMed] [Google Scholar]
- 140.Zahr NM, Mayer D, Rohlfing T, Hasak M, Hsu O, Vinco S, Orduna J, Luong R, Sullivan EV, Pfefferbaum A. Brain Injury and Recovery Following Binge Ethanol: Evidence from In Vivo Magnetic Resonance Spectroscopy. Biological psychiatry. 2010;67(9):846–54. doi: 10.1016/j.biopsych.2009.10.028. [DOI] [PMC free article] [PubMed] [Google Scholar]
- 141.Zahr NM, Mayer D, Vinco S, Orduna J, Luong R, Sullivan EV, Pfefferbaum A. In vivo evidence for alcohol-induced neurochemical changes in rat brain without protracted withdrawal, pronounced thiamine deficiency, or severe liver damage. Neuropsychopharmacology. 2009;34(6):1427–42. doi: 10.1038/npp.2008.119. [DOI] [PMC free article] [PubMed] [Google Scholar]