

Abstract
Transcriptome analysis of adult hematopoietic stem cells (HSC) and their progeny has revealed mechanisms of blood differentiation and leukemogenesis, but a similar analysis of HSC development is lacking. Here, we acquired the transcriptomes of developing HSC purified from >2500 murine embryos and adult mice. We found that embryonic hematopoietic elements clustered into three distinct transcriptional states characteristic of the definitive yolk sac, HSCs undergoing specification, and definitive HSCs. We applied a network biology-based analysis to reconstruct the gene regulatory networks of sequential stages of HSC development and functionally validated candidate transcriptional regulators of HSC ontogeny by morpholino-mediated knock-down in zebrafish embryos. Moreover, we found that HSCs from in vitro differentiated embryonic stem cells closely resemble definitive HSC, yet lack a Notch-signaling signature, likely accounting for their defective lymphopoiesis. Our analysis and web resource (http://hsc.hms.harvard.edu) will enhance efforts to identify regulators of HSC ontogeny and facilitate the engineering of hematopoietic specification.
Introduction
Hematopoietic stem cells (HSC) have been extensively analyzed via global transcriptional profiling, which has yielded novel insights into their unique biology (Seita and Weissman, 2010). A recent examination of human HSC and their progeny revealed both hematopoietic cell-type specific and ‘re-used’ transcriptional programs (Novershtern et al., 2011). A similarly comprehensive examination of the transcriptome of embryonic HSC is absent from the literature, largely due to the practical difficulties of prospectively isolating sufficient quantities of highly purified HSCs and precursors from embryos (Godin and Cumano, 2002). The description of Sox17 as a disparate regulator of fetal vs. adult HSC indicates that distinct molecular pathways likely govern different stages of HSC development (Kim et al., 2007). A deep understanding of the molecular regulation of HSC ontogeny would inform efforts to expand HSC in vitro and induce HSC generation during pluripotent stem cell (PSC) differentiation, as well as illuminate novel disease causing genes.
Definitive adult-type HSC are born in the E10.5 aorta-gonads-mesonephros (AGM), and thereafter migrate to the fetal liver (FL), placenta, and bone marrow (Medvinsky et al., 2011). HSCs apparently emerge from a subset of endothelial cells in the ventral aspect of the dorsal aorta (recently reviewed in detail (Medvinsky et al., 2011)). Imaging reveals the dramatic “bending” of hemogenic endothelial cells as they move into the aortic space (Kissa and Herbomel, 2010). Although these emergent cells have not been directly demonstrated to be functional HSC, the preponderance of evidence indicates that definitive HSC arise from hemogenic endothelium.
Directed differentiation of PSCs to specific lineages for research and cell therapy is a major goal of stem cell biology. Nearly two decades of effort has not yielded robust, definitive HSC from PSC (McKinney-Freeman and Daley, 2007). Ectopic expression of the homeotic genes HoxB4 and Cdx4 produced cells that reconstituted multi-lineage hematopoiesis in lethally irradiated primary and secondary mice (Kyba et al., 2002; Wang et al., 2005b). Although this approach generated hematopoietic progenitors with cardinal features stem cell features of self-renewal and multi-lineage differentiation, these embryonic stem cell derived-HSCs (ESC-HSC) do not faithfully mimic the function or phenotype of whole bone marrow (WBM)-HSCs (Bonde et al., 2008; McKinney-Freeman et al., 2009; Tabayoyong et al., 2009). Recent data proposing the equivalence of hemogenic endothelium and the hemangioblast that arises during ESC differentiation (Lancrin et al., 2009) suggests that discerning the molecular pathways of hematopoietic ontogeny in vivo will provide a roadmap for differentiating definitive HSC from PSC in vitro.
Here, we present the most complete analysis of the transcriptional program of definitive HSC ontogeny to date, gleaned from rigorously characterized hematopoietic stem and progenitor cell (HSPC) populations isolated from over 2500 murine embryos and adult mice. To illuminate combinatorial control of gene expression, we applied a novel computational analysis that identifies a gene regulatory network for each critical developmental stage (Faith et al., 2007). We then validated several predicted regulators in HSC ontogeny via morpholino knock-down in zebrafish embryos. We discovered that HSC exist in only three distinct transcriptional states during ontogeny and that a subset of HSC from E12.5 FL retain the transcriptional signature of their endothelial precursors. Ultimately, we compared the transcriptional profiles of ESC, ESC-derived hematopoietic progenitors, and ESC-HSC to their potential in vivo counterparts, and found that ESC-HSC most closely resemble definitive HSC but are defective in essential HSC regulatory pathways, perhaps accounting for their functional deficits. Taken together, our unique dataset, available to the stem cell community as a searchable web resource (http://hsc.hms.harvard.edu), illuminates novel aspects of hematopoietic development that will prove valuable for research in developmental hematopoiesis and in vitro directed differentiation.
Results
Acquisition of HSC gene expression profiles throughout murine ontogeny
The technical challenges to purifying HSC to absolute homogeneity from FL and WBM has not precluded the derivation of important biological insights from analysis of the global gene expression profiles of highly purified populations of primitive hematopoietic progenitors (Kiel et al., 2005; Park et al., 2003; Seita and Weissman, 2010). Here, we restricted our purification scheme to surface markers that enrich functionally for hematopoietic repopulation (yolk sac (YS), placenta, FL, WBM, and ESC-HSC) or HSC precursors (EB-derived cells and AGM) (Figure 1A and Table 1). E9 YS CD41+c-kit+CD34+ cells can contribute to life-long hematopoiesis when transplanted into neonates (Ferkowicz et al., 2003). E11.5 AGM HSC are exceedingly rare (1-3 functional HSC per embryo; (Kumaravelu et al., 2002)). However, between E11.5 and E12.5, HSC expand dramatically in the placenta and FL (Kumaravelu et al., 2002; Taoudi et al., 2008; Taoudi et al., 2005). This expansion results partly from an acceleration in de novo HSC specification from VE-cadherin+CD45+ AGM hemogenic precursors (Taoudi et al., 2008). To capture the molecular transition from hemogenic endothelium to definitive HSC, we isolated VE-cadherin+CD45+ cells from E11.5 AGM and HSC from E12.5 placenta and FL. We also collected HSC from E13.5 FL, E14.5 FL, adult WBM, and ESC (McKinney-Freeman et al., 2008). Samples were double sorted into lysis buffer via fluorescence activated cell sorting to assure cell purities of >95%, minimal loss of material, and maximal RNA integrity (Figure 1B, Figure S1). Three to six biological replicates were collected for each population. We generated gene expression profiles using Affymetrix gene chips and performed computational analysis as described below.
Figure 1. Acquisition of global gene expression profiles of HSC compartments throughout murine ontogeny.

(A) Outline of the developmental time-points, embryonic tissues, and ESC-derived populations examined. See also Figure S1. (B) RNA was collected from double sorted cells, amplified, and then hybridized to 430 2.0 Affymetrix gene chips. The resulting data was analyzed by unsupervised hierarchical clustering, PCA, Naïve Bayesian classifier, WGCNA, GRN reconstruction by CLR, differential expression analysis, and GSEA prior to functional studies in zebrafish.
Table 1.
Description of purified HSPC
| Cell Source | Days of embryonic development/differentiation | cTotal # biological replicates | Total number of embryos dissected | eNo. cells/sample (x1000) | Cell surface phenotype of purified HSPC |
|---|---|---|---|---|---|
| Yolk sac | aE9 | 8 | 198 | 23±10.5 | CD41+CD34+c-kit+ |
|
| |||||
| AGM | E11.5 | 10 | 587 | 4.1±2.5 | VE-cadherin+CD45+ |
|
| |||||
| Placenta | E12.5 | 9 | 485 | 75.8±55 | CD45+CD34medc-kit+ |
|
| |||||
| Fetal Liver | E12.5 | 9 | 367 | 3.4±0.9 | Lin-Sca-1+c-kit+ |
| VE-cadherin+Mac-1low | |||||
|
| |||||
| Fetal Liver | E13.5 | 6 | 140 | 6.5±3.4 | Lin-Sca-1+ |
| c-kit+CD150+CD48- | |||||
|
| |||||
| Fetal Liver | E14.5 | 6 | 458 | 27.8±11 | Lin-Sca-1+ |
| c-kit+CD150+CD48- | |||||
|
| |||||
| WBM | Adult | 6 | d276 | 90±50 | Lin-Sca-1+ |
| c-kit+CD150+CD34- | |||||
|
| |||||
| Embryoid Body | Day 6 | 8 | - | nr | c-kit+CD41+ |
|
| |||||
| ESC-HSC cell | bDay 10-14 | 3 | - | 1000±0 | CD41brightCD45-CD34- |
|
| |||||
| Total | 2511 | ||||
somite pairs = 18-22
day-6 EB-derived cells were expanded on OP9 stroma for 10-14 days after infection with retroviral HoxB4 prior to fractionation via FACS
Sum of replicated collected for array and fluidigm analysis
Indicates total number of mice
According to cell count of FACSAria after secondary sort into lysis buffer nr = not recorded
Embryonic HSC exist in three predominant transcriptional states
Pearson correlations between biological replicates revealed that most samples within a group were well correlated (Figure S2A). Hierarchical clustering and principal component analysis (PCA) reveal that embryonic hematopoietic populations segregate into three transcriptionally distinct groups, designated as “Yolk Sac-like”, “Specifying HSC”, and “Definitive HSC” (Figure 2A and B). Placenta and AGM samples cluster together (Figure 2A and B), confirming recent data that both are sites of hematopoietic specification (Rhodes et al., 2008). Interestingly, two E12.5 FL samples align with the AGM, whereas four align with later stage FL and WBM HSC (Figure 2A). We termed the AGM-like E12.5 FL samples “FL12 A”, and the FL-like E12.5 FL samples “FL12 F”. FL12 F, E13.5 FL, E14.5 FL, and WBM-HSC cluster as one group (i.e. “Definitive HSC”) while E9 YS cluster separately with embryoid-body (EB)-derived hematopoietic progenitors. Definitive HSC isolated from FL across two days of embryonic development (E12.5-14.5) are nearly indistinguishable by gene expression. Nine genes were differentially expressed in FL12 F vs. E13.5 FL and only five genes distinguished E13.5 from E14.5 (http://hsc.hms.harvard.edu). In contrast, 619 genes were differentially expressed between AGM and FL12 F HSC (http://hsc.hms.harvard.edu). The clustering of FL12 A with placenta/AGM rather than FL/WBM suggests that the transcriptional signature of HSC immediately upon arrival in the FL represents a critical transitional stage from hemogenic endothelium to definitive HSC that can be observed fortuitously in some embryos (Figure 2A and B). Although AGM and FL12 A cluster together, they are transcriptionally distinct when specific hematopoietic genes are examined (Figure S2B). In total, our data reveal that AGM and FL12 A are distinct, yet transcriptionally related cell populations.
Figure 2. Identification of distinct transcriptional and regulatory stages of HSC ontogeny.
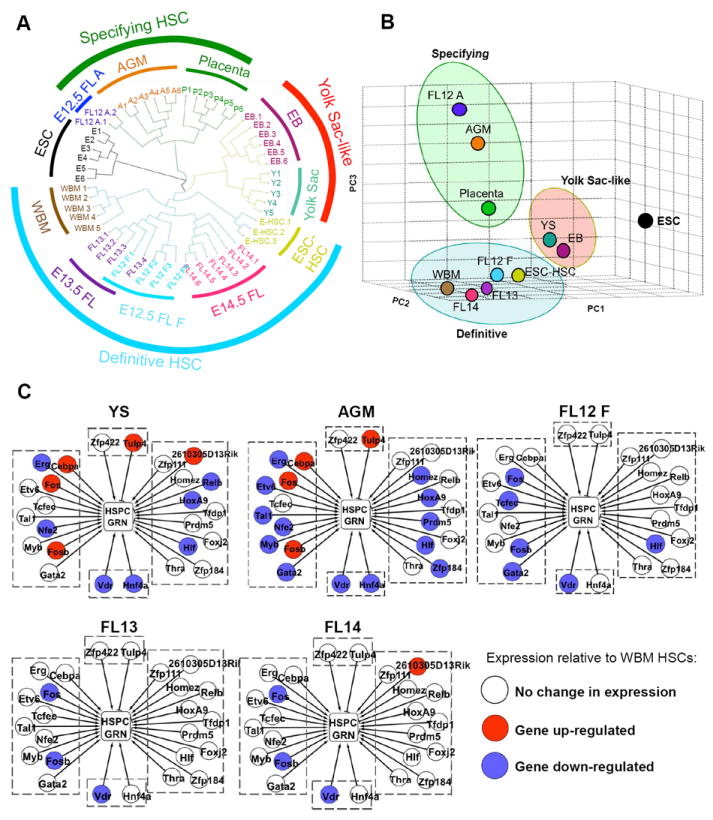
Results of unsupervised hierarchical clustering (A) and PCA (B). (C) Schematics of the HSPC gene regulatory network (GRN) in YS, AGM, FL12 F, FL13, and FL14 relative to WBM HSC. This GRN is composed of HSPC expressed genes (center rectangle), transcription factors (TFs) predicted to regulate these genes (circles), and cooperating gene sets that must be highly expressed for the TFs to exert a regulatory influence (contexts, boxed areas). Stimulatory TFs are shown as arrows and inhibitory TFs are shown as blunt lines. Differences in TFs expression are shown as red circles (up-regulated) or blue circles (down-regulated). Only TFs where the absolute value of the log2 ratio of the given sample versus WBM HSCs exceeds 1 are shown. See also Figure S2.
To determine whether differences in the HSPC gene regulatory network (GRN) contribute to the three distinct transcriptional states of developing HSC, we first identified the context-dependent GRNs of 44 distinct cell types and tissues, including HSPCs, using publicly available data (Supplemental Methods). There are three components to each GRN: genes expressed by a cell type or tissue, the transcription factors (TFs) predicted to regulate these genes, and cooperating gene sets that must be highly expressed for the TFs to exert a regulatory influence (contexts). We compared the expression of the HSPC GRN in YS and AGM to WBM (Figure 2C). The expression of the HSPC regulators Erg, Nfe2, Hoxa9, and Hlf, did not reach an adult HSC expression level in the YS and AGM. Also, Tulp4, a predicted repressor of the HSPC GRN, is highly expressed in both the YS-like and Specifying HSC. However, Myb, Gata2, Tal1, Etv6, Prdm5, and Homez had low expression only in Specifying HSC, suggesting that this difference contributes to the distinct states of the YS-like and Specifying groups. Examining the progression of GRN changes in the Definitive HSC population from FL12 to FL14, we found that Fos and Fosb are down-regulated in highly proliferative FL HSCs (Figure 2C), consistent with their role as gate-keepers to HSC mitotic entry (Okada et al., 1999).
Hemogenic endothelial HSC precursors share transcriptional overlap with macrophages
Our data represent the first global expression profiling of HSPC and their precursors from the AGM, YS, and placenta. To determine the global resemblance of these populations to known, adult cell populations, we applied a Naive Bayesian classifier that calculates the probability that an unknown sample is indistinguishable from known cells types and tissues (Supplemental Methods). HSC from WBM, FL12 F, E13.5 FL, E14.5 FL, E9 YS, E12.5 placenta, E11.5 AGM, day-6 EB-derived cells, and ESC-HSC cells all classified as HSPCs (Figure 3A). Surprisingly, E11.5 AGM hemogenic precursors also scored positively for similarities to macrophages, microglia and osteoclasts. This likely does not result from contamination because the E11.5 AGM population is uniformly composed of small, blast-like cells that do not resemble macrophages (Taoudi et al., 2005). The set of genes contributing most significantly to the macrophage classification (Figure S3A) is enriched in the GO Biological Processes ‘Cell migration’, ‘Blood vessel development’, and ‘Inflammatory response’ (corrected p-values<0.01), suggesting that AGM-derived cells and macrophages utilize common genetic programs to facilitate their migratory behavior and that these cells have remnants of their endothelial origin. The FL12 A samples also classified as macrophages, despite being isolated on the basis of a distinct cell surface phenotype that included the depletion of mature hematopoietic lineages, including macrophages.
Figure 3. Comparison of HSCs in ontogeny to adult tissues and cell types.
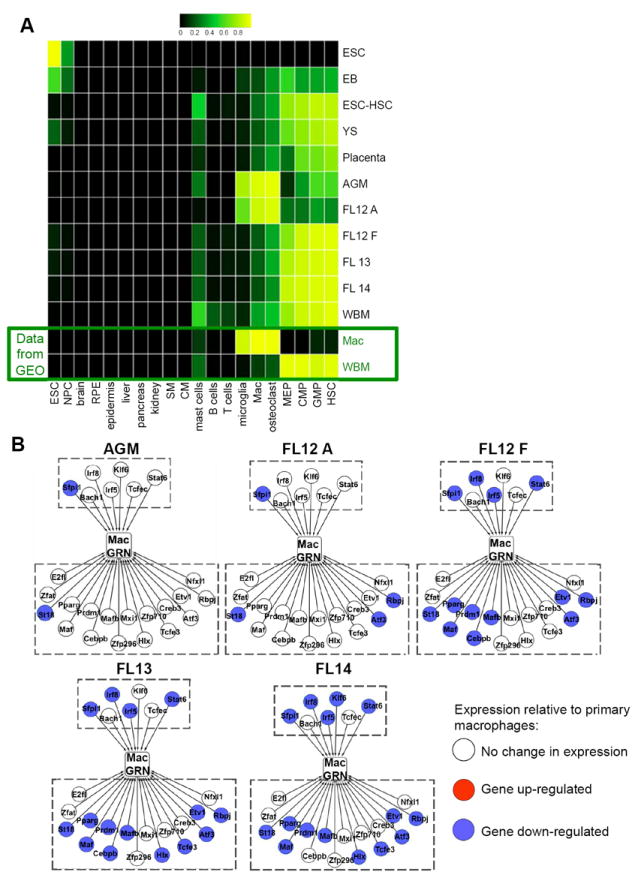
(A) A Naïve Bayesian classifier was used to assess transcriptional overlap with 44 tissues and cell types. The results of 20 of these comparisons are displayed (all other reference tissues and cell types were negative). NPC, neural progenitor cells; RPE, retinal pigment epithelium; SM, skeletal muscle; CM, cardiac muscle; Mac, macrophage; MEP, megakaryocyte-erythrocyte progenitor; CMP, common myeloid progenitor; GMP, granulocyte-monocyte progenitor. Each row is a biological group (i.e. WBM HSCs), and each column is a known tissue or cell type. The classifier determines the posterior probability that a sample is indistinguishable from each of the tissues or cell types in the reference data set. Higher probabilities are bright yellow and low probabilities are dark green and black. (B) Schematics of the macrophage GRN in AGM, FL12 A, FL12 F, FL13, and FL14 relative to primary macrophages (see Figure Legend 2C for details). Only TFs where the absolute value of the log2 ratio of the given sample versus primary macrophages exceeds 2 are shown. See also Figure S3.
We speculated that differential activity of the regulatory network governing the macrophage program might account for the ability of hemogenic endothelial cells to transiently pass through a macrophage-like transcriptional state. To explore this, we again leveraged the context-dependent GRNs of 44 cell types and tissues, comparing the expression of the macrophage GRN in the AGM and FL-derived HSCs to primary macrophages. The expression of most macrophage positive regulators was unchanged (Figure 3B) in the AGM and FL12 A samples. However, Sfpi1, a master regulator of myeloid and lymphoid differentiation, does not reach the macrophage level of expression (Figure 3B). This is significant because Sfpi1 is auto-regulated in differentiated myeloid cells, a mechanism by which cells are able to stabilize transcriptional states (Leddin et al., 2011). These results suggest a model in which nascent HSCs temporarily access a macrophage-related transcriptional program, perhaps to facilitate their migration to the FL. Low Sfpi1 expression may ensure that this state is transient.
ESC-derived hematopoietic progenitors and HSC cluster with distinct in vivo populations
EB-derived hematopoietic progenitors express c-kit and CD41 (McKinney-Freeman et al., 2008; Mikkola et al., 2003) and acquire repopulating activity when exposed to ectopic homeobox gene expression and OP9 co-culture (Wang et al., 2005a). Moreover, retroviral integration site analysis reveals clonal multi-lineage lymphoid-myeloid engraftment of primary and secondary animals, thereby reflecting the cardinal features of HSCs—self-renewal and multipotency (Wang et al., 2005a). Although Cdx-Hox modified EB cells are the most robust ESC-HSC reported to date, they fail to fully reconstitute the in vivo lymphoid compartment and display an aberrant cell surface phenotype (McKinney-Freeman et al., 2009). A better understanding of how these ESC-HSC relate to embryonic HSCs would inform protocols for deriving HSC from PSC or non-hematopoietic tissues via direct conversion. Thus, we compared the gene expression profiles of CD41BrightCD34-CD45- ESC-HSC, c-kit+CD41+ day-6 EB-derived cells, and ESC to the developmental dataset (Figure 1 and Table 1). ESC-HSC cells clustered mostly tightly with FL and WBM HSC (Figure 2A and B) and were distinct from mid-gestation in vivo populations (i.e. E9 YS) and their cells of origin (i.e. c-kit+CD41+ EB-derived cells). As anticipated, EB-derived c-kit+CD41+ cells clustered with E9 YS, reflecting the known similarity of EB-derived and YS hematopoiesis (Keller et al., 1993). Thus, despite their aberrant function, ESC-HSC are most similar to HSC populations with a definitive, adult-like HSC fate.
Pair-wise comparisons
As the expression of few known HSC regulators fluctuated during HSC ontogeny (Figure S2B), we next assessed differentially expressed genes between each population for enrichment of Gene Ontology (GO) biological processes and canonical signaling pathways (Figure S4A and B). Gene Set Enrichment Analysis (GSEA) was applied to pair-wise comparisons between all populations and major biological groups (i.e. YS-like, Definitive, and Specifying HSCs). As expected, ESC were enriched in the GO category “negative regulation of cell differentiation,” and all embryonic populations were enriched in active cell cycle categories (e.g. “cell division”, “cell cycle”, and “mitosis”) relative to WBM-HSC, consistent with their known quiescence (Wilson et al., 2009). VE-cadherin+CD45+ AGM-derived cells were enriched for “cell communication”, “NO biosynthetic processes”, and “positive regulation of angiogenesis” (Figure S4A), reflective of their endothelial origin. AGM and placenta were both enriched for “neutrophil chemotaxis” and “chemotaxis”, suggesting migratory populations. AGM and placenta are also enriched in “inflammatory response” and “response to lipopolysaccharide” (Figure S4A), consistent with a transcriptional resemblance to macrophages (Figure S4A). Analysis of the major biological groups revealed that Specifying HSCs were enriched in chemotaxis, inflammatory response, positive regulation of nitric oxide, biosynthetic process, cell adhesion, positive regulation of angiogenesis, and the ERK cascade, again consistent with an endothelial origin (Figure 4A) (Krens et al., 2008; Srinivasan et al., 2009).
Figure 4. Pathway enrichment analysis of pair-wise comparisons between major developmental hematopoietic groups.
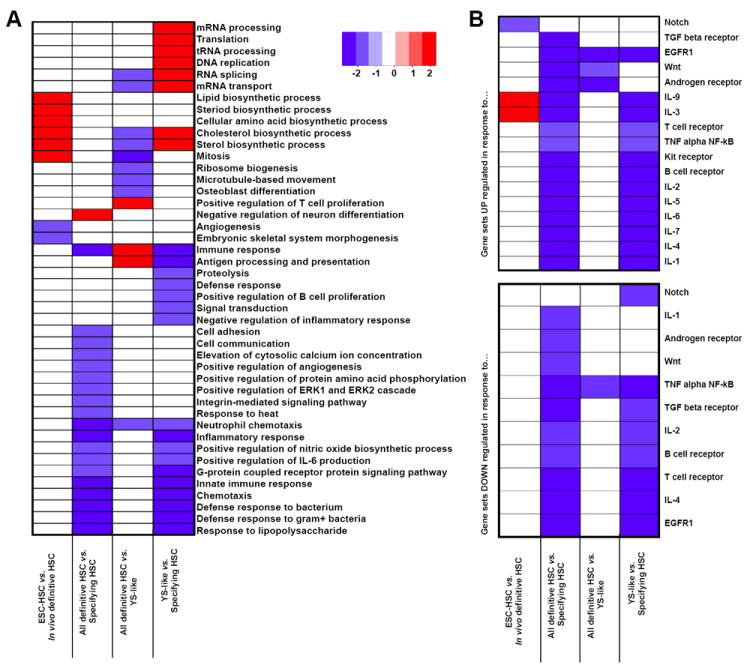
(A) GSEA of pair-wise comparisons to find GO Biological Processes enriched (red) or depleted (blue) between developmental populations. (B) GSEA of pair-wise comparisons to identify NetPath-annotated signaling pathways transcriptionally activated or suppressed. “In vivo Definitive HSC” includes WBM, FL12 F, E13.5 FL and E14.5 FL; “Specifying HSC” includes AGM, FL12 A, and placenta; “YS-like” includes EB and YS; and “All definitive HSC” includes ESC-HSC, WBM, FL12 F, E13.5 FL and E14.5 FL. Only significant gene sets are shown (Family wise error rate<0.05). See also Figure S4.
Next, we determined whether genes regulated in response to the twenty NetPath signaling pathways (Kandasamy et al., 2010) were enriched in the YS-like, Definitive, and Specifying populations. Each NetPath-annotated signaling pathway has two gene sets: genes up-regulated in response to a pathway and genes down-regulated. Genes up-regulated in response to Wnt and IL-3 signaling were enriched in Specifying HSC (Figure 4B), in agreement with reports that Wnt and IL-3 signaling promote HSC specification (Goessling et al., 2009; Robin et al., 2006). Notably, in vivo Definitive HSCs were enriched in genes targeted by Notch signaling relative to ESC-HSC (Figure 4B and Figure S4B), suggesting that the aberrant functionality of ESC-HSC may be due to a lack of specification via Notch signaling.
Identification of known and novel transcriptional regulators of HSC ontogeny
To identify coordinately expressed genes, we applied the network-based Weighted Gene Co-expression Network Analysis clustering algorithm (WGCNA) and detected 66 modules ranging in content from 24 to 1,752 genes (Figure 5 and Figure S5A). A complete list of genes assigned to each module is available on the companion website (http://hsc.hms.harvard.edu). As genes within a module are highly positively correlated, we summarized their expression as the median of the standardized expression of each gene within a given module, resulting in a single module value at each developmental time-point (Figure 5 and Figure S5A). Twenty-six modules are stage-enriched (i.e., more highly expressed in a single stage than all other stages (corrected P-value<0.01; Figure 5)). Thirteen modules were characteristic of Definitive HSC (highest in FL12 F, FL13, FL14, WBM, ESC-HSC), 11 for Specifying HSC (highest in AGM, Placenta, FL12 A), 5 for Yolk sac-like (highest in EB and YS), and 10 reflected the in vitro state (highest in ESC, EB, and ESC-HSC; Figure 5).
Figure 5. Identification of stage-specific gene sets.
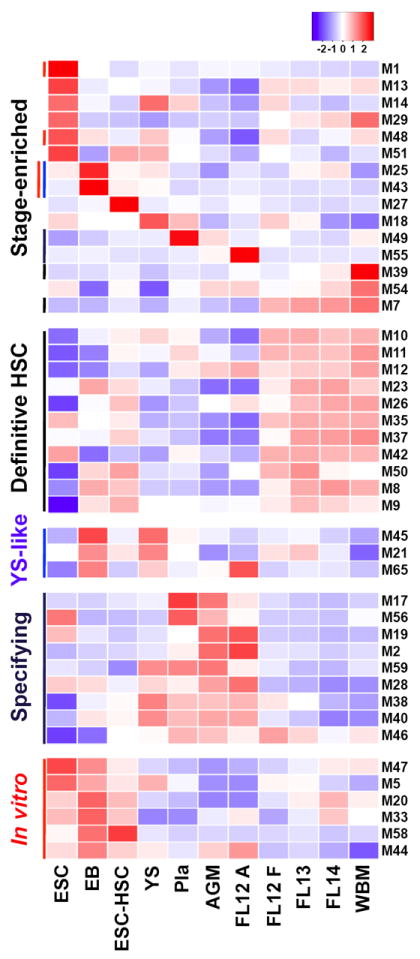
Co-regulated gene sets were identified via WGCNA. 66 distinct modules were discovered. A module was considered “Definitive HSC” if its expression was significantly higher in definitive HSC (FL12 F, FL13, FL14, ESC-HSC, and WBM) relative to other samples (Holm-corrected p-value<0.01). Similarly, modules were annotated as “stage-enriched”, “specifying”, or “in vitro”. Each row represents the module profile: a summary of the expression pattern of all genes within a module. See also Figure S5 and Table S1.
To identify the GRN active in HSC development, we used the Context Likelihood of Relatedness (CLR) algorithm to identify putative transcriptional regulators (TR) of each module (Figure S6A) (Faith et al., 2007; Taylor et al., 2008). CLR uses mutual information rather than linear correlation to identify significant relationships between TR and target genes, and has accurately reconstructed mammalian GRN (Faith et al., 2007; Taylor et al., 2008). We applied CLR to each gene module and 1,623 TRs, computing the mutual information between module profiles and the expression profile of each TR. This analysis identified a GRN consisting of 1,147 putative regulatory relationships (FDR<0.05) with 0 to 53 (median=17) regulators per module and 0 to 7 modules per regulator. A table of the complete GRN (TRs and putative target modules) is available on the companion website. For clarity, we show the network consisting of CLR predictions at the 0.01 FDR threshold (Figure S6A). The network is scale-free, indicating that a small number of nodes act as hubs with edges to a large number of other nodes, consistent with other network analyses of GRN (Figure S6B) (Barabasi and Oltvai, 2004).
To assess the reproducibility of our gene expression data, we analyzed the exemplars and top three predicted regulators of 22 modules via the Fluidigm microfluidic qRT-PCR platform (Table S1, Figure S5B-E). We collected multiple additional independent biological replicates of EB-derived cells, ESC-HSC, YS, Placenta, AGM, E12.5 FL, E13.5 FL, and WBM (Table 1) and compared the microarray intensities of each gene at each stage to qRT-PCR-based delta Cts (normalized to Rps29). We saw high concordance between the two platforms (R2=0.5446, P-value<4.4 * 10-111, Figure S5C and D). Figure S5E depicts the results for five “Definitive HSC” modules, revealing that at the gene-level, the Affymetrix-expression levels are recapitulated by Fluidigm. In total, 60/80 candidate genes (at a P-value cutoff <0.10) were validated by Fluidigm, confirming the fidelity of our dataset.
Hypothesizing that highly connected (“hub”) genes are more likely to be important in HSC, we looked for overlap in the CLR predictions of modules with a “Definitive HSC” signature (i.e., M7, M10, M11, M12, M23, M26, M35, M37, M42, M50, M8 and M9; Figure 6A). Regulators predicted for more than one of these modules are labeled in Figure 6A. Many of these “hub” regulators have already been implicated in hematopoiesis, though not necessarily in HSC development, including HoxA9, Vdr, Hlf, Lmo2, Bcl11a, Prdm16, Gfi1, and Mllt3 (Chuikov et al., 2010; Hirose et al., 2010; Hock et al., 2004; Jeanson and Scadden, 2010; Lawrence et al., 1997; Magnusson et al., 2007; Pina et al., 2008; Sankaran et al., 2008). These results confirm that “hub” genes may be key regulators of HSC function and/or development.
Figure 6. Identification and validation of novel transcriptional regulators of discrete stages of HSC ontogeny.
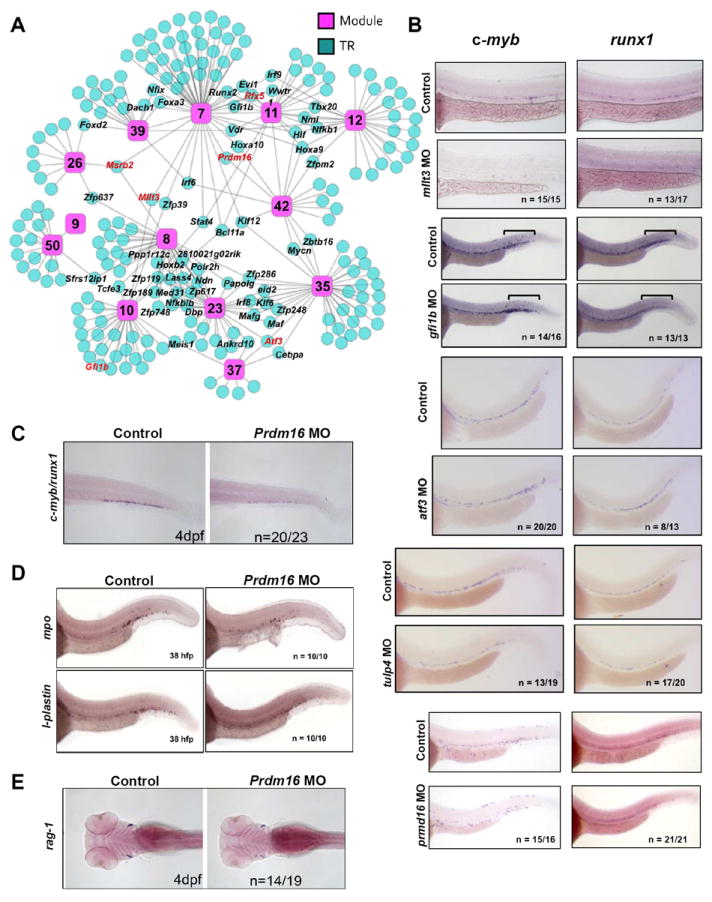
(A) CLR was applied to identify putative TRs for each module. A network schematic of the CLR-derived predictions at the 0.05 FDR for all “Definitive HSC” modules is shown. Pink squares represent modules and blue circles represent predicted TRs. “Hub” genes are labeled black. Genes assessed functionally in zebrafish are highlighted in red. A list of all genes predicted to regulate each module can be found at http://hsc.hms.harvard.edu/. (B) Whole-mount in situ hybridization for c-myb and runx1 was performed at 36 hpf on uninjected embryos or embryos injected with morpholinos (MO) targeting mllt3, gfi1, atf3, tulp4, or prdm16. Bars in gfi1b panels designate the posterior ICM. (C) The CHT of prdm16 morphants was examined 4 dpf for c-myb/runx1 expression via whole-mount in situ hybridization. (D) Prdm16 morphants were examined via whole-mount in situ hybridization for mpo or l-plastin expression at 38 hpf. (E) Prdm16 morphants were examined via whole-mount in situ hybridization for rag-1 at 4 dpf. See also Figures S6, S7.
To functionally determine if our computational predictions were indeed able to identify novel gene candidates involved in definitive hematopoiesis, Definitive HSC “hub” genes prdm16, mllt3, atf3, msrb2 and rfx5 (Figure 6A), as well as gfi1b, predicted regulator of definitive module M10, and tulp4, a CLR predicted positive regulator of Specifying modules 19 and 28 and negative regulator of Definitive HSC module 7, were selected for knock-down in zebrafish embryos. Mllt3 is also a Specifying “hub” gene, predicted to regulate two Specifying modules (M28 and M40). Zebrafish represents a tractable system that faithfully reflects mammalian hematopoiesis and thus, allows us to rapidly interrogate a role for these genes in this process in vivo. Embryos were injected at the one-cell stage with morpholinos targeting these gene candidates and assayed at 36 hours post fertilization (hpf) by in situ hybridization for c-myb and runx1, markers for HSPC/myeloid cells and HSPC, respectively (Jin et al., 2009).
mllt3 morphants displayed a significant loss of both c-myb and runx1 staining in the 36 hpf AGM, suggesting a decrease in HSPC (Figure 6B). While disruption of gfi1b did not affect c-myb or runx1 expression in the AGM, an increase of c-myb+ cells and a decrease of runx1+ cells was seen in the posterior intermediate cell mass (ICM), where erythroid/myeloid progenitors (EMP) are known to localize (Figure 6B). These data implicate gfi1b in erythroid/myeloid EMP fate choice by suggesting an increase in EMP-derived myeloid progeny, consistent with gfi1’s known role in lineage choice (Hock and Orkin, 2006; Randrianarison-Huetz et al., 2010). Atf3 morphants showed an increase in runx1 staining in the AGM with no change in c-myb staining (Figure 6B). Likely aft3 directly or indirectly regulates runx1 transcript levels, given that aft3 morphants also displayed no change in l-plastin or CD41, suggesting that myeloid progeny downstream of HSPC, as well as HSPC progenitors, respectively were unchanged (Figure S7B and C). Tulp4 morphants showed a decrease in both runx1 and c-myb staining in the AGM, suggesting a reduction in HSPC (Figure 6B). Neither Atf3 nor Tulp4 have ever been linked functionally to the regulation of HSC or hematopoiesis. Thus, our computational data effectively identified these two genes as putative novel regulators of HSPC biology.
C-myb expression was clearly reduced in prdm16 morphants while runx1 expression was maintained (Figure 6B). A loss of c-myb/runx1 staining was also observed with a second morpholino targeting a distinct exon of prdm16 (Figure S7 A and D). The development of c-myb+/runx1+ cells in the caudal hematopoietic tissue was also impaired in prdm16 morphants at four days post fertilization (dpf) (Figure 6C). This was not concomitant with an initial loss of proliferation or increase in cell death, as we observed no changes in phospho-histone H3 or apoptosis in prdm16 morphants (Figure S7E). Impairment in the formation of mpo+ and l-plastin+ myeloid cells and rag1+ lymphoid cells was also observed at 38 hpf and four dpf respectively (Figure 6D and E). Notch1 signaling, ephrinB2 expression, and flk1 expression were all unperturbed in prdm16 morphants, supporting intact hematopoietic and endothelial specification (Figure S7F and G). These data suggest proper HSC specification in prdm16 morphants, but a failure of HSCP maintenance, and possibly differentiation, as has been suggested by recent mouse studies (Chuikov et al., 2010; Aguilo et al., 2011). However, a potential defect in HSC migration cannot be excluded by these experiments.
Discussion
Here we present a comprehensive analysis of the transcriptome of developing HSC, from mid-gestation through adulthood. By novel application of the network-based WGCNA and CLR algorithms, we identified genes that define discrete stages of HSC development and their putative regulators. As leukemic transformation often involves the reactivation of developmental genes (e.g. Lmo2, Scl, Mll, Runx1 (Ernst et al., 2002; Izraeli, 2004)), understanding the transcriptional networks governing HSC development may help unravel mechanisms of hematopoietic malignancy. Further, our dataset nominates a host of genes to test for their potential to engineer hematopoietic fates from PSC, a critical milestone in realizing the clinical potential of patient-specific PSC.
Our dataset complements a recent analysis of the transcriptional circuitry of human post-natal hematopoietic populations by focusing on the transcriptional landscape of embryonic hematopoiesis (Novershtern et al., 2011). Pbx1 and Sox4, identified in our analysis as regulators of Definitive HSC modules M8 and M7, respectively, were also the top-level regulators of the human ‘HSC-Progenitor’ program #865 in this prior study, suggesting conservation of HSC regulators in humans and mice (Novershtern et al., 2011). However, although the HSC-Progenitor program included HOXA9, HOXA10, GATA2, and MEIS1, these genes were split here between modules M7 (Hox genes) and M8 (Gata2 and Meis1), suggesting that the establishment of the HSC transcriptional program results from multiple, distinct regulatory programs active during development. Thus, our novel analysis allowed us to further refine distinct regulatory programs active during HSC ontogeny.
Identification and functional validation of novel transcriptional regulators
Computational strategies for inferring mammalian gene regulatory networks include modeling expression levels using ordinary differential equations (di Bernardo et al., 2005; Ergun et al., 2007), inferring regulatory relationships based on mutual information between regulators and target genes, and Bayesian network approaches (Faith et al., 2007; Margolin et al., 2006; Segal et al., 2003). As most known hematopoietic regulators in our data set did not dramatically change expression in HSPC or their precursors during development (Figure S2B), we presumed that the regulators that orchestrate the transitions responsible for each developmental stage remained to be discovered and validated. Thus, we designed a novel computational strategy to identify stage-specific transcriptional regulators. We applied the CLR algorithm because of its strong performance characteristics and relatively short execution times, which allowed us to iteratively run the algorithm as additional samples were collected and processed (Ciaccio et al., 2010). By extending its application to modules of coordinately expressed genes, we increased CLR s ability to detect putative targets genes (Michoel et al., 2009). This allowed us to discern 66 distinct gene modules and associated TRs. Each module represents an opportunity to develop novel hypotheses about the regulation of HSC development. Our data is available to the community via a searchable website (http://hsc.hms.harvard.edu) that allows users to both explore each WGCNA-generated gene module and it s corresponding CLR-predicted TRs, as well as evaluate the expression of genes of interest across the dataset.
Our zebrafish studies confirmed a role for prdm16, mllt3, gfi1b, aft3, tulp4, but not rfx5 and msrb2 (data not shown), in HSPC biology. These genes were all predicted as HSC regulators by our dataset and represent both known and novel hematopoietic factors. Our data implicate for the first time potential roles for both Mllt3 and Tulp4 in HSC specification. Importantly, both these genes are Specifying “hub” genes: Mllt3 is a predicted regulator of Specifying modules M40 and M28 and Tulp4 of Specifying modules M28 and M19. Although Mllt3-/- deficient mice do not have peripheral hematopoietic defects, their HSC compartment is unexplored (Collins et al., 2002; Iida et al., 1993). Preliminary work suggests that ectopic Mllt3 during murine ESC differentiation enhances the specification of hematopoietic progenitors (McKinney-Freeman, unpublished data). Prdm16, gfi1b, and atf3 were each shown to contribute to different aspects of HSC biology, likely downstream of specification: gfi1b was shown to skew the activity of posterior ICM EMPs, consistent with known roles in erythoid/megakaryocyte biology (Hock and Orkin, 2006; Randrianarison-Huetz et al., 2010). Zebrafish prdm16 seems required to maintain homeostasis as HSC differentiate, in agreement with recent data that mice require Prdm16 for HSC maintenance and function (Aguilo et al., 2011; Chuikov et al., 2010). Although Atf3 and Tulp4 were predicted to regulate multiple Specifying and Definitive HSC modules by our analysis, these two genes have never been previously linked to HSC biology. Our finding that morpholino-mediated disruption of these genes in developing zebrafish can perturb the expression of key hematopoietic TRs suggests that these genes may indeed regulate HSC development and/or biology, although further work is needed to clarify their precise roles. Nonetheless, here we showed that multiple genes identified by our computational strategy do indeed have functional consequences on developing hematopoietic populations when disrupted in vivo, establishing that this dataset and analysis can identify functionally relevant novel gene candidates.
Recent reports establishing hemogenic endothelium as the source of definitive HSC have generated tremendous interest in elucidating the molecular mechanisms governing this transition. HoxA3, reported to suppress the hematopoietic signature in endothelium (Iacovino et al., 2011) was identified in our study as a repressor of the specifying module M28 (Figure 5). Erg, key for fetal HSC but dispensable for specification, is negatively correlated with M19, a specifying module, but positively correlated with M10, a definitive HSC module (Figure 5), exactly as one would predict (Taoudi et al., 2011). Thus, our computational analyses successfully identified and classified these known regulators of HSC development.
Embryonic HSC can be “YS-like”, “Specifying”, or “Definitive”
When examined by hierarchical clustering and PCA, the multiple independent HSPC populations interrogated in our study converged on three transcriptionally distinct states: the neonatal repopulating cells of the YS, the nascent HSC and precursors of the placenta and AGM, and definitive FL and WBM HSC (Figure 2A and 2B). The relatively few differences within these groups seen by differential expression and GSEA supports our conclusion that there are three states of developing HSC. For example, pathway enrichment analyses revealed only nine and six differentially expressed categories when E13.5 or 14.5 FL HSC were compared with WBM-HSC, respectively. Seven of these nine differential groups relate to the already well-described differences in cell cycle status between these groups (Figure S4A). In contrast, 17 and 21 differential groups are seen when the AGM is compared to E13.5 or 14.5 FL HSC, respectively, suggesting a distinct state. This finding also suggests that the definitive HSC signature is not acquired gradually during gestation, but is specified suddenly around E12.5 as HSC transition to the FL. This finding highlights again the critical importance of dissecting the molecular regulation of the conversion from a “Specifying” to a “Definitive” HSC fate, as this is the most dramatic and critical transition that occurs during HSC ontogeny.
The E12.5 HSC compartment is split between two transcriptional states
HSC, rare in the E10.5-E11.5 conceptus, expand dramatically in the FL and placenta between E11.5 and E12.5 due to an acceleration of de novo HSC specification (Taoudi et al., 2008) (Mikkola et al., 2005). Surprisingly, hierarchical clustering and PCA of our data reveal that the E12.5 HSC compartment is split between an AGM-like transcriptional signature and a WBM-like transcriptional signature: all placenta and FL12 A samples clustered with VE-cadherin+CD45+ E11.5 AGM while all FL12 F, E13.5 FL, and E14.5 FL samples clustered with WBM HSC. Thus, some E12.5 HSC share significant transcriptional overlap with hemogenic endothelial precursors. This could be due to ongoing HSC specification within the early FL or significant numbers of nascent HSC newly arrived from the AGM that have not yet silenced the hemogenic endothelial signature. While VE-cadherin+CD45+ E11.5 AGM cells express only gamma globin, FL12 A cells express a variety of fetal and adult hemoglobin genes, suggesting a population in transition. Thus, our unique data set and computational analyses suggest a model in which HSC originating from AGM hemogenic endothelial precursors, and possibly placenta, seed the E12.5 FL and acquire a complete definitive HSC signature over the next few hours of development.
Nascent HSC share transcriptional overlap with macrophages and inflammatory cells
Although VE-cadherin+CD45+ AGM-derived and FL12 A cells scored as HSPC, they also correlated with macrophages via the Naïve Bayesian classifier (Figure 3A and Figure S3A). E11.5 AGM-derived VE-cadherin+CD45+ cells are a mixture of hematopoietic progenitors, adult repopulating cells, and hemogenic precursors that display a uniform ‘blast-like’ morphology very unlike macrophages (Taoudi et al., 2005). Our data suggest that the AGM is enriched for nascent HSPC that utilize similar molecular mechanisms as macrophages to migrate to the FL. Indeed, analysis of intra-aortic cell clusters by electron microscopy reveal fillipodia extensions, suggestive of a population primed to migrate (Medvinsky et al., 1996). VE-cadherin+CD45+ are likely found in these cell clusters (Taoudi et al., 2005). Like these nascent progenitors, inflammatory cells are programmed to migrate (sites of infection vs. FL). Live imaging recently captured dramatic changes in cell shape and motility as endothelial cells leave the aortic wall and commit to a hematopoietic fate (Kissa and Herbomel, 2010). It is possible that this process employs the same motility pathways as macrophages.
ESC-HSC transcriptionally resemble definitive HSC
There have been many unsuccessful attempts to generate PSC-HSC (McKinney-Freeman and Daley, 2007). Recently, hematopoietic cells have been generated via co-culturing human ESC with AGM-derived stromal lines or reprogramming committed cells directly into hematopoietic progenitors without a pluripotent intermediate, but the degree of hematopoietic engraftment for these engineered populations lags behind accessible human sources like umbilical cord blood (Ledran et al., 2008; Szabo et al., 2010). Although murine ESC-HSC can robustly engraft lethally irradiated mice (Wang et al., 2005a), they do not faithfully mimic the function or phenotype of WBM-HSC (McKinney-Freeman et al., 2009). Since ESC-HSC express high levels of CD41, we hypothesized that they might represent a developmental intermediate. However, our data reveal that ESC-HSC cluster most closely with FL and WBM-HSC, rather than E9 YS or day 6 EBs. While it has been thought that HoxB4 merely expands a hematopoietic progenitor population already specified during EB differentiation, our results suggest that homeotic gene expression, in conjunction with OP9 co-culture, serves to re-specify a subset of CD41+ckit+ EB-derived cells towards a definitive HSC fate, as originally argued (Kyba et al., 2002). The aberrant function of ESC-HSC is likely due to incomplete specification or molecular perturbations caused by constitutive ectopic homeobox gene expression and the absence of critical exogenous and molecular cues. Indeed, Tek and HoxA9 expression is starkly absent from ESC-HSC relative to FL and WBM HSC. Tek (also known as Tie2) regulates HSC maintenance while HoxA9 is required for normal hematopoiesis (Arai et al., 2004; Lawrence et al., 1997; Takakura et al., 1998). In addition, pair-wise comparison between ESC-HSC and FL/WBM HSC revealed the absence of a transcriptional response to Notch signaling, which could explain the inability of these cells to faithfully generate lymphoid cells. Further work is required to determine if rescuing the Notch transcriptional response restores the lymphoid potential of homeobox-derived ESC-HSC. Most importantly, since ESC-HSC are closely related to definitive HSC, yet functionally restricted, they represent a unique opportunity to uncover novel molecular regulators of definitive HSC function.
Experimental Procedures
Details on embryo dissections, cell culture, zebrafish, fluidigm validation experiments, and data analysis are described in the Extended Experimental Procedures available on-line.
Cell fractionation
Cell sorting was performed as previously described (McKinney-Freeman et al., 2009). For all populations, cells were first collected in PBS and then sorted a second time into lysis buffer (RNAeasy Microkit, Qiagen).
Microarray
The RNAeasy microkit (Qiagen) was used to collect and prepare total RNA for microarray and Fluidigm analysis. The Ovation®Picokit (Nugen) was used for pre-amplification. Gene expression profiling was performed on Affymetrix 430 2.0 gene chips per standard protocol.
Computational Analysis
Normalization, batch correction, differential analysis, and hierarchical clustering of microarray data are described in detail in the Supplemental Methods. WGCNA, a clustering algorithm that selects clustering cutoffs such that the resulting gene network follows a scale-free distribution (Zhang and Horvath, 2005), was used to find sets of positively co-regulated genes. Module profiles were computed by calculating the sample-median of standardized gene expression values in each module. Module regulatory networks were constructed by applying the CLR algorithm to the matrix consisting of the standardized expression values of 1,171 transcription regulators detected as present in at least one biological group and the module profiles. False discovery rates were calculated as previously described (Faith et al., 2007). Stage-specific and stage-enriched modules were defined as those expressed higher in one stage versus all other stages (Holm corrected p-value<1*10-10 and p-value<1*10-2, respectively). GEO accessions of the mESC samples are GSE16925 and GSE14012. Positive control samples for the classification analysis (Figure 3B) are GSM516564 and GSM463712 for the macrophage and HSC samples, respectively. The GEO accession for the newly generated data presented here is GSE37000.
Supplementary Material
Highlights.
Web-based expression resource of embryonic blood populations: http://hsc.hms.harvard.edu/
Gene regulatory network reconstruction of HSC development
Multiple novel regulators of HSC development implicated, e.g. Prdm16, Mllt3, Gfi1b, Atf3, Tulp4
ESC-HSCs resemble definitive HSC but lack a Notch-signaling signature
Acknowledgments
We thank M.W. Lensch for helpful discussions and critical review of the manuscript, N. Gerry for assistance with gene expression arrays, and J. Daley and S. Lazo-Kallanian of the Dana Farber Cancer Institute (Boston, MA) and Richard Ashman and Jim Houston of St. Jude Children s Research Hospital (Memphis, TN) for expertise in cell sorting and flow cytometry. Fluidigm experiments were performed by the Molecular Genetics Core Facility at Children s Hospital Boston supported by NIH-P50-NS40828 and NIH-P30-HD18655. SMF was supported by NIH grant K01 DK080846. GQD is supported by grants from the NIH (RO1-DK70055, RO1-DK59279, UO1-HL100001, R24-DK092760 and special funds from the ARRA stimulus package- RC2-HL102815), the Roche Foundation for Anemia Research, Alex s Lemonade Stand, and the Harvard Stem Cell Institute. GQD is an affiliate member of the Broad Institute, a recipient of Clinical Scientist Awards in Translational Research from the Burroughs Wellcome Fund and the Leukemia and Lymphoma Society, and an investigator of the Manton Center for Orphan Disease Research. PC is supported by grant T32HL007623 from the NHLBI. GQD, LZ, and JJC are investigators of the Howard Hughes Medical Institute. JJC and HL are supported by Howard Hughes Medical Institute, SysCODE (Systems-based Consortium for Organ Design & Engineering), and NIH grant # RL1DE019021, and H.L. is supported by Boston University Clinical and Translational Science Institute (CTSI) grant # UL1-TR000157.
Footnotes
Publisher's Disclaimer: This is a PDF file of an unedited manuscript that has been accepted for publication. As a service to our customers we are providing this early version of the manuscript. The manuscript will undergo copyediting, typesetting, and review of the resulting proof before it is published in its final citable form. Please note that during the production process errors may be discovered which could affect the content, and all legal disclaimers that apply to the journal pertain.
References
- Aguilo F, Avagyan S, Labar A, Sevilla A, Lee DF, Kumar P, Lemischka IR, Zhou BY, Snoeck HW. Prdm16 is a physiologic regulator of hematopoietic stem cells. Blood. 2011;117:5057–5066. doi: 10.1182/blood-2010-08-300145. [DOI] [PMC free article] [PubMed] [Google Scholar]
- Arai F, Hirao A, Ohmura M, Sato H, Matsuoka S, Takubo K, Ito K, Koh GY, Suda T. Tie2/angiopoietin-1 signaling regulates hematopoietic stem cell quiescence in the bone marrow niche. Cell. 2004;118:149–161. doi: 10.1016/j.cell.2004.07.004. [DOI] [PubMed] [Google Scholar]
- Barabasi AL, Oltvai ZN. Network biology: understanding the cell’s functional organization. Nat Rev Genet. 2004;5:101–113. doi: 10.1038/nrg1272. [DOI] [PubMed] [Google Scholar]
- Bonde S, Chan KM, Zavazava N. ES-cell derived hematopoietic cells induce transplantation tolerance. PLoS One. 2008;3:e3212. doi: 10.1371/journal.pone.0003212. [DOI] [PMC free article] [PubMed] [Google Scholar]
- Chuikov S, Levi BP, Smith ML, Morrison SJ. Prdm16 promotes stem cell maintenance in multiple tissues, partly by regulating oxidative stress. Nat Cell Biol. 2010;12:999–1006. doi: 10.1038/ncb2101. [DOI] [PMC free article] [PubMed] [Google Scholar]
- Ciaccio MF, Wagner JP, Chuu CP, Lauffenburger DA, Jones RB. Systems analysis of EGF receptor signaling dynamics with microwestern arrays. Nat Methods. 2010;7:148–155. doi: 10.1038/nmeth.1418. [DOI] [PMC free article] [PubMed] [Google Scholar]
- Collins EC, Appert A, Ariza-McNaughton L, Pannell R, Yamada Y, Rabbitts TH. Mouse Af9 is a controller of embryo patterning, like Mll, whose human homologue fuses with Af9 after chromosomal translocation in leukemia. Mol Cell Biol. 2002;22:7313–7324. doi: 10.1128/MCB.22.20.7313-7324.2002. [DOI] [PMC free article] [PubMed] [Google Scholar]
- di Bernardo D, Thompson MJ, Gardner TS, Chobot SE, Eastwood EL, Wojtovich AP, Elliott SJ, Schaus SE, Collins JJ. Chemogenomic profiling on a genome-wide scale using reverse-engineered gene networks. Nat Biotechnol. 2005;23:377–383. doi: 10.1038/nbt1075. [DOI] [PubMed] [Google Scholar]
- Ergun A, Lawrence CA, Kohanski MA, Brennan TA, Collins JJ. A network biology approach to prostate cancer. Mol Syst Biol. 2007;3:82. doi: 10.1038/msb4100125. [DOI] [PMC free article] [PubMed] [Google Scholar]
- Ernst P, Wang J, Korsmeyer SJ. The role of MLL in hematopoiesis and leukemia. Curr Opin Hematol. 2002;9:282–287. doi: 10.1097/00062752-200207000-00004. [DOI] [PubMed] [Google Scholar]
- Faith JJ, Hayete B, Thaden JT, Mogno I, Wierzbowski J, Cottarel G, Kasif S, Collins JJ, Gardner TS. Large-scale mapping and validation of Escherichia coli transcriptional regulation from a compendium of expression profiles. PLoS Biol. 2007;5:e8. doi: 10.1371/journal.pbio.0050008. [DOI] [PMC free article] [PubMed] [Google Scholar]
- Ferkowicz MJ, Starr M, Xie X, Li W, Johnson SA, Shelley WC, Morrison PR, Yoder MC. CD41 expression defines the onset of primitive and definitive hematopoiesis in the murine embryo. Development. 2003;130:4393–4403. doi: 10.1242/dev.00632. [DOI] [PubMed] [Google Scholar]
- Godin I, Cumano A. The hare and the tortoise: an embryonic haematopoietic race. Nat Rev Immunol. 2002;2:593–604. doi: 10.1038/nri857. [DOI] [PubMed] [Google Scholar]
- Goessling W, North TE, Loewer S, Lord AM, Lee S, Stoick-Cooper CL, Weidinger G, Puder M, Daley GQ, Moon RT, et al. Genetic interaction of PGE2 and Wnt signaling regulates developmental specification of stem cells and regeneration. Cell. 2009;136:1136–1147. doi: 10.1016/j.cell.2009.01.015. [DOI] [PMC free article] [PubMed] [Google Scholar]
- Hirose K, Inukai T, Kikuchi J, Furukawa Y, Ikawa T, Kawamoto H, Oram SH, Gottgens B, Kiyokawa N, Miyagawa Y, et al. Aberrant induction of LMO2 by the E2A-HLF chimeric transcription factor and its implication in leukemogenesis of B-precursor ALL with t(17;19) Blood. 2010;116:962–970. doi: 10.1182/blood-2009-09-244673. [DOI] [PubMed] [Google Scholar]
- Hock H, Hamblen MJ, Rooke HM, Schindler JW, Saleque S, Fujiwara Y, Orkin SH. Gfi-1 restricts proliferation and preserves functional integrity of haematopoietic stem cells. Nature. 2004;431:1002–1007. doi: 10.1038/nature02994. [DOI] [PubMed] [Google Scholar]
- Hock H, Orkin SH. Zinc-finger transcription factor Gfi-1: versatile regulator of lymphocytes, neutrophils and hematopoietic stem cells. Curr Opin Hematol. 2006;13:1–6. doi: 10.1097/01.moh.0000190111.85284.8f. [DOI] [PubMed] [Google Scholar]
- Iacovino M, Chong D, Szatmari I, Hartweck L, Rux D, Caprioli A, Cleaver O, Kyba M. HoxA3 is an apical regulator of haemogenic endothelium. Nat Cell Biol. 2011;13:72–78. doi: 10.1038/ncb2137. [DOI] [PMC free article] [PubMed] [Google Scholar]
- Iida S, Seto M, Yamamoto K, Komatsu H, Tojo A, Asano S, Kamada N, Ariyoshi Y, Takahashi T, Ueda R. MLLT3 gene on 9p22 involved in t(9;11) leukemia encodes a serine/proline rich protein homologous to MLLT1 on 19p13. Oncogene. 1993;8:3085–3092. [PubMed] [Google Scholar]
- Izraeli S. Leukaemia -- a developmental perspective. Br J Haematol. 2004;126:3–10. doi: 10.1111/j.1365-2141.2004.04986.x. [DOI] [PubMed] [Google Scholar]
- Jeanson NT, Scadden DT. Vitamin D receptor deletion leads to increased hematopoietic stem and progenitor cells residing in the spleen. Blood. 2010;116:4126–4129. doi: 10.1182/blood-2010-04-280552. [DOI] [PMC free article] [PubMed] [Google Scholar]
- Jin H, Sood R, Xu J, Zhen F, English MA, Liu PP, Wen Z. Definitive hematopoietic stem/progenitor cells manifest distinct differentiation output in the zebrafish VDA and PBI. Development. 2009;136:647–654. doi: 10.1242/dev.029637. [DOI] [PMC free article] [PubMed] [Google Scholar]
- Kandasamy K, Mohan SS, Raju R, Keerthikumar S, Kumar GS, Venugopal AK, Telikicherla D, Navarro JD, Mathivanan S, Pecquet C, et al. NetPath: a public resource of curated signal transduction pathways. Genome Biol. 2010;11:R3. doi: 10.1186/gb-2010-11-1-r3. [DOI] [PMC free article] [PubMed] [Google Scholar]
- Keller G, Kennedy M, Papayannopoulou T, Wiles MV. Hematopoietic commitment during embryonic stem cell differentiation in culture. Mol Cell Biol. 1993;13:473–486. doi: 10.1128/mcb.13.1.473. [DOI] [PMC free article] [PubMed] [Google Scholar]
- Kiel MJ, Yilmaz OH, Iwashita T, Terhorst C, Morrison SJ. SLAM family receptors distinguish hematopoietic stem and progenitor cells and reveal endothelial niches for stem cells. Cell. 2005;121:1109–1121. doi: 10.1016/j.cell.2005.05.026. [DOI] [PubMed] [Google Scholar]
- Kim I, Saunders TL, Morrison SJ. Sox17 dependence distinguishes the transcriptional regulation of fetal from adult hematopoietic stem cells. Cell. 2007;130:470–483. doi: 10.1016/j.cell.2007.06.011. [DOI] [PMC free article] [PubMed] [Google Scholar]
- Kissa K, Herbomel P. Blood stem cells emerge from aortic endothelium by a novel type of cell transition. Nature. 2010;464:112–115. doi: 10.1038/nature08761. [DOI] [PubMed] [Google Scholar]
- Krens SF, Corredor-Adamez M, He S, Snaar-Jagalska BE, Spaink HP. ERK1 and ERK2 MAPK are key regulators of distinct gene sets in zebrafish embryogenesis. BMC Genomics. 2008;9:196. doi: 10.1186/1471-2164-9-196. [DOI] [PMC free article] [PubMed] [Google Scholar]
- Kumaravelu P, Hook L, Morrison AM, Ure J, Zhao S, Zuyev S, Ansell J, Medvinsky A. Quantitative developmental anatomy of definitive haematopoietic stem cells/long-term repopulating units (HSC/RUs): role of the aorta-gonad-mesonephros (AGM) region and the yolk sac in colonisation of the mouse embryonic liver. Development. 2002;129:4891–4899. doi: 10.1242/dev.129.21.4891. [DOI] [PubMed] [Google Scholar]
- Kyba M, Perlingeiro RC, Daley GQ. HoxB4 confers definitive lymphoid-myeloid engraftment potential on embryonic stem cell and yolk sac hematopoietic progenitors. Cell. 2002;109:29–37. doi: 10.1016/s0092-8674(02)00680-3. [DOI] [PubMed] [Google Scholar]
- Lancrin C, Sroczynska P, Stephenson C, Allen T, Kouskoff V, Lacaud G. The haemangioblast generates haematopoietic cells through a haemogenic endothelium stage. Nature. 2009;457:892–895. doi: 10.1038/nature07679. [DOI] [PMC free article] [PubMed] [Google Scholar]
- Lawrence HJ, Helgason CD, Sauvageau G, Fong S, Izon DJ, Humphries RK, Largman C. Mice bearing a targeted interruption of the homeobox gene HOXA9 have defects in myeloid, erythroid, and lymphoid hematopoiesis. Blood. 1997;89:1922–1930. [PubMed] [Google Scholar]
- Leddin M, Perrod C, Hoogenkamp M, Ghani S, Assi S, Heinz S, Wilson NK, Follows G, Schonheit J, Vockentanz L, et al. Two distinct auto-regulatory loops operate at the PU.1 locus in B cells and myeloid cells. Blood. 2011;117:2827–2838. doi: 10.1182/blood-2010-08-302976. [DOI] [PMC free article] [PubMed] [Google Scholar]
- Ledran MH, Krassowska A, Armstrong L, Dimmick I, Renstrom J, Lang R, Yung S, Santibanez-Coref M, Dzierzak E, Stojkovic M, et al. Efficient hematopoietic differentiation of human embryonic stem cells on stromal cells derived from hematopoietic niches. Cell Stem Cell. 2008;3:85–98. doi: 10.1016/j.stem.2008.06.001. [DOI] [PubMed] [Google Scholar]
- Magnusson M, Brun AC, Lawrence HJ, Karlsson S. Hoxa9/hoxb3/hoxb4 compound null mice display severe hematopoietic defects. Exp Hematol. 2007;35:1421–1428. doi: 10.1016/j.exphem.2007.05.011. [DOI] [PubMed] [Google Scholar]
- Margolin AA, Nemenman I, Basso K, Wiggins C, Stolovitzky G, Dalla Favera R, Califano A. ARACNE: an algorithm for the reconstruction of gene regulatory networks in a mammalian cellular context. BMC Bioinformatics. 2006;7(Suppl 1):S7. doi: 10.1186/1471-2105-7-S1-S7. [DOI] [PMC free article] [PubMed] [Google Scholar]
- McKinney-Freeman SL, Daley GQ. Towards hematopoietic reconstitution from embryonic stem cells: a sanguine future. Curr Opin Hematol. 2007;14:343–347. doi: 10.1097/MOH.0b013e3281900edd. [DOI] [PubMed] [Google Scholar]
- McKinney-Freeman SL, Lengerke C, Jang IH, Schmitt S, Wang Y, Philitas M, Shea J, Daley GQ. Modulation of murine embryonic stem cell-derived CD41+c-kit+ hematopoietic progenitors by ectopic expression of Cdx genes. Blood. 2008;111:4944–4953. doi: 10.1182/blood-2007-11-124644. [DOI] [PMC free article] [PubMed] [Google Scholar]
- McKinney-Freeman SL, Naveiras O, Yates F, Loewer S, Philitas M, Curran M, Park PJ, Daley GQ. Surface antigen phenotypes of hematopoietic stem cells from embryos and murine embryonic stem cells. Blood. 2009;114:268–278. doi: 10.1182/blood-2008-12-193888. [DOI] [PMC free article] [PubMed] [Google Scholar]
- Medvinsky A, Rybtsov S, Taoudi S. Embryonic origin of the adult hematopoietic system: advances and questions. Development. 2011;138:1017–1031. doi: 10.1242/dev.040998. [DOI] [PubMed] [Google Scholar]
- Medvinsky AL, Gan OI, Semenova ML, Samoylina NL. Development of day-8 colony-forming unit-spleen hematopoietic progenitors during early murine embryogenesis: spatial and temporal mapping. Blood. 1996;87:557–566. [PubMed] [Google Scholar]
- Michoel T, De Smet R, Joshi A, Van de Peer Y, Marchal K. Comparative analysis of module-based versus direct methods for reverse-engineering transcriptional regulatory networks. BMC Syst Biol. 2009;3:49. doi: 10.1186/1752-0509-3-49. [DOI] [PMC free article] [PubMed] [Google Scholar]
- Mikkola HK, Fujiwara Y, Schlaeger TM, Traver D, Orkin SH. Expression of CD41 marks the initiation of definitive hematopoiesis in the mouse embryo. Blood. 2003;101:508–516. doi: 10.1182/blood-2002-06-1699. [DOI] [PubMed] [Google Scholar]
- Mikkola HK, Gekas C, Orkin SH, Dieterlen-Lievre F. Placenta as a site for hematopoietic stem cell development. Exp Hematol. 2005;33:1048–1054. doi: 10.1016/j.exphem.2005.06.011. [DOI] [PubMed] [Google Scholar]
- Novershtern N, Subramanian A, Lawton LN, Mak RH, Haining WN, McConkey ME, Habib N, Yosef N, Chang CY, Shay T, et al. Densely interconnected transcriptional circuits control cell states in human hematopoiesis. Cell. 2011;144:296–309. doi: 10.1016/j.cell.2011.01.004. [DOI] [PMC free article] [PubMed] [Google Scholar]
- Okada S, Fukuda T, Inada K, Tokuhisa T. Prolonged expression of c-fos suppresses cell cycle entry of dormant hematopoietic stem cells. Blood. 1999;93:816–825. [PubMed] [Google Scholar]
- Park IK, Qian D, Kiel M, Becker MW, Pihalja M, Weissman IL, Morrison SJ, Clarke MF. Bmi-1 is required for maintenance of adult self-renewing haematopoietic stem cells. Nature. 2003;423:302–305. doi: 10.1038/nature01587. [DOI] [PubMed] [Google Scholar]
- Pina C, May G, Soneji S, Hong D, Enver T. MLLT3 regulates early human erythroid and megakaryocytic cell fate. Cell Stem Cell. 2008;2:264–273. doi: 10.1016/j.stem.2008.01.013. [DOI] [PubMed] [Google Scholar]
- Randrianarison-Huetz V, Laurent B, Bardet V, Blobe GC, Huetz F, Dumenil D. Gfi-1B controls human erythroid and megakaryocytic differentiation by regulating TGF-beta signaling at the bipotent erythro-megakaryocytic progenitor stage. Blood. 2010;115:2784–2795. doi: 10.1182/blood-2009-09-241752. [DOI] [PubMed] [Google Scholar]
- Rhodes KE, Gekas C, Wang Y, Lux CT, Francis CS, Chan DN, Conway S, Orkin SH, Yoder MC, Mikkola HK. The emergence of hematopoietic stem cells is initiated in the placental vasculature in the absence of circulation. Cell Stem Cell. 2008;2:252–263. doi: 10.1016/j.stem.2008.01.001. [DOI] [PMC free article] [PubMed] [Google Scholar]
- Robin C, Ottersbach K, Durand C, Peeters M, Vanes L, Tybulewicz V, Dzierzak E. An unexpected role for IL-3 in the embryonic development of hematopoietic stem cells. Dev Cell. 2006;11:171–180. doi: 10.1016/j.devcel.2006.07.002. [DOI] [PubMed] [Google Scholar]
- Sankaran VG, Menne TF, Xu J, Akie TE, Lettre G, Van Handel B, Mikkola HK, Hirschhorn JN, Cantor AB, Orkin SH. Human fetal hemoglobin expression is regulated by the developmental stage-specific repressor BCL11A. Science. 2008;322:1839–1842. doi: 10.1126/science.1165409. [DOI] [PubMed] [Google Scholar]
- Segal E, Shapira M, Regev A, Pe’er D, Botstein D, Koller D, Friedman N. Module networks: identifying regulatory modules and their condition-specific regulators from gene expression data. Nat Genet. 2003;34:166–176. doi: 10.1038/ng1165. [DOI] [PubMed] [Google Scholar]
- Seita J, Weissman IL. Hematopoietic stem cell: self-renewal versus differentiation. Wiley Interdiscip Rev Syst Biol Med. 2010;2:640–653. doi: 10.1002/wsbm.86. [DOI] [PMC free article] [PubMed] [Google Scholar]
- Srinivasan R, Zabuawala T, Huang H, Zhang J, Gulati P, Fernandez S, Karlo JC, Landreth GE, Leone G, Ostrowski MC. Erk1 and Erk2 regulate endothelial cell proliferation and migration during mouse embryonic angiogenesis. PLoS One. 2009;4:e8283. doi: 10.1371/journal.pone.0008283. [DOI] [PMC free article] [PubMed] [Google Scholar]
- Szabo E, Rampalli S, Risueno RM, Schnerch A, Mitchell R, Fiebig-Comyn A, Levadoux-Martin M, Bhatia M. Direct conversion of human fibroblasts to multilineage blood progenitors. Nature. 2010;468:521–526. doi: 10.1038/nature09591. [DOI] [PubMed] [Google Scholar]
- Tabayoyong WB, Salas JG, Bonde S, Zavazava N. HOXB4-transduced embryonic stem cell-derived Lin-c-kit+ and Lin-Sca-1+ hematopoietic progenitors express H60 and are targeted by NK cells. J Immunol. 2009;183:5449–5457. doi: 10.4049/jimmunol.0901807. [DOI] [PubMed] [Google Scholar]
- Takakura N, Huang XL, Naruse T, Hamaguchi I, Dumont DJ, Yancopoulos GD, Suda T. Critical role of the TIE2 endothelial cell receptor in the development of definitive hematopoiesis. Immunity. 1998;9:677–686. doi: 10.1016/s1074-7613(00)80665-2. [DOI] [PubMed] [Google Scholar]
- Taoudi S, Bee T, Hilton A, Knezevic K, Scott J, Willson TA, Collin C, Thomas T, Voss AK, Kile BT, et al. ERG dependence distinguishes developmental control of hematopoietic stem cell maintenance from hematopoietic specification. Genes Dev. 2011;25:251–262. doi: 10.1101/gad.2009211. [DOI] [PMC free article] [PubMed] [Google Scholar]
- Taoudi S, Gonneau C, Moore K, Sheridan JM, Blackburn CC, Taylor E, Medvinsky A. Extensive hematopoietic stem cell generation in the AGM region via maturation of VE-cadherin+CD45+ pre-definitive HSCs. Cell Stem Cell. 2008;3:99–108. doi: 10.1016/j.stem.2008.06.004. [DOI] [PubMed] [Google Scholar]
- Taoudi S, Morrison AM, Inoue H, Gribi R, Ure J, Medvinsky A. Progressive divergence of definitive haematopoietic stem cells from the endothelial compartment does not depend on contact with the foetal liver. Development. 2005;132:4179–4191. doi: 10.1242/dev.01974. [DOI] [PubMed] [Google Scholar]
- Taylor RC, Acquaah-Mensah G, Singhal M, Malhotra D, Biswal S. Network inference algorithms elucidate Nrf2 regulation of mouse lung oxidative stress. PLoS Comput Biol. 2008;4:e1000166. doi: 10.1371/journal.pcbi.1000166. [DOI] [PMC free article] [PubMed] [Google Scholar]
- Wang L, Menendez P, Shojaei F, Li L, Mazurier F, Dick JE, Cerdan C, Levac K, Bhatia M. Generation of hematopoietic repopulating cells from human embryonic stem cells independent of ectopic HOXB4 expression. J Exp Med. 2005a;201:1603–1614. doi: 10.1084/jem.20041888. [DOI] [PMC free article] [PubMed] [Google Scholar]
- Wang Y, Yates F, Naveiras O, Ernst P, Daley GQ. Embryonic stem cell-derived hematopoietic stem cells. Proc Natl Acad Sci U S A. 2005b;102:19081–19086. doi: 10.1073/pnas.0506127102. [DOI] [PMC free article] [PubMed] [Google Scholar]
- Wilson A, Laurenti E, Trumpp A. Balancing dormant and self-renewing hematopoietic stem cells. Curr Opin Genet Dev. 2009;19:461–468. doi: 10.1016/j.gde.2009.08.005. [DOI] [PubMed] [Google Scholar]
- Zhang B, Horvath S. A general framework for weighted gene co-expression network analysis. Stat Appl Genet Mol Biol. 2005;4 doi: 10.2202/1544-6115.1128. Article17. [DOI] [PubMed] [Google Scholar]
Associated Data
This section collects any data citations, data availability statements, or supplementary materials included in this article.