

Abstract
Estrogen receptor (ER) is a crucial molecule symbol of breast cancer. Molecular interactions between ER complexes and DNA regulate the expression of genes responsible for cancer cell phenotypes. However, the positions and mechanisms of the ER binding with downstream gene targets are far from being fully understood. ChIP-Seq is an important assay for the genome-wide study of protein-DNA interactions. In this paper, we explored the genome-wide chromatin localization of ER-DNA binding regions by analyzing ChIP-Seq data from MCF-7 breast cancer cell line. By integrating three peak detection algorithms and two datasets, we localized 933 ER binding sites, 92% among which were located far away from promoters, suggesting long-range control by ER. Moreover, 489 genes in the vicinity of ER binding sites were identified as estrogen response elements by comparison with expression data. In addition, 836 single nucleotide polymorphisms (SNPs) in or near 157 ER-regulated genes were found in the vicinity of ER binding sites. Furthermore, we annotated the function of the nearest-neighbor genes of these binding sites using Gene Ontology (GO), KEGG, and GeneGo pathway databases. The results revealed novel ER-regulated genes pathways for further experimental validation. ER was found to affect every developed stage of breast cancer by regulating genes related to the development, progression, and metastasis. This study provides a deeper understanding of the regulatory mechanisms of ER and its associated genes.
1. Introduction
Breast cancer is a complex disease with high occurrence. It involves a wide range of pathological entities with diverse clinical courses. Gene and protein expression have been extensively profiled in different subtypes of breast cancer [1]. Growth of human breast cells is closely regulated by hormone receptors. Estrogen receptor (ER), a hormonal transcription factor, plays a critical role in the development of breast cancer. Combined with estrogen, it regulates the expression of multiple genes. Studies have found that ER-positive and ER-negative breast cancers are fundamentally different [2]. The outcome of hormone receptor positive tumors is better than hormone receptor negative tumors [3]. Thus, the identification of ER target genes may reveal critical biomarkers for cancer aggressiveness and is therefore crucial to understanding the global molecular mechanisms of ER in breast cancer. To identify direct target genes of ER, it is necessary to map the ER binding sites across the genome. ChIP-Seq is an effective technology for the genome-wide localization of histone modification and transcription factor binding sites. It enables researchers to fully understand many biological processes and disease states, including transcriptional regulation of ES cells, tissue samples, and cancer cells.
Several previous studies have been dedicated to ER-regulated genes and their function in breast cancer cell line [4, 5]. However, most studies lacked the comprehensive and genome-wide view and failed to perform an integrated analysis. In this study, we combined ChIP-Seq and microarray datasets to analyze the ER-regulated genes in the MCF-7 breast cancer cell line. The molecular mechanisms of ER were fully studied, including binding sites, motif, regulated genes, related single nucleotide polymorphisms (SNPs) and functional annotation. The process of this analysis was illustrated in Figure 1.
Figure 1.
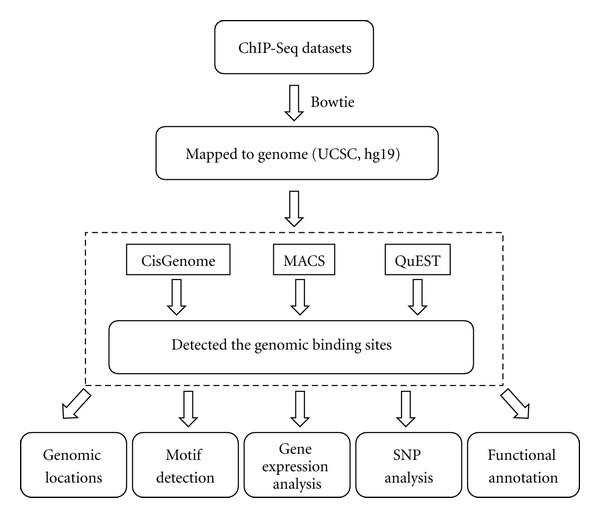
The ChIP-Seq data analyzing pipeline.
2. Materials and Methods
2.1. Datasets
The breast cancer associated ChIP-Seq datasets were extracted from Gene Expression Omnibus (GEO): GSE19013 [6] and GSE14664 [7]. Both datasets can be used to survey genome-wide binding of estrogen receptor (ER) in the MCF-7 breast cancer cell line. Control sample was incorporated for the genomic peak finding of ER. (See Table 1 for details.)
Table 1.
The CHIP-Seq datasets.
2.2. Chip-Seq Analysis
Bowtie [8] was selected to align sequence tags to human genome. Bowtie is an ultrafast and best short-read aligner. It is suitable for sets of short reads where many reads have at least one good and valid alignment, many reads with relatively high quality, and the number of alignment reported per read is small (closed to 1). ChIP-seq datasets we used were satisfied these criteria. In the analysis, tags were selected using the criterion that alignments had no more than 2 mismatches in the first 35 bases on the high quality end of the read, and the sum of the quality values at all mismatched positions could not exceed 70.
Peak detection algorithm is crucial to the analysis of ChIP-Seq dataset. Currently, several tools are available to identify genome-wide binding sites of transcription factors, such as FindPeaks [9], F-Seq [10], CisGenome [11], MACS [12], SISSRs [13], and QuEST [14]. These different methods have their own advantages and disadvantages, although they act in a similar manner. Table 2 showed an overview of the characteristics of these algorithms. ChIP-Seq data has regional biases because of sequencing and mapping biases, chromatin structure, and genome copy number variations [15]. It is believed that more robust ChIP-Seq peak predictions can be obtained by matching control samples [12]. In order to get more stable result, three tools, CisGenome, MACS, and QuEST, were used to identify the binding sites of ER in this study. All the three tools systematically used control samples to guide peak finding and calculate the FDR (False Discovery Rate) value of peaks.
Table 2.
An overview of the characteristics of different Chip-Seq peak detection algorithm.
| Algorithm | Profile | Background model | Control sample | Use control to compute FDR |
|---|---|---|---|---|
| F-Seq | Kernel density estimation (KDE) | √ | ||
| FindPeaks | Aggregation of overlapped tags | Monte Carlo | ||
| SISSRs | Window scan | Poisson | √ | |
| QuEST | Kernel density estimation (KDE) | √ | √ | |
| MACS | Tags shifted then window scan | dynamic Poisson | √ | √ |
| CisGenome | Strand-specific window scan | Negative binomial | √ | √ |
Additionally, MEME program [16] was employed for de novo motif search, keeping default options (minimum width: 6, maximum width: 50, motifs to find: 3, and minimum sites: ≥2). For each site, statistical significance (P value) gives the probability of a random string having the same match score or higher. And a criterion of P-value < 0.01 was used here.
2.3. Expression and SNP Analysis
Expression analysis was performed using the same package [17, 18]. Differentially expressed genes were selected based on the q-value less than 1%.
Using the table SNP (131) (dbSNP build 131) [19] in UCSC (http://genome.ucsc.edu/), we identified SNPs near the ER binding sites. The SNPs with at least one mapping in the regions were selected.
2.4. Functional Annotation
Three functional annotation systems, the Gene Ontology (GO) categories [20], canonical KEGG Pathway Maps [21], and commercial software MetaCore-GeneGo Pathway Maps, were used to perform the enrichment analysis for gene function.
Enrichment of GO categories was determined with the Gene Ontology Tree Machine (GOTM) [22], using Hypergeometric test, Multiple test adjustment (BH), and a P-value cut-off of 0.01. WebGestalt (WEB-based GEne SeT AnaLysis Toolkit) [23] (http://bioinfo.vanderbilt.edu/webgestalt/option.php) was used for enrichment of KEGG Pathway. Hypergeometric test, Multiple test adjustment (BH), and a P-value cut-off of 0.01 were also used as criterion. MetaCore-GeneGo is a commercial software which offers gene expression pathway analysis and bioinformatics solutions for systems biology research and development. Hypergeometric intersection was used to estimate P-value, the lower P-value means higher relevance. P-value < 0.01 and FDR < 0.05 were used as criterion.
3. Results and Discussion
3.1. ChIP-Seq Analysis Mapped ER Binding Sites across the Human Genome
Using ChIP-Seq datasets, we identified the global ER binding sites. Sequence tags were firstly aligned to human genome assembly (UCSC, hg19) using Bowtie. Three ChIP-Seq peak calling programs, CisGenome, MACS, and QuEST, were selected to identify the enriched binding peaks. Using a false discovery rate of 0.01, 933 ER binding peaks were revealed by all the three tools in both datasets (Table 3). There were differences among the predicted results using different methods in both two datasets (Figure 2). The calculated FDR value was not only related to different methods, but also influenced by datasets. The overlapped binding sites seemed to be more robust, with 84.9% having FDR value less than 0.005 in all methods and datasets. These binding sites were used for the following analysis. Firstly, we compared these binding sites with two published studies by Welboren et al. [7] and Hu et al. [6]. Our results showed a substantial overlap with the two studies (77.8 and 78.5%, resp.). Also, 719 binding sites, which were shared by all three studies, were likely to be more reliable. The presence of consensus sequence motifs in the ER binding sites was also examined. De novo motif search using the MEME program [16] identified a refined ERE motif that was markedly similar to the canonical ERE (Figure 3(a)). Almost all of the ER binding sites contained one or more ERE motif (P-value < 0.01) (Figure 3(b)). Both published and newly identified binding sites contained at least one ERE motif (Figure 3(c)).
Table 3.
Number of ER binding sites identified by three ChIP-Seq peak calling programs (FDR < 0.01).
Figure 2.
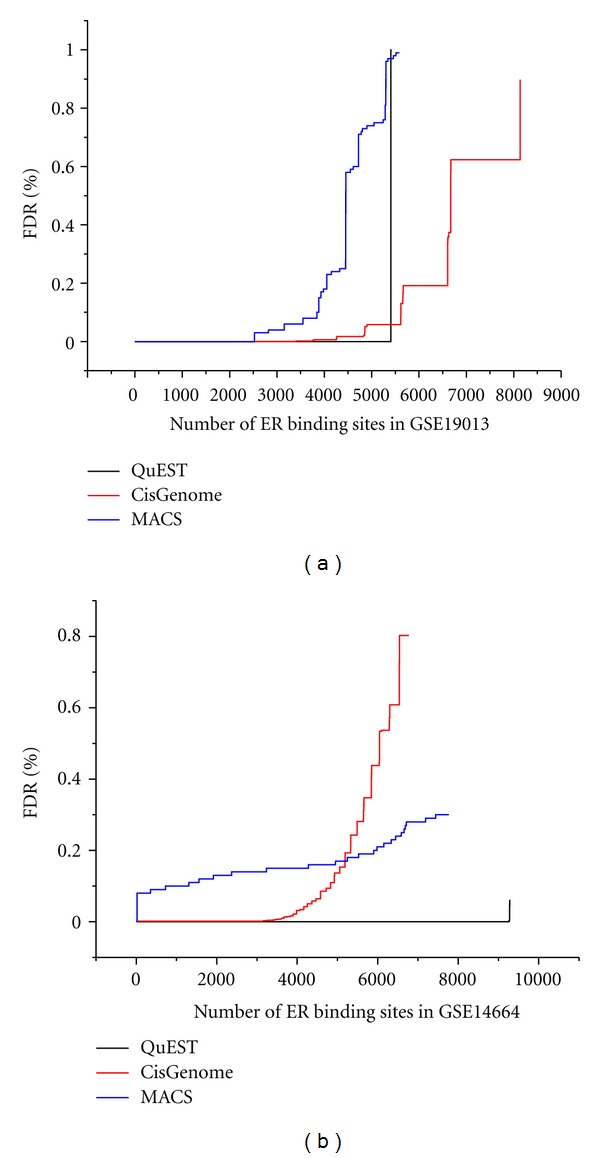
Comparison of QuEST, CisGenome, and MACS predicted result. (a) The FDR value in the dataset of GSE19013. (b) The FDR value in the dataset of GSE14664.
Figure 3.
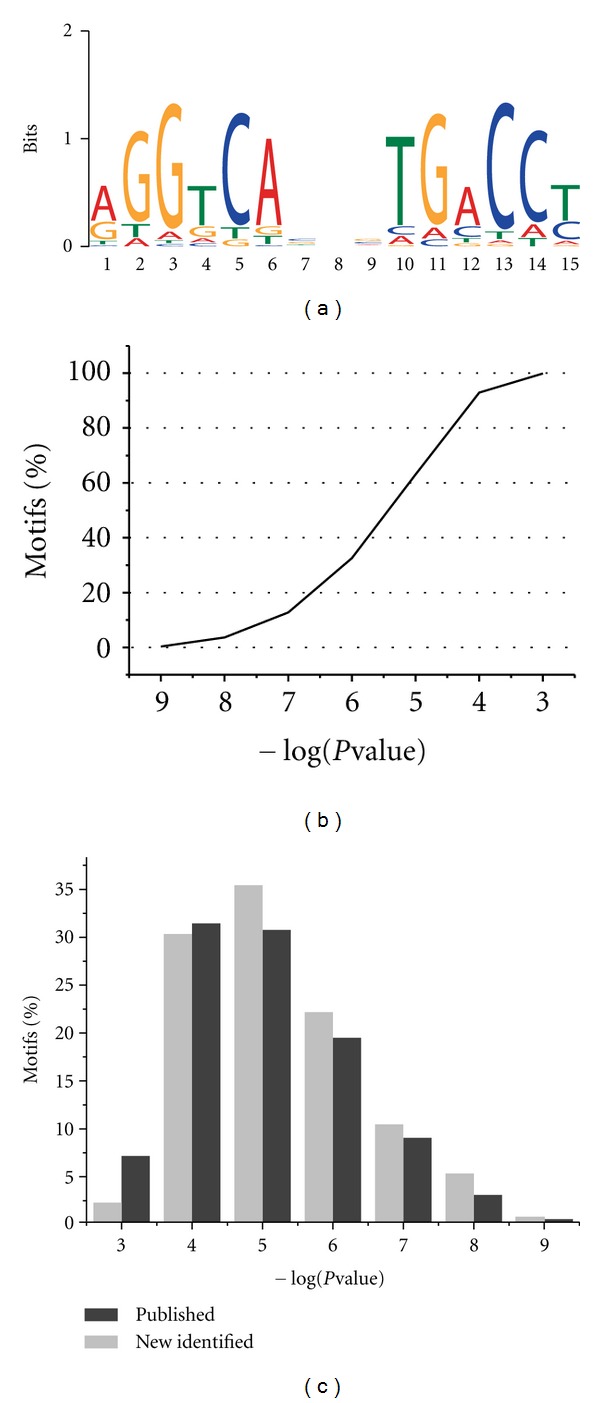
The genomic binding sites of ER. (a) The consensus motif identified in the ERE binding sites. De novo motif search was performed using the MEME program. (b) The percentage of occurrences of ERE motifs in ER binding sites. (c) Comparison of the occurrences of ERE motifs between published and newly identified binding sites.
Furthermore, we examined the location of ER enrichment sites relativer to the nearest-neighbor genes. The result was shown in Figure 4(a). Only 8% (72) of the peaks occured within gene promoters (defined here as within 5 kb upstream of 5′ to TSS). Also, 34% (317) of the peaks resided in intragenic sites, including 1% (10) in the 3′UTR, 9% (81) in the 5′UTR, 2% (20) in the exon, and 22% (206) in the intron. The occupancy of enhancer (>5 kb away 5′ to TSS) was 35% (332). According to Figure 4(b), the peaks occurred most frequently between −10 kb to −100 kb, +10 kb to +100 kb, with +10 kb to +100 kb being the highest. A further insight into the peaks within +10 kb to +100 kb showed that peaks were preferably located within the regions spanning from +10 kb to +40 kb (Figure 4(c)).
Figure 4.
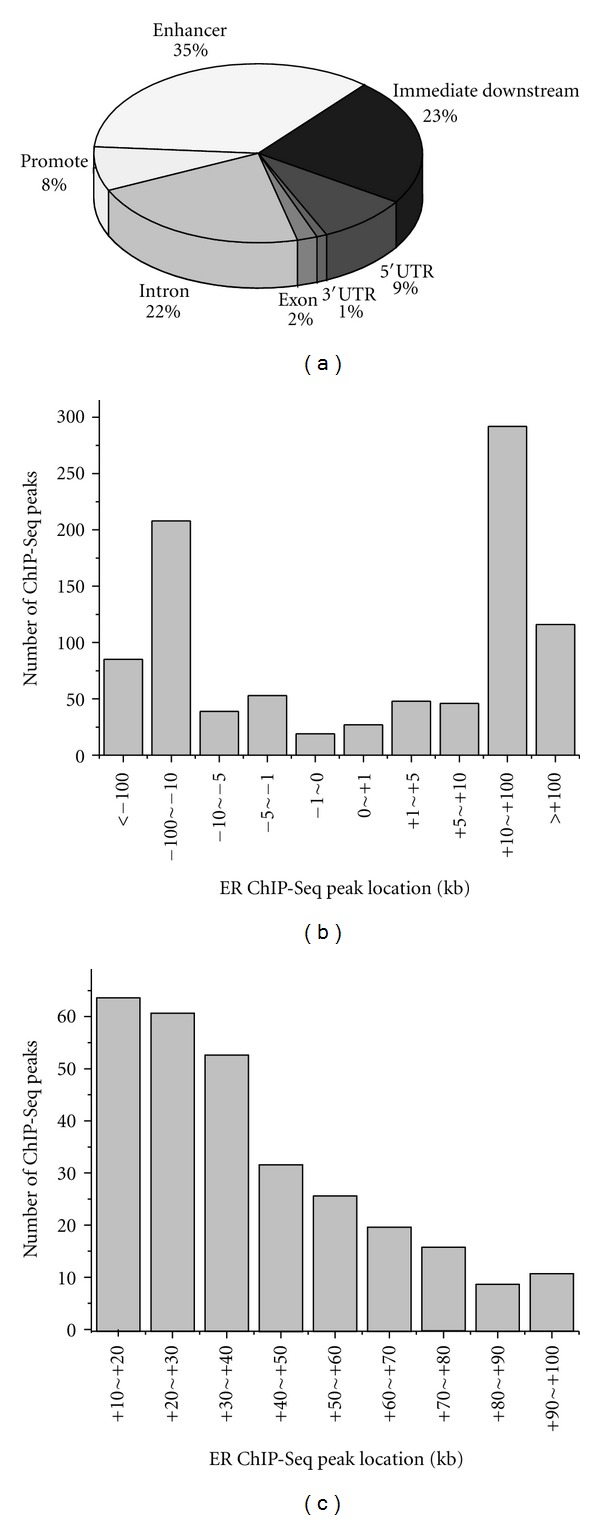
Location analysis of ER binding sites. (a) locations relative to nearest-neighbor genes. (b) Genomic Locations of ER ChIP-Seq peaks. (c) Genomic locations of ER ChIP-Seq peaks within +10~+100 kb.
3.2. Using Gene Expression Data to Confirm the ER Binding Sites
In order to determine the specific gene responses corresponding to ER in MCF-7 cells, we compared the nearest-neighbor genes of ER binding sites to the published studies examining differentially expressed genes between ER+ and ER− breast tumors. We used the 3 studies in Table 4 for the gene expression analysis. Differentially expressed genes were selected based on a q-value cut-off of less than 1% using a stringent statistical analysis method. We identified 5692 and 6101 up- and downregulated genes. When combined with the nearest-neighbor genes of ER binding sites, 289 up-regulated genes and 198 down-regulated genes were associated with the ER binding sites (see additional file 1, Supplementary Material available online at doi:10.1155/2012/568950). Among these genes, 33 upregulated genes and 11 downregulated genes were also identified by published ChIP-PET analysis [27].
Table 4.
Breast cancer gene expression dataset and differently expressed genes number (q-value < 1%).
Our analysis found that more binding sites were associated with ER up-regulated genes (60%) compared to down-regulated genes (40%), indicating that ER was more frequently involved in the direct regulation of up-regulated genes. We also examined the location of ER binding sites in up-regulated and down-regulated genes. As shown in Figure 5, both the up- and down-regulated genes occurred most frequently between −10 kb to −100 kb, +10 kb to +100 kb, which verified the long-range control mode of ER factor.
Figure 5.
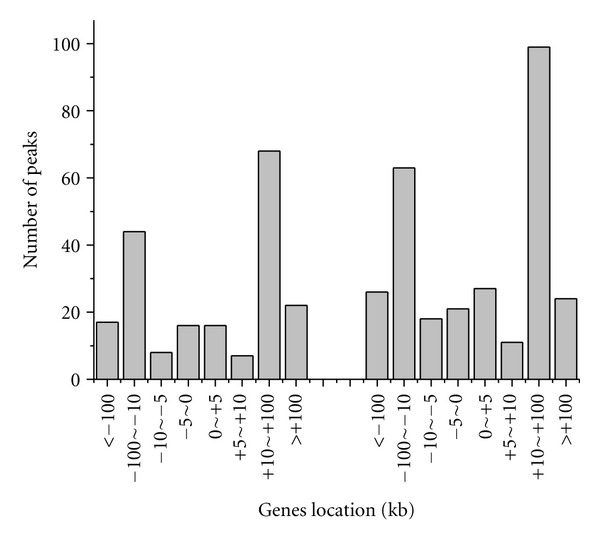
Genomic Locations of differentially expressed genes in the vicinity of ER binding sites.
3.3. SNPs Occurred near the ER Binding Sites
Current studies have shown that the breast cancer risks are associated with commonly occurring single nucleotide polymorphisms (SNPs) [28–32]. The table SNP (131) (dbSNP build 131) in UCSC (http://genome.ucsc.edu/) was used to identify SNPs near the ER binding sites. A total of 2694 SNP loci were found and subsequently annotated using dbSNP in NCBI.
Compared with the differently expressed gene set in the vicinity of ER binding sites, 836 SNPs in or near 157 ER-regulated genes were identified (see additional file 2). Most of the SNPs (94.5%) were located in intron and untranslated regions. Only 5.5% were located in the regions of near-gene, coding-synon, missense, and frameshift. These SNPs might have close relationship with breast cancer.
3.4. Functional Annotation of ER Binding Sites
To identify the biological processes and pathways altered by ER, we employed three functional annotation systems, the Gene Ontology (GO) categories [20], canonical KEGG Pathway Maps [21], and commercial software MetaCore-GeneGo Pathway Maps, to perform the enrichment analysis for gene function.
To gain an overview of the biological processes in which the nearest-neighbor genes of ER binding sites reside, we firstly performed gene set enrichment analysis using Gene Ontology database. Statistically significant (Hypergeometric test, P-value < 0.01) enriched GO terms were identified using the web tool GOTM (Gene Ontology Tree Machine) [22]. The Gene Ontology Directed Acyclic Graph for the nearest-neighbor genes generated by GOTM was presented in Figure 6. The terms with red color were significantly enriched. In terms of biological process, negative regulation of biological process and cellular process, cellular component movement, and regulation of localization and locomotion, structure and system development were significantly enriched. Furthermore, whether differently expressed or not, genes were mostly associated with biological regulation and metabolic process in biological process terms, protein binding in molecular function terms, and membrane in cellular component terms (each term included more than 100 genes). Gene functions for all the nearest-neighbor genes were summarized in Table 5.
Figure 6.
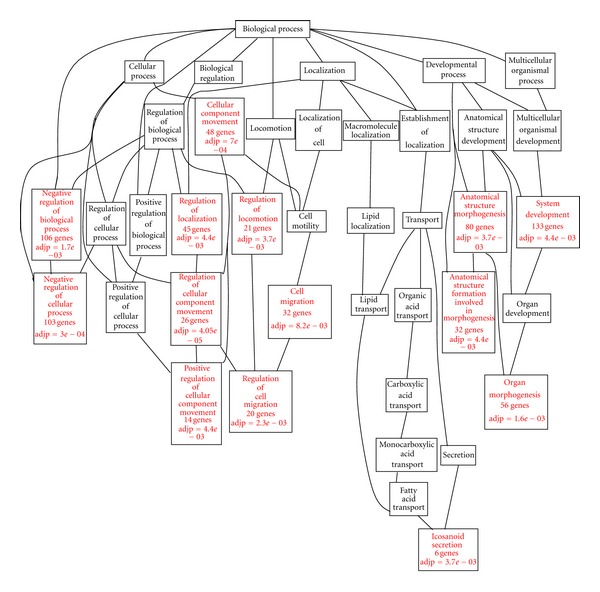
Directed Acyclic Graphs (DAGs) of significantly enriched GO (Gene Ontology) categories (P < 0.01).
Table 5.
The comparison of top enriched GO categories between different expressed and other nearest-neighbor genes of ER binding sites (number of genes ≥ 100).
| Genes set | Biological process | Molecular function | Cellular component |
|---|---|---|---|
| Differently expressed | Biological regulation, metabolic process, cell communication, organismal process, localization, developmental process |
Protein binding, iron binding |
Membrane, nucleus |
| Others | Biological regulation, metabolic process | Protein binding | Membrane |
The KEGG Pathway database (posted on May 23, 2011) was used to identify functional modules regulated by ER. Seventeen significantly enriched pathways (P-value < 0.01) were revealed (Table 6). In these pathways, most genes were also differentially expressed between ER+ and ER− tumors. Pathways in cancer, focal adhesion, axon guidance, regulation of actin cytoskeleton, and MAPK signaling pathway ranked among the most enriched pathways. The top enriched maps, such as focal adhesion pathway and MAPK signaling pathway, were reported to be related with ER in breast cancer. High expression of focal adhesion kinase had been reported to be related to cancer progression of breast. And tumors with high expression of focal adhesion kinase lack ER and PR [33]. It was also reported that hyperactivation of MAPK could repress the ER expression in breast tumors [34]. Pathways in cancer were the top enriched KEGG pathway. The abnormal expression of some genes occurred in several types of cancer [35–37]. Axon guidance pathway played important roles in cancers. Axon guidance molecules might control the development, migration, and invasion of cancer cells [38]. Regulation of actin cytoskeleton was related to cancer cell migration and invasion [39]. This indicated the crucial role of ER in the development, migration, and invasion of breast cancer.
Table 6.
KEGG pathways enriched with the nearest-neighbor genes of ER binding sites (P-value < 0.01).
| KEGG ID | Pathways name | P-value | Number of genes | Number of different expressed genes |
|---|---|---|---|---|
| hsa05200 | Pathways in cancer | 2.24E − 05 | 22 | 16 |
| hsa04510 | Focal adhesion | 0.0002 | 15 | 14 |
| hsa04360 | Axon guidance | 0.0009 | 11 | 8 |
| hsa04810 | Regulation of actin cytoskeleton | 0.0012 | 14 | 11 |
| hsa04010 | MAPK signaling pathway | 0.0022 | 15 | 12 |
| hsa04114 | Oocyte meiosis | 0.0024 | 9 | 8 |
| hsa04144 | Endocytosis | 0.0024 | 12 | 11 |
| hsa04115 | p53 signaling pathway | 0.0024 | 7 | 7 |
| hsa05216 | Thyroid cancer | 0.0024 | 5 | 4 |
| hsa05218 | Melanoma | 0.0033 | 7 | 3 |
| hsa04020 | Calcium signaling pathway | 0.004 | 11 | 4 |
| hsa04062 | Chemokine signaling pathway | 0.0064 | 11 | 9 |
| hsa04914 | Progesterone-mediated oocyte maturation | 0.0085 | 7 | 7 |
| hsa01100 | Metabolic pathways | 0.0086 | 35 | 28 |
| hsa00450 | Selenoamino acid metabolism | 0.0088 | 4 | 3 |
| hsa05414 | Dilated cardiomyopathy | 0.0096 | 7 | 7 |
| hsa03440 | Homologous recombination | 0.0097 | 4 | 3 |
GeneGo was also used to perform the pathway analysis. Ten pathways were found to be significantly enriched with P-value < 0.01 and FDR < 0.05 (Table 7). The result showed that ER binding sites were enriched in breast cancer related pathways. Among the top five maps, development_prolactin receptor signaling and development_glucocorticoid receptor signaling had been reported to associate with ER [40, 41]. development_ligand-independent activation of ESR1 and ESR2 was another enriched map which might have close relationship with ER. APRIL and BAFF were the members of tumor necrosis factor family which related to a plethora of cellular events from proliferation and differentiation to apoptosis and tumor reduction [42]. IL-22 might play a role in the control of tumor growth and progression in breast [43]. However, the relationship between ER and these two pathways need further experimental study.
Table 7.
Terms of the enriched GeneGo pathway maps (P-value < 0.01, FDR < 0.05).
| GeneGo pathway terms | P-value |
|---|---|
| Apoptosis and survival_APRIL and BAFF signaling | 1.29889E − 05 |
| Development_prolactin receptor signaling | 4.95517E − 05 |
| Development_glucocorticoid receptor signaling | 5.81237E − 05 |
| Development_ligand-independent activation of ESR1 and ESR2 | 0.000295251 |
| Immune response_IL-22 signaling pathway | 0.000381484 |
| Development_EPO-induced Jak-STAT pathway | 0.000531744 |
| Development_growth hormone signaling via STATs and PLC/IP3 | 0.000531744 |
| Cytoskeleton remodeling_keratin filaments | 0.000622315 |
| Development_GM-CSF signaling | 0.000660576 |
| Transcription_transcription regulation of aminoacid metabolism | 0.000752764 |
4. Conclusions
ER is an important molecular symbol of breast cancer. A full understanding of the molecular mechanisms of ER will be useful for the research in the prediction and treatment of breast cancer. The ChIP-Seq technology is useful to study the interaction of protein and DNA on a genome-wide scale. ChIP-Seq data can effectively analyze the regulatory mechanism of transcription factor in genome-wide scale. In this study, we used ChIP-Seq data to identify the global sites regulated by ER in MCF-7 breast cancer cell line. In order to get more reliable result, three different tools were used to analyze two datasets. And 933 binding sites were identified, and the ERE motif was refined here.
The analysis of the global genomic occupancy of ER-regulated genes revealed that 92% of the total 933 ER-binding sites were located far away from promoters. This suggested that the canonical mode of ER factor function involved long-range control. Previous research had reported that ER-α includes looping [44]. Using ChIP-PET, Lin et al. [27] had analyzed the genome-wide ER-α chromatin occupancy and revealed abundant nonpromoter sites. Our findings provided further support for this mode of ER factor function.
We compared the ER binding sites found in this study with published differentially expressed genes between ER+ and ER− breast tumors. A set of 487 genes was found significant in discriminating ER status in breast tumors. This indicated that these genes appeared to affect ER response. Only 9% (44) of the genes have been identified by Lin et al. [27], while the remaining need further validations. We found that binding sites were preferentially associated with ER up-regulated genes, indicating that ER was more frequently involved in the regulation of upregulated genes. The location of 487 genes verified the long-range control mode of ER factor.
In this study, we found 2694 single nucleotide polymorphisms loci located in or near the ER binding sites. Among these SNPs, the 157 genes of 836 SNPs were also differentially expressed between ER+ and ER− breast tumors. It indicated that this set of SNPs might have close relationship with ER in breast.
The functional annotation provided a deeper understanding of ER and ER-associated genes. Enrichment analysis of GO gave an overview of gene function. As shown in Figure 6, significantly enriched terms belonged to three classes, biological regulation, cellular processes, and developmental processes. The result of KEGG enrichment analysis was similar. Five pathways were involved in cellular processes, including focal adhesion, regulation of actin cytoskeleton, oocyte meiosis, endocytosis, and p53 signaling pathway. These pathways were associated with cell communication, movement, growth, and death. Most enriched terms determined by GeneGO were development pathways. It was suggested that ER-regulated genes participated in various development processes. Moreover, KEGG pathway analysis suggested that ER-regulated genes were enriched in some diseases related pathways. Both KEGG and GeneGO pathway analysis revealed that some immune-related pathways were enriched, such as chemokine signaling pathway and immune response_IL-22 signaling pathway. These results indicated that ER-regulated genes related to the development, progression, and metastasis of breast. ER affected every developed stage of breast. However, the regulatory mechanisms of ER in different stages and different pathways still need further studies.
Supplementary Material
Additional file 1 shows the differentially expressed genes in the vicinity of ER binding sites. Using 3 gene expression studies and a criterion of q-value <0.01, we identified 5692 and 6101 up- and down-regulated down-regulated genes between ER+ and ER- breast tumors. Among these genes, 289 up-regulated and 198 down-regulated genes located near the ER binding sites. The details of these 489 estrogen response elements were listed here. Additional file 2 shows the SNPs occurred in the ER-regulated genes located near the binding sites. These SNPs were identified by using the table SNP (131) (dbSNP build 131) in UCSC (http://genome.ucsc.edu/). Totally, 836 SNPs in or near 157 ER-regulated genes were identified.
Conflict of Interests
The authors declare that they have no conflict of interests.
Acknowledgments
This work was supported by the National Natural Science Foundation of China Grants (no. 91230117 and 31170795), the Specialized Research Fund for the Doctoral Program of Higher Education of China (20113201110015), International S&T Cooperation Program of Suzhou (SH201120), and the National High Technology Research and Development Program of China (863 program, Grant no. 2012AA02A601).
References
- 1.van de Vijver MJ, He YD, van’T Veer LJ, et al. A gene-expression signature as a predictor of survival in breast cancer. The New England Journal of Medicine. 2002;347(25):1999–2009. doi: 10.1056/NEJMoa021967. [DOI] [PubMed] [Google Scholar]
- 2.Lopez-Garcia MA, Geyer FC, Lacroix-Triki M, Marchió C, Reis-Filho JS. Breast cancer precursors revisited: molecular features and progression pathways. Histopathology. 2010;57(2):171–192. doi: 10.1111/j.1365-2559.2010.03568.x. [DOI] [PubMed] [Google Scholar]
- 3.Anderson WF, Chatterjee N, Ershler WB, Brawley OW. Estrogen receptor breast cancer phenotypes in the surveillance, epidemiology, and end results database. Breast Cancer Research and Treatment. 2002;76(1):27–36. doi: 10.1023/a:1020299707510. [DOI] [PubMed] [Google Scholar]
- 4.Mandal S, Davie JR. An integrated analysis of genes and pathways exhibiting metabolic differences between estrogen receptor positive breast cancer cells. BMC Cancer. 2007;7, article 181 doi: 10.1186/1471-2407-7-181. [DOI] [PMC free article] [PubMed] [Google Scholar]
- 5.Abba MC, Hu Y, Sun H, et al. Gene expression signature of estrogen receptor α status in breast cancer. BMC Genomics. 2005;6(1, article 37) doi: 10.1186/1471-2164-6-37. [DOI] [PMC free article] [PubMed] [Google Scholar]
- 6.Hu M, Yu J, Taylor JMG, Chinnaiyan AM, Qin ZS. On the detection and refinement of transcription factor binding sites using ChIP-Seq data. Nucleic Acids Research. 2010;38(7):2154–2167. doi: 10.1093/nar/gkp1180.gkp1180 [DOI] [PMC free article] [PubMed] [Google Scholar]
- 7.Welboren WJ, van Driel MA, Janssen-Megens EM, et al. ChIP-Seq of ERα and RNA polymerase II defines genes differentially responding to ligands. EMBO Journal. 2009;28(10):1418–1428. doi: 10.1038/emboj.2009.88. [DOI] [PMC free article] [PubMed] [Google Scholar]
- 8.Langmead B, Trapnell C, Pop M, Salzberg SL. Ultrafast and memory-efficient alignment of short DNA sequences to the human genome. Genome Biology. 2009;10(3, article R25) doi: 10.1186/gb-2009-10-3-r25. [DOI] [PMC free article] [PubMed] [Google Scholar]
- 9.Fejes AP, Robertson G, Bilenky M, Varhol R, Bainbridge M, Jones SJM. FindPeaks 3.1: a tool for identifying areas of enrichment from massively parallel short-read sequencing technology. Bioinformatics. 2008;24(15):1729–1730. doi: 10.1093/bioinformatics/btn305. [DOI] [PMC free article] [PubMed] [Google Scholar]
- 10.Boyle AP, Guinney J, Crawford GE, Furey TS. F-Seq: a feature density estimator for high-throughput sequence tags. Bioinformatics. 2008;24(21):2537–2538. doi: 10.1093/bioinformatics/btn480. [DOI] [PMC free article] [PubMed] [Google Scholar]
- 11.Ji H, Jiang H, Ma W, Johnson DS, Myers RM, Wong WH. An integrated software system for analyzing ChIP-chip and ChIP-seq data. Nature Biotechnology. 2008;26(11):1293–1300. doi: 10.1038/nbt.1505. [DOI] [PMC free article] [PubMed] [Google Scholar]
- 12.Zhang Y, Liu T, Meyer CA, et al. Model-based analysis of ChIP-Seq (MACS) Genome Biology. 2008;9(9, article R137) doi: 10.1186/gb-2008-9-9-r137. [DOI] [PMC free article] [PubMed] [Google Scholar]
- 13.Jothi R, Cuddapah S, Barski A, Cui K, Zhao K. Genome-wide identification of in vivo protein-DNA binding sites from ChIP-Seq data. Nucleic Acids Research. 2008;36(16):5221–5231. doi: 10.1093/nar/gkn488. [DOI] [PMC free article] [PubMed] [Google Scholar]
- 14.Valouev A, Johnson DS, Sundquist A, et al. Genome-wide analysis of transcription factor binding sites based on ChIP-Seq data. Nature Methods. 2008;5(9):829–834. doi: 10.1038/nmeth.1246. [DOI] [PMC free article] [PubMed] [Google Scholar]
- 15.Redon R, Ishikawa S, Fitch KR, et al. Global variation in copy number in the human genome. Nature. 2006;444(7118):444–454. doi: 10.1038/nature05329. [DOI] [PMC free article] [PubMed] [Google Scholar]
- 16.Bailey TL, Elkan C. Fitting a mixture model by expectation maximization to discover motifs in biopolymers. Proceedings of the International Conference on Intelligent Systems for Molecular Biology; 1994; pp. 28–36. [PubMed] [Google Scholar]
- 17.Li J, Tibshirani R. Finding consistent patterns: a nonparametric approach for identifying differential expression in RNA-Seq data. doi: 10.1177/0962280211428386. Statistical Methods in Medical Research. In press. [DOI] [PMC free article] [PubMed] [Google Scholar]
- 18.Tusher VG, Tibshirani R, Chu G. Significance analysis of microarrays applied to the ionizing radiation response. Proceedings of the National Academy of Sciences of the United States of America. 2001;98(9):5116–5121. doi: 10.1073/pnas.091062498. [DOI] [PMC free article] [PubMed] [Google Scholar]
- 19.Sherry ST, Ward MH, Kholodov M, et al. DbSNP: the NCBI database of genetic variation. Nucleic Acids Research. 2001;29(1):308–311. doi: 10.1093/nar/29.1.308. [DOI] [PMC free article] [PubMed] [Google Scholar]
- 20.Ashburner M, Ball CA, Blake JA, et al. Gene ontology: tool for the unification of biology. Nature Genetics. 2000;25(1):25–29. doi: 10.1038/75556. [DOI] [PMC free article] [PubMed] [Google Scholar]
- 21.Kanehisa M, Goto S. KEGG: kyoto encyclopedia of genes and genomes. Nucleic Acids Research. 2000;28(1):27–30. doi: 10.1093/nar/28.1.27. [DOI] [PMC free article] [PubMed] [Google Scholar]
- 22.Zhang B, Schmoyer D, Kirov S, Snoddy J. GOTree Machine (GOTM): a web-based platform for interpreting sets of interesting genes using gene ontology hierarchies. BMC Bioinformatics. 2004;5, article 16 doi: 10.1186/1471-2105-5-16. [DOI] [PMC free article] [PubMed] [Google Scholar]
- 23.Zhang B, Kirov S, Snoddy J. WebGestalt: an integrated system for exploring gene sets in various biological contexts. Nucleic Acids Research. 2005;33(2):W741–W748. doi: 10.1093/nar/gki475. [DOI] [PMC free article] [PubMed] [Google Scholar]
- 24.Graham K, Ge X, de Las Morenas A, Tripathi A, Rosenberg CL. Gene expression profiles of estrogen receptor-positive and estrogen receptor-negative breast cancers are detectable in histologically normal breast epithelium. Clinical Cancer Research. 2011;17(2):236–246. doi: 10.1158/1078-0432.CCR-10-1369. [DOI] [PMC free article] [PubMed] [Google Scholar]
- 25.Wang Y, Klijn JGM, Zhang Y, et al. Gene-expression profiles to predict distant metastasis of lymph-node-negative primary breast cancer. The Lancet. 2005;365(9460):671–679. doi: 10.1016/S0140-6736(05)17947-1. [DOI] [PubMed] [Google Scholar]
- 26.Lu B, Liang X, Scott GK, et al. Polyamine inhibition of estrogen receptor (ER) DNA-binding and ligand-binding functions. Breast Cancer Research and Treatment. 1998;48(3):243–257. doi: 10.1023/a:1005949319064. [DOI] [PubMed] [Google Scholar]
- 27.Lin CY, Vega VB, Thomsen JS, et al. Whole-genome cartography of estrogen receptor α binding sites. PLoS Genetics. 2007;3(6, article e87) doi: 10.1371/journal.pgen.0030087. [DOI] [PMC free article] [PubMed] [Google Scholar]
- 28.Beeghly-Fadiel A, Zheng W, Lu W, et al. Replication study for reported SNP associations with breast cancer survival. Journal of Cancer Research and Clinical Oncology. 2012;138(6):1019–1026. doi: 10.1007/s00432-012-1174-6. [DOI] [PMC free article] [PubMed] [Google Scholar]
- 29.Han W, Kim KY, Yang SJ, Noh DY, Kang D, Kwack K. SNP-SNP interactions between DNA repair genes were associated with breast cancer risk in a Korean population. Cancer. 2012;118(3):594–602. doi: 10.1002/cncr.26220. [DOI] [PubMed] [Google Scholar]
- 30.Yang CH, Chuang LY, Chen YJ, Tseng HF, Chang HW. Computational analysis of simulated SNP interactions between 26 growth factor-related genes in a breast cancer association study. OMICS A Journal of Integrative Biology. 2011;15(6):399–407. doi: 10.1089/omi.2010.0028. [DOI] [PubMed] [Google Scholar]
- 31.Graves KD, Peshkin BN, Luta G, Tuong W, Schwartz MD. Interest in genetic testing for modest changes in breast cancer risk: implicationsfor SNP testing. Public Health Genomics. 2011;14(3):178–189. doi: 10.1159/000324703. [DOI] [PMC free article] [PubMed] [Google Scholar]
- 32.Hartmaier RJ, Tchatchou S, Richter AS, et al. Nuclear receptor coregulator SNP discovery and impact on breast cancer risk. BMC Cancer. 2009;9, article 438 doi: 10.1186/1471-2407-9-438. [DOI] [PMC free article] [PubMed] [Google Scholar]
- 33.Lark AL, Livasy CA, Dressler L, et al. High focal adhesion kinase expression in invasive breast carcinomas is associated with an aggressive phenotype. Modern Pathology. 2005;18(10):1289–1294. doi: 10.1038/modpathol.3800424. [DOI] [PubMed] [Google Scholar]
- 34.Oh AS, Lorant LA, Holloway JN, Miller DL, Kern FG, El-Ashry D. Hyperactivation of MAPK induces loss of ERα expression in breast cancer cells. Molecular Endocrinology. 2001;15(8):1344–1359. doi: 10.1210/mend.15.8.0678. [DOI] [PubMed] [Google Scholar]
- 35.Cam H, Griesmann H, Beitzinger M, et al. p53 family members in myogenic differentiation and rhabdomyosarcoma development. Cancer Cell. 2006;10(4):281–293. doi: 10.1016/j.ccr.2006.08.024. [DOI] [PubMed] [Google Scholar]
- 36.DeYoung MP, Johannessen CM, Leong CO, Faquin W, Rocco JW, Ellisen LW. Tumor-specific p73 up-regulation mediates p63 dependence in squamous cell carcinoma. Cancer Research. 2006;66(19):9362–9368. doi: 10.1158/0008-5472.CAN-06-1619. [DOI] [PubMed] [Google Scholar]
- 37.Dominguez G, Silva JM, Silva J, et al. Wild type p73 overexpression and high-grade malignancy in breast cancer. Breast Cancer Research and Treatment. 2001;66(3):183–190. doi: 10.1023/a:1010624717311. [DOI] [PubMed] [Google Scholar]
- 38.Chédotal A. Chemotropic axon guidance molecules in tumorigenesis. Progress in Experimental Tumor Research. 2007;39:78–90. doi: 10.1159/000100048. [DOI] [PubMed] [Google Scholar]
- 39.Yamaguchi H, Condeelis J. Regulation of the actin cytoskeleton in cancer cell migration and invasion. Biochimica et Biophysica Acta. 2007;1773(5):642–652. doi: 10.1016/j.bbamcr.2006.07.001. [DOI] [PMC free article] [PubMed] [Google Scholar]
- 40.McHale K, Tomaszewski JE, Puthiyaveettil R, Livolsi VA, Clevenger CV. Altered expression of prolactin receptor-associated signaling proteins in human breast carcinoma. Modern Pathology. 2008;21(5):565–571. doi: 10.1038/modpathol.2008.7. [DOI] [PubMed] [Google Scholar]
- 41.Moutsatsou P, Papavassiliou AG. The glucocorticoid receptor signalling in breast cancer: breast carcinoma. Journal of Cellular and Molecular Medicine. 2008;12(1):145–163. doi: 10.1111/j.1582-4934.2007.00177.x. [DOI] [PMC free article] [PubMed] [Google Scholar]
- 42.Pelekanou V, Kampa M, Kafousi M, et al. Expression of TNF-superfamily members BAFF and APRIL in breast cancer: immunohistochemical study in 52 invasive ductal breast carcinomas. BMC Cancer. 2008;8, article 76 doi: 10.1186/1471-2407-8-76. [DOI] [PMC free article] [PubMed] [Google Scholar]
- 43.Weber GF, Gaertner FC, Erl W, et al. IL-22-mediated tumor growth reduction correlates with inhibition of ERK1/2 and AKT phosphorylation and induction of cell cycle arrest in the G 2-M phase. Journal of Immunology. 2006;177(11):8266–8272. doi: 10.4049/jimmunol.177.11.8266. [DOI] [PubMed] [Google Scholar]
- 44.Carroll JS, Liu XS, Brodsky AS, et al. Chromosome-wide mapping of estrogen receptor binding reveals long-range regulation requiring the forkhead protein FoxA1. Cell. 2005;122(1):33–43. doi: 10.1016/j.cell.2005.05.008. [DOI] [PubMed] [Google Scholar]
Associated Data
This section collects any data citations, data availability statements, or supplementary materials included in this article.
Supplementary Materials
Additional file 1 shows the differentially expressed genes in the vicinity of ER binding sites. Using 3 gene expression studies and a criterion of q-value <0.01, we identified 5692 and 6101 up- and down-regulated down-regulated genes between ER+ and ER- breast tumors. Among these genes, 289 up-regulated and 198 down-regulated genes located near the ER binding sites. The details of these 489 estrogen response elements were listed here. Additional file 2 shows the SNPs occurred in the ER-regulated genes located near the binding sites. These SNPs were identified by using the table SNP (131) (dbSNP build 131) in UCSC (http://genome.ucsc.edu/). Totally, 836 SNPs in or near 157 ER-regulated genes were identified.