Abstract
We present an ultrasound (US)-guided diffuse optical tomography for mapping tumor deoxyhemoglobin (deoxyHb) and oxyhemoglobin (oxyHb) concentrations in blood phantoms and in in-vivo patients. Because oxyHb and deoxyHb respond differently at different wavelengths, four laser diodes of wavelengths 740 nm, 780 nm, 808 nm and 830 nm were used in the study. Tumor model experiments were performed using phantoms of different hemoglobin oxygen saturations (14%-89%) representing hemoglobin oxygenation in tissue. Targets of different sizes and located at different depths were used to validate the accuracy of oxygen saturation estimation. The absolute deviations between the estimated hemoglobin oxygen saturations obtained from reconstructed absorption maps and oxygen measurements obtained using a pO2 electrode were less than 8% over the measured range of oxygen saturation. An inhomogeneous concentric blood phantom of deoxygenated center core and oxygenated outer shell was imaged and deoxyHb and oxyHb maps revealed corresponding distributions which correlated well with inhomogeneous deoxy- and oxy-distributions frequently seen in breast cancers. Clinical examples are given to demonstrate the utility of US-guided optical tomography in mapping heterogeneous deoxyHb and oxyHb distributions in breast cancers.
Keywords: Diffuse optical tomography, Ultrasound, Breast cancer, Tumor hypoxia, Tumor oxygen saturation
Introduction
Tumor vasculature is directly related to tumor proliferation, growth, and metastasis; while tumor hypoxia alters the pattern of gene expression leading to more aggressive behavior with increased metastatic potential and treatment resistance (1-12). Tumor oxygen partial pressure measurements have shown that hypoxia conditions often exist in malignant tumors but not in vascular supply, they develop an adaptation that has a negative effect on their response to treatment (7, 9). If the tumor is not well perfused, chemotherapeutic drugs cannot easily reach the tumor cells. Furthermore, tumor cells rapidly adapt to hypoxia by slowing their growth rate, and conventional chemotherapy generally is toxic to cells in proportion to their proliferation. Most chemotherapeutic drugs are essentially anti-proliferation agents rather than specific anti-cancer agents so that when cells enter a resting phase they are insensitive to these cytotoxic agents. Thus, the ability to image tumor hypoxia in general has important clinical utility, providing additional diagnosis information for distinguishing malignant and benign lesions, selection of a cohort of patients who may benefit from hypoxia-directed therapies and monitoring tumor response using longitudinal imaging (12).
Near Infrared (NIR) Diffuse Optical Tomography (DOT) or Diffuse Optical Spectroscopy (DOS), a non-invasive imaging or spectroscopic technique, has demonstrated its clinical potential of probing tumor angiogenesis which can be quantitatively assessed by total hemoglobin (tHb) concentration (13-25). When multiple wavelengths are used, DOT/ DOS can be used to map deoxyhemoglobin (deoxyHb) and oxyhemoglobin (oxyHb) concentrations or tumor oxygen saturation. Numbers of publications have reported a lower oxygen saturation SO2 in breast tumors with respect to normal tissues (26-28), whereas others have observed no difference (29-30). Publications involving a larger number of subjects have shown that oxygen saturation itself may not be a statistically significant discriminator to differentiate malignant from benign breast lesions (16-17, 20, 23-25). Chance et al. showed that SO2, when combined with tHb could provide sensitivity and specificity of 96% and 93%, respectively, for classifying malignant from benign lesions (16). Rinneberg et al. concluded from a study involving 154 patients that the tumor SO2 provided additional information in distinguishing malignant from benign breast lesions, however, the tumor SO2 itself was a poor discriminator (17). By using x-ray tomosynthesis guided DOT, Fang et al. reported lower SO2 in some cancer cases, however, the statistically significance of SO2 was found only between cysts and solid benign lesions (23). Choe et al. found statistical significance of oxyHb not SO2 in differentiating malignant cancers from normal tissues (20). Cerussi et al. reported statistical significance of oxyHb and deoxyHb not SO2 in malignant cancers as compared to the background normal tissues (25). Using DOS to follow patient response to neoadjuvant chemotherapy, Cerussi et al. found that deoxyHb was a significant predictor to treatment response (24).
Our group has explored the use of ultrasound (US)-guided optical tomography to improve the lesion localization and light quantification accuracy (14, 21-22). In our clinical studies, we have observed that large tumors often presented with more deoxygenated center core and oxygenated peripheral distribution (31-32). This type of heterogeneous distribution sometimes can be seen in smaller 1-2 cm tumors as well, however, it has not been observed in benign lesions. It has been reported in the literature that as a solid tumor progresses, tumor angiogenesis produces abnormal vasculature that is characterized by hypervascularity at the tumor periphery, where the tumor center can be hypovascular (33). Peripheral enhancement patterns are frequently used in contrast-enhanced MRI to differentiate malignant from benign lesions (34-35).
This study was motivated by the lack of phantom studies correlating inhomogeneous oxygenation distribution with our in vivo observations. Additionally, there are no systemic phantom studies quantifying the accuracy of reconstructed deoxyHb and oxyHb distributions or oxygen saturation as a function of tumor size and tumor depth with different oxygen conditions. In this paper, we have evaluated the capability of US-guided DOT in imaging deoxyHb and oxyHb distributions of blood phantoms having different controlled oxygen conditions. Different size phantoms located at different depths were imaged and the estimated oxygen saturations were compared with the measurements obtained using a pO2 electrode. A blood hypoxia phantom with deoxygenated core and oxygenated periphery was imaged and the deoxyHb and oxyHb distributions correlate with the heterogeneous distributions frequently seen in breast cancers. Clinical examples of benign and breast cancer cases are given to demonstrate the capability of US-guided optical tomography in mapping heterogeneous deoxyHb and oxyHb distributions in breast cancers and in assisting diagnosis. To the best of our knowledge, this manuscript is the first to report the utility of US-guided DOT in mapping heterogeneous deoxyHb and oxyHb distributions in phantoms and in patients.
Materials and Methods
Ultrasound Guided DOT Imaging System and Imaging Algorithm
Our frequency domain system consists of 14 parallel detectors and 4 laser diodes of 740 nm, 780 nm, 808 nm and 830 nm. Each laser diode was sequentially switched to 9 positions on the probe. The center slot on the probe was used for ultrasound transducer and the sources and detectors were distributed on both sides (36). Intralipid solution of 0.8% was used to emulate the background tissue and the calibrated absorption coefficient (μa) was in the range of 0.01-0.03 cm−1 and the reduced scattering coefficient (μs’) was in the range of 7-8 cm−1 for the four wavelengths employed. Measurements were made with the target inside the intralipid (target data) and intralipid alone as a reference. The perturbation between the target data and the reference was used for image reconstruction.
The dual-zone mesh scheme introduced by us earlier was used for reconstruction of absorption maps (36). Briefly, the imaging volume was segmented into two regions consisting of the lesion (ROI) as identified by the co-registered ultrasound and the background region. We used a smaller fine mesh size for the lesion region and a larger coarse mesh size for the background region, so that the total voxels with unknown optical properties was significantly reduced and the inversion converged quickly in three to four iterations. The conjugate gradient method was used for the iterative optimization. Using this method, the scattered field can be related to the integral or total absorption distribution as:
| [1] |
where WL and WB are the weight matrices for lesion region and background region, respectively; and are the total absorption distribution of the lesion and the background regions, respectively. Here, the total absorption distribution was reconstructed rather than Δμa(r’). At the end of the iterative optimization, the total absorption distribution is divided by the different voxel sizes of the lesion and background to obtain , where is the background absorption obtained from intralipid for phantom experiments and contralateral normal breast for patients.
Both deoxyHb and oxyHb are the major endogenous chromophores in tissue to absorb light in the NIR range. The absorption between 700 nm-800 nm is dominated by deoxyHb and that between 800 nm-900 nm is dominated by oxyHb. The deoxyHb and oxyHb concentrations at each imaging voxel r’ were related to the reconstructed absorption coefficients, , by the following equations: where and are extinction coefficients at wavelength
| [2] |
λi are in Ref. 38. The deoxyHb and oxyHb concentrations were computed as:
| [3] |
where wavelengths λ1, λ2, λ3, λ4 correspond to 740, 780, 808 and 830 nm, respectively. The tHb concentration is computed as:
| [4] |
and oxygenation saturation as
| [5] |
The equation [5] provides oxygen saturation mapping at each voxel r’, which is not robust at the locations where the total hemoglobin concentration is low. Therefore, the maps of deoxyHb r ( ’) and oxyHb r ( ’) computed from four wavelengths were used to visualize the deoxy- and oxy-components of the hemoglobin distribution. Furthermore, the mean values of oxyHb and tHb computed within the full width and half maximum from the maximum value of the corresponding distribution were used to obtain the estimated SO2 of phantom targets as:
| [6] |
The estimated or computed SO2 was used to compare with measured SO2 obtained from a pO2 electrode discussed in the next section.
Hypoxia Model Experiments
Hypoxia model experiments were performed to validate the accuracy of the tumor hypoxia mapping and oxygen saturation quantification using the US-guided DOT technique. In the model experiment, blood phantoms at different controlled oxygenation conditions were imaged by the combined system. Hollow glass spheres of sizes 1.0 cm to 3.0 cm (0.5 cm increment) were customized (Glass Technology Center, University of Connecticut, Storrs, CT) to hold the blood samples for mimicking different tumor sizes. Blood was collected from 2-3 months old fresh euthanized rats by cardiac puncture and preserved in 7.0 ml EDTA tubes (BD Vacutainer, Franklin Lakes, NJ; K3 EDTA 12 mg blood collection tubes: 8018346). The blood was centrifuged at 2000 rpm for 15 minutes to collect red blood cells (RBC). The supernatants of plasma and serum were aspirated. Similar amount of sterile saline solution was added to RBC and centrifuged again until the supernatant was clearer. The RBCs were then free from the clotting proteins which were originally present in the plasma (37). For the optical imaging experiment, the RBCs were diluted 4 times with sterile saline solution and the diluted RBCs were filled in the customized glass spheres (2.0 mm openings). The diluted RBCs referred as diluted blood, considered as oxygenated blood, were placed in glass spheres and imaged with the combined system.
The diluted blood was deoxygenated by passing nitrogen gas (Airgas East, Cheshire, CT) at 1.5 psi for 10 minutes in a measuring flask. The deoxygenated blood was then transferred to the previously evacuated glass spheres for imaging. Absorption maps were reconstructed at four wavelengths with oxygenated and deoxygenated blood phantoms located at different depths. Following the collection of one set of data at one deoxygenated condition, the blood was transferred to the original measuring flask and slowly oxygenated by adding small volumes of oxygen and gently shaking it. Using this method, different intermediate deoxygenated conditions were achieved.
We have taken care to avoid the concentration change caused by water evaporation during gas bubbling. As explained by Cope et al. (38), hemoglobin can become denaturized and precipitate (produce scattering), if it is deoxygenated vigorously or remains deoxygenated for a long period of time. The concentration change can shift the isobestic point to different wavelengths. For deoxygenation, the blood was filled in the measuring flask sealed with a rubber stopper. Two 18 gage needles were attached to the rubber for inlet and outlet of gases. There was an additional port for a pO2 electrode, for measuring oxygen saturation. The nitrogen gas was passed to the flask at 1.5 psi and the flask was gently shaked for proper mixing. During gas passing precautions were taken not to form bubbles which can evaporate and changes the density of blood hence the absorbance. We have observed this effect when the gas was passed vigorously and kept the gas passing for a long period of time. In our procedure we always limited the gas passing time to 10 minutes. To bring back to oxygenated blood and for getting intermediate oxygen saturation points, air from the environment was injected to the measuring flask and the flask was shaked gently.
Three different types of model experiments were performed to evaluate our approach; (1) same blood phantom with different oxygenation conditions located at different depths, (2) blood phantoms of different sizes with similar oxygenation conditions, and (3) a smaller target with deoxygenated blood inside a bigger target with oxygenated blood. The third set of experiment emulated the condition of a large cancer where the core of the tumor could be deoxygenated and periphery was oxygenated. All the targets were embedded in a 0.8% homogeneous intralipid medium (Fresenius Kabi, Uppsala, Sweden). The intralipid background was first calibrated before imaging the targets. The oxygen saturation was also measured by a commercial pO2 electrode (DO166-MT-1, Lazar Research Laboratory, CA), and was considered as measured SO2 throughout the paper.
Clinical Experiments
Clinical experiments were performed at the Health Center of the University of Connecticut. The study protocol was approved by the local Institution Review Board (IRB) committee. All patients who participated in our study signed the informed consent. The patients were in supine position and scanned by the combined US and NIR probe. The patients’ data were taken at the lesion area and the contralateral breast of the same quadrant as the lesion. Contralateral data set was used to estimate background optical properties for weight matrix computation. The perturbation was computed between lesion data and contralateral data and used for image reconstruction.
Results
Model Hypoxia Experiments
One set of experiment was done with a 2.0 cm target of different oxygen saturations. The target was imaged at depths from 1.5 cm to 3.0 cm with 0.5 cm increments. From the NIR optical spectrum of chromophores (39), it is well known that oxyHb and deoxyHb show significant differences in absorption coefficients at 740 nm and 830 nm. The maximum absorption coefficients reconstructed at four wavelengths for both oxy- and deoxy-blood located at 2.0 cm depth is shown in Figure 1, which is in accordance with the standard NIR spectrum (39). The isobestic point was estimated around 798 nm.
Figure 1.
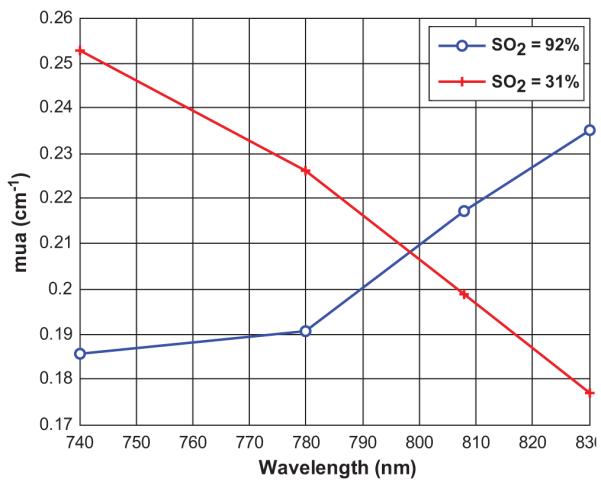
Measured maximum absorption coefficients at 4 wavelengths under two different oxygen conditions of SO2 = 92% and SO2 = 31%. The isobestic point is estimated at 798 nm.
In this set of experiments, we used equation (6) to estimate the average oxygen saturation from the reconstructed absorption maps and referred it as estimated SO2. The target oxygen saturation was also measured by the SO2 meter prior to and post-experiment and the former measurements were taken as measured SO2. The target oxygen saturation was varied from 14% to 92%. The estimated SO2 verses the measured SO2 of a 2.0 cm target located at different experimental depths is plotted in Figure 2. The experiments, with different sets of phantoms, were repeated at a different day to evaluate the consistency of our procedures and variations related to environmental pO2, and both results are plotted as ‘day: 1’ and ‘day: 2’. The estimated values matched well to the measured values (solid dark line) when the targets were at depths of 2.0 and 2.5 cm and the SO2 was within 14-89%. The absolute deviations in estimated SO2 from the measured ones were within 7% (mean error of 3.5% over all the saturation ranges). The deviations were higher when the targets were at shallower depths (1.5 cm) and deeper (3 cm) from the probe. At 1.5 cm depth, the measurement deviations were from 0 to 7% with one exception of 11% deviation at 89% measured SO2, where as for deeper targets (3.0 cm), the deviations were from 2-8% (mean error of 5.5% over all the oxygen saturation ranges). It is noted here that, the errors were larger in reconstructed SO2 if the oxygen saturation was less than 10% (not shown in the Figure). This problem was earlier observed in theoretically generated data (large estimation errors for SO2 < 30%) by Heffer et al. (40) and experimentally blood phantom data by McBride et al. (39) and Srinivasan et al. (28) (oxygen saturation was accurate to within 15% for pO2 < 20 mmHg).
Figure 2.
Measured oxygen saturation versus estimated oxygen saturation obtained using equation [6]. The 2.0 cm target was located at different depth.
We have studied the effects of target size on SO2 estimation. This set of experiment mimicking different development stages of breast tumors. To model this process, glass spheres of diameters from 1.0 cm to 2.5 cm in 0.5 cm increments were imaged at different oxygenation conditions. The top portions of the targets were placed at 1.0 cm depth from the probe. The measured oxygen saturations for targets of different sizes at two different oxygenation conditions are shown in Figure 3. The reconstructed values were very close to that of measured values with absolute deviations of 1-5% for 14% measured SO2 and 1-8% for 70% measured SO2. The deviations between reconstructed and measured SO2 values were the least for targets of 1.5 cm and 2.0 cm, and the deviations were slightly higher for 1.0 cm and 2.5 cm targets. From Figure 3, it is noted that the SO2 is over estimated for deoxytargets and underestimated for oxy-targets. For the deoxytargets, the deoxy-hemoglobin is slightly underestimated because the power of 740 nm laser diode in our system is about 60% of that at other three wavelengths. The underestimation of deoxy-hemoglobin causes overestimation of SO2 (see equation 6). For the oxy-targets, the oxy-hemoglobin is underestimated because stronger absorption at 808 nm and 830 nm (dominated by oxy-absorption) causes the saturation in the reconstructed target absorption maps when Born approximation is used.
Figure 3.
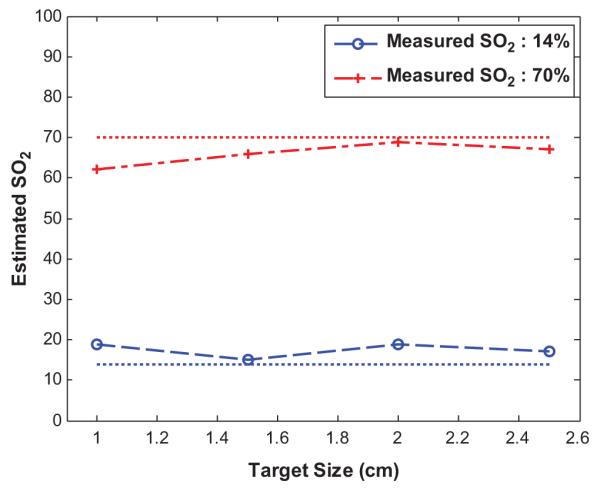
Target size versus estimated SO2 obtained at two oxygen saturation conditions.
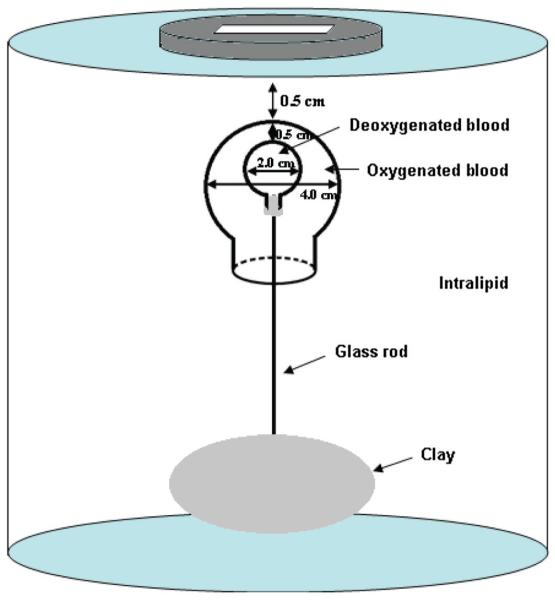
To emulate the real clinical scenario where the core of the large tumor could be hypoxic, we have made a phantom with a 4.0 cm diameter ball (2.2 cm opening) filled with oxygenated blood. A smaller 2.0 cm diameter ball filled with deoxygenated blood was placed inside the bigger ball (see Figure 4). The thickness between the outer shell and the inner core was 0.5 cm. In our previous study of imaging inhomogeneous or heterogeneous absorbing targets (41), we found that when the thickness between the outer shell and the inner core was less than 1.0 cm and the targets located between depth range of 1-3 cm, the inner core could be visualized. However, when the thickness was larger than 1 cm, the inner core could not be resolved, even the core diameter was relatively large. This is caused by the increased scattering events when photons pass the outer shell of more than 1.0 cm thick and the information loss between the two groups of photons passing outer shell only and passing the outer shell and the inner core. The filled smaller ball was mounted on an 8.0 cm long thin transparent glass rod and introduced into the bigger ball. The 4.0 cm bigger ball was filled with oxygenated blood. A transparent plastic cap with center hole was used to seal the bigger ball. The plastic cap had a transparent ventilated extension (a hollow glass cylinder) at the center, some part to inside and remaining to outside of the bigger ball, helped guiding the smaller ball to stay at the center of the bigger ball. The smaller ball was at the center of the bigger ball when the thin transparent glass rod holding the smaller ball was well fitted inside the transparent ventilated cylindrical extension of the bigger ball. Based on the length of the glass rod coming out of the whole assembly, we were able to control the gap between the top surfaces of the bigger and smaller balls. Ultrasound images were taken to estimate the exact gap between the balls. The measured SO2 of the outer target was 70% and that of the inner target was 14%. The 4.0 cm oxy-target was imaged first, and a 2.0 cm deoxy-blood target was introduced after and the combination was imaged again.
Figure 4.
Sketch of the concentric target and experimental set-up.
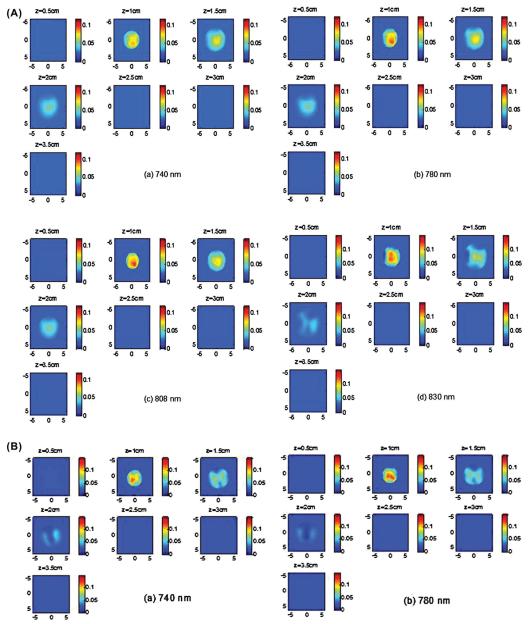
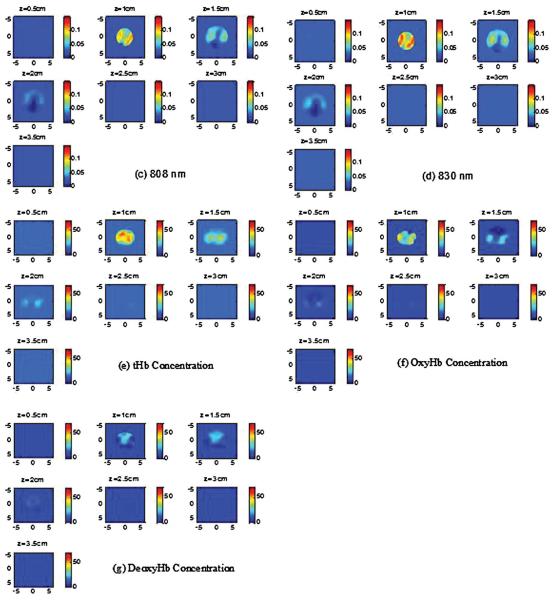
The absorption images of the 4.0 cm oxy-target without the inner deoxy-core are shown in Figure 5A (a-d). Since light at 830 nm is absorbed more by oxy-hemoglobin and light at 740 nm is absorbed more by deoxyHb, the 830 nm image (Figure 5A (d)) shows highest contrast and the reconstructed images at all wavelengths show a homogeneous target. Note that because of the significant light absorption of photons by the top portion of the large blood phantom, it can only be imaged with good sensitivity at first two to three layers in depth. We call this posterior light shadowing effect which is more pronounced in reflection geometry and suggests the high absorption of the target or malignance of the lesion (42). The image of the combined target with the inner deoxy-core at 740 nm (Figure 5B) shows that the core has higher absorption than the periphery and the image at 830 nm shows that the periphery is higher than the core. The tHb, oxyHb and deoxyHb maps are shown in Figure 5B (E)-(G). As seen from the maps, the center is higher in deoxyHb map and the periphery is higher in oxyHb map. The quantitative SO2 using equation 6 is calculated as 64.2%, however, it is not accurate because the distributions of hemoglobin (total, oxy-, deoxy-) are not homogeneous. The maxima of total, oxy- and deoxy-hemoglobin concentrations were 58, 46 and 25 μM. The maximum was measured at the periphery in total and oxyHb maps and at the core in the deoxyHb map. This example demonstrates that our four wavelength imager is capable of mapping out inhomogeneous oxyHb and deoxyHb distributions of the target.
Figure 5.
(A) (a)-(d) Reconstructed absorption maps of the 4.0 cm oxy-target without deoxy-core at four wavelengths of 740 nm (a), 780 nm (b), 808 nm (c), and 830 nm (d), respectively. Each map has 7 sub-images. Each sub-image shows a spatial x-y absorption distribution at the corresponding depth marked on the title of the sub-image. The depth increment is 0.5 cm. The dimensions of the sub-image are 9 cm by 9 cm. In the following Figures, the dimensions of the absorption are the same as Figure 5. The color bars for absorption coefficients were from 0 to 0.12 cm−1. (B) (a)-(d) Reconstructed absorption maps of the concentric target with deoxy-core at four wavelengths of 740 nm (a), 780 nm (b), 808 nm (c), and 830 nm (d), respectively. (e)-(g) tHb, oxyHb, and deoxyHb maps of the concentric target, respectively. The color bars for absorption coefficients were from 0 to 0.14 cm−1; and the values for hemoglobin concentrations were from 0 to 70 μM.
Clinical Examples
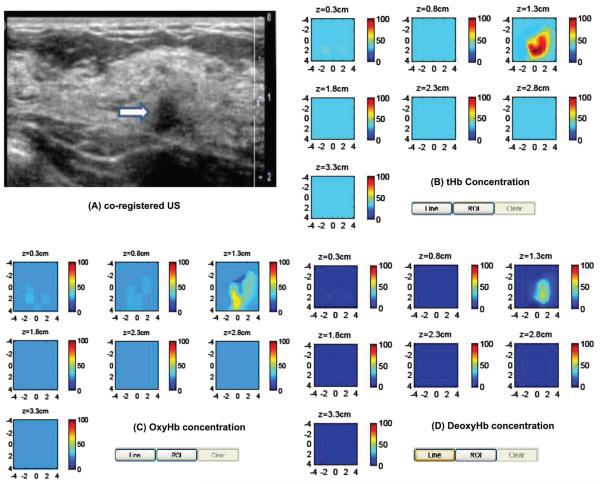
The first clinical example is shown in Figure 6. The patient is a 26-years-old woman having a suspicious solid mass measured 2.2 cm (lateral) × 1.5 cm (depth) by US (a). Near infrared and ultrasound scans were performed before her core biopsy and biopsy result revealed a benign fibroadenoma. The distributions of absorption maps are quite homogeneous for all wavelengths with increasing absorption from 740 to 830 nm (not shown). The reconstructed maximum absorption coefficients were 0.11, 0.13, 0.15, and 0.16 cm−1 at 740, 780, 808 and 830 nm, respectively. The computed tHb, oxyHb and deoxyHb maps are shown in Figure 6 (B)-(D). The color bar is in μM from 0 to 100 μM. The reconstructed maximum and mean tHb were 70.6 μM and 42.2 μM. The lesion is highly oxygenated which can be seen from oxyHb and deoxy maps. Quantitatively, the reconstructed maximum and mean oxyHb were 56.5 μM and 34.8 μM, and corresponding values for deoxyHb were 14.7 μM and 9.0 μM. The estimated SO2 was 83%. It is noted that when the absorption maps are homogeneous, the sum of maximum and mean oxyHb and deoxyHb are approximately equal to maximum and mean tHb.
Figure 6.
Clinical example of a benign fibroadenoma. (A) Co-registered US showed a suspicious 2 cm solid mass on the right breast of a 26-years-old woman. (B)-(D) computed tHb, oxyHb and deoxyHb maps. The absorption maps at all wavelengths (not shown) and computed hemoglobin concentration maps were homogeneous.
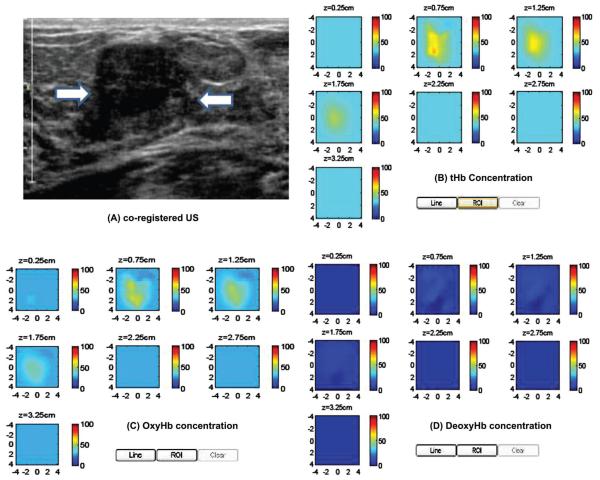
The second clinical example of a stage I breast cancer is given in Figure 7(A). This 61-year old woman had a suspicious 1 cm mass seen by US on her left breast. Near infrared and ultrasound scans were performed before her core biopsy and biopsy result revealed an intermediate grade invasive carcinoma with ductal and lobular features. The reconstructed absorption maps of 740-808 nm are quite homogeneous, while the distribution of 830 nm shows higher absorption at the periphery (not shown). The computed tHb, deoxyHb and oxyHb maps are shown in Figure 7 (B)-(D). As seen from the deoxyHb and oxhHb maps, the tumor core is more deoxygenated and the periphery is more oxygenated. The computed maximum and mean of tHb, deoxyHb, and oxyHb were 99.9 μM and 71.3 μM, 61.8 μM and 42.7 μM, 45.3 μM and 33.5 μM, respectively. The estimated SO2 was 60% which was much lower than the benign case. It is noted that when the absorption maps are inhomogeneous, the sum of maximum oxyHb and deoxyHb may not equal to maximum tHb, because maximum values of these maps may appear at different spatial locations. The sum of mean values of oxyHb and deoxyHb may or may not equal to mean of tHb depending on the spatial distributions of deoxyHb and oxyHb masses.
Figure 7.
Clinical example of a stage I breast cancer. (A) Co-registered US showed a suspicious 1 cm mass on the left breast of a 61-years-old woman. (B)-(D) computed tHb, oxyHb and deoxyHb maps. The absorption maps of 740 nm, 780 nm and 808 nm are quite homogeneous, however, the map at 830 nm shows more periphery distribution (not shown). As a result, the computed oxyHb shows more periphery distribution.
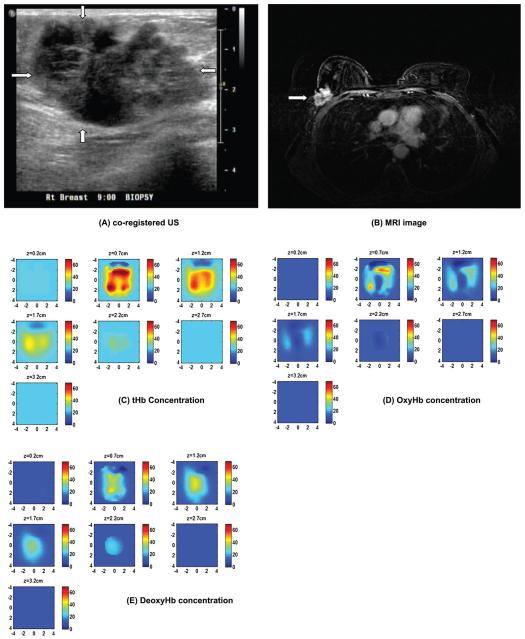
The third clinical example of an advanced breast cancer is shown in Figure 8. This 64-years-old woman had a highly suspicious 5 × 4 cm mass on her right breast measured 5 cm (lateral) × 3 cm(depth) by ultrasound (a) and 3.9 cm (cranial caudal) × 5.5 cm (transverse) × 4.3 cm (anterior-posterior) by contrast enhanced MRI (b). MRI showed periphery enhancement. Near infrared and ultrasound scans were performed before her core biopsy and biopsy result revealed an advanced high grade infiltrating carcinoma. The reconstructed absorption maps at 740 nm shows higher absorption at the core, while 830 nm map shows higher absorption at the periphery. The 780 nm and 808 nm show absorption distributions between 740 nm and 830 nm. The reconstructed maximum absorption coefficients were 0.19, 0.13, 0.13, and 0.25 cm−1 at 740, 780, 808 and 830 nm, respectively. The computed tHb, oxyHb and deoxyHb maps are shown in Figure 8(C)-(E). The color bar is in μM from 0 to 70 μM. The oxyHb map showed periphery distribution, while the deoxyHb map showed higher value at the core. The maximum total hemoglobin concentration was 82.6 μM measured at periphery. The maximum oxyHb and deoxyHb were 56.4 μM and 39.8 μM measured at periphery and core respectively. The mean values of tHb, oxyHb, and deoxyHb were 52.5, 35.2 and 27.4 μM and estimated SO2 was 67%. This example demonstrates the unique tumor vasculature and oxygen consumption patterns that can be revealed by our US-guided DOT.
Figure 8.
Ultrasound image of an advanced breast cancer located at the right breast of a 64-years-old woman (A), and MRI image of the cancer (B) marked by the arrow head. (C)-(F) computed tHb, oxyHb, and deoxyHb maps, respectively. The absorption map at 740 nm shows higher value at the core; while the absorption at 830 nm reveals higher value at periphery (not shown). As a result, the deoxyHb shows a higher value at the core and oxyHb map reveals periphery distribution. The color bars for hemoglobin concentrations are from 0 to 70 μM.
Discussion and Summary
We validated US-guided optical tomography with hypoxia model experiments using blood phantoms of different oxygenation conditions, targets of different sizes mimicking different developmental stages of breast tumors. The estimated SO2 was within 92-100% of the measured SO2 by using an invasive pO2 electrode as a standard. An inhomogeneous concentric blood phantom of deoxygenated center core and oxygenated outer shell was imaged and deoxyHb and oxyHb maps revealed corresponding distributions which correlate with inhomogeneous deoxy- and oxy-distributions frequently seen in large breast cancers. Our results suggest that in addition to quantitative tHb concentration, tumor oxyHb and deoxyHb distributions can add more diagnostic information for distinguishing malignant from benign breast lesions. Our initial findings will need to be further validated by a larger patient population.
From the reconstructed optical absorption maps at four wavelengths, we were able to estimate SO2 in addition to tHb accurately. Compared with using two wavelengths of 780 nm and 830 nm, the target deoxyHb and oxyHb maps obtained from the selected four wavelengths were more robust. There are several factors that may affect the estimated SO2 obtained from reconstructed absorption maps. Because Born approximation was used, the target absorption coefficient could be under reconstructed due to saturation at the wavelength where the absorption was high under certain oxygen conditions. For example, for oxygenated blood, the reconstructed target absorption was higher at 808 nm and 830 nm. The under reconstruction of target absorption at these wavelengths may cause under estimation of SO2. For the diluted blood we used, the larger error up to 8% occurred at higher SO2 end beyond 70%. The experimental errors in measuring oxygen saturation include the time gap between the DOT experiments and SO2 measurement by electrode. There might be a minor change in oxygen saturation during this time frame. Small reflections from the transparent glass balls might have slightly changed the absorption coefficients causing some minor errors in SO2 estimation. We have conducted testing with thin transparent balloons, transparent gloves, thin glass balls, and thin clear plastics, but the transparent glass balls were easier for mounting and controlling the oxygenation level while maintaining lower material effect on image reconstruction. Some numbers of RBCs might have died during all the procedures and getting the intermediate SO2s, causing different SO2 in blood environment and RBC molecules. The electrode measured SO2 of any whole or diluted blood was always less than 92%. By nitrogen passing, we were able to bring the oxygen saturation up to 6%, however our reconstructed optical absorption coefficients never estimated any SO2 less than 14% for any measured SO2 at any depths and any target size. This might be due to the relative lower power of our 740 nm source than that of the other three wavelengths.
In summary, we have demonstrated the utility of US-guided diffuse optical tomography for mapping tumor deoxyhemoglobin (deoxyHb) and oxyhemoglobin (oxyHb) concentrations in blood phantoms and in in-vivo patients. Targets of different sizes and located at different depths with different oxygen conditions were used to validate the accuracy of oxygen saturation estimation. The absolute deviations between the estimated hemoglobin oxygen saturations obtained from reconstructed absorption maps and oxygen measurements obtained using a pO2 electrode were less than 8% over the measured range of oxygen saturation. An inhomogeneous concentric blood phantom of deoxygenated core and oxygenated outer shell was imaged and deoxyHb and oxyHb maps revealed corresponding distributions which correlated well with inhomogeneous deoxy- and oxy-distributions frequently seen in breast cancers. Such distributions may reveal hypovascular core and hypervascular peripheral enhancement that correspond to tumor angiogenesis development.
Acknowledgements
The authors thank the funding support of this work from the National Institute of Health (R01EB002136) and the Donaghue Medical Research Foundation.
Abbreviations
- (DOT)
Diffuse optical tomography
- (US)
Ultrasound
- (tHb)
Total hemoglobin
- (deoxyHb)
Deoxygenated hemoglobin
- (oxyHb)
Oxygenated hemoglobin
References
- 1.Vaupel P, Kallinowski F, Okunieff P. Blood flow, oxygen and nutrient supply, and metabolic microenvironment of human tumors: a review. Cancer Res. 1989;49:6449–6465. [PubMed] [Google Scholar]
- 2.Brizel DM, Rosner GL, Prosnitz LR, Dewhirst MW. Patterns and variability of tumor oxygenation in human soft tissue sarcomas, cervical carcinomas and lymph node metastasis. Int J Radiat Oncol Biol Phys. 1995;31:1121–1125. doi: 10.1016/0360-3016(95)00106-9. [DOI] [PubMed] [Google Scholar]
- 3.Hohenberger P, Flegner C, Haensh W, Schlag PM. Tumor oxyoxy-genation correlates with molecular growth determinants in breast cancer. Breast Cancer Res. 1998;48:97–106. doi: 10.1023/a:1005921513083. [DOI] [PubMed] [Google Scholar]
- 4.Knowles H, Harris AL. Hypoxia and oxidative stress in breast cancer hypoxia and tumourigenesis. Breast Cancer Research. 2001;3:318–322. doi: 10.1186/bcr314. [DOI] [PMC free article] [PubMed] [Google Scholar]
- 5.Hockel M, Aupel PV. Biological consequences of tumor hypoxia. Semin Oncol. 2001;28:36–41. [PubMed] [Google Scholar]
- 6.Harris AL. Hypoxia – a key regulatory factor in tumor growth. Nat Rev Cancer. 2002;2:38–47. doi: 10.1038/nrc704. [DOI] [PubMed] [Google Scholar]
- 7.Kizaka-Kondoh M, Inoue S, Harada H, Hiraoka M. Tumor hypoxia: a target for selective cancer therapy. Cancer Sci. 2003;94:1021–1028. doi: 10.1111/j.1349-7006.2003.tb01395.x. [DOI] [PMC free article] [PubMed] [Google Scholar]
- 8.Vaupel P. Tumor microenvironmental physiology and its implications for radiation oncology. Sem Radiat Oncol. 2004;14:198–206. doi: 10.1016/j.semradonc.2004.04.008. [DOI] [PubMed] [Google Scholar]
- 9.Brown JM, Wilson WR. Exploiting tumor hypoxia in cancer treatment. Nat Rev Cancer. 2004;4:437–447. doi: 10.1038/nrc1367. [DOI] [PubMed] [Google Scholar]
- 10.Vaupel P, Harrison L. Tumor hypoxia: causative factors, compensatory mechanisms, and cellular response. The Oncologist. 2004;9:4–9. doi: 10.1634/theoncologist.9-90005-4. [DOI] [PubMed] [Google Scholar]
- 11.Padhani AR. Where are we with imaging oxygenation in human tumors? Cancer Imaging. 2005;5(1):128–130. doi: 10.1102/1470-7330.2005.0103. [DOI] [PMC free article] [PubMed] [Google Scholar]
- 12.Krohn KA, Link JM, Mason RP. Molecular Imaging of Hypoxia. J Nucl Med. 2008;49:129S–148S. doi: 10.2967/jnumed.107.045914. [DOI] [PubMed] [Google Scholar]
- 13.Tromberg BJ, Cerussi A, Shah N, Compton M, Durkin A, Hsiang D, Butler J, Mehta R. Imaging in breast cancer: diffuse optics in breast cancer: detecting tumors in pre-menopausal women and monitoring neoadjuvant chemotherapy. Breast Cancer Res. 2005;7:279–85. doi: 10.1186/bcr1358. [DOI] [PMC free article] [PubMed] [Google Scholar]
- 14.Zhu Q, Huang MM, Chen NG, Zarfos K, Jagjivan B, Kane M, Hedge P, Kurtzman SH. Ultrasound-guided optical tomographic imaging of malignant and benign breast lesions: initial clinical results of 19 cases. Neoplasia. 2003;5:379–388. doi: 10.1016/s1476-5586(03)80040-4. [DOI] [PMC free article] [PubMed] [Google Scholar]
- 15.Chance B, Nioka S, Zhang J, Conant EF, Hwang E, Briest S, Orel SG, Schnall MD, Czerniecki BJ. Breast Cancer Detection Based on incremental Biochemical and Physiological Properties of Breast Cancers: A Six-Year, Two-Site Study. Acad Radiol. 2005;23:925–933. doi: 10.1016/j.acra.2005.04.016. [DOI] [PubMed] [Google Scholar]
- 16.Rinneberg H, Grosenick D, Moesta KT, Mucke J, Gebauer B, Stroszczynski C, Wabnitz H, Moeller M, Wassermann B, Schlag PM. Scanning time-domain optical mammography: detection and characterization of breast tumors in vivo. Technol Cancer Res Treat. 2005;4:483–496. doi: 10.1177/153303460500400503. [DOI] [PubMed] [Google Scholar]
- 17.Taroni P, Danesini G, Torricelli A, Pifferi A, Spinelli L, Cubeddu R. Clinical trial of of time-resolved scanning optical mam mam-mography at 4 wavelengths between 683 and 975 nm. J Biomed Opt. 2004;9:464–473. doi: 10.1117/1.1695561. [DOI] [PubMed] [Google Scholar]
- 18.Pogue BW, Poplack SP, Mcbride TO, Wells WA, Osterman KS, Osterberg UL, Paulsen KD. Quantitative Hemoglobin Tomography with Diffuse Near-Infrared Spectroscopy: Pilot Results in the Breast. Radiology. 2001;218:261–266. doi: 10.1148/radiology.218.1.r01ja51261. [DOI] [PubMed] [Google Scholar]
- 19.Poplack SP, Tosteson TD, Wells WA, Pogue BW, Meaney PM, Hartov A, Kogel CA, Soho SK, Gibson JJ, Paulsen KD. Electromagnetic Breast Imaging: Results of a Pilot Study in Women with Abnormal Mammograms. Radiology. 2007;243:350–359. doi: 10.1148/radiol.2432060286. [DOI] [PubMed] [Google Scholar]
- 20.Choe R, Konecky SD, Corlu A, Lee K, Durduran T, Busch DR, Pathak S, Czerniecki BJ, Tchou J, Fraker DL, Demichele A, Chance B, Arridge SR, Schweiger M, Culver JP, Schnall MD, Putt ME, Rosen MA, Yodh AG. Differentiation of benign and malignant breast tumors by in-vivo three-dimensional parallelplate diffuse optical tomography. J Biomed Opt. 2009;14:024020. doi: 10.1117/1.3103325. [DOI] [PMC free article] [PubMed] [Google Scholar]
- 21.Zhu Q, Cronin E, Currier A, Vine HS, Huang MM, Chen NG, Xu C. Benign versus Malignant Breast Masses: Optical Differentiation using US to Guide Optical Imaging Reconstruction. Radiology. 2005;57:66. doi: 10.1148/radiol.2371041236. [DOI] [PMC free article] [PubMed] [Google Scholar]
- 22.Zhu Q, Hegde PU, Ricci AJ, Kane M, Cronin EB, Ardeshirpour Y, Xu C, Aguirre A, Kurtzman SH, Deckers PJ, Tannenbaum SH. Early-stage invasive breast cancers: potential role of optical tomography with US localization in assisting diagnosis. Radiology. 2010;256:367–78. doi: 10.1148/radiol.10091237. [DOI] [PMC free article] [PubMed] [Google Scholar]
- 23.Fang QQ, Selb J, Carp SA, Boverman G, Miller EL, Brooks DH. Combined Optical and X-ray Tomosynthesis Breast Imaging. Radiology. 2011;258:89–97. doi: 10.1148/radiol.10082176. [DOI] [PMC free article] [PubMed] [Google Scholar]
- 24.Cerussi A, Hsiang D, Shah N, Mehta R, Durkin A, Butler J, Tromberg BJ. Predicting response to breast cancer neoadjuvant chemotherapy using diffuse optical spectroscopy. Proc Natl Acad Sci U S A. 2007;104:4014–4019. doi: 10.1073/pnas.0611058104. [DOI] [PMC free article] [PubMed] [Google Scholar]
- 25.Cerussi A, Shah N, Hsiang D, Durkin A, Butler J, Tromberg BJ. In vivo absorption, scattering and physiologic properties of 58 malignant breast tumors determined by broadband diffuse optical spectroscopy. J Biomed Opt. 2006;11:044005. doi: 10.1117/1.2337546. [DOI] [PubMed] [Google Scholar]
- 26.Tromberg BJ, Shah N, Lanning R, Cerussi A, Espinoza J, Pham T, Svaasand L, Butler J. Non-invasive in vivo characterization of breast tumors using photon migration spectroscopy. Neoplasia. 2000;2:26–40. doi: 10.1038/sj.neo.7900082. [DOI] [PMC free article] [PubMed] [Google Scholar]
- 27.Holboke MJ, Tromberg BJ, Li X, Shah N, Fishkin J, Kidney D, Butler J, Chance B, Yodh AG. Three dimensional diffuse optical mammography with ultrasound localization in a human subject. J Biomed Opt. 2000;5:237–247. doi: 10.1117/1.429992. [DOI] [PubMed] [Google Scholar]
- 28.Srinivasan S, Pogue BW, Carpenter C, Jiang S, Wells WA, Poplack SP, Kaufman PA, Paulsen KD. Developments in Quantitative Oxygen-Saturation Imaging of Breast Tissue In Vivo Using Multispectral-Near-Infrared Tomography. Antioxidants & Redox Signaling. 2007;9:1143–1156. doi: 10.1089/ars.2007.1643. [DOI] [PubMed] [Google Scholar]
- 29.Heffer E, Pera V, Schütz O, Siebold H, Fantini S. Near-infrared imaging of the human breast: Complementing hemoglobin concentration maps with oxygenation images. J Biomed Opt. 2004;9:1152–1160. doi: 10.1117/1.1805552. [DOI] [PubMed] [Google Scholar]
- 30.Grosenick D, Moesta KT, Wabnitz H, Mucke J, Stroszczynski C, Macdonald R, Schalg PM, Rinnerberg H. Time-domain optical mammography: initial clinical results on detection and characterization of breast tumors. App Opt. 2003;42:3170–3186. doi: 10.1364/ao.42.003170. [DOI] [PubMed] [Google Scholar]
- 31.Zhu Q, Tannenbaum S, Hegde P, Kane M, Xu C, Kurtzman SH. Noninvasive monitoring of breast cancer during neoadjuvant chemotherapy using optical tomography with ultrasound localization. Neoplasia. 2008;10:1028–1040. doi: 10.1593/neo.08602. [DOI] [PMC free article] [PubMed] [Google Scholar]
- 32.Zhu Q, Kurtzman S, Hegde P, Tannenbaum S, Kane M, Huang MM, Chen NG, Jagjivan B, Zarfos K. Utilizing optical tomography with ultrasound localization to image heterogeneous hemoglobin distribution in large breast cancers. Neoplasia. 2005;7:263–270. doi: 10.1593/neo.04526. [DOI] [PMC free article] [PubMed] [Google Scholar]
- 33.Kuszyk BS, Corl FM, Franano FN, Bluemke DA, Hofmann LV, Fortman BJ, Fishman EK. Tumor transfort physysiology: implication for imaging and imaging guided therapy. AJR Am R Radiol. 2001;177:747–753. doi: 10.2214/ajr.177.4.1770747. [DOI] [PubMed] [Google Scholar]
- 34.Agrawal G, Su MY, Nalcioglu O, Feig SA, Chen JH. Significance of breast lesion descriptors in the ACR BI-RADS MRI lexicon. Cancer. 2009;115:1363–1380. doi: 10.1002/cncr.24156. [DOI] [PMC free article] [PubMed] [Google Scholar]
- 35.Matsubayashi R, Matsuo Y, Edakuni G, Satoh T, Tokunaga O, Kudo S. Breast masses with peripheral rim enhancement on dynamic contrast-enhanced MR images: correlation of MR findings with histologic features and expression of growth factors. Radiology. 2000;217:841–848. doi: 10.1148/radiology.217.3.r00dc07841. [DOI] [PubMed] [Google Scholar]
- 36.Zhu Q, Chen NG, Kurtzman S. Imaging tumor angiogenesis using combined near infrared diffusive light and ultrasound. Opt Lett. 2003;28:337–339. doi: 10.1364/ol.28.000337. [DOI] [PMC free article] [PubMed] [Google Scholar]
- 37.Amelink A, Christiaanse T, Sterenborg HJ. Effect of hemoglobin extinction spectra on optical spectroscopic measurements of blood oxygen saturation. Opt Lett. 2009;34:1525–1527. doi: 10.1364/ol.34.001525. [DOI] [PubMed] [Google Scholar]
- 38.Cope M. PhD Dissertation. University College London; 1991. The Application of Near Infrared Spectroscopy to Non-invasive Monitoring of Cerebral Oxygenation in the Newborn Infant. [Google Scholar]
- 39.McBride TO, Pogue BW, Gerety ED, Poplack SB, Osterberg UL, Paulsen KD. Spectroscopic diffuse optical tomography for the quantitative assessment of hemoglobin concentration and oxygen saturation in breast tissue. App Opt. 1999;38:5480–5490. doi: 10.1364/ao.38.005480. [DOI] [PubMed] [Google Scholar]
- 40.Heffer EL, Fantini S. Quantitative oximetry of breast tumors: a near-infrared method that identifies two optimal wavelengths for each tumor. App Opt. 2002;41:3827–3839. doi: 10.1364/ao.41.003827. [DOI] [PubMed] [Google Scholar]
- 41.Xu Y, Zhu Q. Imaging Heterogeneous Absorption Distribution of Advanced Breast Cancer by Optical Tomography. J Biomed Opt. 2010;15:066007. doi: 10.1117/1.3505015. [DOI] [PMC free article] [PubMed] [Google Scholar]
- 42.Xu C, Zhu Q. Light shadowing effect of large breast lesions imaged by optical tomography in reflection geometry. J Biomed Optics. 2010;15(1-16):036003. doi: 10.1117/1.3431086. [DOI] [PMC free article] [PubMed] [Google Scholar]


