Abstract
The level at which implanted sensors and sampling devices maintain their calibration is an important research area. In this work, microdialysis probes with identical geometry and different membranes, polycarbonate/polyether (PC) or polyethersulfone (PES), were used with internal standards (vitamin B12 (MW 1355), antipyrine (MW 188) and 2-deoxyglucose (2-DG, MW 164)) and endogenous glucose to investigate changes in their long-term calibration after implantation into the subcutaneous space of Sprague-Dawley rats. Histological analysis confirmed an inflammatory response to the microdialysis probes and the presence of a collagen capsule. The membrane extraction efficiency (percentage delivered to the tissue space) for antipyrine and 2-DG was not altered throughout the implant lifetime for either PC- or PES-membranes. Yet, Vitamin B12 extraction efficiency and collected glucose concentrations decreased during the implant lifetime. Antipyrine was administered i.v. and its concentrations obtained in both PC-and PES-membrane probes were significantly reduced between the implant day and seven (PC) or 10 (PES) days post implantation suggesting that solute supply is critical for in vivo extraction efficiency. For the low molecular weight solutes such as antipyrine and glucose, localized delivery is not affected by the foreign body reaction, but recovery is significantly reduced. For Vitamin B12, a larger solute, the fibrotic capsule formed around the probe significantly restricts diffusion from the implanted microdialysis probes.
Keywords: Antipyrine, Calibration, Foreign body reaction, Glucose, In vivo microdialysis sampling
1. Introduction
Implantable chemical sensors and drug delivery devices have promising utility for continuous disease monitoring and therapy [1–3]. For any implanted sensor and/or device used for in vivo measurements, the analytical performance is a crucial parameter to investigate. Prior to implantation, devices are typically calibrated in vitro to determine their approximate in vivo performance. However, ultimately, what is most important is to elucidate device calibration in vivo as this is often the desired and relevant analytical figure of merit during real-time chemical monitoring.
All implanted sensors and/or devices initiate an immune response [4–5]. This foreign body reaction has shown to be independent of implant size and material [6]. During the foreign body response, the long-term outcome is a fibrotic capsule, which can severely interfere with the device performance, particularly calibration [7–10]. To improve device performance, there has been extensive interest in different strategies aimed towards achieving more reliable function including calibration [11]. These strategies have included developing materials with different surface chemistries, [12], porosity [13,14], pre-adsorbing mediator proteins [15], release of bioactive agents to affect the immune response [16–19], and genetic engineering aimed towards angiogenesis promotion [20]. How these processes ultimately alter sensor function or device collection capability and in vivo calibration is still an active research area.
Microdialysis sampling is a well-established in vivo collection method [21,22]. It has been applied to collecting glucose from the subcutaneous space [23,24]. An important technical aspect of microdialysis sampling is that it allows for continuous collection from the tissue space and can also be used to simultaneously deliver chemical components to the tissue space. Dialysates are generally analytically-clean and require little to no pretreatment prior to chemical analysis.
The calibration of the microdialysis probe is obtained by evaluating its extraction efficiency (EE, Eq. 1). Under steady-state conditions, the EE is a function of the inlet (Cinlet)
| (Eq.1) |
and outlet (Coutlet) concentration of the analyte, as well as the analyte concentration far from the probe (Csample) [25,26]. Internal standards can be infused to calibrate the probes during a long-term implantation. Since the internal standards are not endogenous to the tissue space, Csample has a zero value. The EE becomes the ratio of the difference between the inlet and outlet concentration to the inlet concentration, which reflects the uptake of the standards from the perfusate into the tissue space. Usually the values from this ratio are expressed as a percentage and can be denoted as EE%, i.e., EE is multiplied by 100. The amount of material lost across the probe or its delivery is a function of important tissue properties including metabolism and capillary permeability/uptake [27]. Thus, the microdialysis sampling device along with appropriate choices of test analytes may be used to investigate alterations to different tissue parameters that may change during the foreign body reaction.
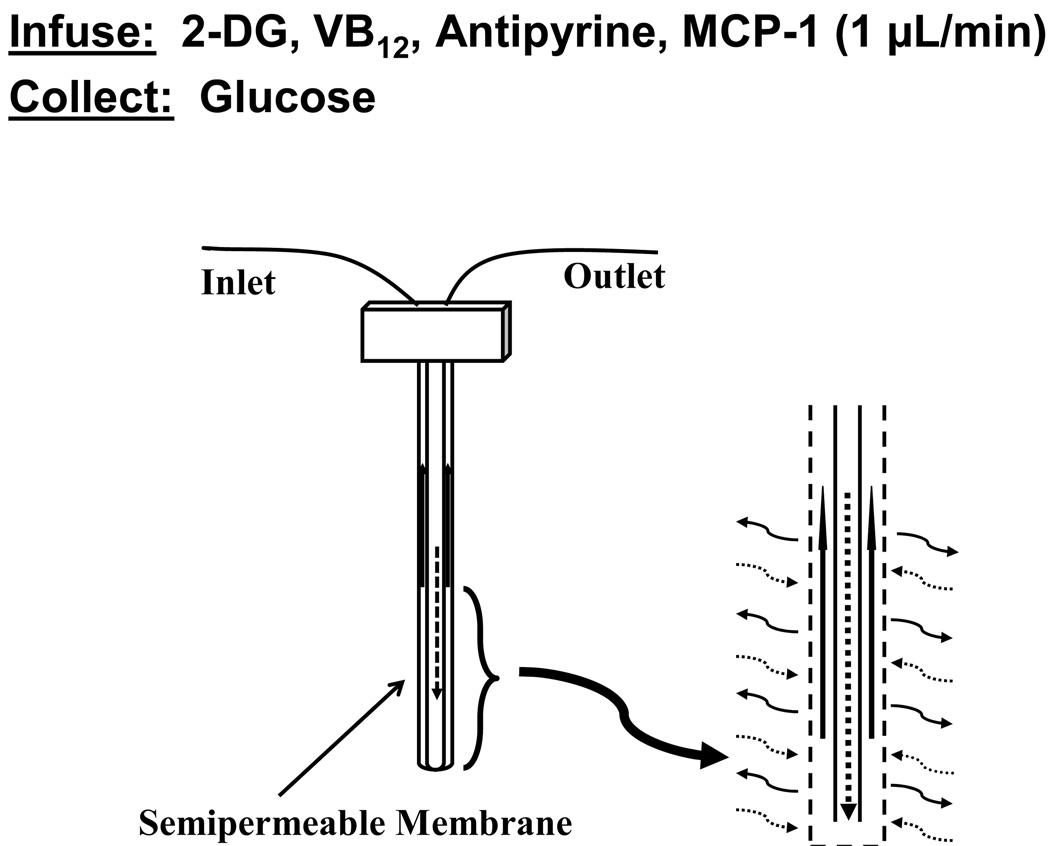
Figure 1 shows a schematic overview of this work with respect to the use of the microdialysis probes. To determine how calibration may be affected by potential alterations in metabolism and capillary permeability during the long-term implantation, three internal standards were perfused through the implanted microdialysis probes. The compound 2-deoxyglucose (2-DG) is widely used in studies for glucose metabolism and has been used to determine the variation of glucose in the presence of active macrophages [28,29]. Antipyrine rapidly equilibrates in the extracellular fluid of tissues and has been widely used as a marker for capillary permeability and has been used as an internal standard during microdialysis sampling [30,31]. Vitamin B12 has also been used as a capillary permeability tracer and provides additional information about alterations in tissue properties that may affect diffusion as it is larger than antipyrine [32].
Figure 1.
Schematic of the microdialysis sampling process.
For any implanted device especially sensing devices, the capsule that forms due to the foreign body response represents an additional layer through which the targeted analyte must diffuse prior to reaching the collection or detection site. This diffusion barrier, coupled with potential changes in vascular exchange within the collagen layer, has been systematically described in a series of papers from Reichert’s group [33–35]. This research field is complicated by the difficulty in devising experimental protocols that allow for systematically investigating how the foreign body response may affect collection or detection of analytes to an implanted device.
The primary goal of this study was to determine how the induction of the foreign body response affects microdialysis probes since their EE is highly dependent on different physicochemical parameters within the tissue space. In this study, two types of microdialysis probes with similar geometry, but different membrane chemistry (polycarbonate/polyether (PC) and polyethersulfone (PES)) were used.1 The main objective was to determine how the calibration of each of the targeted analytes changes as a function of implantation time and not the difference between the two membrane materials. The PC probes are commonly used to collect hydrophilic low molecular weight solutes because of their 20 kDa molecular weight cut off (MWCO). PES probes have nearly identical geometry as the PC probes, but possess a 100 kDa molecular weight cut off (MWCO) semi-permeable membrane to allow collection of large molecular weight solutes such as peptides and proteins [36].
To allow for sample collection on a daily basis as well to prevent concerns of anesthetic effects, an awake- and freely-moving animal system was used. For each experiment, two probes with identical membrane chemistry (PC or PES) were implanted into the subcutaneous space of the rat to allow comparisons between sampling frequency time in the same animal for the different internal standards. Finally, the histology of the fibrotic capsule surrounding the explanted PC and PES microdialysis probes was determined.
2. Materials and Methods
2.1 Chemicals
2.1.1. Microdialysis Perfusion Fluid
Antipyrine, glucose, and vitamin B12 (VB12) were obtained from Sigma-Aldrich (St. Louis, MO). 2-deoxyglucose (2–DG, 99%) was obtained from Acros Organics (Morris Plains, NJ). All other reagents were analytical grade or better. Phosphate-buffered saline solution (PBS, pH 7.2) containing sodium chloride (NaCl, 137 mM), potassium chloride (KCl, 2.7 mM), sodium phosphate dibasic (Na2HPO4, 8.1 mM), and potassium phosphate monobasic (KH2PO4, 1.5 mM) in HPLC grade water was used for all perfusion fluids and was also used as the solvent for dilution of standards.
2.1.2. Detection System (LC) Chemicals
Barium acetate (Ba(OAc)2, 99% was obtained from Fisher Scientific (Pittsburgh, PA) and sodium hydroxide (NaOH) from Mallinckrodt Baker, Inc.(Paris, KY, USA). HPLC grade water, acetonitrile, and sodium dihydrogen phosphate were (NaH2PO4) purchased from Fisher Scientific (Fair Lawn, NJ).
2.1.3. Histological Analysis Chemicals
Absolute ethyl alcohol was obtained from Pharmco (Brookfield, CT). Citrosolv and para-formaldehyde (4% PFA in PBS) were obtained from Fisher Scientific (Fair Lawn, NJ). Paraffin was obtained from Kendall (UK). A Masson’s Trichrome Staining kit was used (American Master Tech Scientific, Lodi, CA).
For immunofluorescence labeling, tissue were fixed using Tissue-Tek optimum cutting temperature (O.C.T.) compound (Sakura, Japan). The following antibodies were used: Monoclonal Anti-α Smooth Muscle Actin Clone 1A4 (Sigma-Aldrich, St. Louis, MO), Anti Rat Monocytes / Macrophages & Dentritic Cells ED1 (Accurate Chemical & Scientific Corp. Westbury, NY), Alexa (488) Labeled Goat Anti-mouse IgG Antibody (Invitrogen, LtD. Paisley, UK), IgG2a and IgG1 (non-conjugated, Santa Cruz Biotechnology, Santa Cruz, CA). The antibodies were diluted using solutions prepared with nonfat dry milk (Nestle, Glendale, CA), 10% goat serum (Sigma-Aldrich, St. Louis, MO), and Tween 20 (enzyme grade, Fisher Scientific, Fair Lawn, NJ).
2.2 Separation and Detection Systems
2.2.1 Glucose and 2-Deoxyglucose
An ion-exchange chromatography column (CarboPac PA1, Dionex) was used for separations followed by pulsed amperometric detection (IC-PAD). An LC-10AD pump (Shimadzu) and an amperometric detector from ANTEC Leyden (DECADE, Antec Leyden, The Netherlands) was used in the analysis of glucose and 2-DG and has been previously described [26].
Standards containing glucose and 2-DG (20, 40, 60, 80, and 100 µM) were used to calibrate the IC-PAD system every working day. Dialysate samples were diluted by taking 5 µL of dialysate to which 495 µL of dialysis perfusion fluid was added. From this sample, 25 µL was used for the analysis.
2.2.2 Vitamin B12 and antipyrine
Vitamin B12 and antipyrine were quantified directly from dialysates (25 µL) without any sample pretreatment using an Aqua C18 column (125Å, 150 × 2 mm, Phenomenex, Torrance, CA) with a Shimadzu HPLC system consisting of an SIL-10ADvp autoinjector, a LC-10ADvp pump, a DGU-14A degasser, a CTO-10ASvp column oven, and an SCL-10Avp system controller, and an UV-VIS detector (SPD-10AVvp). The mobile phase consisting of 23:77% (v:v) acetonitrile in 0.05 M phosphate buffer, pH 2.7 was pumped at 0.1 mL/min. Standard solutions consisting of 20, 40, 60, 80, and 100 µM of antipyrine and VB12 were prepared daily.
2.3 Microdialysis Sampling Experiments
All microdialysis experiments (in vitro and in vivo) were performed using a CMA microdialysis pump with 1-mL syringes. CMA/20 microdialysis probes with either a 10 mm polycarbonate/polyether (PC) membrane and 20-kDa molecular weight cutoff (MWCO) or a 10 mm polyethersulfone (PES) membrane (MWCO 100-kDa) (CMA Microdialysis, Inc., North Chelmsford, MA) were used.
For the in vitro calibration, three microdialysis probes (PC and PES) were calibrated by perfusing at 1 µL/min internal standards (100 µM VB12, 100 µM antipyrine and 5 mM 2-DG) through a probe immersed into a quiescent PBS solution containing 5 mM glucose (37 °C). The samples were collected every 30 minutes for 3 hours. A total of 3 probes combined with 6 dialysates from each probe were collected for a total of n=18 samples per membrane type, PC or PES.
Male Sprague-Dawley rats (210–270 g) were purchased from Taconic (Taconic, NY). The rats had free access to food and water and were subjected to a 12-hr on/off light cycle. All surgical protocols were approved by the Albany Medical College IACUC committee and meet the NIH guidelines for care and use of experimental animals. Before implantation, the surgical tools were autoclaved, and the microdialysis probes were perfused with 70% ethanol followed by sterile water in a biosafety cabinet. Animals were anaesthetized using isoflurane in a fume hood. Six animals were used for each data set with each microdialysis membrane type. Each animal was implanted with two probes that had identical membrane chemistry (PC or PES).
One the day of implantation (day 0), two PC or PES microdialysis probes were implanted in the dorsal subcutaneous tissue of the rats, one probe on each side of the spine, approximately 5 cm apart. Probes were implanted by making a small incision with a scalpel followed by introduction of the microdialysis probe into the subcutaneous space using the accompanying needle introducer provided by the manufacturer. A perfusion fluid containing phosphate buffered saline (PBS) supplemented with VB12 (100 µM), 2-DG (5 mM) and antipyrine (100 µM) was delivered (1 µL/min) through the implanted probe. Prior to use, this perfusion fluid was filtered through a sterile filter (0.2µm, Corning, Germany) in a biosafety cabinet.
Probes were randomized in terms of denoting the left or right side as either a control or daily-perfused probe. In each set of six animals, the control probe was placed on the left in three animals and the right in the other three. After implantation of the dialysis probes, the rat was connected to the tubing lines and swivel system of the freely-moving CMA/120 animal system.2 The probes were then flushed with the perfusion fluid at a rate of 5 µL/min for 5 minutes to ensure the fluid lines were full and cleared; the flow was then reduced to 1 µL/min. Following a 10 minute equilibration, dialysates were collected every 30 minutes for three hours. For animals with PC probe implants, one probe (daily-perfused probe) was perfused with internal standards on the day of implantation (Day 0), and again on days 3, 4, 5, 6 and 7. The second probe with a PC membrane (control probe) was only perfused on days 0, 3 and 7. However in animals with PES membrane probe implants, both probes were infused with internal standards on days 0, 3, 5, 7, 10, and 12.
2.3.1. In Vivo Sampling after i.v. Antipyrine Injection
In two sets of three rats each (140–160g), two microdialysis probes with identical membrane chemistry (PC or PES) were implanted into the dorsal subcutis while the rats were under isoflurane anesthesia. After implantation, the probes were perfused with a sterile saline solution for 5 minutes at 5 µL/min, and then perfused with a flow rate of 1 µL/min for 10 minutes. After this initial wash, baseline dialysates were collected every 15 minutes. Antipyrine (0.1g/mL in sterile saline) was injected i.v. (jugular vein) to achieve a concentration of 20 µg antipyrine per gram weight for each rat [31]. Dialysate collection began immediately after the i.v. injection and six samples were collected over 1.5 hr (15 µL samples collected at 15 min intervals). Following sample collection, the animals were revived and returned to the animal facility. For animals with PC probe implants, the collection of antipyrine was repeated 7 days later; for animals with PES probes, the collection was repeated at 10 days. The 7 and 10 day times were chosen to maximize the implant time while minimizing probe failures as PES probes proved to be far more long-lived than PC probes.
2.4 Histology
After the completion of the sampling protocol, the microdialysis probes were explanted with their capsule intact, embedded in paraffin, and stained using Masson’s Trichrome [37]. To prepare the paraffin sections, the tissue (with the microdialysis probe inside) were dehydrated in ethanol (70%, 85%, 90%, 100% over two hr) and followed by formaldehyde fixation (overnight, 4°C). Then, samples were infiltrated with a Citrosolv and paraffin mixture (1 hour) and embedded with paraffin (3 × 1 hour) using an EG 1160 Embedding apparatus (Leica, Wetzlar Germany). The embedded tissue was cut into 6 µm sections (Leica PM 2135) and the sections were floated in a flotation bath (Fisher Scientific, Fair Lawn, NJ), placed onto Superfrost® slides, and the sections dried onto the slides using a slide warmer (Fisher Scientific, Fair Lawn, NJ). For staining, slides were deparaffinized, rehydrated and stained with Masson’s Trichrome according to manufacturers’ instructions (American Master Tech Scientific (Lodi, CA).
2.5 Immunofluorescence
For immunofluorescence, the explanted capsule containing the probe was embedded in O.C.T (Optimal Cutting Temperature, Tissue-Tek) and 6 µm sections placed on Superfrost® slides. Briefly, O.C.T. was removed by soaking slides soaked in 0.02% Tween 20/PBS for 10 minutes (×2), sections were blocked (5% nonfat dry milk, 10% goat serum, 0.02% Tween 20 in PBS, 1 h), and washed using (0.02% Tween 20 in PBS). The sections were stained for smooth muscle cells (Anti-α Smooth Muscle Actin IgG 2a Clone 1A4, 1:500) and macrophages (Anti-Rat CD68, IgG 1 clone ED1, 1:1000) for 1 h; IgG 2a and IgG1 isotype controls were run in parallel and had no staining. Slides were washed three times (0.02% Tween 20 in PBS) and primary antibodies visualized with Alexa 488-conjugated Goat Anti-mouse IgG 1:1000. Staining was performed at room temperature. Positive staining was visualized using an Olympus IX50 microscope fitted with a Chroma ENGFP-41017 filter (ex 470 nm, em 525 nm band pass) optimized for detection of Alexa 488.
2.6 Statistical Analysis
All the statistical analysis was performed using GraphPad Prism 4.00. The EEs for each internal standard and the glucose concentrations in the dialysates were grouped by their sampling date, and then compared among the collection time points (6 rats at each collection point on each sampling day for each analyte) using ANOVA for repeated measures. The ANOVA was applied among all the sampling days and between the control and daily perfused probes. In some cases, a post-test (Tukey’s Test) to compare all pairs of sampling days was applied. The corresponding non-parametric repeated ANOVA, the Friedman's Test and Dunn’s Post-test, were also performed on all the analytes from both PC and PES probes to confirm the results by ANOVA for repeated measures, which relies on the assumption that the data has a normal distribution.
2.7 Scanning Electron Microscopy
The probes were cut into 5 mm pieces and coated with gold and palladium under high vacuum. Images of the prepared samples were obtained using a JEOL JEM-840 scanning electron microscope (SEM).
3. Results
3.1 In vitro calibration of microdialysis probes
The collected in vitro EE values were as follows: antipyrine (PC, 70 ± 5 %; PES, 86 ± 7 %, n=18); 2-DG (PC, 72 ± 5 %; PES, 79 ± 6 %, n=18); glucose (PC, 68 ± 4 %; PES, 80 ± 7, n=18) and Vitamin B12 (PC, 32 ± 3% PES, 39 ± 6 %, n=18). These results are expected for the similarity in molecular weight for the antipyrine, 2-DG, and glucose as well as the higher molecular weight of Vitamin B12.
3.2. Test for infusion of 2-DG concentrations
A randomized trial of 2-DG infusion concentrations between 2 and 10 mM showed no significant difference in recovered glucose concentrations (Table 1). Additionally, there were no significant differences in the 2-DG EE among the different concentrations perfused.
Table 1.
Delivery (EE%) of 2-deoxlyglucose and collected glucose concentration (mM) from PC Probes.
| Animals | Rat A | Rat B | Average (n=12) |
|||
|---|---|---|---|---|---|---|
| C2-DG (mM) | Analytes | 1 (n=3) | 2 (n=3) | 2 (n=3) | 1 (n=3) | |
| 10 | 2-DG (EE%) | 45±6 | 62±3 | 45±4 | 48±7 | 49±10 |
| CGlucose (mM) | 4.4±0.3 | 3.8±0.5 | 4.1±0.5 | 4.8±0.3 | 4.4±0.6 | |
| 5 | 2-DG (EE%) | 52±3 | 60±4 | 49±5 | 46±5 | 52±8 |
| CGlucose (mM) | 4.3±0.1 | 4.4±0.1 | 3.9±1.0 | 4.1±0.8 | 4.2±0.5 | |
| 2 | 2-DG (EE%) | 57±8 | 62±3 | 55±4 | 50±5 | 55±7 |
| CGlucose (mM) | 4.4±0.6 | 4.1±0.8 | 4.9±0.8 | 4.7±0.7 | 4.6±0.7 | |
Two PC microdialysis probes were implanted into the dorsal subcutaneous space of each rat and perfused at 1 µL/min. The numbers 1 and 2 in the left and right hand columns denote the order of infusion with 1 being from low to high concentration and 2 being high to low concentration. The position in the table denotes which side of the spine that probe was implanted into the subcutaneous tissue. The average denotes a pooled data set from 12 probes.
3.3 In vivo Calibration of Implanted Polycarbonate Microdialysis Probes
An ANOVA analysis was performed on all the EE values obtained at the different time points (30–180 min) for antipyrine, 2-DG, VB12. This ANOVA analysis showed no significant difference among the EE values among the collected time points for each of the internal standards within any sampling day at the 90% confidence level. Additionally, ANOVA analysis showed no significant differences among the EE values obtained within the sampling days, e.g., implantation day, day 3, etc. Using this information, the assumption of steady-state EE values for the internal standards and the glucose concentrations during the three-hour in vivo microdialysis sampling process was used allowing the individual concentrations collected six collection time points from each animal to be pooled and averaged.
The EEs of the three internal standards from the implanted probes along with the collected glucose concentrations in the dialysate are listed in Table 2. For the daily-perfused probes (DPP), the delivery (EE) of Vitamin B12 significantly decreased from 26 ± 4% on the acute day to 10 ± 5% (p<0.005, n=36 from 6 rats) on day 7. The EEs of antipyrine and 2-DG varied within the range of 50–60%. The glucose concentration (absolute concentrations, not corrected for EE) in the dialysates decreased significantly from 4.8 ± 0.9 mM to 1.3 ± 0.6 mM (p<0.005, n=36 from 6 rats) during the 7-day implantation.
Table 2.
Delivery (EE%) of vitamin B12, antipyrine and 2-deoxlyglucose, and collected glucose concentration (mM) from PC probes.
| VB12 (EE %) | Antipyrine (EE %) | 2-DG (EE %) | Glucose (mM) | |||||
|---|---|---|---|---|---|---|---|---|
| Probe | DPP | CP | DPP | CP | DPP | CP | DPP | CP |
| Day 0 | 26±3 | 29±4 | 56±7 | 59±6 | 53±12 | 53±11 | 4.8±0.6 | 4.4±0.8 |
| Day 3 | 21±2 | 19±3 * | 61±7 | 57±5 | 54±7 | 51±8 | 3.6±0.8 | 3.8±0.7 |
| Day 4 | 17±7 | 62±5 | 53±6 | 3.1±1.0 * | ||||
| Day 5 | 17±7 | 59±3 | 52±13 | 2.9±1.0 * | ||||
| Day 6 | 13±10 ** | 58±7 | 52±11 | 2.0±1.3** | ||||
| Day 7 | 11±6 **† | 9±5 **† | 58±4 | 54±3 | 49±7 | 49±8 | 1.3±0.5**† | 1.5±1.2**† |
Two PC microdialysis probes were implanted per rat into the dorsal subcutaneous space, n=6 rats. The control probe (CP) was perfused with 100 µM VB12, 100 µM antipyrine and 5 mM 2-DG on day 0, day 3 and day 7 at 1 µL/min. Samples were collected every 30 min for 3 hrs (n=6). The daily-perfused probe (DPP) was perfused with the same solutions on day 0 and day 3 through day 7. Data represent mean ± SD, n=6 (average of 6 samples from 6 rats).
Significant differences from Day 0 at the p< 0.05
and p < 0.01 were determined using the repeated measurements of ANOVA.
denotes p <0.001 as compared to Day 0 (acute day) using non-parametric repeated ANOVA.
The ANOVA for repeated measures was applied to EE values obtained from the internal standards as well as the glucose concentrations from all the sampling days and between the control and daily perfused probes. No significant difference in either EEs of standards or concentration of collected glucose was observed between the control probes and the daily perfused probes on either sampling days for all the analytes. The EE values for 2-DG and antipyrine did not give a significant p value at 95% confidence level, but the delivery of Vitamin B12 and the collection of glucose gave p values less than 0.0001. Using a Tukey’s test to compare all pairs of sampling days for Vitamin B12 and glucose indicated that both daily perfused and control probes showed significantly lower (**, p<0.01) EE (VB12) and concentrations (glucose) values on day 7 than those from day 0. The control probe also gave significantly lower delivery of Vitamin B12 on day 3 (*, p<0.05).
3.4 In vivo Calibration of Implanted Polyethersulfone (PES) Microdialysis Probes
The PES probes (100 kDa MWCO) were calibrated using the same internal standards (VB12, antipyrine and 2-DG) up to 12 days post implantation. After implantation, the PES probes remained viable at least three days longer than the PC probes. Of the six probes, two failed after day 10, and the other four failed after day 12. Table 3 includes the internal standard EE values and the collected glucose concentrations from the PES probes for each sampling day.
Table 3.
Delivery (EE%) of vitamin B12, antipyrine and 2-deoxlyglucose, and collected glucose concentration (mM) from PES probes.
| VB12 (EE %) | Antipyrine (EE %) | 2-DG (EE %) | Glucose (mM) | |
|---|---|---|---|---|
| Day 0 | 28±4 | 60±9 | 52±11 | 4.5±0.7 |
| Day 3 | 23±3 | 67±7 | 61±8 | 4.9±0.8 |
| Day 5 | 20±3 * | 63±7 | 61±5 | 3.6±0.5 |
| Day 7 | 16±4 ** | 64±6 | 57±4 | 3.3±0.5 |
| Day 10 | 11±3 **† | 60±7 | 45±9 | 2.1±1.0**† |
|
††Day 12 (n=3) |
8±4 | 59±6 | 44±5 | 1.3±0.6 |
Two similar PES probes were implanted into the subcutaneous space of 3 rats (one on each side of the spine). Probes were perfused with 100 µM VB12, 100 µM antipyrine and 5 mM 2-DG at 1 µL/min for 3 hours to collect samples every 30 minutes.
denotes that 3 probes failed between Day 10 and Day 12. The remaining 3 probes failed after Day 12. Data represent mean ± SD, n=6. Data represent mean ± SD, n=6 (average of 6 samples from 6 probes).
Significant differences from Day 0 at the p< 0.05
and p < 0.01 were determined using the repeated measurements of ANOVA.
denotes p <0.001 as compared to Day 0 (acute day) using non-parametric repeated ANOVA.
The ANOVA for repeated measures revealed that, for both the PES and PC probes, an assumption of steady state during the sampling period within a day is valid. Since the repeated measurements requires paired data groups, the results from day 12 (3 rats instead of 6 rats) were not included in the comparison. No significant difference was obtained for the 2-DG or antipyrine delivery (EE). Tukey’s Post-test for those giving significant p values was also applied to the VB12 and glucose data. The delivery of VB12 was significantly lower by day 5 as compared to day 0. The glucose concentration collected in the dialysate showed a significant difference on the last sampling day as compared to the implantation day.
3.5 Pharmacokinetic Analysis
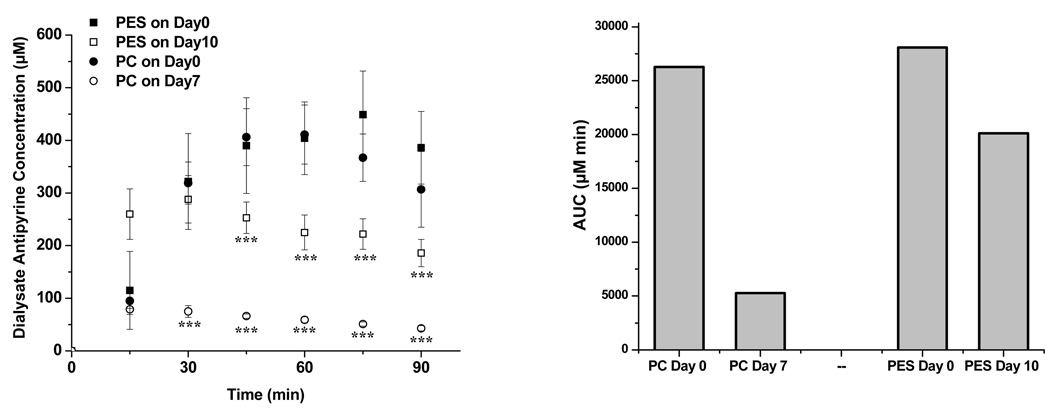
Figure 2a shows the antipyrine concentrations obtained during the pharmacokinetics experiments for acutely implanted microdialysis probes (day 0) vs. those implanted for 7 (PC) or 10 days (PES). A maximum antipyrine concentration was observed for both types of probes at approximately 60 minutes post-injection. At day 0, both probe materials collected similar concentrations of antipyrine among the different time points as shown in the kinetic curves in Figure 2a as well as the area under the curve (AUC) comparisons shown in Figure 2B. However, antipyrine concentrations collected into the microdialysis sampling probe were reduced with significance during the analysis performed on the day prior to the probe being explanted (7 days for PC; 10 days for PES). The antipyrine concentration obtained from the 7-day implanted PC probes was significantly lower (75 ± 11 µM, n=6) (***, p<0.001) than from the freshly implanted probes (319 ± 40 µM, n=6) at 30 minutes post-injection. For PES membranes, the 10-day implanted, the 30 min antipyrine concentrations were 288 ± 45 µM vs. 322 ± 91 µM, n=6, which were not significantly different. However, a significant difference (p < 0.001) in collected concentrations began at 45 min for the PES probes. The mean AUC difference for the PES probes between Day 0 and Day 10 is not as significantly reduced as with the PC probes.
Figure 2.
(Left) Dialysate antipyrine concentrations (µM) from implanted PES and PC probes after i.v. (20 mg/kg weight) injection of antipyrine from PES (Day 0 ■, Day 10 □) and PC probes (Day 0 ●, Day 7 ○), (n=6). The symbol *** represents a significant difference at 99.9% confidence level between days. (Right) Mean area under the curve (AUC) for each probe treatment group.
3.6 Microdialysis Probe Histological Analysis. Comparison of 5 vs. 7 days
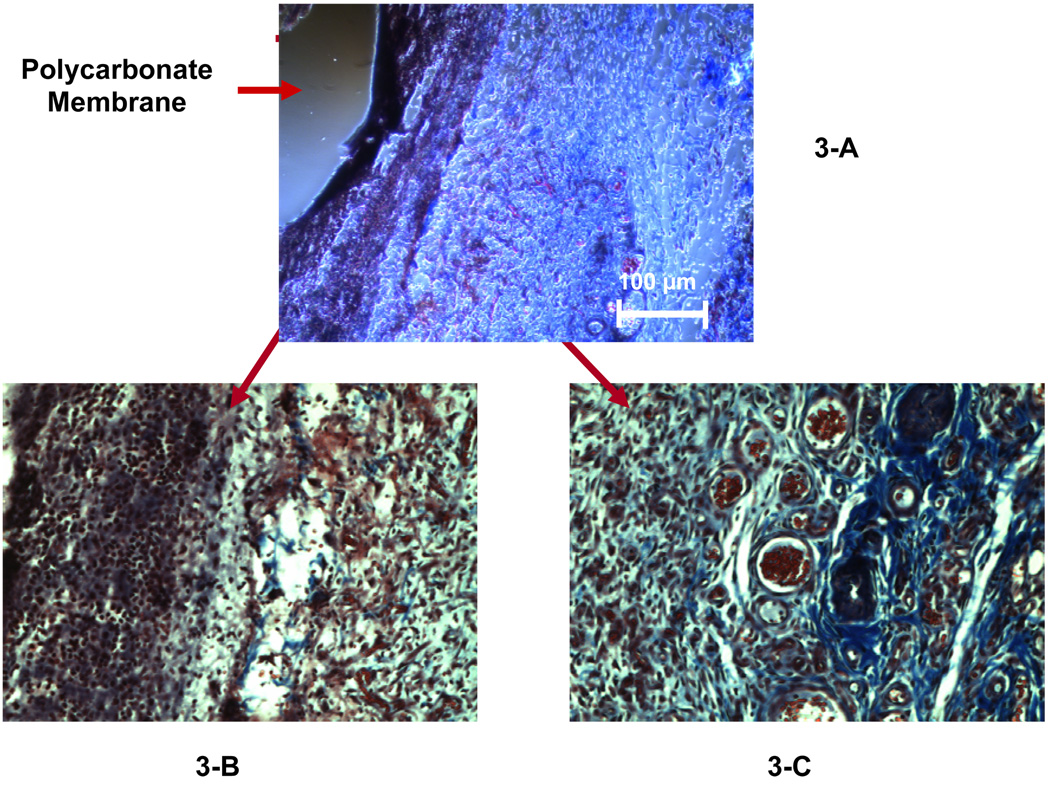
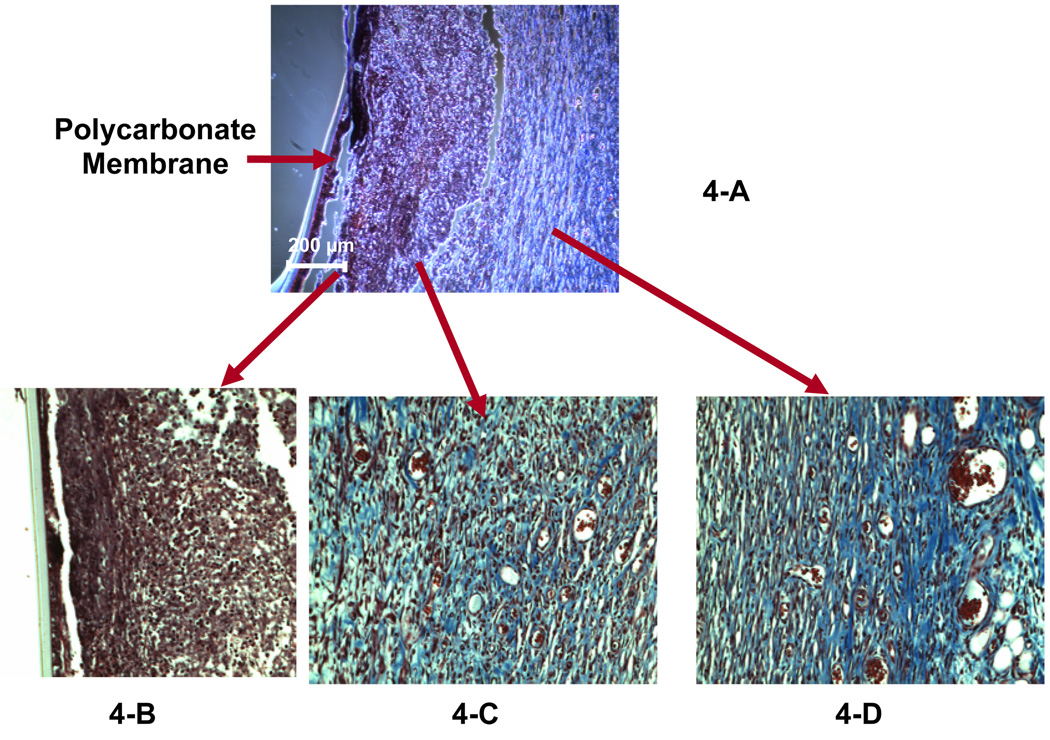
Figure 3 and Figure 4 show the Masson’s trichrome staining for the tissue surrounding the PC probes explanted on days 5 and 7, respectively. The PC probes explanted on day 5 (Figure 3-A) and day 7 (Figure 4-A) were encapsulated by a compact layer of cells (indicated by the black-stained nuclei) surrounded by a layer of collagen (shown as blue stain in the enlarged figures, Fig 3-C and Fig 4-C). The cellular inner layer surrounding 7-day implanted probe is approximately 3 times thicker than that of the 5-day probe (75–100 µm, Figure 4-B vs 20–30 µm, Figure 3-B). The collagen layer (blue in Fig. 3C) contains numerous capillaries (vessels filled with red blood cells) forms the outer layer of the capsule for the 5-day implanted microdialysis probes. Compared to the 5-day explant, the capsule surrounding the 7-day probes has a transitional layer (Figure 4-C, 20× objective) consisting of a large amount of collagen and small blood vessels; the outer layer containing many blood vessels is similar in 5 and 7-day capsules between the inner layer and the very outer layer (Figure 4-D, Figure 20× objective).
Figure 3.
Masson’s trichrome staining on the explanted tissue surrounding the 5-day implanted microdialysis probe (PC membrane). Figure 3-A was observed using a 10× objective. A 20× objective was used to obtain Figures 3-B and 3-C, which display the inner layer and the outer layer of the capsule, respectively.
Figure 4.
Masson’s trichrome staining on the explanted tissue surrounding the 7-day implanted microdialysis probe (PC membrane). Figure 4-A was observed using a 10× objective. A 20× objective was used to obtain Figures 4-B, -C and –D, which display the inner layer, the middle transition layer and the outer layer of the capsule, respectively.
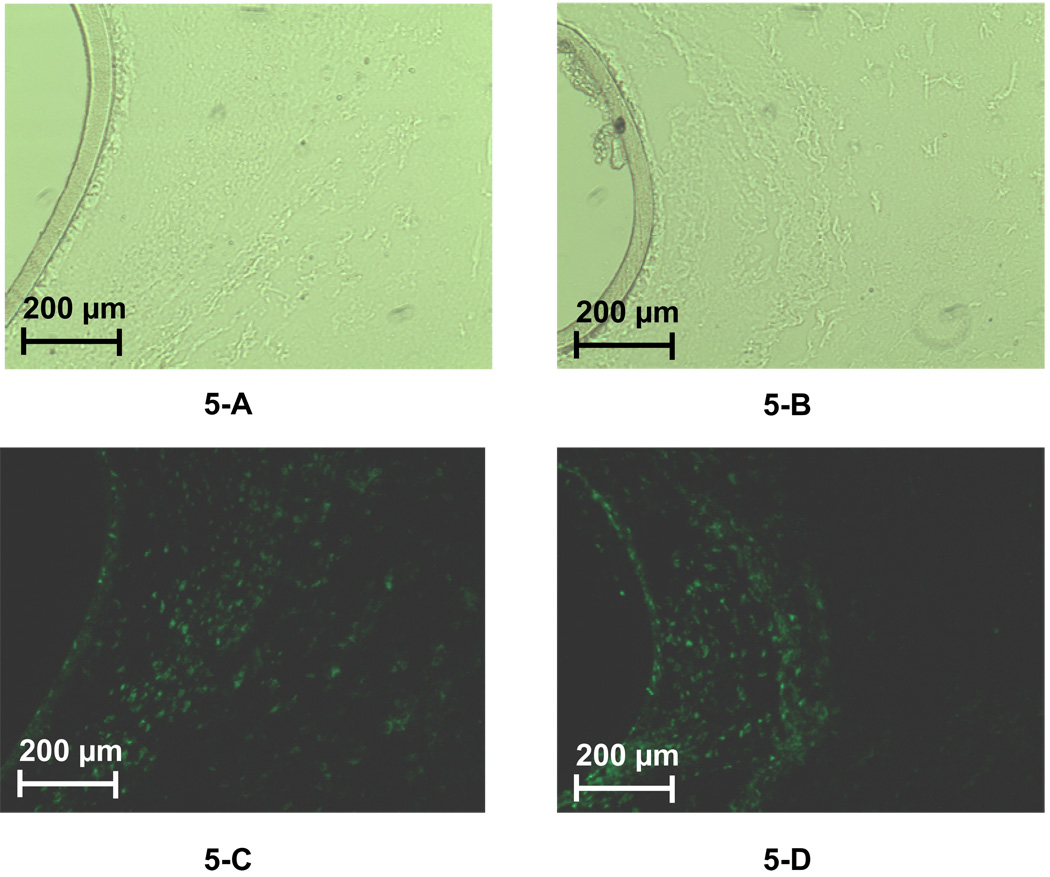
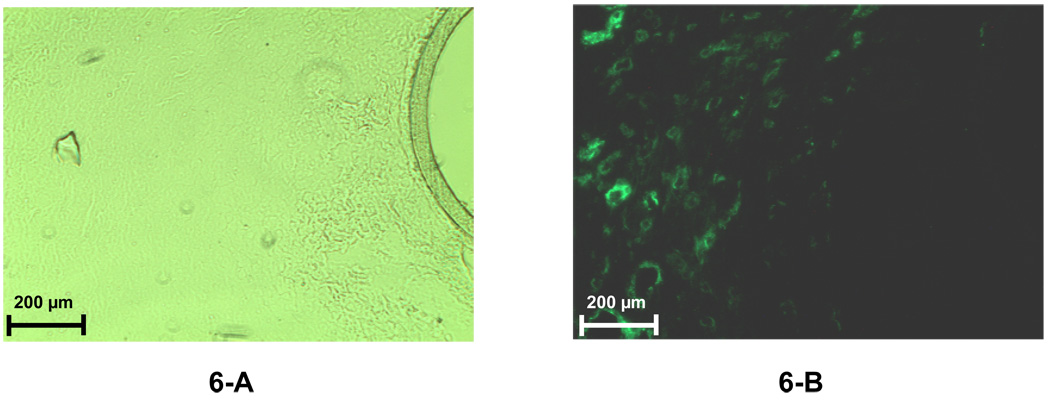
Immunoflourescence was used to identify the cells present in the capsule surrounding the PC probe. At day 5, CD68+ cells (macrophages) are present in a band ∼ 200 µm from the probe (Figure 5-C). By 7 days, the macrophages have infiltrated the capsule and were present in the region adjacent to the probe (Figure 5-D. In contrast, smooth muscle cells do not appear in significant numbers until day 7 (Figure 6-A & 6-B) and reside in the collagen-rich region identified by trichrome staining (Fig. 4-C)
Figure 5.
Immunofluorescence of labeled macrophages in the tissue space surrounding the membrane of 5-day (5-A and 5-C) and 7-day (5-B and 5-D) implanted microdialysis probes (PC membrane). A 20× objective was used for all the images. For each fluorescence image, there is a paired image taken under normal light with the same magnification to reveal the location of the probe membrane. Figure 5-A and 5-B were obtained using a normal microscope lamp. Figures 5-C and 5-D were obtained using the fluorescence lamp with a filter.
Figure 6.
Immunofluorescence labeled fibroblasts in the tissue space surrounding the 7-day implanted microdialysis probes (PC membrane). A 20× objective was used for both images. For each fluorescence image, there is a paired image taken under normal light with the same magnification to reveal the location of the probe membrane. Figure 6-A was obtained using normal microscope lamp. Figure 6-B was obtained using the fluorescence lamp with a filter.
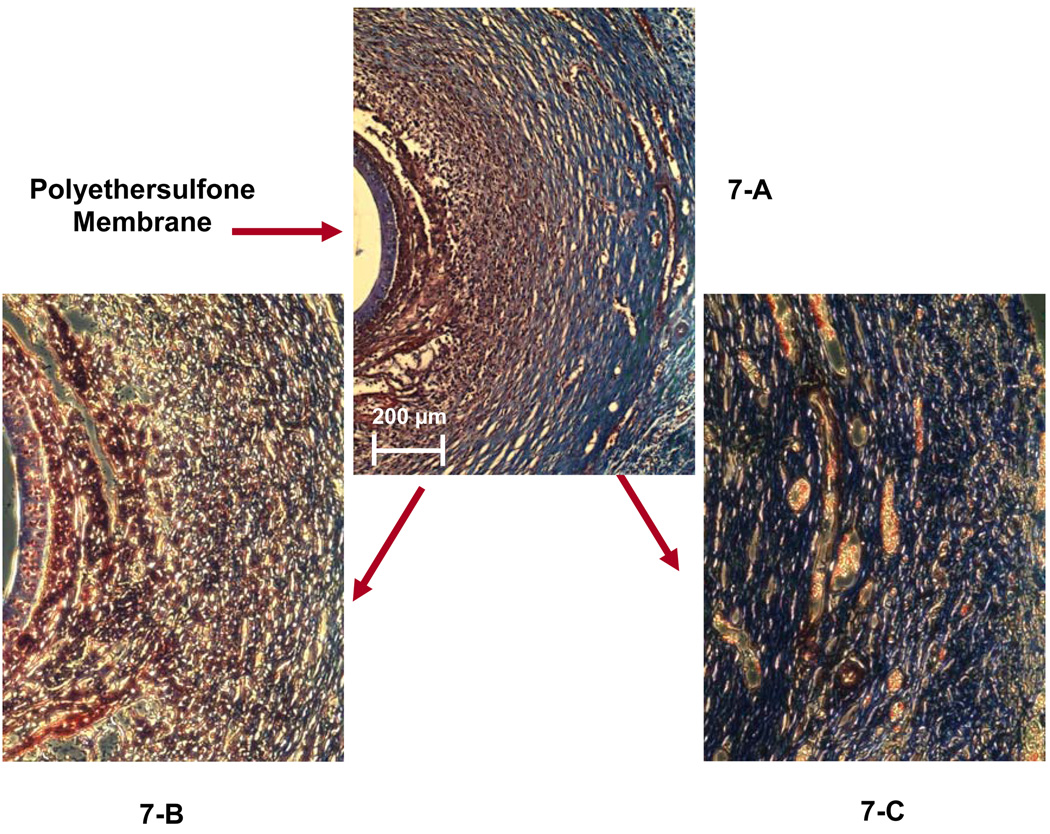
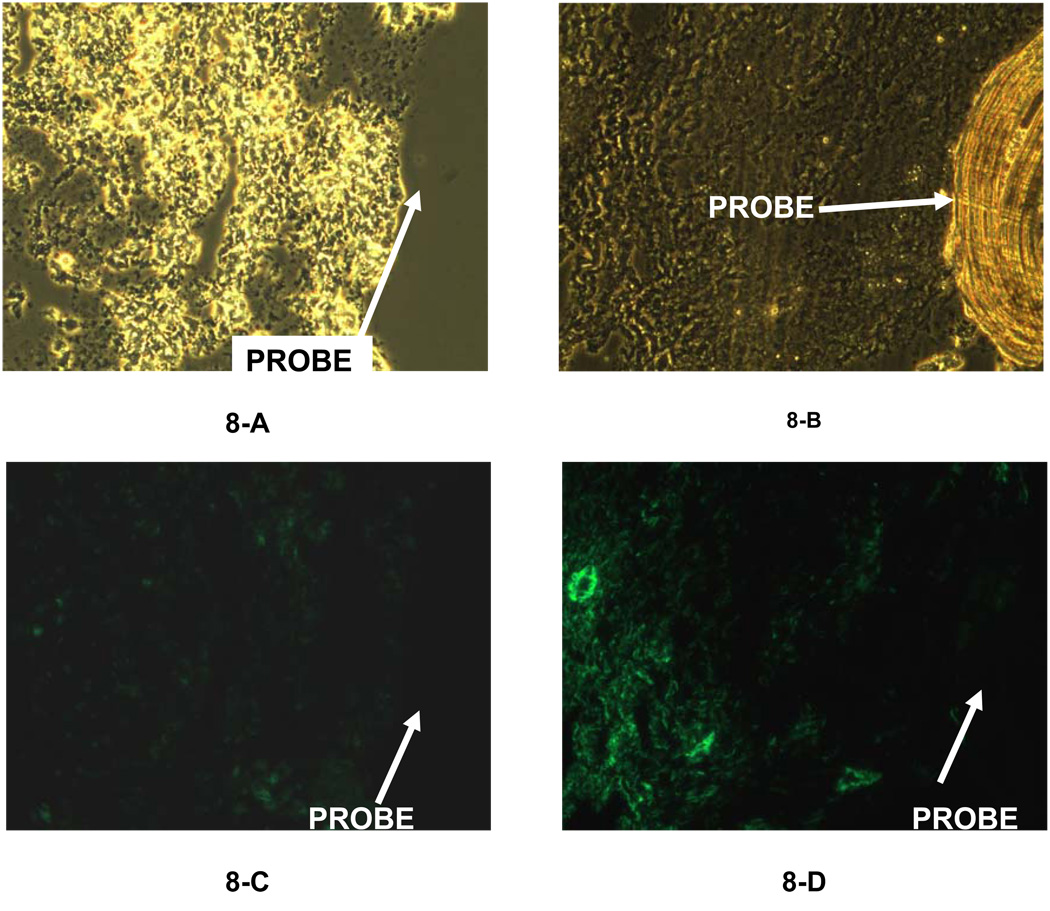
The composition of the capsule surrounding the 14-day PES probe is shown in Figures 7 (trichrome) and 8 (immunofluorescence). By trichrome, the PC and PES capsules were similar. That is, a cellular region close (150–200 µm, Figure 7-B) to the probe surrounded by more collagen rich regions containing blood vessels (Figure 7-C). Similarly, macrophages were concentrated adjacent to the probe (Figure 8-B), and the smooth muscle cells more distant (Figure 8-D). Additionally, cells were seen in the pores of the PES membrane (Figure 7-B), but were not detected in the PC membrane (Fig 5 and 6).
Figure 7.
Masson’s trichrome staining of the tissue surrounding a 14-day implanted microdialysis probe (PES membrane). Figure 7-A was observed using a 10× objective. A 20× objective was used to obtain Figures 7-B and 7-C, which display the inner layer and the outer layer of the collagen capsule.
Figure 8.
Immunofluorescence of labeled macrophages (8-A & 8-C) and fibroblasts (8-B & 8-D) of the tissue space surrounding the membrane of 7-day implanted microdialysis probes (PES membrane). A 20× objective was used for all the images. Figures 8-A and 8-B were obtained using a normal microscope lamp. Figures 8-C and 8-D were observed using the fluorescence lamp with a filter.
3.7 SEM images of microdialysis membranes
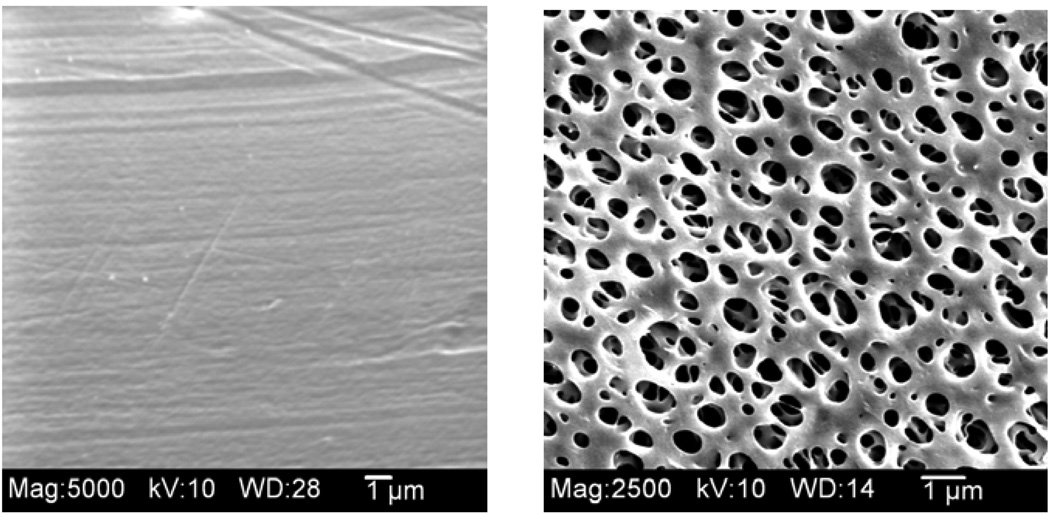
Figure 9 shows the SEM images for both the PC and PES membranes. The PES membranes have a much larger external support layer with pores that are approximately 1 µm in diameter. However, the inner pore size on the skin layer of the PES membranes is reported to be 9 nm by the manufacturer.
Figure 9.
Scanning electron microscope images of the membrane surface of microdialysis probe membranes - PC (left) and PES (right) (original magnification ×5000).
4. Discussion
Although the membrane chemistry of the microdialysis probes is different than for most implanted glucose electrochemical sensors, the use of microdialysis sampling allows for experiments with various targeted analytes to understand the in vivo diffusive characteristics for different analytes through the capsule as it is forming after implantation. Since most sensors and drug delivery systems typically fail within 1 to 4 weeks post implantation [38,39], understanding the diffusive characteristics of this early encapsulation process would be of benefit to control the in vivo performance of most implanted chemical analysis devices.
The three different internal standards (antipyrine, 2-DG, and vitamin B12) exhibited different diffusion properties through the long-term implanted microdialysis probes. For both probe membranes (PC vs. PES), only VB12 exhibited a decreased extraction efficiency during the long-term implant suggesting the formation of a mass transport barrier which could be either diffusive or kinetic (e.g. uptake into capillary beds) in nature. Unlike VB12, the extraction efficiency for infused antipyrine and 2-DG, which have lower molecular weights, seemed to remain relatively constant between the different sampling days and for each type of probe membrane chemistry. This is despite the observation of a fibrotic capsule and cellular material deposited on the membranes as shown in Figure 3, Figure 4, and Figure 7. This collagen material has been shown by Reichert’s group to impose a diffusion barrier to analyte mass transport [33–35]. Since microdialysis sampling is a diffusion-based separation process, the decrease in recovery on Vitamin B12 is most likely due to diffusion barriers caused by the collagen capsule. However, it may also be due to molecular interactions with the proteins within the capsule since Vitamin B12 is charged at physiological pH.
Two analytes, glucose and antipyrine were collected into the dialysis probe. In each case, as the implantation time increased, the amount of analyte collected decreased. The recovery of these analytes appears to be impeded by the capsule tissue or other processes related to the response of the host tissue to the implanted microdialysis probe. This suggests that, during collection of an analyte, supply and not necessarily diffusion through the collagen barrier causes a significant decrease in the collected material. This supply issue has been previously reported by Rebrin et al. who also report glucose concentrations near an implanted glucose sensor to be 25% of that in tissue space that did not possess an implant [40].
Other studies have reported the effects of tissue reactions on glucose sensor function. Ward, et al., showed that for a glucose sensor implanted acutely (equivalent to our day 0) the reported sensitivity was similar to in vitro controls [41]. This seems to match our experience for the first few implant days that the microdialysis EE appears to be stable. Henninger, et al., have reported on the tissue response to two different commercially-available glucose sensors implanted into the subcutaneous space of rats [42] While sensor performance was not evaluated as a function of implant time in their study, their microarray and histological analyses show the progression of the foreign body reaction as a function of time. In a polyvinylalchol (PVA) sponge implant model, Dungel et al. showed an approximate 42% decrease in glucose sensitivity at day 7 and approximately 25% decrease by day 14 [8]. While these are certainly different implantation techniques, the trends in decrease of sensitivity, especially for glucose, are similar to our observations. In another implantation study with new types of scaffold materials for glucose sensors, sensitivity decreases between 20 to 60% were reported at one week post implantation [14]. While these are completely different materials, the trend of reduction in sensitivity is similar to our observations.
A histological study of many different polymeric semi-permeable membranes, some of which have been used for creating home-made microdialysis probes, that were syringe implanted into the subcutaneous space has been reported [43]. In their study, the main focus of the report was the capsular thickness around the implanted membranes. Additionally, the authors reported good long-term stability of polysulfone membranes. These membranes are similar, but not identical to the PES membranes used in our work. While smaller capsule sizes (∼ 30 µm) were reported, it should be noted that they sterilized their membranes with ethylene oxide.
While blood flow has been measured immediately after microdialysis probe insertion into subcutaneous tissue of rats [44,45], it has not been measured out to seven days. In the work of Groth, et al., blood flow of rats under halothane anesthesia drops after probe insertion and then reaches a slightly higher plateau after 1 hr. However, in that study, the animal was under inhalation anesthetic throughout the blood flow measurement. This is in contrast to our studies where the animal is awake and freely moving prior to initiation of sample collection. The combination of both of these reports in rats suggests that during our studies blood flow is not likely to be dramatically altered. Additionally, in a study that used anesthetized rats, microdialysis probes with the PES membrane have been shown to have flux decreases during in vivo glucose collection two days post implantation as compared to eight days post implantation for the PC membrane [23]. This is in contrast to what our results with the awake- and freely-moving animals where we observed that PC probes demonstrated notable differences in endogenous glucose concentrations recovered at 4 days post implantation and for PES probes at 10 days post implantation. The reasons for these observed differences are not entirely clear and may be due to differences in experimental designs.
The lack of change in extraction efficiency for 2-DG, a well known tracer for glucose metabolism, suggests that the collagen layer did not restrict its diffusion through the probe. The lack of change in the EE values for 2-DG is consistent with our previously reported preliminary studies in anesthetized rats [29]. If there were a significantly higher uptake of 2-DG into the metabolically active immune cells surrounding the implanted probe it could be reflected as an increase in the EE values for 2-DG. It should be noted that lack of change in the EE for 2-DG does not necessarily mean that changes in glucose metabolism near the probe do not exist but that the changes may be below the limits of detection of the microdialysis extraction efficiency.
The PES probes exhibited longer lifetimes (up to 12 days) during implantation and a lower fouling rate compared to PC probes (up to 7 days). Yet, the PES probes had the larger diameter foreign body capsule surrounding them after implantation. Since the externally facing pores of the PES membrane (Figure 9 (right)) are much larger those of the PC membrane (Figure 9 (left)), the fouling from the protein deposition that occurs after implantation may not significantly affect the flux. We have previously shown this with the collection of cytokines were PES membranes that appeared to be significantly biofouled still are able to collect the cytokine, interleukin-6, with the same average EE as a fresh probe [46]. Additionally, the expected edema that would occur after implantation may have helped the diffusion of small molecules, due to a higher extracellular fluid space volume fraction, and thus kept EE high for a few days post-implantation.
5. Conclusions
The in vivo calibration of implanted microdialysis probes with different internal standards illustrated that recovery of solutes from the tissue space appears to be highly dependent on the progression of the foreign body reaction. This has important implications for the use of various chemical sensors as well as drug delivery devices. The PC probes, with smaller pores failed within one week. The PES probes exhibited longer working lifetimes (10–12 days) and exhibited a more stable collection of glucose concentrations over their implant lifetime. The delivery of VB12, MW 1355, was dramatically decreased for both membranes during the lifetime of the probe implant. The lack of change in the 2-DG EE values during the implantation times with either microdialysis membrane material, PC or PES, suggests that large changes in the metabolic uptake of glucose during the foreign body reaction are unlikely. The most important issue affecting the collection of glucose as demonstrated by the antipyrine pharmacokinetics experiments appears to be the reduction of glucose supply from the blood vessels in the outer layer of the capsule by the collagen layer.
Acknowledgements
We thank Dr. Van De Water from Albany Medical College (Center for Cell Biology and Cancer Research) for generously providing chemicals and the protocol for immunofluorescence labeling. We also appreciate the guidance on histological examination from Jessica Germond, Katharine Halligan, Yili Lin at Albany Medical College. We gratefully acknowledge the NIH (EB001441) for funding of this research.
Footnotes
Publisher's Disclaimer: This is a PDF file of an unedited manuscript that has been accepted for publication. As a service to our customers we are providing this early version of the manuscript. The manuscript will undergo copyediting, typesetting, and review of the resulting proof before it is published in its final citable form. Please note that during the production process errors may be discovered which could affect the content, and all legal disclaimers that apply to the journal pertain.
The PC-membrane probes have now been discontinued by the manufacturer (CMA Microdialysis, Inc.). They have been replaced with a polyarylethersulfone membrane with a 20 kDa MWCO.
A figure of this system is available at: http://www.microdialysis.se/basic-research/microdialysis-instruments/cma-120 accessed on October 23, 2009
References
- 1.Cunningham DD, Stenken JA, editors. In vivo glucose sensors. Hoboken, NJ: John Wiley & Sons; 2010. [Google Scholar]
- 2.Skyler JS. Continuous glucose monitoring: An overview of its development. Diabetes Technol Ther. 2009;11:S5–S10. doi: 10.1089/dia.2009.0045. [DOI] [PubMed] [Google Scholar]
- 3.Iyer SS, Barr WH, Karnes HT. Profiling in vitro drug release from subcutaneous implants: a review of current status and potential implications on drug product development. Biopharm Drug Dispos. 2006;27:157–170. doi: 10.1002/bdd.493. [DOI] [PubMed] [Google Scholar]
- 4.Coleman DL, King RN, Andrade JD. The foreign body reaction: a chronic inflammatory response. J Biomed Mater Res. 1974;8:199–211. doi: 10.1002/jbm.820080503. [DOI] [PubMed] [Google Scholar]
- 5.Anderson JM, Rodriguez A, Chang DT. Foreign body reaction to biomaterials. Sem Immunol. 2008;20:86–100. doi: 10.1016/j.smim.2007.11.004. [DOI] [PMC free article] [PubMed] [Google Scholar]
- 6.Ratner BD, Bryant SJ. Biomaterials: where we have been and where we are going. Ann Rev Biomed Eng. 2004;6:41–75. doi: 10.1146/annurev.bioeng.6.040803.140027. [DOI] [PubMed] [Google Scholar]
- 7.Gifford R, Kehoe JJ, Barnes SL, Kornilayev BA, Alterman MA, Wilson GS. Protein interactions with subcutaneously implanted biosensors. Biomaterials. 2006;27:2587–2598. doi: 10.1016/j.biomaterials.2005.11.033. [DOI] [PubMed] [Google Scholar]
- 8.Dungel P, Long N, Yu B, Moussy Y, Moussy F. Study of the effects of tissue reactions on the function of implanted glucose sensors. J Biomed Mater Res, Part A. 2008;85A:699–706. doi: 10.1002/jbm.a.31593. [DOI] [PubMed] [Google Scholar]
- 9.Koschwanez HE, Reichert WM. In vitro, in vivo and post explantation testing of glucose-detecting biosensors: Current methods and recommendations. Biomaterials. 2007;28:3687–3703. doi: 10.1016/j.biomaterials.2007.03.034. [DOI] [PMC free article] [PubMed] [Google Scholar]
- 10.Voskerician G, Shive MS, Shawgo RS, von Recum H, Anderson JM, Cima MJ, et al. Biocompatibility and biofouling of MEMS drug delivery devices. Biomaterials. 2003;24:1959–1967. doi: 10.1016/s0142-9612(02)00565-3. [DOI] [PubMed] [Google Scholar]
- 11.Wang J. Electrochemical glucose biosensors. Chem Rev. 2007;108:814–825. doi: 10.1021/cr068123a. [DOI] [PubMed] [Google Scholar]
- 12.Quinn CAP, Connor RE, Heller A. Biocompatible, glucose-permeable hydrogel for in situ coating of implantable biosensors. Biomaterials. 1997;18:1665–1670. doi: 10.1016/s0142-9612(97)00125-7. [DOI] [PubMed] [Google Scholar]
- 13.Ju YM, Yu B, Koob TJ, Moussy Y, Moussy F. A novel porous collagen scaffold around an implantable biosensor for improving biocompatibility. I. In vitro/in vivo stability of the scaffold and in vitro sensitivity of the glucose sensor with scaffold. J Biomed Mater Res, Part A. 2008;87A:136–146. doi: 10.1002/jbm.a.31756. [DOI] [PubMed] [Google Scholar]
- 14.Ju YM, Yu B, West L, Moussy Y, Moussy F. A novel porous collagen scaffold around an implantable biosensor for improving biocompatibility. II. Long-term in vitro/in vivo sensitivity characteristics of sensors with NDGA- or GA-crosslinked collagen scaffolds. J Biomed Mater Res, Part A. 2010;92A:650–658. doi: 10.1002/jbm.a.32400. [DOI] [PubMed] [Google Scholar]
- 15.Geelhood SJ, Horbett TA, Ward WK, Wood MD, Quinn MJ. Passivating protein coatings for implantable glucose sensors: evaluation of protein retention. J Biomed Mater Res, B Appl Biomater. 2007;81:251–260. doi: 10.1002/jbm.b.30660. [DOI] [PubMed] [Google Scholar]
- 16.Frost M, Meyerhoff ME. In vivo chemical sensors: tackling biocompatibility. Anal Chem. 2006;78:7370–7377. doi: 10.1021/ac069475k. [DOI] [PubMed] [Google Scholar]
- 17.Ward WK, Wood MD, Casey HM, Quinn MJ, Federiuk IF. The effect of local subcutaneous delivery of vascular endothelial growth factor on the function of a chronically implanted amperometric glucose sensor. Diabetes Technol Ther. 2004 Apr;6(2):137–145. doi: 10.1089/152091504773731320. [DOI] [PubMed] [Google Scholar]
- 18.Hickey T, Kreutzer D, Burgess DJ, Moussy F. Dexamethasone/PLGA microspheres for continuous delivery of an anti-inflammatory drug for implantable medical devices. Biomaterials. 2002;23:1649–1656. doi: 10.1016/s0142-9612(01)00291-5. [DOI] [PubMed] [Google Scholar]
- 19.Hetrick EM, Prichard HL, Klitzman B, Schoenfisch MH. Reduced foreign body response at nitric oxide-releasing subcutaneous implants. Biomaterials. 2007;28:4571–4580. doi: 10.1016/j.biomaterials.2007.06.036. [DOI] [PMC free article] [PubMed] [Google Scholar]
- 20.Klueh U, Dorsky DI, Kreutzer DL. Enhancement of implantable glucose sensor function in vivo using gene transfer-induced neovascularization. Biomaterials. 2005;26:1155–1163. doi: 10.1016/j.biomaterials.2004.04.017. [DOI] [PubMed] [Google Scholar]
- 21.Westerink BHC, Cremers TIFH, editors. Handbook of microdialysis sampling: Methods, applications, and clinical aspects. Amsterdam: Academic Press; 2007. [Google Scholar]
- 22.Nandi P, Lunte SM. Recent trends in microdialysis sampling integrated with conventional and microanalytical systems for monitoring biological events: A review. Anal Chim Acta. 2009;651:1–14. doi: 10.1016/j.aca.2009.07.064. [DOI] [PMC free article] [PubMed] [Google Scholar]
- 23.Wisniewski N, Klitzman B, Miller B, Reichert WM. Decreased analyte transport through implanted membranes: differentiation of biofouling from tissue effects. J Biomed Mater Res. 2001;57:513–521. doi: 10.1002/1097-4636(20011215)57:4<513::aid-jbm1197>3.0.co;2-e. [DOI] [PubMed] [Google Scholar]
- 24.Ricci F, Moscone D, Palleschi G. Ex vivo continuous glucose monitoring with microdialysis technique: the example of GlucoDay. IEEE Sensors J. 2008;8:63–70. [Google Scholar]
- 25.Bungay PM, Morrison PF, Dedrick RL. Steady-state theory for quantitative microdialysis of solutes and water in vivo and in vitro. Life Sci. 1990;46:105–119. doi: 10.1016/0024-3205(90)90043-q. [DOI] [PubMed] [Google Scholar]
- 26.Bungay PM, Newton-Vinson P, Isele W, Garris PA, Justice JB. Microdialysis of dopamine interpreted with quantitative model incorporating probe implantation trauma. J. Neurochem. 2003;86:932–946. doi: 10.1046/j.1471-4159.2003.01904.x. [DOI] [PMC free article] [PubMed] [Google Scholar]
- 27.Stenken JA. Methods and issues in microdialysis calibration. Anal Chim Acta. 1999;379:337–357. [Google Scholar]
- 28.Wick AN, Drury DR, Nakada HI, Wolfe JB. Localization of the primary metabolic block produced by 2-deoxyglucose. J. Biol. Chem. 1957;224:963–969. [PubMed] [Google Scholar]
- 29.Mou X, Stenken JA. Microdialysis sampling extraction efficiency of 2-deoxyglucose: Role of macrophages in vitro and in vivo. Anal Chem. 2006;78:7778–7784. doi: 10.1021/ac061124i. [DOI] [PMC free article] [PubMed] [Google Scholar]
- 30.Deguchi Y, Terasaki T, Kawasaki S, Tsuji A. Muscle microdialysis as a model study to relate the drug concentration in tissue interstitial fluid and dialysate. J Pharmacobiodyn. 1991;14:483–492. doi: 10.1248/bpb1978.14.483. [DOI] [PubMed] [Google Scholar]
- 31.Yokel RA, Allen DD, Burgio DE, McNamara PJ. Antipyrine as a dialyzable reference to correct differences in efficiency among and within sampling devices during in vivo microdialysis. J Pharmacol Toxicol Methods. 1992;27:135–142. doi: 10.1016/1056-8719(92)90034-x. [DOI] [PubMed] [Google Scholar]
- 32.Haraldsson B, Rippe B. Upper and lower bounds on capillary permeability ratios of Cr-EDTA to cyanocobalamin in rat hindquarters. Acta Physiol Scand. 1991;143:239–241. doi: 10.1111/j.1748-1716.1991.tb09228.x. [DOI] [PubMed] [Google Scholar]
- 33.Sharkawy AA, Klitzman B, Truskey GA, Reichert WM. Engineering the tissue which encapsulates subcutaneous implants. I. Diffusion properties. J. Biomed Mater Res. 1997;37:401–412. doi: 10.1002/(sici)1097-4636(19971205)37:3<401::aid-jbm11>3.0.co;2-e. [DOI] [PubMed] [Google Scholar]
- 34.Sharkawy AA, Klitzman B, Truskey GA, Reichert WM. Engineering the tissue which encapsulates subcutaneous implants. II. Plasma-tissue exchange properties. J Biomed Mater Res. 1998;40:586–597. doi: 10.1002/(sici)1097-4636(19980615)40:4<586::aid-jbm10>3.0.co;2-e. [DOI] [PubMed] [Google Scholar]
- 35.Sharkawy AA, Klitzman B, Truskey GA, Reichert WM. Engineering the tissue which encapsulates subcutaneous implants. III. Effective tissue response times. J. Biomed Mater Res. 1998;40:598–605. doi: 10.1002/(sici)1097-4636(19980615)40:4<598::aid-jbm11>3.0.co;2-c. [DOI] [PubMed] [Google Scholar]
- 36.Schutte RJ, Oshodi SA, Reichert WM. In vitro characterization of microdialysis sampling of macromolecules. Anal Chem. 2004;76:6058–6063. doi: 10.1021/ac0493626. [DOI] [PubMed] [Google Scholar]
- 37.Bancroft J, Gamble M. Theory and practice of histological techniques. London: Churchill Livingstone; 2001. [Google Scholar]
- 38.Gilligan BC, Shults M, Rhodes RK, Jacobs PG, Brauker JH, Pintar TJ, et al. Feasibility of continuous long-term glucose monitoring from a subcutaneous glucose sensor in humans. Diabetes Technol Ther. 2004;6:378–386. doi: 10.1089/152091504774198089. [DOI] [PubMed] [Google Scholar]
- 39.Pickup JC, Hussain F, Evans ND, Sachedina N. In vivo glucose monitoring: the clinical reality and the promise. Biosens Bioelectro. 2005;20:1897–1902. doi: 10.1016/j.bios.2004.08.016. [DOI] [PubMed] [Google Scholar]
- 40.Rebrin K, Fischer U, Hahn von Dorsche H, von Woetke T, Abel P, Brunstein E. Subcutaneous glucose monitoring by means of electrochemical sensors: fiction or reality? J Biomed Eng. 1992;14:33–40. doi: 10.1016/0141-5425(92)90033-h. [DOI] [PubMed] [Google Scholar]
- 41.Ward WK, Jansen LB, Anderson E, Reach G, Klein J-C, Wilson GS. A new amperometric glucose microsensor: in vitro and short-term in vivo evaluation. Biosens Bioelectron. 2002;17:181–189. doi: 10.1016/s0956-5663(01)00268-8. [DOI] [PubMed] [Google Scholar]
- 42.Henninger N, Woderer S, Kloetzer H-M, Staib A, Gillen R, Li L, et al. Tissue response to subcutaneous implantation of glucose-oxidase-based glucose sensors in rats. Biosens Bioelectron. 2007;23:26–34. doi: 10.1016/j.bios.2007.03.016. [DOI] [PubMed] [Google Scholar]
- 43.Clark H, Barbari TA, Stump K, Rao G. Histologic evaluation of the inflammatory response around implanted hollow fiber membranes. J Biomed Mater Res. 2000;52:183–192. doi: 10.1002/1097-4636(200010)52:1<183::aid-jbm24>3.0.co;2-d. [DOI] [PubMed] [Google Scholar]
- 44.Groth L, Jorgensen A, Serup J. Cutaneous microdialysis in the rat: insertion trauma and effect of anaesthesia studied by laser Doppler perfusion imaging and histamine release. Skin Pharmacol Appl Skin Physiol. 1998;11:125–132. doi: 10.1159/000029818. [DOI] [PubMed] [Google Scholar]
- 45.Mathy FX, Denet AR, Vroman B, Clarys P, Barel A, Verbeeck RK, et al. In vivo tolerance assessment of skin after insertion of subcutaneous and cutaneous microdialysis probes in the rat. Skin Pharmacol Appl Skin Physiol. 2003;16:18–27. doi: 10.1159/000068290. [DOI] [PubMed] [Google Scholar]
- 46.Wang X, Lennartz MR, Loegering DJ, Stenken JA. Interleukin-6 collection through long-term implanted microdialysis sampling probes in rat subcutaneous space. Anal Chem. 2007;79:1816–1824. doi: 10.1021/ac061503b. [DOI] [PubMed] [Google Scholar]


