

Abstract
The ability to survey polymorphism on a genomic scale has enabled genome-wide scans for the targets of natural selection. Theory that connects patterns of genetic variation to evidence of natural selection most often assumes a diallelic locus and no recurrent mutation. Although these assumptions are suitable to selection that targets single nucleotide variants, fundamentally different types of mutation generate abundant polymorphism in genomes. Moreover, recent empirical results suggest that mutationally complex, multiallelic loci including microsatellites and copy number variants are sometimes targeted by natural selection. Given their abundance, the lack of inference methods tailored to the mutational peculiarities of these types of loci represents a notable gap in our ability to interrogate genomes for signatures of natural selection. Previous theoretical investigations of mutation-selection balance at multiallelic loci include assumptions that limit their application to inference from empirical data. Focusing on microsatellites, we assess the dynamics and population-level consequences of selection targeting mutationally complex variants. We develop general models of a multiallelic fitness surface, a realistic model of microsatellite mutation, and an efficient simulation algorithm. Using these tools, we explore mutation-selection-drift equilibrium at microsatellites and investigate the mutational history and selective regime of the microsatellite that causes Friedreich’s ataxia. We characterize microsatellite selective events by their duration and cost, note similarities to sweeps from standing point variation, and conclude that it is premature to label microsatellites as ubiquitous agents of efficient adaptive change. Together, our models and simulation algorithm provide a powerful framework for statistical inference, which can be used to test the neutrality of microsatellites and other multiallelic variants.
Keywords: microsatellites, fitness landscape, natural selection, population genetic inference, Friedreich’s ataxia, tandem repeats
Introduction
Genomic scans for natural selection are now ubiquitous and target a variety of subject species (Oleksyk et al. 2010; Strasburg et al. 2012). Despite their promise, however, positive results from separate scans of the same species can show limited overlap (Biswas and Akey 2006; Akey 2009) and a relatively small number of unambiguously positive results have been gathered (e.g., LCT and G6PD in humans; Tishkoff et al. 2001; Bersaglieri et al. 2004). Indeed, the prevalence of genomic scans has revealed a number of biological and demographic factors that complicate the intuitive simplicity of the selective sweep model (Maynard Smith and Haigh 1974) and are likely to confound statistical tests for selection that assume a homogeneous genome. For example, statistics like Tajima’s D (Tajima 1989) may fail to identify selection targeting standing variation (Innan and Kim 2005; Przeworski et al. 2005), yet produce false positives in response to demographic change (Nielsen et al. 2005; Li 2011).
A complication that has received little attention is the role diverse mutational mechanisms play in the dynamics and signatures of selection. This oversight is noteworthy because a large fraction of genetic variation is of a fundamentally different mutational nature than a single nucleotide polymorphism (SNP), which is assumed to arise from a single, unique mutation under the infinite sites model (ISM; Kimura 1969). Though SNPs are the most common type of polymorphism, several mutationally complex structural variants—including micro and minisatellites, copy number variants (CNVs), and transposable elements—are abundant in genomes (Ellegren 2004; Korbel et al. 2007; Huang et al. 2010). Reliable detection of natural selection across the full complement of mutationally heterogeneous loci will require models (mutational and selective) appropriate to each non-SNP variant.
Here, we focus on microsatellites. Found throughout the genomes of prokaryotes and eukaryotes, microsatellites are defined as sequential repeats of a 1–6 nucleotide motif. The mutation rate at microsatellites generally exceeds that of point mutation by several orders of magnitude (Bhargava and Fuentes 2010), which leads to recurrent mutation that violates the ISM on which much of the theoretical work regarding SNP-based selection is based (Maynard Smith and Haigh 1974; Hermisson and Pennings 2005). Thanks to their early adoption in forensic analysis (Hampikian et al. 2011), genetic map construction (e.g., Broman et al. 1998; Kong et al. 2002), and population genetic inference (e.g., Navascués et al. 2009; Goldberg and Waits 2010), more is known about microsatellite mutation than other non-SNP variants. For these reasons, microsatellites provide a model system for studying the effects of non-ISM mutation on the inference of natural selection.
Microsatellites have long been used as markers in population genetics and forensic analysis because they are often highly variable (Oliveira et al. 2006). An implicit assumption underlying the use of microsatellites as diagnostic markers is that they evolve neutrally. However, recent studies have identified functional microsatellites that affect the fitness of an individual (Kashi and King 2006; Gemayel et al. 2010). Putatively (dys)functional microsatellites are primarily located in or near genic regions, where a change in the number of times the motif is repeated (hereafter referred to as allele size) is hypothesized to modify gene expression or change protein sequence (Wren et al. 2000; Li et al. 2004; Gemayel et al. 2010). Synthesizing the results of more than 500 individual experiments, Rockman and Wray (2002) concluded that as much as 20% of cis-regulation in humans is mediated by variation in repetitive elements including microsatellites. More recently, Vinces et al. (2009) provided strong experimental evidence for eukaryotic gene regulation via microsatellites. In Saccharomyces cerevisiae, the authors demonstrated rapid and effective selection for change in gene expression that was mediated by concomitant change in the allele size of a promoter microsatellite. In exons, changes in protein sequence caused by microsatellite mutation can drive rapid morphological evolution. For example, profound evolution of the snout morphology of domestic dog breeds was accomplished in less than a century through artificial selection acting on the length of a compound microsatellite in the gene Runx2 (Fondon and Garner 2004). The presence of microsatellites in coding regions can also present substantial hazard for organisms. For example, most mutations of nontriplet microsatellites in protein coding regions cause frame shifts, which can eliminate protein function. Furthermore, hyperexpansion of trinucleotide repeats in genic regions cause numerous human diseases such as Fragile X syndrome (Kremer et al. 1991), Friedreich’s ataxia (Durr et al. 1996), and Huntington’s disease (Huntington’s Disease Collaborative Research Group 1993).
Though these empirical examples show that repetitive elements can be functional, a few authors have suggested that repetitive variants including microsatellites may be ubiquitous agents of efficient adaptive evolution (Trifonov 1989; King 1994, 1999; Kashi et al. 1997; King et al. 1997; Fondon and Garner 2004; Trifonov 2004; Kashi and King 2006, King and Kashi 2009). In general, they argue that if small changes in allele size at a microsatellite correspond to incremental changes in the value of a quantitative trait such as gene expression, then high mutation at a microsatellite should generate a reservoir of quantitative trait variation to be drawn on in times of ecological stress. Although theoretical and empirical studies have focused on the use of microsatellite markers to detect selective sweeps targeting linked variation (Wiehe 1998; Schlötterer 2002; Nair et al. 2003; Rockman et al. 2005), a paucity of research addresses the topic of direct microsatellite selection. An objective, inferential framework to test the neutrality of microsatellites is absent.
Natural selection at a microsatellite is perhaps best considered in the context of mutation-selection balance. Although the action of natural selection tends to increase mean fitness of the population, mutation acts in constant opposition to this increase by producing less fit alleles. Previous theoretical treatments of mutation-selection dynamics at loci with multiple alleles make assumptions that limit their application to inference from microsatellite data. Both Crow and Kimura (1970) and Clark (1998) assume the infinite alleles model of mutation (Kimura and Crow 1964), which is inappropriate to microsatellite mutation unless the selective event of interest is recent enough or mutation rate is low enough to limit recurrent mutation and resultant homoplasy. Several studies have investigated mutation-selection balance at a locus mutating according to the stepwise mutation model (SMM) (Moran 1976; Kingman 1977; Moran 1977; Bürger 1988, 1998); the SMM is a simple but appropriate model for microsatellite mutation (Ohta and Kimura 1973). However, these studies make several assumptions that limit their practical use: haploidy, deterministic evolution, and, often, that a single allele is most fit.
The models of selection and mutation presented here empower exploration of diverse selective and mutational dynamics at microsatellites in diploids. We also describe a rapid simulation algorithm, which makes it simple to generate thousands of sample data sets. Together, models and simulation provide a reasonable framework to: 1) test the neutrality of individual microsatellite loci, which is simply assumed in most studies that use microsatellite markers; 2) evaluate claims regarding the importance and prevalence of selection targeting microsatellites; and 3) investigate the population-level consequences of selection targeting microsatellites. Although we focus on microsatellites as a molecular model system, our models and simulation algorithm should be portable to other classes of multiallelic loci such as CNVs assuming a variant-specific mutational matrix can be constructed.
Models and Simulation
Modeling the Fitness Surface of a Microsatellite
We present four models for the fitness surface of a microsatellite locus: additive, multiplicative, dominant, and recessive. Using four parameters—key allele size (x), threshold effect (δ), and lower and upper gradient effects (gl and gu)—the fitness surface is constructed in two steps. Regardless of model, the first step is to calculate a vector of allelic fitness. Let ai represent an allele of size i and let  be its fitness. Initially, set
  Then, a detrimental effect of allele ai on fitness is indicated by
  . The sign of threshold effect δ determines which set of alleles are subject to its effect. When negative, it reduces the fitness of all alleles <x equally; when positive, it reduces the fitness of all alleles >x equally. More specifically, when δ is negative add δ to
  for all ai where i < x. When δ is positive subtract δ from
  for all ai where i > x. Gradient effects gl and gu affect the fitness of alleles of size i < x and i > x, respectively. When negative, these parameters decrease fitness as distance from x increases and vice versa. To realize these effects, add
  to
to  for all ai where i < x and
  to
to  for all ai where i > x. Finally, lethal alleles are represented by a relative fitness of zero. For all i considered, set
  if
if  after the previous calculations are performed. The second step is to construct the diploid fitness surface in a model-specific manner. Let
  be the fitness of the diploid genotype containing alleles of size i and j. Under additive and multiplicative models,
  equals the sum or product of the fitnesses
  and
and  , respectively. Under the dominant model, deleterious effects are dominant. Thus, genotypic fitness is calculated as the minimum fitness of the two component alleles:
  . Under the recessive model, deleterious effects are recessive. Thus, genotypic fitness is equal to the maximum fitness of the component alleles:
  . For all four models, the fitness surface is normalized by dividing each
  by
by  . Figure 1A shows a schematic of fitness surface construction.
Fig. 1.

Modeling mutation and selection at a microsatellite. (A) The diploid fitness surface is constructed in two steps. First, allelic fitnesses are calculated by combining the threshold and gradient effects associated with the values of parameters δ, gl, and gu. Second, the vector of allelic fitnesses is used to compute the fitness surface (genotypic fitnesses) in a model-specific manner. (B) Allele-specific mutation rate is defined as a basic logistic function modified by three parameters whose values control the allele size where mutation rate begins to increase (ψ), the slope of increase (γ), and the maximum mutation rate (ϕ).
Modeling the Microsatellite Mutation Matrix
A positive correlation between allele size and mutation rate is supported by mutational studies (Goldstein and Clark 1995; Wierdl et al. 1997; Brinkmann et al. 1998; Schlötterer et al. 1998; Vigouroux et al. 2002; Leopoldino and Pena 2003; Henke L and Henke J 2006; McConnell et al. 2007; Seyfert et al. 2008; Marriage et al. 2009; Sun et al. 2012), analyses of polymorphism data (Ellegren 2000; Legendre et al. 2007; Brandstrom and Ellegren 2008; Kelkar et al. 2008; Payseur et al. 2011), and model-based inference (Aandahl et al. 2012). Several studies have modeled this size-dependent aspect of microsatellite mutation rate using a linear or polynomial function of allele size (Kruglyak et al. 1998; Calabrese et al. 2001; Sibly et al. 2001). However, genome-wide analyses of polymorphism data further suggest that mutation rate increases rapidly over a short range of allele sizes after which mutation rate appears to asymptote (Brandstrom and Ellegren 2008; Payseur et al. 2011). This characteristic suggests that a logistic function might be a reasonable alternative model for allele-specific mutation rate. We use three parameters to modify the logistic function and control allele-specific mutation rate: ψ controls the position of the upward inflection point of mutation rate on the allele-size axis, ϕ controls maximum mutation rate, and γ controls the slope of increase in mutation rate (fig. 1B). Following the general formula for the logistic function, allele specific mutation rate μ is
| (1) |
where g is current allele size. Recent studies suggest a linear increase in mutation rate with allele size (Aandahl et al. 2012; Sun et al. 2012). A linear model of mutation rate requires only two parameters, slope b and intercept a:
Note that negative values of a can lead to μ = 0 for small allele sizes. Indeed, based on human mutation data and assuming a linear model of allele-specific mutation rate, Sun et al. (2012) infer negative intercepts for di- and tetranucleotide microsatellites and therefore μ = 0 for small alleles. Although μ is likely minimal for small allele sizes at most microsatellite loci, it is almost certainly nonzero. Therefore, we use the logistic model in the remainder of this study because it allows realistic, nonzero mutation rates for the smallest allele sizes and can recapitulate mutation curves derived from the linear model for larger allele sizes (supplementary fig. S1, Supplementary Material online). We note, however, that any previous mutational model translated into a stochastic matrix may be used in the algorithm detailed later.
Under the SMM, transition probabilities for mutation from size g to size h are
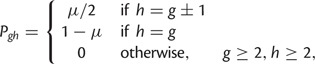 |
where μ is determined using equation (1). To model departures from the SMM, we specified two additional parameters. First, we used parameter c to control contraction bias—the empirically observed tendency for longer alleles to contract more frequently than expand (Amos et al. 1996; Xu et al. 2000). Let 
 , where g is current allele size and
  (though for most loci, reasonable values of c will not exceed 0.01). Z has a horizontal asymptote at 1. When Z = 0.5 (c = 0), there is no contraction bias; when Z is near one, most mutations reduce allele size. Second, we used parameter m to model multi-step mutation. Specifically, step size
 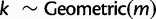 , where m is the probability of single step mutation. When c = 0 and m = 1, mutation reduces to the standard SMM.
Finally, a stochastic matrix M comprising transition probabilities  from size g to h is computed as follows:
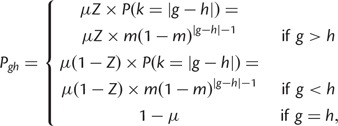 |
(2) |
where μ is computed using equation (1) and 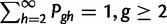 .
.
Rapid Forward Simulation of Natural Selection, Mutation, and Drift at a Microsatellite Using a Recursion Equation
Edwards (2000) corrected Wright’s equation for the change in allele frequencies at a multiallelic locus in response to natural selection (Wright 1937). This difference equation specifies the change in allele frequencies after one generation of natural selection:
 |
(3) |
where pi is the frequency of allele ai,  is mean fitness, and the partial derivative
  is equal to twice the marginal fitness of allele ai,
  .
.
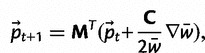
We express the vector of allele frequencies after one generation of selection and mutation as a recursion equation:
 |
(4) |
where MT is the transpose of the mutation matrix (eq. 2),  is the vector of current allele frequencies, C is the covariance matrix on the RHS of equation (3), and
  is the gradient vector of partial derivatives on the RHS of equation (3). In the following algorithm, we use repeated application of equation (4) with multinomial sampling to simulate evolution of microsatellite allele frequencies subject to mutation, selection, and drift:
A0: Set t = 0 and
 to the starting vector of allele frequencies.
A1: For each allele ai, calculate marginal fitness
 and
and  .
.A2: Calculate
 and C.
A3: (Selection and mutation) Use equation (4) to find
 .
.A4: (Reproduction and drift) Use multinomial sampling to draw a sample of size 2Ne based on probabilities
 , where Ne is effective diploid population size.
A5: Use the sample from [A4] to recalculate
 .
.A6: Repeat steps [A1]–[A5] for the number of generations desired.
If steps [A4] and [A5] are skipped, thereby disregarding drift, steps [A1]–[A3] may be repeated until  ϵ, where ϵ is an appropriately small threshold (we used ϵ
  ). Then, current
  provides an approximation of the allele frequencies at mutation-selection balance.
To assess accuracy, we compared the outcome of simulations using algorithm A with the outcome of forward, individual-based simulations. In forward simulations, all 2Ne copies of the allele were followed; each generation consisted of selection on diploid individuals, mutation of the surviving alleles, and reproduction by random sampling of surviving alleles until 2Ne copies were obtained. For the comparison of recursion and forward simulations, we used a representative set of parameter values: dominant model, δ = 0.05, gl = −0.001, gu = 0, ϕ = 3.5, ψ = 1.5, γ = 0.15, m = 1, and c = 0. We performed the comparison for two distinct population sizes: Ne = 500 or 10,000.
Results
Picturing Mutation-Selection-Drift Equilibrium at a Microsatellite
Forward simulations following algorithm A generated samples highly similar to those produced using much slower individual-based simulations (supplementary fig. S2, Supplementary Material online). The contour plots in figure 2A–C each summarize the frequency distribution of a single allele over time and across 1,000 replicate simulations using algorithm A. Equilibrium between mutation, selection, and drift eventually becomes apparent across replicates. The frequency of the key allele at mutation-selection balance (obtained by a single simulation in the absence of drift) was 0.9864. For a diploid population size of Ne = 10,000, the key allele slowly approaches mutation-selection equilibrium in all 1,000 replicates (fig. 2A). The effect of drift is minimal, but does cause key allele frequency to oscillate about its equilibrium frequency at mutation-selection balance. When Ne = 500 (fig. 2B), however, the effect of drift dominates. In a large fraction of simulations (31%), frequency of the key allele at 4,500 generations is <0.2. Figure 2C shows the frequency distribution of the next-most-fit allele (size 7) across the same 1,000 replicates shown in figure 2A. Comparing figure 2A and C, we can intuit the chronology of selective effects resulting from the topology of the multiallelic fitness surface (fig. 2D). Initially, the frequencies of both alleles increase because the large fitness penalty imposed on alleles of size >8 by threshold effect δ = 0.05 rapidly eliminates these alleles from the population. After  generations, however, only alleles of size ≤8 remain and the gradient parameter gl = −0.001 begins to slowly eliminate alleles of size
  .
.
Fig. 2.

Mutation-selection-drift equilibrium for a microsatellite under selection. (A) The joint distribution of key allele (size = 8) frequency versus time for 1,000 replicates at a selected microsatellite locus. In this case, the key allele is also the most fit and its frequency at mutation-selection equilibrium is 0.9684 (dashed line). The simulated selective regime was dominant model with x = 8, δ = 0.05, gl = −0.001, and gu = 0. Simulated mutational parameters were ϕ = 3.5, ψ = 1.5, γ = 0.15, m = 1, and c = 0. Diploid population size Ne = 10,000. (B) The same as (A) for 1,000 simulations where Ne = 500. (C) Derived from the same simulations as (A), the joint distribution of the frequency of allele size 7 versus time is shown. This allele is the next most-fit allele according to the modeled selective regime. (D) The fitness surface used in the simulations underlying (A–C).
The Evolution of Friedreich’s Ataxia and Its Causative Microsatellite
To demonstrate the utility of the fitness models described here, we applied the recessive model to inference of parameters concerning the origin and selective regime of the human disease Friedreich’s ataxia (FRDA). FRDA is caused by the hyperexpansion of a GAA repeat in the first intron of the autosomal gene frataxin (FXN; Campuzano et al. 1996) and is the most common inherited ataxia among individuals of Western European ancestry (Pandolfo 2008). Four size-based classes of GAA allele are generally identified: short normal (SN) with allele size <12, long normal (LN) with allele size between 12 and 33, premutation (P) with allele size between 34 and 60, and expanded (E) with allele size >60. Affected individuals are homozygous for an E allele; age of onset and severity of the disease increase with the size of the smaller allele in affected genotypes (Durr et al. 1996). Patterns of linkage disequilibrium (LD) with nearby SNPs support the hypothesis that a single 18-repeat allele (and the LN class with it) originated from a rare doubling mutation of a 9-repeat allele (Cossee et al. 1997; Monticelli et al. 2004). Subsequently, LN alleles likely proliferated via ordinary mutation (Montermini et al. 1997), eventually generating larger P alleles that are vulnerable to hyperexpansion (size  ). E-class alleles mutate ∼85% of the time and while the expansion/contraction ratio is even in females, nearly all mutations of E alleles in males are contractions (Pianese et al. 1997). The geographic distribution of non-SN alleles and analyses of LD suggest that a unique SN-to-LN mutation took place in Africa (Colombo and Carobene 2000). Based on measures of LD in modern Europeans, one study dated the origin of the first LN allele at 682 ± 203 generations ago (Colombo and Carobene 2000). However, the authors acknowledge this may be an underestimate. Their method assumed equilibrium population dynamics, but migration from Africa to Europe incurred a population bottleneck that would have slowed decay of LD, thereby skewing the estimate of allele age towards more recent times. In our simulation-based inference, we allowed both African and European origins of the LN class to be simulated (fig. 3).
Fig. 3.
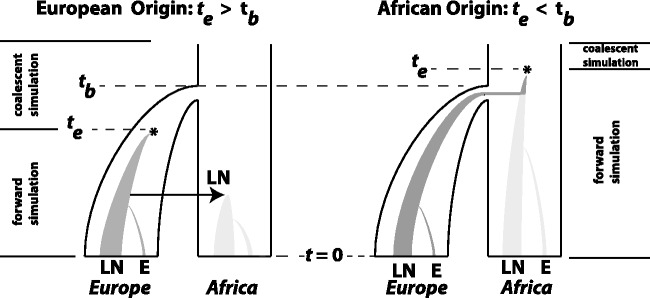
The demographic model for FRDA inference. Outer trees indicate population size. Inner shaded trees represent the frequencies of LN and E class alleles. Parameters tb (bottleneck time) and te (time of LN class origin) were drawn from uniform prior distributions before the start of each simulation. The relationship between these parameter values distinguished between two historical possibilities. When  (left), the bottleneck occurred before the emergence of the first LN allele. In this case, the LN and E alleles observed in Northern Africa on the same haplotypic background as European LN and E alleles can only be explained by back-migration to Africa (arrow). When
  (right), LN emergence takes place in Africa and is subsequently carried to Europe by members of a founding population. Note that only simulations where LN alleles survived to modern day (t = 0) were retained and that the postdivergence African population was not simulated. Coalescent simulation was used to simulate starting distributions of genetic variation; forward simulations as detailed here were used to progress from time te to t = 0.
Posterior point estimates and 95% credible intervals for all parameters of interest are found in table 1, whereas graphical comparisons of prior and posterior distributions for each estimate are shown in supplementary figure S3, Supplementary Material online. Our median estimate of the age of the anomalous SN-to-LN doubling event is 1,494 generations ago with a credible interval of 840–2,593 generations ago. Figure 4 shows the estimated fitness surface of the causative GAA repeat assuming median values of δ and gu from posterior distributions. After normalizing the fitness surface by assigning a fitness of 1.0 to all genotypes with at least one allele less than 34 in size, the relative fitness of the most deleterious genotype (1,500/1,500) is 0.105. All genotypes in which both alleles are of size  have relative fitness
  . Despite very low fitness of affected genotypes, the low frequency of E alleles in the observed Western European population and the recessivity of the disease suggest that the selective toll of FRDA is minimal. This expectation was confirmed by additional simulation; across 1,000 simulations using median parameter estimates, maximum realized genetic load was only ∼1.2e−04 (supplementary fig. S4, Supplementary Material online).
Table 1.
Prior Distributions and Posterior Estimates for Parameters Relevant to the Microsatellite Causative of Friedreich’s Ataxia.
| te | tb | Selection |
Mutation |
Population Growth | ||||
|---|---|---|---|---|---|---|---|---|
| gu | δ | ϕ | ψ | γ | α | |||
| Prior | (−4,000, −475) | (−4,000, −1,000) | (−0.0015, 0) | (0, 0.04) | (4.5, 7) | (1.5, 4) | (0.05, 0.4) | (−0.003, 0) |
| Posterior | ||||||||
| Median | −1,494 | −2,645 | −0.0006 | 0.0157 | 6.27 | 2.74 | 0.17 | −0.0016 |
| 2.5 percentile | −2,593 | −3,705 | −0.0012 | 0 | 5.66 | 1.98 | 0.1 | −0.003 |
| 97.5 percentile | −840 | −1,656 | 0 | 0.028 | 6.93 | 3.7 | 0.31 | −0.0001 |
Note.—All prior distributions were uniform on the specified interval. In addition, the listed priors are narrower than those used for the first 10,000 simulations.
Fig. 4.
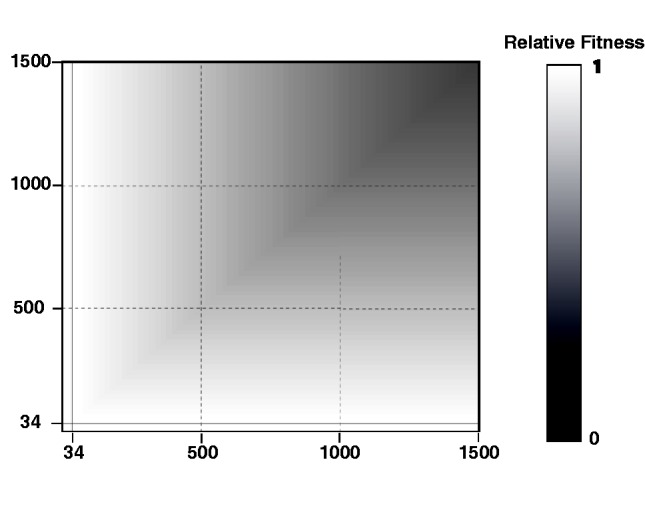
Estimate of the fitness surface for the GAA repeat that causes Friedreich’s ataxia. This estimate is based on median selective parameter values from their posterior distributions. The solid black lines are drawn at allele size 34. We assumed that all genotypes with at least one allele of size <34 had a relative fitness of 1. The least fit genotype on the graph, 1,500/1,500, has an estimated fitness of only 0.104.
Approximate posterior densities on the mutational parameters ϕ, ψ, and γ were relatively narrow (table 1; supplementary fig. S3, Supplementary Material online). Using the median estimates of these parameters to calculate allele-specific rates of  , we estimate that alleles <size 12 mutate at rates
  . However, alleles of size >12 were inferred to be extremely mutable, peaking at
  for alleles of size >24. These results suggest that modeling allelic-specific mutation rate is an important part of characterizing selection targeting microsatellites.
Population-Level Characteristics of Microsatellite Selection
We quantified distance between the starting distribution of allele frequencies and those at mutation-selection balance as Δmsat (see Material and Methods). For all selective regimes tested (table 2), regression of d on Δmsat and cost of selection C on Δmsat were significant ( ). Values of r2 associated with regression analyses (table 2) suggest that Δmsat is an important determinant of both the cost and duration of selection in a population. Interestingly, the influence of Δmsat on the cost of selection is largely independent of selective strength. Comparing additive regimes A1 and A2, the rate at which C increases in response to increases in Δmsat is identical for both scenarios, despite 5-fold greater values of gl and gu in regime A2 (P = 0.915; analysis of covariance: H0: slopes identical; fig. 5A). Although the intercepts of the best-fit lines for regimes A1 and A2 are significantly different (P = 0.021), it is visibly evident that the average increase in C associated with regime A1 is very minimal (fig. 5A). These results agree with those for diallelic loci, where, except for very strong selection, increases in selective strength do not affect C (Haldane 1957). Different models of microsatellite selection can lead to selective events with very different characteristics (fig. 5B). For example, dominant and recessive selective regimes produced selective events of greater duration than those of additive and multiplicative selection regimes. In addition, populations evolving under the multiplicative regime M2 obtained mutation-selection equilibrium in roughly half the time of populations evolving according to selective regime A2, despite identical parameter values. Finally, for all selective regimes simulated, greater than 70% of replicates fell to the left of the hard sweep line in figure 5B. This region of the graph corresponds to soft selective sweeps on SNPs, where the starting frequency of the beneficial variant is
  .
.
Table 2.
Simulated Selective Regimes and Coefficients of Determination for Regression of C and d on Δmsat.
| Regime | Model | x | gl | gu | δ |
r2 |
|
|---|---|---|---|---|---|---|---|
| C on Δmsat | d on Δmsat | ||||||
| A1 | Additive | 11 | −0.01 | −0.01 | 0 | 0.74 | 0.56 |
| A2 | Additive | 11 | −0.05 | −0.05 | 0 | 0.59 | 0.29 |
| M2 | Multiplicative | 11 | −0.05 | −0.05 | 0 | 0.64 | 0.38 |
| D1 | Dominant | 11 | −0.01 | −0.01 | 0 | 0.36 | 0.43 |
| R1 | Recessive | 11 | 0 | −0.01 | −0.025 | 0.74 | 0.77 |
Fig. 5.
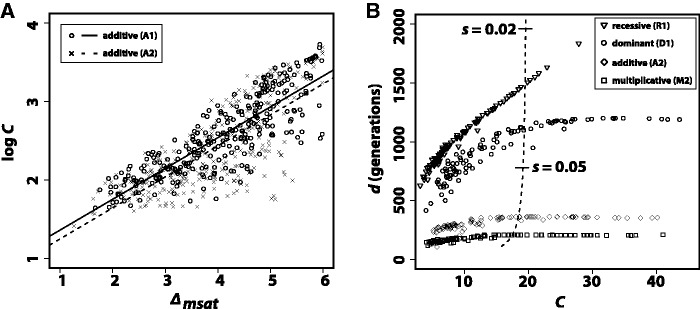
Cost and duration of microsatellite selection. (A) Regression of log C on Δmsat for additive regimes A1 and A2 (table 2). The results of 250 deterministic simulations are shown. The only difference between replicates of the same regime was the starting distribution of allele frequencies, which was generated using neutral coalescent simulation. Δmsat quantifies the difference between starting allele frequencies and those at mutation-selection balance. Best fit lines for both regimes are drawn. (B) Duration of selection versus cost of selection for regimes R1, D1, A2, and M2; 250 deterministic replicates each. The dashed line is drawn from deterministic simulations of a hard, SNP-based selective sweep (dominance coefficient h = 0.5). The line is interpolated but based on thousands of simulations, each with a different value of s. Two values of s are indicated on the dashed line.
Discussion
The Role of Mutational Complexity in Genomic Scans for Selection
Standard genomic scans for selection assume that natural selection is the only locus-specific force active in the genome. The effects and/or rates of mutation, recombination, and demography are assumed to be homogeneous across the genome. This paradigm is attractive because it implies that anomalous patterns of genetic diversity must be attributable to the action of natural selection. However, although genomic scans have identified a handful of loci clearly subject to natural selection in humans, meta-analyses of genomic scans in humans do not yield ready consensus (Akey 2009). One reason for this is likely the characterization of genomes as a monolithic sequence. Methods that ignore interlocus heterogeneity caused by factors other than natural selection bear reduced statistical power to detect selection and could suffer elevated false positive rates. In particular, studies that differ in terms of sample, sample size, markers, and so forth will often yield distinct or conflicting results.
Here, we focused on a common source of heterogeneity that is seldom considered: frequent, recurrent mutation. We used microsatellites as a model form of variation for this purpose. Implementing our models of direct selection on microsatellites revealed the danger in assuming that high-density SNP data are capable of detecting selection at non-SNP variants. In figure 5, the majority of simulated selective events targeting microsatellites fall to the left of the line denoting a starting frequency of  for SNP selection. In other words, selective events targeting microsatellites will frequently resemble soft sweeps on SNPs, which are nearly impossible to detect using statistics based on the site frequency spectrum (Pennings and Hermisson 2006b). Indeed, simulations of linked diversity in the case of direct selection on a microsatellite corroborate the analogy to soft sweeps; soft sweeps and direct microsatellite selection generate minimal selective footprints in their wake, at least as measured by summaries of the site frequency spectrum (fig. 6). In general, this is most likely due to the fact that recurrent mutation causes an advantageous microsatellite allele to become associated with a variety of haplotypic backgrounds.
Fig. 6.
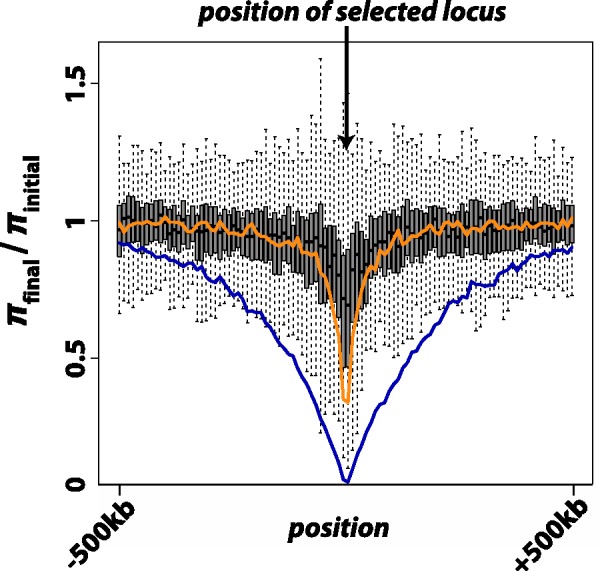
Results from 250 independent simulations each of additive selection on a microsatellite, a soft sweep (p0 on the interval [0.1, 0.2]), or a hard sweep ( ), where p0 is the starting frequency of the beneficial SNP variant. The y-axis plots
  , where final nucleotide diversity (
 ) was calculated from a sample of n = 100 chromosomes either at the time of fixation of the beneficial variant (SNP selection) or when mutation-selection-drift equilibrium was achieved (microsatellite selection). In all selection scenarios, the target of selection was located at the center of a 1 Mb sequence. Box plots summarize the results from simulations of microsatellite selection in non-overlapping 10 kb windows (rectangles are interquartile distances). Colored lines plot the mean value of
  across simulations for soft sweep (orange) and hard sweep (blue) simulations.
Pennings and Hermisson (2006a, 2006b) developed a model of positive selection that did include recurrent mutation (following an infinite alleles model) and found that resultant soft sweeps were detected with high statistical power using measures of LD. The authors attributed this power to the fact that each individual mutation to the beneficial allele was likely to bring with it a distinct ancestral haplotype whose genetic associations (LD) were unlikely to decay during the selective period. Though it warrants further investigation, there are several reasons to suspect that the encouraging results of Pennings and Hermisson (2006b) may not hold for the detection of microsatellite selection: 1) favored microsatellite alleles will frequently be drawn from standing variation, suggesting that selected alleles will already lie on genetic backgrounds of partially decayed LD; 2) the population mutation rate of microsatellites,  , will generally be much higher than the values considered by Pennings and Hermisson (2006a, 2006b), leading to very frequent recurrent mutation; 3) back mutation, ignored by Pennings and Hermisson (2006a, 2006b), will be common at microsatellites, and 4) considerable variation in allelic fitness may often exist at non-neutral microsatellite loci, which can undermine the effectiveness of tests for selection based on LD (Pennings and Hermisson 2006a).
In general, lessons learned from studies based on the infinite sites or infinite alleles models of mutation will not hold for microsatellites and other genetic variants created by complex mutation. Therefore, it seems prudent to develop models of selection and mutation tailored to the peculiarities of these variants. Otherwise, even strong instances of selection on many forms of genetic variation that are less commonly considered will be difficult or impossible to detect.
Detecting Microsatellite Selection
The complex nature of multiallelic selection makes detecting evidence of natural selection at microsatellites a challenging task. As discussed earlier, the standard genomic scan for selection will generally be a poor approach for detecting microsatellite targets of selection. Furthermore, the absence of genome-wide microsatellite data currently precludes full genomic scans for microsatellite selection [though see Gymrek et al. (2012)]. Yet, we believe testing candidate microsatellites for evidence of selection provides one way forward. In this sense, testing for microsatellite selection may actually prove an easier task, since microsatellite loci are well defined while genomic scans for positive selection proceed under the assumption that all nucleotides could be of adaptive consequence. Also, a locus-specific test of microsatellite neutrality should be helpful to empiricists, where the presumed neutrality of microsatellite markers is rarely tested.
One approach to testing candidate microsatellites for selection is to embrace their potential complexity and use simulation based inference procedures. We have demonstrated that a simple implementation of ABC inference using our models and simulation algorithm was sufficient to provide novel insights regarding evolution of the microsatellite underlying Friedreich’s ataxia (discussed later). However, direct selection on a microsatellite and selection on a tightly linked SNP both cause reductions in microsatellite variation (Slatkin 1995). Thus, full implementation of our models in the inference of microsatellite selection requires a means to distinguish between direct and linked selection. One possibility is to examine levels of linked diversity in sequence flanking the subject microsatellite. Since most instances of microsatellite selection appear most similar to selection on standing SNP variation (fig. 5), direct microsatellite selection should most often reduce variance at the microsatellite while leaving a minimal selective footprint in linked sequence diversity (fig. 6).
The Cost and Duration of Microsatellite Selection Are Dependent on Several Factors
A recent study of experimental evolution unequivocally demonstrated that rapid adaptive responses are possible when the selected target is a repetitive element with high mutation rate (Vinces et al. 2009). This result supports hypotheses that microsatellites provide reservoirs of potentially adaptive alleles and that frequent recurrent mutation provides the opportunity for rapid adaptive response to environmental change (Kashi et al. 1997; King et al. 1997; Trifonov 2004; Kashi and King 2006; King and Kashi 2009; Gemayel et al. 2010). Yet, it is premature to claim that repetitive elements such as microsatellites are truly ubiquitous agents of efficient adaptive change; their capacity as drivers of adaptive change appears contingent on several factors. First, the efficiency of adaptive response is dependent upon the selective regime imposed by ecological change. We found that 99% of the replicates of microsatellite selection under regime A1 take longer to reach equilibrium than those of regime A2. Yet there is not a significant difference between initial variance in allele size in the A1 and A2 replicates (P = 0.643). In other words, the difference in efficiency of adaptive responses demonstrated by A1 and A2 replicates is not due to insufficient accumulation of standing variation at the selected locus but the relatively flatter fitness surface under scenario A1. As another example, consider the substantial difference in the efficiency of selection between regimes R1 and M2. While the duration of selection is <200 generations for all replicates of M2 selective events, it can take >1,500 generations to obtain mutation-selection balance under the R1 regime (fig. 5B). Second, efficiency of the selective response of a microsatellite is dependent on the starting distribution of allele frequencies. For both A1 and A2 scenarios, replicates with the highest selective costs (fig. 5A) and longest durations of selection were also among the set of replicates with the highest values of Δmsat (fig. 5A). In many of these cases, the most fit allele was not present in the population at the start of selection. Thus, the accumulation of standing variation at a microsatellite prior to environmental change will only lead to a more efficient selective response if the new selective regime selects for alleles in the vicinity of the current allele distribution. Some hypotheses that advocate the efficacy of selection on repetitive elements do make this very assumption, such as the “tuning knob” model of Trifonov (2004). Finally, as shown in figure 2B, small population size can lead to an appreciable probability that a population will segregate the most beneficial allele at near-zero frequency despite high rates of mutation. This suggests that potential efficiencies of adaptation via microsatellite will be difficult to obtain in small, imperiled populations.
Inferring the Origin and Selective Regime of Friedreich’s Ataxia
Our estimated date for the anomalous SN-to-LN mutation is more than double that of a previous estimate (Colombo and Carobene 2000), which was calculated as a simple function of LD and recombination fraction at several linked loci (Risch et al. 1995). As the authors discussed, however, their estimate may be biased toward more recent estimates. Indeed, we believe a substantially more ancient estimate of LN emergence is supported by a variety of evidence. First, near-perfect LD with nearby variants (Cossee et al. 1997; Monticelli et al. 2004) and a noticeable gap between observed frequency distributions of SN and LN alleles (Monticelli et al. 2004) support the hypotheses that: 1) the current pool of LN, P, and E class alleles is derived from a single, anomalous mutation of an SN allele and 2) broadening of the SN allele range by standard mutation has not contributed to the current pool of LN alleles. We incorporated these hypotheses in our inference procedure by rejecting any simulation in which all descendants of the single, initial LN allele were lost. In this case, we found that it is nearly impossible to generate LN and E frequencies comparable with empirical frequencies in less than 1,000 generations, even when mutation rate of LN alleles was very high. Only two of the 500 best simulated samples used to compute posterior distributions had  . Second, E class alleles are limited to Northern Africa, the Middle East, and Western Europe. Coupled with the hypothesis of a single LN origin, this fact recommends the parsimonious hypothesis that LN emergence took place somewhere in Northern Africa and subsequently spread with immigrants to the Near East and Europe. If a Northern African origin of the LN class is true, it necessitates that the mutation occurred >2,000 generations ago, as the Eurasian expansion likely took place on the order of 40 kya (Liu et al. 2006). On the other hand, we interestingly found that 93% of the best fitting simulations had
  —that is, LN emergence took place in the bottlenecked European population (supplementary fig. S3, Supplementary Material online). If true, this historical hypothesis necessitates the back-migration of LN class alleles to Africa (fig. 3).
To our knowledge, the fitness surface presented in figure 4 is the first estimate of its kind for a microsatellite that causes a human trinucleotide disorder. The topography of this surface agrees with clinical observations. First, decreasing fitness with increasing size of the smallest E allele in a genotype (i.e., negative gu) agrees with the observation that decreased age of onset and increased severity of symptoms are correlated with the size of the smaller allele in affected individuals (Durr et al. 1996). Second, a positive value of δ agrees with the fact that all individuals with two E alleles experience some impairment. Relative fitnesses of genotypes in which both alleles are >1,100 repeats are very low (<0.35). However, the occurrence of these genotypes in nature must be very rare. Using standard formulas for expected homozygosity and conditional probability, the probability of a 1,100+/1,100+ genotype is only
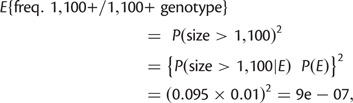 |
where P(E) is the marginal probability of an E class allele. Thus, we expect only one in 1.1 million people of European ancestry to carry these highly deleterious genotypes. Although natural selection acts upon variation at the GAA repeat in FXN, it has had very minor impact on the evolution of the microsatellite relative to mutation and drift (supplementary fig. S4, Supplementary Material online).
We inferred remarkable heterogeneity in mutation rates for the FXN microsatellite. Although SN alleles are predicted to mutate within the range of mutation rates generally cited for microsatellites ( ), the median estimate of μ for larger LN alleles was on the order of
  . The absence of empirical examples of LN alleles on more than one haplotypic background as well as the discontinuity in the observed frequency distribution between SN and LN class ranges support the idea that SN alleles mutate quite slowly. If SN alleles mutated at very high rates, they would likely invade LN allele space thereby linking LN alleles to a diversity of haplotypic backgrounds. Also, our simulations indicate that a very high mutation rate of LN alleles is required for the rapid increase in frequency of LN alleles from
  to 0.1675 (even in 1,000+ generations).
Although the qualitative patterns implied by our parameter estimates seem reasonable, the absolute quantitative estimates presented here should be treated with caution. For example, these estimates possess little value if the seemingly well-supported assumption that there was a single LN origin does not hold. Furthermore, our model of the European bottleneck (fig. 3) overlooks the fact that the colonization of Europe and other regions likely included serial bottlenecks (Liu et al. 2006; DeGiorgio et al. 2009). Our main motivation for including this example was to point out the potential value of our models and simulation algorithm to population genetic inference. Indeed, we believe that the analysis of the FXN locus that used African and Eurasian samples as well as more detailed summary statistics could provide a high-resolution portrait of the evolution of Friedreich’s ataxia and its causative locus.
Extending Models of the Fitness Surface to Other Multiallelic Variants
Our models could be applied to other multiallelic variants. CNVs are polymorphisms in the number of repeats of 1 kb to 1 Mb DNA segments. Recently, CNVs have been implicated in disease and other phenotypic variation (Cooper et al. 2007; Nair et al. 2008), most likely due to differences in dosage of genes contained within the repeated segments (Stankiewicz and Lupski 2010). The mutational mechanism leading to the generation and variation of CNVs is far from settled (Hastings et al. 2009). Nevertheless, CNVs resemble microsatellites in several ways. They are repetitive elements that mutate in a complicated manner and whose allele size may affect fitness. CNV analogs to the models reported here could similarly be used in inference regarding selection on these variants, which are of increasing interest to the human genetics community. Although selective models could be ported directly, construction of a realistic mutational model would likely be difficult. However, a variety of mutational models could be combined with the selective models reported here to enable simulation-based investigation of the population-level consequences of different mutational mechanisms.
Materials and Methods
Modeling Friedreich’s Ataxia and Inferring Parameters of Interest
In modeling FRDA evolution, we assumed the following: 1) recessive model of natural selection; 2) key allele x = 34; 3) effective population size of the affected, modern day Western European population is Ne = 10,000; 4) an historical demographic model in which an African population of Ne = 10,000 gives rise to a bottlenecked founding population that undergoes exponential population growth at rate α (fig. 3; parameter tb specifies the time of the bottleneck); 5) no selection against allele sizes <34; 6) gu
 , that is, the fitness of alleles of size greater than 34 (key allele size) could only decline with increasing allele size; 7) single origin of an LN allele at size 18; 8) mutation of SN and LN alleles follows the mutation model outlined earlier; 9) gender-specific differences in hyperexpansion mutations follow a 50/50 mixture model of male and female mutational distributions (Pianese et al. 1997); 10) P and E alleles hyperexpand with probability 0.85; and 11) with probability 0.15, E alleles undergo no change and P alleles are subject to normal mutation probabilities.
We used approximate Bayesian computation (ABC; Beaumont et al. 2002) to estimate parameter values of interest. Frequencies of SN and LN alleles were estimated from 400 chromosomes sampled from Europeans in two studies (Montermini et al. 1997; Monticelli et al. 2004), while E frequencies were estimated from 332 chromosomes sampled from Europeans in two separate studies (Durr et al. 1996; Pianese et al. 1997). Following the ABC paradigm, we estimated parameter values by comparing empirical frequencies to those generated by simulation.
For each simulation, we drew random values of parameter te—the emergence time of the first LN allele—as well as seven other parameters: tb, α, gu, δ, ϕ, ψ, and γ. Constant values of c = 0 and m = 0.95 were used. All prior distributions were uniform (table 1). Note that the prior distributions for te includes more recent time points that that of tb. This allowed the emergence of the first LN allele to occur in the founding European population rather than the ancestral African population. Although haplotype data indicate that this is a less parsimonious hypothesis, we allow simulation of this hypothesis because it is possible that the first LN allele emerged in the European population and back-migrated to Northern Africa (fig. 3). To increase the efficacy of simulation effort, we refined initial prior distributions based on the results of 10,000 pilot simulations. These narrower priors are the ones listed in table 1. We ran 100,000 total simulations with these priors. Each simulation began with a coalescent phase (fig. 3). At time te, a single SN allele was converted to a size 18 LN allele. Then, forward simulation following algorithm A proceeded until t = 0 (modern day); note, however, that Ne changed through time and that the postdivergence African population pictured in figure 3 was not directly simulated. At t = 0, a sample of n = 400 chromosomes was taken from the population. 100,000 total simulations were run. We restarted a replicate whenever all descendants of the single size 18 allele were lost. Thus, all results are conditioned on survival of this lineage as supported by linkage analysis (Cossee et al. 1997; Monticelli et al. 2004). Empirical and simulated samples were summarized using six summary statistics: total frequencies of LN and E alleles and the proportion of E-class alleles found on the size intervals (60, 500], (500, 700], (700, 900], and  . Observed values of these summary statistics were 0.1675, 0.01, 0.146, 0.17, 0.293, and 0.095, respectively. We retained all simulated samples and used weighted local linear regression (Beaumont et al. 2002) with a tolerance of 0.005 (0.5% of simulations) as implemented in the R package abc (Csillery et al. 2012) to estimate approximate posterior distributions for the parameters of interest. Parameters were log-transformed for regression and back-transformed postregression.
Characterizing the Effects of Microsatellite Selection at the Population Level
To compare population-level consequences of microsatellite selection, we simulated representative selective regimes for each of the four models described earlier (table 2; 250 replicates each). Each replicate of a given selective regime began with a random starting distribution of allele frequencies, generated using neutral coalescent simulation in MARKSIM (Haasl and Payseur 2011). Simulations were deterministic and mutation parameters were constant across all simulated regimes: ϕ = 5, ψ = 2, γ = 0.3, c = 0, m = 0.95. For each replicate, we calculated the following: 1) the duration of selection, d, which was the time in generations from the onset of selection until mutation-selection equilibrium was achieved (defined as the first generation when the sum of allele frequencies at the selected locus was less than 1/2Ne [although these were deterministic simulations, this definition of equilibrium implicitly assumes Ne = 10,000]); 2) the cost of selection, 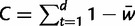 (Haldane 1957); and 3) the distance between starting allele frequencies and those at mutation-selection equilibrium, Δmsat. The last metric was calculated as:
 |
(5) |
where  is the set of starting allele sizes,
  is the set of equilibrium allele sizes, and p is allele frequency. Thus, Δmsat weights the distance between each starting and equilibrium allele by the product of their frequencies,
  , which can be thought of as the probability that a starting allele of size x will be replaced by an allele of size y by the time of equilibrium. Finally, for comparison, we calculated d and C for hard selective sweeps, where the beneficial single nucleotide variant started at a frequency of 5e−05 (although these were deterministic simulations, this starting frequency implicitly assumes Ne = 10,000). In all simulations of SNP selection, the dominance coefficient h = 0.5. We simulated values of the selection coefficient s ranging from 0.001 to 0.1 in increments of 0.001.
Comparing the Selective Footprints of Selection Targeting SNP Variants versus Microsatellites
We ran 250 independent simulations each for three different selective scenarios: 1) additive selection on a microsatellite ( ); 2) a soft sweep (p0 on the interval [0.1, 0.2]); and 3) a hard sweep (
 ), where p0 is the starting frequency of the beneficial SNP variant. For each type of selection, the 250 simulations started with an array of independently generated SNP variation along a 1 MB sequence using MS (Hudson 2002) embedded in MARKSIM (Haasl and Payseur 2011). We then added the beneficial SNP variant or microsatellite to the exact center of the 1 MB sequence. Next, we used forward simulations, in which the order of events was selection, reproduction and recombination, and mutation. Simulations finished when fixation of the beneficial variant occurred (SNP-based selection) or the selected microsatellite reached mutation-selection-drift equilibrium. To simulate reproduction and recombination, two chromosomes from those remaining after selection were chosen at random to represent the “father” and two to represent the “mother”. For each of these two pairs, we then tested the pair for recombination (rate 1.25 cM/Mb). If recombination was indicated, we then tested to see if a recombinant chromatid was inherited. If so, we chose the position of the breakpoint at random. From each parent, then, an offspring inherited a random recombinant or nonrecombinant chromosome. Reproduction continued until the constant population size of Ne = 10,000 was reached. During the mutation phase, new SNPs arose at random positions at a Poisson-distributed rate of 0.0125 (106 bases
  ). Microsatellites mutated according to the logistic model described in this article with ϕ = 5, ψ = 2, γ = 0.3, c = 0, and m = 0.95. For both soft and hard sweeps, selection parameter s = 0.05 and dominance parameter h = 0.5.
Supplementary Material
Supplementary figures S1–S4 are available at Molecular Biology and Evolution online (http://www.mbe.oxfordjournals.org/).
Acknowledgments
The authors thank the associate editor and three anonymous reviewers for helpful comments. This work was supported by the National Institutes of Health (grant HG004498). The authors report no conflicts of interest.
References
- Aandahl RZ, Reyes JF, Sisson SA, Tanaka MM. A model-based Bayesian estimation of the rate of evolution of VNTR loci in Mycobacterium tuberculosis. PLoS Comput Biol. 2012;8:e1002573. doi: 10.1371/journal.pcbi.1002573. [DOI] [PMC free article] [PubMed] [Google Scholar]
- Akey JM. Constructing genomic maps of positive selection in humans: where do we go from here? Genome Res. 2009;19:711–722. doi: 10.1101/gr.086652.108. [DOI] [PMC free article] [PubMed] [Google Scholar]
- Amos W, Sawcer SJ, Feakes RW, Rubinsztein DC. Microsatellites show mutational bias and heterozygote instability. Nat Genet. 1996;13:390–391. doi: 10.1038/ng0896-390. [DOI] [PubMed] [Google Scholar]
- Beaumont MA, Zhang W, Balding DJ. Approximate Bayesian computation in population genetics. Genetics. 2002;162:2025–2035. doi: 10.1093/genetics/162.4.2025. [DOI] [PMC free article] [PubMed] [Google Scholar]
- Bersaglieri T, Sabeti PC, Patterson N, Vanderploeg T, Schaffner SF, Drake JA, Rhodes M, Reich DE, Hirschhorn JN. Genetic signatures of strong recent positive selection at the lactase gene. Am J Hum Genet. 2004;74:1111–1120. doi: 10.1086/421051. [DOI] [PMC free article] [PubMed] [Google Scholar]
- Bhargava A, Fuentes FF. Mutational dynamics of microsatellites. Mol Biotechnol. 2010;44:250–266. doi: 10.1007/s12033-009-9230-4. [DOI] [PubMed] [Google Scholar]
- Biswas S, Akey JM. Genomic insights into positive selection. Trends Genet. 2006;22:437–446. doi: 10.1016/j.tig.2006.06.005. [DOI] [PubMed] [Google Scholar]
- Brandstrom M, Ellegren H. Genome-wide analysis of microsatellite polymorphism in chicken circumventing the ascertainment bias. Genome Res. 2008;18:881–887. doi: 10.1101/gr.075242.107. [DOI] [PMC free article] [PubMed] [Google Scholar]
- Brinkmann B, Klintschar M, Neuhuber F, Huhne J, Rolf B. Mutation rate in human microsatellites: influence of the structure and length of the tandem repeat. Am J Hum Genet. 1998;62:1408–1415. doi: 10.1086/301869. [DOI] [PMC free article] [PubMed] [Google Scholar]
- Broman KW, Murray JC, Sheffield VC, White RL, Weber JL. Comprehensive human genetic maps: individual and sex-specific variation in recombination. Am J Hum Genet. 1998;63:861–869. doi: 10.1086/302011. [DOI] [PMC free article] [PubMed] [Google Scholar]
- Bürger R. Mutation-selection balance and continuum-of-allele models. Math Biosci. 1988;91:67–83. [Google Scholar]
- Bürger R. Mathematical properties of mutation-selection models. Genetica. 1998;102/103:279–298. [Google Scholar]
- Calabrese PP, Durrettt RT, Aquadro CF. Dynamics of microsatellite divergence under stepwise mutation and proportional slippage/point mutation models. Genetics. 2001;159:839–852. doi: 10.1093/genetics/159.2.839. [DOI] [PMC free article] [PubMed] [Google Scholar]
- Campuzano V, Montermini L, Molto MD, et al. (26 co-authors) Friedreich’s ataxia: autosomal recessive disease caused by an intronic GAA triplet repeat expansion. Science. 1996;271:1423–1427. doi: 10.1126/science.271.5254.1423. [DOI] [PubMed] [Google Scholar]
- Clark AG. Mutation-selection balance with multiple alleles. Genetica. 1998;102/103:41–47. [PubMed] [Google Scholar]
- Colombo R, Carobene A. Age of the intronic GAA triplet repeat expansion mutation in Friedreich ataxia. Hum Genet. 2000;106:455–458. doi: 10.1007/s004390000261. [DOI] [PubMed] [Google Scholar]
- Cooper GM, Nickerson DA, Eichler EE. Mutational and selective effects on copy-number variants in the human genome. Nat Genet. 2007;39:S22–S29. doi: 10.1038/ng2054. [DOI] [PubMed] [Google Scholar]
- Cossee M, Schmitt M, Campuzano V, Reutenauer L, Moutout C, Mandel JL, Koenig M. Evolution of the Friedreich’s ataxia trinucleotide repeat expansion: founder effect and premutations. Proc Natl Acad Sci U S A. 1997;94:7452–7457. doi: 10.1073/pnas.94.14.7452. [DOI] [PMC free article] [PubMed] [Google Scholar]
- Crow JF, Kimura M. New York: Harper and Row; 1970. An introduction to population genetic theory. [Google Scholar]
- Csillery K, Francois O, Blum MGB. ABC: an R package for approximate Bayesian computation (ABC) Methods Ecol Evol. 2012;3:475–479. [Google Scholar]
- DeGiorgio M, Jakobsson M, Rosenberg NA. Explaining worldwide patterns of human genetic variation using a coalescent-based serial founder model of migration outward from Africa. Proc Natl Acad Sci U S A. 2009;106:16057–16062. doi: 10.1073/pnas.0903341106. [DOI] [PMC free article] [PubMed] [Google Scholar]
- Durr A, Cossee M, Agid Y, Campuzano V, Mignard C, Penet C, Mandel JL, Brice A, Koenig M. Clinical and genetic abnormalities in patients with Friedreich’s ataxia. N Engl J Med. 1996;335:1169–1175. doi: 10.1056/NEJM199610173351601. [DOI] [PubMed] [Google Scholar]
- Edwards AWF. Sewall Wright’s equation Δq=(q(1−q)∂w/∂q)/2w) Theor Popul Biol. 2000;57:67–70. doi: 10.1006/tpbi.1999.1437. [DOI] [PubMed] [Google Scholar]
- Ellegren H. Heterogeneous mutation processes in human microsatellite DNA sequences. Nat Genet. 2000;24:400–402. doi: 10.1038/74249. [DOI] [PubMed] [Google Scholar]
- Ellegren H. Microsatellites: simple sequences with complex evolution. Nat Rev Genet. 2004;5:435–445. doi: 10.1038/nrg1348. [DOI] [PubMed] [Google Scholar]
- Fondon JW, Garner HR. Molecular origins of rapid and continuous morphological evolution. Proc Natl Acad Sci U S A. 2004;101:18058–18063. doi: 10.1073/pnas.0408118101. [DOI] [PMC free article] [PubMed] [Google Scholar]
- Gemayel R, Vinces MD, Legendre M, Verstrepen KJ. Variable tandem repeats accelerate evolution of coding and regulatory sequences. Annu Rev Genet. 2010;44:445–477. doi: 10.1146/annurev-genet-072610-155046. [DOI] [PubMed] [Google Scholar]
- Goldberg CS, Waits LP. Comparative landscape genetics of two pond-breeding amphibian species in a highly modified agricultural landscape. Mol Ecol. 2010;19:3650–3663. doi: 10.1111/j.1365-294X.2010.04673.x. [DOI] [PubMed] [Google Scholar]
- Goldstein DB, Clark AG. Microsatellite variation in North American populations of Drosophila melanogaster. Nucleic Acids Res. 1995;23:3882–3886. doi: 10.1093/nar/23.19.3882. [DOI] [PMC free article] [PubMed] [Google Scholar]
- Gymrek M, Golan D, Rosset S, Erlich Y. lobSTR: a short tandem repeat profiler for personal genomes. Genome Res. 2012;22:1154–1162. doi: 10.1101/gr.135780.111. [DOI] [PMC free article] [PubMed] [Google Scholar]
- Haasl RJ, Payseur BA. Multi-locus inference of population structure: a comparison between single nucleotide polymorphisms and microsatellites. Heredity. 2011;106:158–171. doi: 10.1038/hdy.2010.21. [DOI] [PMC free article] [PubMed] [Google Scholar]
- Haldane JBS. The cost of natural selection. J Genet. 1957;55:511–524. [Google Scholar]
- Hampikian G, West E, Akselrod O. The genetics of innocence: analysis of 194 U.S. DNA exonerations. Annu Rev Genomics Hum Genet. 2011;12:97–120. doi: 10.1146/annurev-genom-082509-141715. [DOI] [PubMed] [Google Scholar]
- Hastings PJ, Lupski JR, Rosenberg SM, Ira G. Mechanisms of change in gene copy number. Nat Rev Genet. 2009;10:551–564. doi: 10.1038/nrg2593. [DOI] [PMC free article] [PubMed] [Google Scholar]
- Henke L, Henke J. Supplemented data on mutation rates in 33 autosomal short tandem repeat polymorphisms. J Forensic Sci. 2006;51:446–447. doi: 10.1111/j.1556-4029.2006.00094.x. [DOI] [PubMed] [Google Scholar]
- Hermisson J, Pennings PS. Soft sweeps: molecular population genetics of adaptation from standing genetic variation. Genetics. 2005;169:2335–2352. doi: 10.1534/genetics.104.036947. [DOI] [PMC free article] [PubMed] [Google Scholar]
- Huang CRL, Schneider AM, Lu Y, et al. (14 co-authors) Mobile interspersed repeats are major structural variants in the human genome. Cell. 2010;141:1171–1182. doi: 10.1016/j.cell.2010.05.026. [DOI] [PMC free article] [PubMed] [Google Scholar]
- Hudson RR. Generating samples under a Wright-Fisher neutral model of genetic variation. Bioinformatics. 2002;18:337–338. doi: 10.1093/bioinformatics/18.2.337. [DOI] [PubMed] [Google Scholar]
- Huntington’s Disease Collaborative Research Group. A novel gene containing a trinucleotide repeat that is expanded and unstable on Huntington’s disease chromosomes. Cell. 1993;72:971–983. doi: 10.1016/0092-8674(93)90585-e. [DOI] [PubMed] [Google Scholar]
- Innan H, Kim Y. Pattern of polymorphism after strong artificial selection in a domestication event. Proc Natl Acad Sci. 2005;101:10667–10672. doi: 10.1073/pnas.0401720101. [DOI] [PMC free article] [PubMed] [Google Scholar]
- Kashi Y, King D. Simple sequence repeats as advantageous mutators in evolution. Trends Genet. 2006;22:253–259. doi: 10.1016/j.tig.2006.03.005. [DOI] [PubMed] [Google Scholar]
- Kashi Y, King D, Soller M. Simple sequence repeats as a source of quantitative genetic variation. Trends Genet. 1997;13:74–78. doi: 10.1016/s0168-9525(97)01008-1. [DOI] [PubMed] [Google Scholar]
- Kelkar Y, Tyekucheva S, Chiaromonte F, Makova K. The genome-wide determinants of human and chimpanzee microsatellite evolution. Genome Res. 2008;18:30–38. doi: 10.1101/gr.7113408. [DOI] [PMC free article] [PubMed] [Google Scholar]
- Kimura M. The number of heterozygous nucleotide sites maintained in a finite population due to the steady flux of mutations. Genetics. 1969;61:893–903. doi: 10.1093/genetics/61.4.893. [DOI] [PMC free article] [PubMed] [Google Scholar]
- Kimura M, Crow JF. The number of alleles that can be maintained in a finite population. Genetics. 1964;49:725–738. doi: 10.1093/genetics/49.4.725. [DOI] [PMC free article] [PubMed] [Google Scholar]
- King D. Triplet repeat DNA as a highly mutable regulatory mechanism. Science. 1994;263:595–596. [PubMed] [Google Scholar]
- King D, Soller M, Kashi Y. Evolutionary tuning knobs. Endeavour. 1997;21:36–40. [Google Scholar]
- King DG. Modeling selection for adjustable genes based on simple sequence repeats. Annal N Y Acad Sci. 1999;870:396–399. doi: 10.1111/j.1749-6632.1999.tb08912.x. [DOI] [PubMed] [Google Scholar]
- King DG, Kashi Y. Heretical DNA sequences? Science. 2009;326:229–230. doi: 10.1126/science.326_229. [DOI] [PubMed] [Google Scholar]
- Kingman JFC. On the properties of bilinear models for the balance between genetic mutation and selection. Math Proc Cambridge Philos Soc. 1977;81:443–453. [Google Scholar]
- Kong A, Gudbjartsson DF, Sainz J, Jonsdottir GM, Gudjonsson SA. A high-resolution recombination map of the human genome. Nat Genet. 2002;31:241–247. doi: 10.1038/ng917. [DOI] [PubMed] [Google Scholar]
- Korbel JO, Urban AE, Affourtit JP, et al. (23 co-authors) Paired-end mapping reveals extensive structural variation in the human genome. Science. 2007;318:420–426. doi: 10.1126/science.1149504. [DOI] [PMC free article] [PubMed] [Google Scholar]
- Kremer EJ, Pritchard M, Lynch M, Yu S, Holman K, Baker E, Warren S, Schlessinger D, Sutherland GR, Richards RI. Mapping of DNA instability at the fragile X to a trinucleotide repeat sequence p(ccg)n. Science. 1991;252:1711–1714. doi: 10.1126/science.1675488. [DOI] [PubMed] [Google Scholar]
- Kruglyak S, Durrett RT, Schug MD, Aquadro CF. Equilibrium distributions of microsatellite repeat length resulting from a balance between slippage events and point mutations. Proc Natl Acad Sci U S A. 1998;95:10774–10778. doi: 10.1073/pnas.95.18.10774. [DOI] [PMC free article] [PubMed] [Google Scholar]
- Legendre M, Pochet N, Pak T, Verstrepen K. Sequence-based estimation of minisatellite and microsatellite repeat variability. Genome Res. 2007;17:1787–1796. doi: 10.1101/gr.6554007. [DOI] [PMC free article] [PubMed] [Google Scholar]
- Leopoldino AM, Pena SD. The mutational spectrum of human autosomal tetranucleotide microsatellites. Hum Mut. 2003;21:71–79. doi: 10.1002/humu.10153. [DOI] [PubMed] [Google Scholar]
- Li H. A new test for detecting recent positive selection that is free from the confounding impacts of demography. Mol Biol Evol. 2011;28:365–375. doi: 10.1093/molbev/msq211. [DOI] [PubMed] [Google Scholar]
- Li YC, Korol AB, Fahima T, Nevo E. Microsatellites within genes: structure, function, and evolution. Mol Biol Evol. 2004;21:991–1007. doi: 10.1093/molbev/msh073. [DOI] [PubMed] [Google Scholar]
- Liu H, Prugnolle F, Manica A, Balloux F. A geographically explicit genetic model of worldwide human-settlement history. Am J Hum Genet. 2006;79:230–237. doi: 10.1086/505436. [DOI] [PMC free article] [PubMed] [Google Scholar]
- Marriage TN, Hudman S, Mort ME, Orive ME, Shaw RG, Kelly JK. Direct estimation of the mutation rate at dinucleotide microsatellite loci in Arabadopsis thaliana (brassicaceae) Heredity. 2009;103:310–317. doi: 10.1038/hdy.2009.67. [DOI] [PMC free article] [PubMed] [Google Scholar]
- Maynard Smith J, Haigh J. The hitch-hiking effect of a favourable gene. Genetical Res. 1974;23:23–35. [PubMed] [Google Scholar]
- McConnell R, Middlemist S, Scala C, Strassmann JE, Quell DC. An unusually low microsatellite mutation rate in Dictyostelium discoideum, an organism with unusually abundant microsatellites. Genetics. 2007;177:1499–1507. doi: 10.1534/genetics.107.076067. [DOI] [PMC free article] [PubMed] [Google Scholar]
- Montermini L, Andermann E, Labuda M, et al. (14 co-authors) The Friedreich ataxia GAA triplet repeat: premutation and normal alleles. Hum Mol Genet. 1997;6:1261–1266. doi: 10.1093/hmg/6.8.1261. [DOI] [PubMed] [Google Scholar]
- Monticelli A, Giacchetti M, Biase ID, Pianese L, Turano M, Pandolfo M, Cocozza S. New clues on the origin of the Friedreich ataxia expanded alleles from the analysis of new polymorphisms closely linked to the mutation. Hum Genet. 2004;114:458–463. doi: 10.1007/s00439-004-1089-7. [DOI] [PubMed] [Google Scholar]
- Moran PAP. Global stability of genetic systems governed by mutation and selection. Math Proc Cambridge Philos Soc. 1976;80:331–336. [Google Scholar]
- Moran PAP. Global stability of genetic systems governed by mutation and selection. II. Math Proc Cambridge Philos Soc. 1977;81:435–441. [Google Scholar]
- Nair S, Miller B, Barends M, Jaidee A, Patel J, Mayxay M, Newton P, Nosten F, Ferdig MT, Anderson TJC. Adaptive copy number evolution in malaria parasites. PLoS Genet. 2008;4:e1000243. doi: 10.1371/journal.pgen.1000243. [DOI] [PMC free article] [PubMed] [Google Scholar]
- Nair S, Williams JT, Brockman A, et al. (12 co-authors) A selective sweep driven by pyrimethamine treatment in Southeast Asian malaria parasites. Mol Biol Evol. 2003;20:1526–1536. doi: 10.1093/molbev/msg162. [DOI] [PubMed] [Google Scholar]
- Navascués M, Hardy OJ, Burgarella C. Characterization of demograhpic expansions from pairwise comparisons of linked microsatellite haplotypes. Genetics. 2009;181:1013–1019. doi: 10.1534/genetics.108.098194. [DOI] [PMC free article] [PubMed] [Google Scholar]
- Nielsen R, Williamson S, Kim Y, Hubisz MJ, Clark AG, Bustamante C. Genomic scans for selective sweeps using SNP data. Genome Res. 2005;15:1566–1675. doi: 10.1101/gr.4252305. [DOI] [PMC free article] [PubMed] [Google Scholar]
- Ohta T, Kimura M. Model of mutation appropriate to estimate number of electrophoretically detectable alleles in a finite population. Genet Res. 1973;22:201–204. doi: 10.1017/s0016672300012994. [DOI] [PubMed] [Google Scholar]
- Oleksyk TK, Smith MW, O’Brien SJ. Genome-wide scans for footprints of natural selection. Philos Trans Royal Soc Series B. 2010;365:185–205. doi: 10.1098/rstb.2009.0219. [DOI] [PMC free article] [PubMed] [Google Scholar]
- Oliveira E, Padua J, Zucchi M, Vencovsky R, Vieira M. Origin, evolution, and genome distribution of microsatellites. Genet Mol Biol. 2006;29:294–307. [Google Scholar]
- Pandolfo M. Friedreich ataxia. Arch Neurol. 2008;65:1296–1303. doi: 10.1001/archneur.65.10.1296. [DOI] [PubMed] [Google Scholar]
- Payseur BA, Jing P, Haasl RJ. A genomic portrait of human microsatellite variation. Mol Biol Evol. 2011;28:303–312. doi: 10.1093/molbev/msq198. [DOI] [PMC free article] [PubMed] [Google Scholar]
- Pennings PS, Hermisson J. Soft sweeps II—molecular population genetics of adaptation from recurrent mutation or migration. Mol Biol Evol. 2006a;23:1076–1084. doi: 10.1093/molbev/msj117. [DOI] [PubMed] [Google Scholar]
- Pennings PS, Hermisson J. Soft sweeps III: the signature of positive selection from recurrent mutation. PLoS Genet. 2006b;2:1998–2012. doi: 10.1371/journal.pgen.0020186. [DOI] [PMC free article] [PubMed] [Google Scholar]
- Pianese L, Cavalcanti F, Michele GD, Filla A, Campanella G, Calabrese O, Castaldo I, Monticelli A, Cocozza S. The effect of parental gender on the GAA dynamic mutation in the FRDA gene. Am J Hum Genet. 1997;60:460–463. [PMC free article] [PubMed] [Google Scholar]
- Przeworski M, Coop G, Wall JD. The signature of positive selection on standing genetic variation. Evolution. 2005;59:2312–2323. [PubMed] [Google Scholar]
- Risch N, de Leon D, Ozelius L, Kramer P, Almasy L, Singer B, Fahn S, Breakefield X, Bressman S. Genetic analysis of idiopathic torsion dystonia in Ashkenazi Jews and their recent descent from a small founder population. Nat Genet. 1995;9:152–159. doi: 10.1038/ng0295-152. [DOI] [PubMed] [Google Scholar]
- Rockman MV, Hahn MW, Soranzo N, Zimprich F, Goldstein DB, Wray GA. Ancient and recent positive selection transformed opioid cis-regulation in humans. PLoS Biol. 2005;3:e387. doi: 10.1371/journal.pbio.0030387. [DOI] [PMC free article] [PubMed] [Google Scholar]
- Rockman MV, Wray GA. Abundant raw material for cis-regulatory evolution in humans. Mol Biol Evol. 2002;19:1991–2004. doi: 10.1093/oxfordjournals.molbev.a004023. [DOI] [PubMed] [Google Scholar]
- Schlötterer C. A microsatellite-based multilocus screen for the identification of local selective sweeps. Genetics. 2002;160:753–763. doi: 10.1093/genetics/160.2.753. [DOI] [PMC free article] [PubMed] [Google Scholar]
- Schlötterer C, Ritter R, Harr B, Brem G. High mutation rate of a long microsatellite allele in Drosophila melanogaster provides evidence for allele-specific mutation rates. Mol Biol Evol. 1998;15:1269–1274. doi: 10.1093/oxfordjournals.molbev.a025855. [DOI] [PubMed] [Google Scholar]
- Seyfert AL, Cristescu MEA, Frisse L, Schaack S, Thomas WK, Lynch M. The rate and spectrum of microsatellite mutation in Caenorhabditis elegans and Daphnia pulex. Genetics. 2008;178:2113–2121. doi: 10.1534/genetics.107.081927. [DOI] [PMC free article] [PubMed] [Google Scholar]
- Sibly RM, Whittaker JC, Talbot M. A maximum-likelihood approach to fitting equilibrium models of microsatellite evolution. Mol Biol Evol. 2001;18:413–417. doi: 10.1093/oxfordjournals.molbev.a003817. [DOI] [PubMed] [Google Scholar]
- Slatkin M. Hitchhiking and associative overdominance at a microsatellite locus. Mol Biol Evol. 1995;12:473–480. doi: 10.1093/oxfordjournals.molbev.a040222. [DOI] [PubMed] [Google Scholar]
- Stankiewicz P, Lupski JR. Structural variation in the human genome and its role in disease. Annu Rev Med. 2010;61:437–455. doi: 10.1146/annurev-med-100708-204735. [DOI] [PubMed] [Google Scholar]
- Strasburg JL, Sherman NA, Wright KM, Moyle LC, Willis JH, Rieseberg LH. What can patterns of differentiation across plant genomes tell us about adaptation and speciation? Philos Trans Royal Soc Series B. 2012;367:364–373. doi: 10.1098/rstb.2011.0199. [DOI] [PMC free article] [PubMed] [Google Scholar]
- Sun JX, Helgason A, Masson G, et al. (11 co-authors) A direct characterization of human mutation based on microsatellites. Nat Genet. 2012;44:1161–1165. doi: 10.1038/ng.2398. [DOI] [PMC free article] [PubMed] [Google Scholar]
- Tajima F. Statistical method for testing the neutral mutation hypothesis by DNA polymorphism. Genetics. 1989;123:585–595. doi: 10.1093/genetics/123.3.585. [DOI] [PMC free article] [PubMed] [Google Scholar]
- Tishkoff SA, Varkonyi R, Cahinhinan N, et al. (17 co-authors) Haplotype diversity and linkage disequilibrium at human g6pd: recent origin of alleles that confer malarial resistance. Science. 2001;293:455–462. doi: 10.1126/science.1061573. [DOI] [PubMed] [Google Scholar]
- Trifonov E. The multiple codes of nucleotide sequences. Bull Math Biol. 1989;51:417–432. doi: 10.1007/BF02460081. [DOI] [PubMed] [Google Scholar]
- Trifonov E. Tuning function of tandemly repeating sequences: a molecular device for fast adaptation. In: Wasser S, editor. Evolutionary theory and processes: papers in honour of Eviatar Nevo. Dordrecht (The Netherlands): Kluwer Academic Publishers; 2004. [Google Scholar]
- Vigouroux Y, Jaqueth JS, Matsuoka Y, Smith OS, Beavis WD, Smith JS, Doebley J. Rate and pattern of mutation at microsatellite loci in maize. Mol Biol Evol. 2002;19:1251–1260. doi: 10.1093/oxfordjournals.molbev.a004186. [DOI] [PubMed] [Google Scholar]
- Vinces M, Legendre M, Caldara M, Hagihara M, Verstrepen K. Unstable tandem repeats in promoters confer transcriptional evolvability. Science. 2009;324:1213–1216. doi: 10.1126/science.1170097. [DOI] [PMC free article] [PubMed] [Google Scholar]
- Wiehe T. The effect of selective sweeps on the variance of the allele distribution of a linked multiallele locus: hitchhiking of microsatellites. Theor Popul Biol. 1998;53:272–283. doi: 10.1006/tpbi.1997.1346. [DOI] [PubMed] [Google Scholar]
- Wierdl M, Dominska M, Petes TD. Microsatellite instability in yeast: dependence on the length of the microsatellite. Genetics. 1997;146:769–779. doi: 10.1093/genetics/146.3.769. [DOI] [PMC free article] [PubMed] [Google Scholar]
- Wren J, Forgacs E, Fondon J, Pertsemlidis A, Cheng S, Gallardo T, Williams R, Shohet R, Minna J, Garner H. Repeat polymorphisms within gene regions: phenotypic and evolutionary implications. Am J Hum Genet. 2000;67:345–356. doi: 10.1086/303013. [DOI] [PMC free article] [PubMed] [Google Scholar]
- Wright S. The distribution of gene frequencies in populations. Proc Natl Acad Sci U S A. 1937;23:307–320. doi: 10.1073/pnas.23.6.307. [DOI] [PMC free article] [PubMed] [Google Scholar]
- Xu X, Peng M, Fang Z, Xu X. The direction of microsatellite mutations is dependent upon allele length. Nat Genet. 2000;24:396–399. doi: 10.1038/74238. [DOI] [PubMed] [Google Scholar]
Associated Data
This section collects any data citations, data availability statements, or supplementary materials included in this article.