

Abstract
Cytotoxic T lymphocyte-associated antigen-4 (CTLA-4; CD152) is of pivotal importance for self-tolerance, with deficiency or unfavorable polymorphisms leading to autoimmune disease. Tolerance to self-antigens is achieved through thymic deletion of highly autoreactive conventional T (Tconv) cells and generation of FoxP3+ regulatory T (Treg) cells. The main costimulatory molecule, CD28, augments the negative selection of Tconv cells and promotes the generation of FoxP3+ Treg cells. The role of its antagonistic homolog CTLA-4, however, remains a topic of debate. To address this topic, we investigated the thymic development of T cells in the presence and absence of CTLA-4 in a T-cell receptor (TCR) transgenic mouse model specific for the myelin basic protein peptide Ac1–9. We reveal that CTLA-4 is expressed in the corticomedullary region of the thymus. Its absence alters the response of CD4+CD8− thymocytes to self-antigen recognition, which affects the quantity of the Treg cells generated and broadens the repertoire of peripheral Tconv cells. T-cell repertoire alteration after deletion of CTLA-4 results from changes in TCR Vα and Jα segment selection as well as CDR3α composition in Tconv and Treg cells. CTLA-4, therefore, regulates the early development of self-reactive T cells in the thymus and plays a key role in central tolerance.
Keywords: costimulation, immune regulation, experimental autoimmune encephalomyelitis
T-cell tolerance to self-antigens is a crucial factor in the prevention of autoimmune disease. Intrathymic negative selection of autoreactive T cells and induction of regulatory cells together aid the avoidance of peripheral T-cell activation that would otherwise lead to tissue destruction. The affinity of the T-cell receptor (TCR) for self-antigens, some but not all of which are expressed in the thymus under the control of the transcription factor Aire (autoimmune regulator), plays an important role in the survival of developing T cells (1, 2). High-affinity interaction of the TCR with self-antigen–derived peptide–MHC complexes generally results in clonal deletion or inactivation (3–6), but it may also result in the up-regulation of the transcription factor FoxP3 (7, 8), thus inducing regulatory T (Treg) cell function. Thymic selection, however, is not merely controlled by TCR affinity alone. Other factors, such as cytokines, chemokines, adhesion molecules, and costimulatory signals, have been shown to play a role in negative selection of conventional T (Tconv) cells and generation of Treg cells (9–11). Ligation of the costimulatory molecule CD28 during thymic development of CD4+ Tconv cells augments clonal deletion (12, 13). In contrast, CD28-deficient mice show markedly lower numbers of FoxP3+ Treg cells in the thymus and periphery (14–16). This effect of CD28 may involve one or a combination of several mechanisms: CD28 can enhance the avidity of T cell–antigen-presenting cell interaction, it may promote IL-2 production (16), or there could be direct signaling effects on T-cell survival, including regulation of proapoptotic Fas/FasL (17) or antiapoptotic Bcl-XL (18).
Cytotoxic T lymphocyte-associated antigen-4 (CTLA-4), an antagonistic homolog of CD28, is known to be of crucial importance for the prevention of autoimmune disease. Non-TCR transgenic, CTLA-4–deficient mice die of lymphoproliferative disease and organ infiltration within 3–4 wk (19, 20). In humans, SNPs within the CTLA-4 locus have been linked to susceptibility to autoimmune disease (21, 22). The direct effects of polymorphisms on CTLA-4 function are poorly understood, but taken together, these results suggest that minor alterations to CTLA-4 can have dramatic effects on the activity and/or generation of Tconv and Treg cells. Although the contribution of CD28 to the thymic development of CD4+ T cells is well-defined, a potential role for CTLA-4 remains debated. Several groups have investigated the role of CTLA-4 during negative selection, mostly finding that CTLA-4 signaling prevents deletion of developing thymocytes, thus counteracting the effect of CD28 (23–26). We recently showed that, in a TCR transgenic mouse model (Tg4), where >90% of T cells bear a TCR specific for the myelin basic protein (MBP) -derived peptide Ac1–9, a greater number of FoxP3+ Treg cells were generated in the thymus in the absence of CTLA-4 (27), again seemingly counteracting the reported role of CD28 in this process. Indeed, blocking CD28 in fetal thymic organ cultures abrogated FoxP3 expression completely, even in CTLA-4–deficient thymi. In the absence of CTLA-4, some FoxP3+ Treg cells were selected ectopically in areas of the thymic cortex, whereas in WT mice, Foxp3 expression was induced predominantly in the medulla. Other studies of CTLA-4–deficient models have also reported elevated numbers of FoxP3+ Treg cells in the periphery but not in the thymus (28–30). To clarify the role of CTLA-4 in the thymus, we have extensively researched the effect of CTLA-4 deficiency on the generation of Tconv and Treg cells in the Tg4 mouse. Here, we show expression of CTLA-4 in the corticomedullary area of the thymus, suggesting a role during negative selection. Absence of CTLA-4 during thymic selection changes the cytokine pattern of peripheral Tconv cells in addition to its previously reported role in the generation of Foxp3+ Treg cells. These changes coincide with a reduced T cell–APC clustering ability and elevated activation threshold of CTLA-4–deficient T cells. We subsequently analyzed the use and characteristics of TCRα chains in WT and CTLA-4–deficient Tg4 thymocytes. The Tg4 mouse expresses both a transgenic T-cell receptor β variable (TRBV) 13.2 (Vβ8.2) and a transgenic T-cell receptor α variable (TRAV) 6 (Vα4). The transgenic TCRβ prevents additional expression of endogenous β-chains, but allelic exclusion does not occur for the TCRα, thus allowing the additional expression of up to two different endogenous chains. By analyzing the expression of 20 TRAV families, we show that ∼60–75% of all TRAVs used combined with the transgenic TRBV13.2 fall within either the TRAV6 (as in the TCRα transgene) or TRAV13 (Vα10) families. For these two TRAV families, millions of sequences were analyzed to define their T-cell receptor α junctional (TRAJ) gene segment use and complementarity determining region 3 (CDR3) compositions. We found that the absence of CTLA-4 led to vast differences in the sequence of the purely endogenous TRAV13 family in both CD4+ Tconv cells and FoxP3+ Treg cells. Overall, our results reveal that CTLA-4 plays a key role in tuning the TCR repertoire of self-antigen–specific T cells during thymic selection by controlling the properties of peptide-binding CDR3 regions and thereby, skewing the number and characteristics of peripheral Tconv and Treg cells.
Results
CTLA-4 Is Expressed Mainly by Thymocytes in the Corticomedullary Junction.
CTLA-4 has previously been shown to be expressed by CD4+CD8− (CD4SP) and CD4+CD8+ (DP) thymocytes on activation with anti-CD3 antibody in vitro or in vivo (24, 25). To confirm the role of CTLA-4 in thymic selection, we sought to characterize its natural, in situ expression by thymocytes. Consequently, we used confocal microscopy to identify the expression of CD4, CD80 (B7.1), and CTLA-4 in thymus sections from 6- to 7-wk-old Tg4 and non-TCR transgenic B10.PL mice expressing the same MHC II (I-Au). Cytokeratin-5 was used to distinguish cortical and medullary areas, which showed that CTLA-4 was commonly expressed by CD4SP cells in cortex-proximal regions of the thymic medulla and less abundantly by CD4CD8DP cells in the medulla-proximal cortex (Fig. 1A). The density of CTLA-4 expression seemed lower in the nonself-antigen–specific B10.PL mouse than in the Tg4, but overall patterns were similar. Quantitative image analysis confirmed that CTLA-4 expression both in Tg4 and B10.PL mice occurs mostly in the corticomedullary junction, defined as an area 250 μm on either side of the cytokeratin-5 boundary (Fig. 1B). This location suggests that CTLA-4 is expressed during negative selection, akin to its role described previously (23–26). The CTLA-4 ligand CD80 was found almost exclusively in the medulla (Fig. 1A) in concurrence with its known expression on activated medullary thymic epithelial cells (31, 32). CD86 is present both in the medulla and scattered throughout the cortex (32, 33). The imaging results were followed by flow cytometric analysis of CD4SP and CD4CD8DP thymocytes from age-matched (6- to 8-wk) Tg4 and B10.PL mice directly ex vivo. The relative size of CD4SP and CD4CD8DP thymocyte populations differed markedly between the two, with Tg4 mice exhibiting a skew to CD4SP cells (Fig. 1C). CTLA-4 expression, as also indicated by the in situ staining, was more predominant on CD4SP cells in both the Tg4 and B10.PL mouse (Fig. 1D). The percentage of CTLA-4+ cells in the B10.PL thymus was higher than in the Tg4, unlike what may be assumed from the imaging data, but this result may be accounted for by the different ratios of CD4SP and CD4CD8DP cells and perhaps, differences in fluorescence sensitivity between the two techniques. CTLA-4+ cells in images of B10.PL thymi appear dimmer than in Tg4 thymi. A greater percentage of CTLA-4+ CD4SP cells in the B10.PL thymus was expected, because these mice show augmented selection of FoxP3+ cells that constitutively express CTLA-4. Gating on CTLA-4+ cells revealed that it was expressed on not only FoxP3+ Treg cells but also, activated FoxP3−CD69+ cells, confirming its role during negative selection. Approximately 60% of CTLA-4+FoxP3− CD4SP cells in both the Tg4 and B10.PL thymi were CD69+, suggesting that the expression of CTLA-4 during selection was not altered as a result of the transgenic TCR. These results prompted us to further investigate whether the expression of CTLA-4 during thymic selection affects the generation of not only FoxP3+ Treg cells, as shown previously (27), but also, Tconv cells in the Tg4 model.
Fig. 1.

CTLA-4 expression in the thymus. (A) Staining of 6-μm-thick frozen sections of the thymi of Tg4 or B10.PL mice (6–7 wk of age) with anti–CTLA-4, anticytokeratin-5, and anti-CD80. Dotted lines trace the border between cortex and medulla. C, cortex; M, medulla. (B) Quantitative image analysis of CTLA-4+ cells in Tg4 and B10.PL thymus sections; 12 images (775 × 775 μm each) of two Tg4 thymi and 20 images of two B10.PL thymi were analyzed for CTLA-4+ punctae. Junction is defined as 250 μm on either side of the cytokeratin-5 boundary, and cortex or medulla is beyond that point. Data represented as mean ± SEM. *P < 0.05, **P < 0.01, ***P < 0.001; Tukey’s multiple comparison test. (C) Isolated thymocytes from Tg4 or B10.PL mice, ages 6–8 wk, stained with anti-CD4 and anti-CD8 antibodies to determine percentage of CD4SP and CD4CD8DP thymocytes. Gated on live single cells. Images are representative of five (Tg4) or four (B10.PL) thymi analyzed. (D) Expression of CTLA-4, CD69, and FoxP3 on live CD4SP or CD4CD8DP thymocytes from Tg4 or B10.PL mice (6–8 wk) directly ex vivo. Representative images. Tg4, n = 5; B10.PL, n = 4. Minimum of 2 × 10⁶ live thymocytes analyzed for each thymus.
CTLA-4 Affects the Cytokine Secretion Profile of Tconv Cells.
In our previous study (27), we showed that a greater number and frequency of FoxP3+ Treg cells were selected in the thymus of CTLA-4KO Tg4 mice. Considering the reported role of CTLA-4 in negative selection (23–26), we asked whether the Tconv cell lineage in this self-antigen–specific model might also be modified. To address this question, we studied the pattern of cytokines produced by naïve CD4+CD62L+ splenic T cells from 6-wk-old CTLA-4WT and CTLA-4KO Tg4 mice after activation. We found that, after one round of in vitro stimulation with specific antigen followed by Phorbol 12-myristate 13-acetate (PMA)/ionomycin treatment to induce a recall response of cytokines produced, Tg4 CTLA-4WT T cells displayed a limited pattern of cytokine production restricted largely to IL-2 and IFN-γ (Fig. 2A). Tg4 CTLA-4KO T cells, however, showed a much more diverse cytokine pattern, with the additional production of IL-4, IL-17, and particularly, IL-10 after the first in vitro stimulation (Fig. 2 A and B). This effect was unexpected, because CTLA-4 is not expressed on splenic Tconv cells until at least 24 h after activation (34). Accordingly, alterations in IL-4 and IL-17 production in other CTLA-4KO models did not occur until after a second TCR stimulation (28, 35–37). The observed effect on IL-10 production has not been reported previously to our knowledge. To confirm that these qualitative alterations in cytokine production result from changes in thymic selection directed by expression of endogenous TCRs rather than the inability to express CTLA-4 during the first round of stimulation, we repeated the same experiments with splenocytes from Rag-deficient mice (ages 4–5 wk) that only express the transgenic TCRαβ. In this case, the absence of CTLA-4 during thymic development or in vitro culture did not result in a shift of cytokine production of peripheral T cells, with all cells showing a typical Th1 phenotype (Fig. 2C). The absence of CTLA-4, therefore, seems to widen the repertoire of Tconv cells in a manner dependent on TCR rearrangement.
Fig. 2.

Cytokine secretion profile of CTLA-4WT and CTLA-4KO naïve CD4+ Tg4 splenocytes. (A) Tg4 CTLA-4WT and CTLA-4KO CD4+CD62L+ splenocytes were stimulated with 1 μg/mL MBP Ac1–9 for 7 d before treatment with PMA/ionomycin for 4 h. Cells were stained for surface CD4 and intracellularly for IL-2, IL-4, IL-10, IL-17, and IFN-γ. Plots are gated on live CD4+ cells and representative of three similar experiments. (B) Percentage (± SEM) of cells producing IFN-γ, IL-2, IL-4, IL-10, or IL-17 as determined by intracellular cytokine staining. One experiment, in triplicate, representative of three similar experiments. *P = 0.0286; Mann–Whitney test. (C) Seven-color intracellular cytokine staining on Tg4 Rag−/− CTLA-4WT or CTLA-4KO cells stimulated with 1 μg/mL MBP Ac1–9 for 7 d followed by 4-h treatment with PMA/ionomycin. Gated on live CD4+ cells. One experiment representative of three identical experiments shown.
Tg4 CTLA-4KO T Cells Display Reduced Dendritic Cell Clustering and Elevated Activation Threshold.
We hypothesized that, in the absence of any particular costimulatory signal, the TCR signal directing thymic selection of both the Tconv and Treg cell lineages would be modified. The absence of the negative regulator CTLA-4 should theoretically allow for the selection of TCRs of lower affinity, which may account for the observed skew in FoxP3 expression and altered cytokine secretion by peripheral CD4+ T cells. To investigate how this process affects the properties of Tg4 cells where only the endogenous TCRα can be rearranged, we looked at the rate of clustering of freshly isolated CD4SP thymocytes, which do not actively express CTLA-4, with nonmatured bone marrow-derived dendritic cells (BMDCs). CD4SP thymocytes from Tg4 CTLA-4WT and Tg4 CTLA-4KO mice were labeled with 5(6)-Carboxyfluorescein diacetate N-succinimidyl ester (CFSE) or cell proliferation dye (CPD) efluor670 and cocultured for up to 2 h with CPD efluor450-labeled BMDCs that had been preloaded with a high-MHC affinity variant of the MBP Ac1–9 peptide (Ac-ASQYRPSQR). Position 4 substitution of the WT residue lysine by tyrosine increases the affinity of the peptide for I-Au (38) but does not seem to affect the qualitative nature of T-cell recognition (39). Fig. 3A shows that CTLA-4WT CD4SP thymocytes started clustering with peptide-loaded BMDCs from as little as 30 min, gradually increasing over time. CTLA-4KO CD4SP thymocytes did not start clustering until after 1 h of culture and never reached the level achieved by CTLA-4WT cells. Importantly, this difference in clustering seemed to depend almost entirely on the recognition of peptide–MHC complexes, because in the absence of peptide, only a limited level of colocalization occurred, even after 2 h. Moreover, the clustering of thymocytes with peptide-loaded BMDCs was reduced substantially by the addition of an anti-MHC II blocking antibody. Importantly, there was no difference in the level of TCR expression between CTLA-4WT and CTLA-4KO CD4SP thymocytes that could account for a difference in avidity (Fig. 3B). The uniform size of CD4SP thymocytes and the consistent labeling with proliferation dyes allowed for the analysis of the number of thymocytes clustered with each BMDC. Fig. 3C shows that, after 2 h, not only have more BMDCs bound at least one thymocyte in conditions using CTLA-4WT CD4+ T cells, but also, the average number of thymocytes bound increased compared with CTLA-4KO cells. This effect became increasingly pronounced over time (Fig. 3D).
Fig. 3.

Effect of CTLA-4 on T cell–APC clustering and activation of naïve CD4+ Tg4 splenocytes. (A) CFSE-labeled CD4SP thymocytes were cocultured with CPD ef450-labeled BMDCs for up to 2 h. Percentages represent BMDCs that cluster with one or more T cells without peptide, when preloaded with 0.1 μg/mL high-affinity MBP Ac1–9, or when preloaded with peptide and cocultured in the presence of 1 μg/mL anti-MHC II (I-A/I-E) blocking antibody. Data are representative of five or more similar experiments. (B) Median fluorescence intensity ± SEM for TCRβ expression (H57–597) on CD4SP thymocytes (n = 6). (C) Flow cytometry plots gated on CPD ef450-labeled BMDCs after 2 h of coculture. BMDCs clustered with at least one CPD ef670+ thymocyte (upper right quadrant of dot plots in Upper) were then analyzed for the number of T cells bound (histograms in Lower). (D) Change in thymocyte binding over time. Gray filled histograms indicate CTLA-4WT, and black open histograms indicate CTLA-4KO. C and D are representative of three identical experiments. (E) Histograms of CD69 expression on naïve CD4+CD62L+ splenocytes from CTLA-4WT or CTLA-4KO mice 24 h after stimulation with increasing doses of MBP Ac1–9. Gated on live CD4+ cells. Where indicated, 10 μg/mL anti–CTLA-4 (9H10) were added at the start of culture. Data representative of three similar experiments. (F) Percentage of CD69-expressing cells (± SEM) 24 h after stimulation of naïve CD4+ T cells with MBP Ac1–9 peptide. Gated on live CD4+ cells. ***P < 0.001; two-way ANOVA with Bonferroni posttest on transformed data. ns, not significant.
The theoretical difference in avidity of TCRs on CTLA-4WT and CTLA-4KO T cells was further supported by studying the activation of naïve CD4+CD62L+ splenic T cells. As mentioned, naïve T cells do not express CTLA-4 until 24 h after activation (34), and therefore, any difference in the activation of deficient cells within this period must result from a prior effect (i.e., expression during thymic selection). We stimulated naïve CTLA-4WT and CTLA-4KO Tg4 T cells with MBP Ac1–9 (4K) peptide for 24 h and determined expression of the early activation marker, CD69. In support of the clustering data, CTLA-4–deficient cells exhibited a reduced up-regulation of CD69, particularly at lower peptide concentrations (Fig. 3 E and F). Blocking CTLA-4 with specific antibody on CTLA-4WT T cells did not have any effect on CD69 expression. Together, these results support the theory that absence of CTLA-4 during thymic selection leads to the selection of T cells of lower TCR avidity.
CTLA-4 Alters Endogenous TCRα Variable Gene Segment Use.
The Tg4 transgenic TCR uses the TRBV13.2 (Vβ8.2) and TRAV6 (Vα4) variable chain segments (6). Lack of allelic exclusion in the TCRα locus allows expression of one or two endogenous α-chains in addition to the transgenic chain. To establish whether CTLA-4 expression during thymic selection alters the endogenous TCRα repertoire selected, we determined the expression of each of 20 different TRAV families in thymic CD4SP CD25− Tconv cells and CD4SP CD25+ Treg cells (Fig. 4A) as well as conventional CD4+CD25− and regulatory CD4+CD25+ T cells from the spleens of Tg4 CTLA-4WT or Tg4 CTLA-4KO mice (Fig. 4B). Two separate primer sets were required to cover all individual members of the TRAV5 and TRAV6 families, and these primer sets were plotted separately. Despite the fact that the thymocytes and splenocytes were not from the same individuals and isolated by a different method, the overall patterns of TRAV expression in the spleen and thymus were remarkably similar; as expected, the TRAV6 family, which includes the transgenic α-chain, was highly expressed in all four groups. Together with the endogenous TRAV13 family, they represented ∼50–60% of TRAV families expressed in Tconv or Treg cells in the thymus, increasing to 60–75% in the spleen. The absence of CTLA-4 led to a clear shift in the prevalence of these TRAV families, with CTLA-4KO cells showing higher expression of endogenous TRAV13. This shift was seen in both Tconv and Treg cells from thymus and spleen. Changes within other TRAV families were less pronounced and consistent from thymus to periphery. The shift in TRAV expression indicated that CTLA-4 does, indeed, affect the generation of the mature TCR repertoire during thymic selection. The influence of peripheral T-cell expansion or conversion seems limited, but to exclude peripheral effects on the TCRα repertoire, all subsequent analyses were performed using pooled CD4SP thymocytes.
Fig. 4.

TRAV use by Tg4 CTLA-4WT and Tg4 CTLA-4KO T cells. RT-PCR analysis for each of 20 TRAV families was performed to determine relative expression levels. (A) CD4SPCD25− Tconv cells and CD4SPCD25+ Treg cells were FACS-sorted and pooled from the thymi of six Tg4 CTLA-4WT or three Tg4 CTLA-4KO females ages 7–9 wk. (B) CD4+CD25− Tconv cells or CD4+CD25+ Treg cells were magnetically isolated and pooled from the spleens of three Tg4 CTLA-4WT or two Tg4 CTLA-4KO males ages 7–9 wk. Two primer sets were required to cover all members of the TRAV5 and TRAV6 families and were plotted separately. Error bars indicate SD.
CTLA-4 Changes the Use of TCRα Junctional Regions.
Although the shift in TRAV expression proves that CTLA-4 plays a role in the thymic selection of T cells, it does not reveal how the characteristics of the TCRα change. Therefore, we focused on the highly expressed endogenous TRAV13 and analyzed the use of each of the 60 individual TRAJ regions by sequencing the α-chains of FACS-sorted CD4SP Tconv and Treg cells from CTLA-4WT and CTLA-4KO Tg4 thymi (Fig. S1). We analyzed between 2.5 and 5 million sequences from each subset, which allowed very accurate determination of TCR diversity, V and J segment use, and CDR3 composition. Looking only at TRAJ regions that form functional genes (22 of 60 are pseudogenes or ORFs according to ImMunoGeneTics (IMGT); www.imgt.org), CTLA-4KO Treg cells used the fewest TRAJ regions, with 21 of 38 (55%) cells found at least one time among the millions of sequences analyzed, whereas CTLA-4WT Treg cells used the widest range at 84% (Fig. 5A). Interestingly, in CTLA-4KO Treg cells, less than 1% of functional TRAJ genes that combined with TRAV13 were in frame, meaning that, although TRAV13 is highly expressed by these cells, it rarely leads to a functional TCRα. In comparison, in each of the other three cell populations, around 60% of functional TRAJ genes were in frame (Fig. 5B and Fig. S2). Although a wide range of TRAJ gene segments were used in each group, their frequencies varied greatly between the four populations. In Tconv cells, over 97% of in-frame sequences were from only three functional genes, whereas Treg cells used a much greater variety (Fig. 5 C and D). The influence of CTLA-4 on TCRα arrangement was astoundingly clear at this level, particularly in Tconv cells. Although both CTLA-4WT and CTLA-4KO Tconv cells used predominantly three individual TRAJ genes, none were shared between them. TRAJ31, TRAJ42, and TRAJ45 made up the bulk of in-frame, functional genes used in CTLA-4WT Tconv cells, whereas in the CTLA-4KO Tconv cells, TRAJ23, TRAJ33, and TRAJ35 were used. Another clear difference in TRAJ use was found among Treg cells. Most strikingly, of the in-frame, functional genes found in CTLA-4KO Treg cells, nearly one-half were from TRAJ27, which represented fewer than 5% of sequences from CTLA-4WT Treg cells.
Fig. 5.

TRAJ use with TRAV13 in Tg4 CTLA-4WT and Tg4 CTLA-4KO thymocytes. To determine TRAJ use combined with TRAV13 in CD4SP thymocytes, we analyzed 2.6 million sequences from CTLA-4WT Tconv cells, 5.2 million sequences from CTLA-4KO Tconv cells, 4.2 million sequences from CTLA-4WT Treg cells, and 5.2 million sequences from CTLA-4KO Treg cells. (A) Percentage of functional TRAJ regions used at least one time within the millions of sequences analyzed. (B) Percentage of functional TRAJ regions used that were in frame. (C) Comparison of relative frequency of each functional, in-frame TRAJ region used with TRAV13 in CTLA-4WT and CTLA-4KO Tconv and Treg cells. (D) Graphic representation of relative use of functional, in-frame TRAJ regions used with TRAV13 that make up at least 5% of the total found in either cell type.
CTLA-4 Affects the Diversity and Sequence of Endogenous CDR3α Regions in Tg4 Tconv and Treg Cells.
Our findings with T cell–DC clustering and naïve T-cell activation suggested that the shift in thymic selection of Tconv and Treg cells in the absence of CTLA-4 resulted from an altered affinity of TCRs using endogenous α-chains, because TCRs using the transgenic chain cannot change their affinity for the cognate peptide. It is important to note that MBP is expressed in the thymus, but because of its unstable binding to I-Au MHC II, MBP Ac1–9 expression does not lead to negative selection of all cells with specific TCRs (40–42). The main site of peptide recognition in the TCRα is the CDR3, created by the combination of TRAV and TRAJ gene segments. The changes in TRAV and TRAJ segments resulting from CTLA-4 deficiency should, thus, affect this region and hence, the TCR peptide-binding qualities. To investigate, we looked at CDR3 length, which contributes to diversity and therefore, potentially peptide affinity and specificity. Our analysis of TRAV13 CDR3 length showed a greater diversity in Treg than Tconv cells, regardless of CTLA-4 expression (Fig. 6A). This augmented diversity has been reported before in one model but contradicted in other mouse models (43–45). The difference in CDR3 length between Tconv and Treg cells in our model was more pronounced in CTLA-4WT than CTLA4KO mice and consistent with the greater variability in TRAJ gene segment use. Interestingly, in the absence of CTLA-4, some Tconv cells seem to show a preference for shorter CDR3 sequences. In both varieties of Tconv cells, ∼68% of CDR3 regions were 20 aa in length; however, in CTLA-4KO cells, the remaining 32% were 18 aa in length, whereas in CTLA-4WT cells, these regions were predominantly 19 aa in length.
Fig. 6.

CDR3 characteristics of TCRα that use TRAV13. (A) Relative frequency of each CDR3 length (in number of amino acids) in CTLA-4WT and CTLA-4KO Tconv and Treg cells. (B) Box and whisker plots of hydrophilicity and PI of CDR3α regions from CTLA-4WT and CTLA-4KO Tconv and Treg cells. Data weighted according to relative expression of each unique CDR3. Horizontal line indicates median value, box covers the interquartile range, bars show variance, gray dots show maximum outliers, and gray crosses display mean. Differences in hydrophilicity and PI between each of the four T-cell groups are all statistically significant (P < 0.0001; Mann–Whitney u test). (C) Correlation plots for hydrophilicity and PI. Each unique CDR3α found more than one time in the cell population indicated was plotted for its specific value and the number of times that it was encountered.
To determine differences in peptide-binding potential more closely, we next compared the CDR3 amino acid composition of the three most common TRAV13.TRAJ combinations for each Tconv cell subset with the same combination in matching Treg cells. Treg cells are generally thought to have TCRs of higher peptide affinity than Tconv cells (7, 8), which should be reflected in the CDR3 sequence. For CDR3 analysis in this study, the 6 aa of the germ-line sequence of TRAV13 leading up to the hypervariable CDR3 region were included, because the aspartic acid (position 1) and glycine (position 3) were previously suggested to be important for the binding of MBP Ac1-11/I-Au complexes (46). More pronounced than in most other models (47), there was a complete disparity of the amino acid composition of CDR3 regions between Tconv and Treg cells in the Tg4 CTLA-4WT mouse (Table S1, upper half). In CTLA-4KO mice, the difference in CDR3 amino acid sequence between Tconv and Treg cells was less dramatic than in CTLA-4WT cells (Table S1, lower half); only in the TRAV13.TRAJ33 combination were the most common sequences markedly different and found to be shorter in Treg than Tconv cells. In the TRAV13.TRAJ23 and TRAV13.TRAJ35 combinations, the CDR3 amino acid composition was identical for Tconv and Treg cells, but the TRAV13 germ-line sequence showed a phenylalanine to leucine substitution at position 6. This substitution occurred in all three common TRAV13.TRAJ combinations found in CTLA-4KO Tconv cells and may have great implications for TCR affinity, because it indicates that CTLA-4KO Treg cells used a different member of the TRAV13 family, characterized by other CDR1 and CDR2 regions, important for MHC recognition.
To investigate whether TCRs of different affinity would be selected in the Treg cell lineage in the absence of CTLA-4, we compared their CDR3α amino acid composition. Table 1 lists the CDR3 regions of the most common TRAV13.TRAJ combinations shared between CTLA-4WT and CTLA-4KO Treg cells. The amino acid compositions for TRAV13.TRAJ22, TRAV13.TRAV33, and TRAV13.TRAV49 were largely identical in CTLA-4WT and CTLA-4KO cells, although the aforementioned phenylalanine to leucine substitution in the TRAV13 carboxyl-terminal germ-line sequence was again common. TRAV13.TRAJ43 and TRAV13.TRAJ27, the latter of which accounts for nearly one-half of all CDR3α in CTLA-4KO Treg cells, showed not only a reduced length in CTLA-4KO Treg cells (20 vs. 22 aa) but also, a shift in amino acids used, indicating a shift in peptide recognition ability. Most informative were the results from TRAV13.TRAJ31, TRAV13.TRAV42, and TRAV13.TRAJ45. Here, most CDR3α sequences expressed commonly in CTLA-4WT Treg cells were also expressed in CTLA-4KO Treg cells, accounting for 45–60% of the CDR3α in CTLA-4KO Treg cells (Table 1, italics). Another 30–45% of CDR3α sequences in CTLA-4KO Treg cells were found only in Tconv cells in WT mice (Table 1, bold). Although the change in the TRAV13 germ-line sequence in CTLA-4KO Treg cells does not allow us to claim a direct Tconv to Treg shift in the absence of CTLA-4, the shared and identical CDR3α is nevertheless remarkable.
Table 1.
Comparison of CDR3α amino acid composition for common TRAV13.TRAJ combinations used by both CTLA-4WT and CTLA-4KO Treg cells
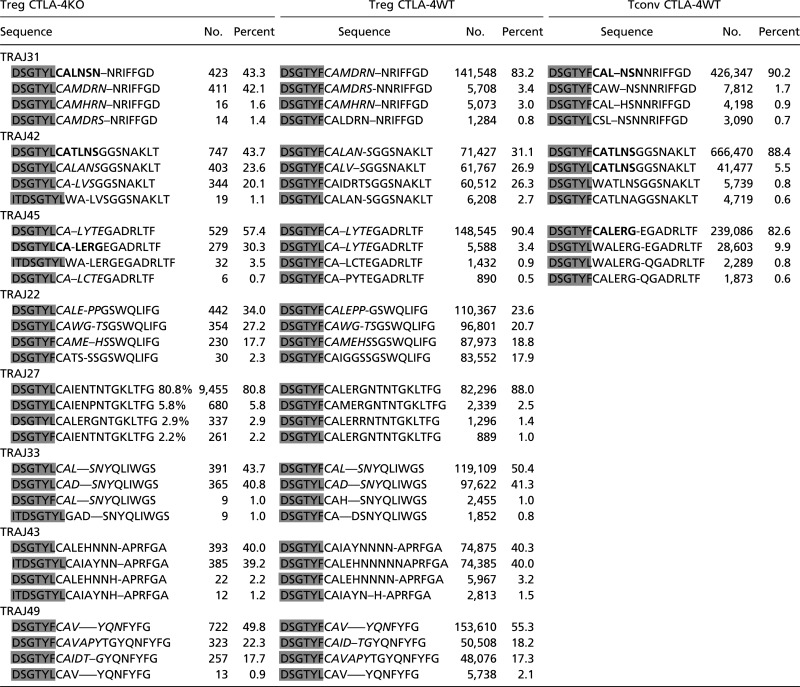 |
Data represent the CDR3 amino acid sequences of TRAV13.TRAJ combinations commonly found in Treg cells. The four most common sequences in each combination are compared between CTLA-4KO Treg cells, CTLA-4WT Treg cells, and where applicable, CTLA-4WT Tconv cells. Italic letters indicate sequences shared by CTLA-4KO Treg cells and CTLA-4WT Treg cells, bold letters indicate sequences shared by CTLA-4KO Treg cells and CTLA-4WT Tconv cells, and shaded letters represent amino acids that are part of the germ-line sequence of TRAV13.
Changes in CDR3α Composition Dictate Peptide-Binding Potential.
The observed changes in CDR3α amino acid composition clearly indicate that, in the absence of CTLA-4, a shift occurs in the affinity of TCRs of both Tconv and Treg cells. To try and define the difference in binding potential of CDR3α regions, we calculated the isoelectric point (PI; indicative of charge) and average hydrophilicity, which each affect peptide/MHC-binding affinity (48, 49). Comparison of the CDR3 properties of the three most common TRAV13.TRAJ combinations in CTLA-4WT Tconv cells with the same combination in matching Treg cells confirmed that Treg cells require different binding characteristics to use the same CDR3α, which was suggested by the change in amino acid composition (Fig. S3). However, the difference in PI and hydrophilicity between Treg and Tconv cells was not consistent at this level, with both higher and lower values found for the same parameters. A highly compelling change became apparent comparing the CDR3α properties of CTLA-4WT with CTLA-4KO Tconv cells. Considering that there was no overlap in the use of TRAJ regions between these groups, we combined all TRAV13 CDR3α regions within either group and compared overall weighted values for PI and hydrophilicity. This approach revealed that, in the absence of CTLA-4, CDR3α regions were selected with strikingly lower hydrophilicity and PI, which would alter peptide-binding properties substantially (Fig. 6B). We next compared these values with those values of Treg cells and found that, in the WT Tg4 mouse, CDR3α sequences of Treg cells had a significantly lower median hydrophilicity and PI than matching Tconv cells. CTLA-4KO Treg cells, however, had significantly higher values for hydrophilicity and PI than equivalent Tconv cells. Finally, in the absence of CTLA-4, Treg cells developed CDR3α with higher values for hydrophilicity and lower PI. Correlation plots (Fig. 6C) of each CDR3α sequence that occurred more than one time within millions of sequences analyzed for each cell population revealed that, compared with Tconv cells, Treg cells had a wider range of PI and hydrophilicity, within which CDR3α was selected at high frequency, consistent with the greater diversity of TRAJ regions and therefore, CDR3 sequences. Interestingly, whereas CTLA-4WT Tconv cells had one defined range of hydrophilicity that allows specific CDR3 to be selected frequently, two distinct peaks occurred in the absence of CTLA-4. Therefore, although both CTLA-4WT and CTLA-4KO Tconv cells had an equally limited CDR3 diversity, with only three TRAJ gene segments used preferentially, the latter cells seem to have a broader range of peptide-binding properties.
We conclude that, in the Tg4 model, CTLA-4 tunes the strength of activation signals during thymic selection and thereby, determines the avidity of the TCR required for progression into the mature T-cell population. In the absence of CTLA-4, endogenous TCRα chains of altered peptide recognition are selected; this altered TCR repertoire then widens the diversity of Tconv cells and skews the direction of developing thymocytes to the FoxP3+ Treg cell lineage.
Discussion
In this study, we have investigated the influence of CTLA-4 on the thymic generation of self-antigen–specific Tconv and Treg cells in TCR transgenic Tg4 mice using in-depth TCRα analysis and functional assays. We show that CTLA-4 is expressed in the thymus without the need for exogenous stimulation using anti-CD3. CTLA-4 expression was most apparent in the corticomedullary area of the thymus of both nontransgenic B10.PL and Tg4 mice, which was expected from its reported role in negative selection (23–26). Imaging results suggested that the quantity of CTLA-4 protein in CTLA-4+ thymocytes in the Tg4 model may be augmented. Furthermore, flow cytometric analysis showed that the thymic composition was altered as a result of the transgenic TCR, but the incidence of CTLA-4+FoxP3− CD4SP thymocytes that express CD69 and are undergoing thymic selection was not affected. We show in this report that the expression of CTLA-4 in the Tg4 thymus affects not only the thymic generation of FoxP3+ Treg cells but also, Tconv cells by altering the TCR repertoire. Exactly how the low level of expression of CTLA-4 in the thymus can have such a profound effect on T-cell selection is perhaps perplexing, but two factors may play a role. First, CTLA-4 only needs to be expressed at the time of self-antigen recognition to have an effect, and therefore, its expression on any individual cell can be short-lived and transient. As shown previously, CTLA-4 is up-regulated on thymocytes after TCR-mediated activation (25). Second, for CTLA-4 to have its effect on all peripheral T cells, it will only have to be expressed on thymocytes that successfully undergo positive and negative selection. The efficiency of thymic selection in the Tg4 model remains unknown but like thymic selection in general, may not be very high.
Thymocytes in the Tg4 mouse model express a transgenic TRBV13 and TRAV6, but this expression does not inhibit the expression of endogenous TRAV gene segments. The dual expression of different TRAV genes in the same cell is not uncommon, because at least one-third of CD4+ T cells in nontransgenic mice express two TRAV regions (50), with the frequency of dual-expressing cells higher in Treg than Tconv cells (51). Our analysis of TRAV use in CTLA-4WT and CTLA-4KO Tg4 mice showed that, in the absence of CTLA-4, a greater proportion of sequences were from the endogenous TRAV13 rather than the transgenic TRAV6. This finding could reflect either a greater positive selection of thymocytes expressing the endogenous TRAV13 rather than the transgenic TRAV6 or an increase in cells expressing both TRAV13 and TRAV6.
The effect of CTLA-4 on TCRα use in Tconv cells is clear from the TRAV analysis, although the effect is even more apparent when looking at the use of junctional regions combined with TRAV13. In both CTLA-4WT and CTLA-4KO Tconv cells, over 97% of all TRAJ regions that combine with TRAV13 are from only three families; however, there is no overlap between these dominant regions, indicating that Tg4 Tconv cells developing in the absence of CTLA-4 have different requirements to their endogenous TCRα. Analysis of TRAJ region use further highlights the difference in TCRα between Tconv and Treg cells. One remarkable observation was that, in CTLA-4KO Treg cells, greater than 99% of all TRAJ regions expressed with TRAV13 were out of frame, indicating that, although TRAV13 was commonly expressed by these cells, it rarely led to a functional α-chain. In Tconv cells or CTLA-4WT Treg cells, around 60% of TRAV13-associated TRAJ regions were in frame. A recent study (52) suggested that out-of-frame selection is not a random process as expected, although the rules that govern this process remain to be elucidated. Still, CTLA-4KO Treg cells must express a successfully rearranged endogenous TCRα, because Tg4 RagKO CTLA-4KO mice that only express the transgenic α-chain, do not harbor FoxP3+ Treg cells (27). The high frequency of out-of-frame TRAJ region sequences, therefore, is unlikely to occur for other TRAV families used by CTLA-4KO Treg cells. Focusing on in-frame sequences, it is clear that Treg cells use a greater diversity of TRAJ regions combined with TRAV13 than Tconv cells, which primarily used only three different TRAJ gene segments but showed no overlap between CTLA-4WT and CTLA-4KO cells. CTLA-4WT and CTLA-4KO Treg cells expressed largely the same wide range of TRAJ regions but differed considerably in their preferences. For example, nearly one-half of TRAJ sequences in the CTLA-4KO Treg cells were from TRAJ27, whereas in CTLA-4WT Treg cells, no single TRAJ made up more than 18% of the total. TRAJ region analysis in addition to TRAV gene expression, therefore, not only confirmed that TCRα is altered in the absence of CTLA-4, but also, it showed that Treg cells have a much wider range of TCRα than Tconv cells.
The combination of TRAV and TRAJ gene segments forms the CDR3α, the region responsible for peptide recognition. CTLA-4WT and CTLA-4KO Tconv cells differed in CDR3α length; in both, ∼2/3rds of sequences were 20 aa in length, whereas the remaining 1/3rd was either 19 or 18 aa in length, respectively. The length of the CDR3 region has previously been implicated in the differentiation of Tconv cells to either a Th1 or Th2 phenotype (53). Similarly, CTLA-4–deficient mice have been shown to exhibit a skewed repertoire of Th1, Th2, and Th17 cells, which was also reported here for Tg4 CTLA-4KO mice (28, 35–37). In our model, CDR3α using the endogenous TRAV13 showed a greater diversity in length in Treg cells than Tconv cells, which was previously found by one group (43), although other groups have found a comparable (44) or lower (45) diversity in different models.
Diversity of CDR3 regions is not just determined by variation in length but more importantly, also by changes in amino acid composition. We show here that, in CDR3α regions shared between CTLA-4WT Tconv and Treg cells (i.e., the same combination of TRAV13 with a particular TRAJ region), there was no overlap of identical sequences at all, whereas CTLA-4KO Tconv and Treg cells had several sequences in common. Sequence homology between CDR3 regions of Tconv and Treg cells varies from model to model and may well depend on the relative contribution of the TCR to the total avidity of activation signals received during thymic selection (47). One very remarkable observation in this study came from the comparison of the endogenous CDR3α from CTLA-4WT Tconv cells with CTLA-4KO Treg cells. CTLA-4WT Treg cells did not exhibit sequence homology of shared CDR3 regions with CTLA-4WT Tconv cells, but CTLA-4KO Treg cells shared at least one-third of their sequences with each of CTLA-4WT Treg and Tconv cells. Although there are minor differences in TRAV13 germ-line sequence between CTLA-4KO Treg cells and CTLA-4WT Tconv cells, the shared CDR3 sequences provide the tantalizing prospect of cells with a TCR avidity normally found in Tconv cells being driven to FoxP3 expression in the absence of CTLA-4 signaling. This effect might help to explain the elevated number of FoxP3+ Treg cells and augmented resistance to autoimmune disease observed in CTLA-4–deficient Tg4 mice (27).
The difference in amino acid composition of CDR3α regions can be used to calculate properties known to affect TCR affinity. The Geiger laboratory previously published two studies looking at the hydropathy and charge of CDR3β from Tconv and Treg cells in a myelin oligodendrocyte glycoprotein-specific model (48, 49) and found a significant difference only in net charge. In their model, FoxP3+ Treg cells showed a higher charge and seemingly higher hydrophilicity of CDR3β, although the latter was not significantly different because of a much lower number of sequences analyzed than in this study. In our CDR3α analysis, we found CTLA-4WT Treg cells to have regions of a significantly lower hydrophilicity and PI (indicative of charge) than CTLA-4WT Tconv cells. More strikingly, CTLA-4KO Tconv cells showed an even greater difference in PI and hydrophilicity compared with their WT counterparts. It is difficult to link these differences directly to either a higher or lower TCR affinity, because it also depends on other factors, such as the amino acid composition of the CDR3, the charge properties of the antigen–MHC target, and the interaction of the CDR1 and CDR2 regions with MHC II; however, these results certainly indicate that differences in binding properties will occur in the absence of CTLA-4. We have shown the effect of CDR3α deviations on TCR avidity by studying the clustering of CD4SP thymocytes with peptide-loaded BMDCs. Differences are small, because either the avidity is the combined result of TCRs using the transgenic α- and β-chains and TCRs using the rearranged endogenous α-chain or greater differences would not allow thymic selection. From these results and the effect on CD69 up-regulation, it seems that, in the absence of CTLA-4, CD4+ T cells with lower TCR avidity are selected in the thymus. This result is consistent with a model of total avidity for the selection of thymocytes. The absence of negative signaling through CTLA-4 necessitates a lower TCR signal to reach the total level of activation required for successful thymic selection. The effect of costimulatory signals, including CTLA-4, on thymic selection may be particularly relevant in the Tg4 mouse model because of the unusually low affinity and instability of the binding of MBP Ac1–9 to I-Au, which limits the activation signals received through the TCR (54).
Finally, this study may explain why FoxP3+ Treg cells in our model are functional suppressors, despite the absence of CTLA-4. By restricting the TCR specificity to a thymically expressed antigen, we allowed developing thymocytes to compensate for the absence of CTLA-4 by lowering their TCR avidity, thereby reaching the same level of total activation signals as in the presence of CTLA-4.
In summary, we here show that CTLA-4 is expressed in the thymus, where it works together with other signals to set the required level of TCR avidity and determine the development of both Tconv and Treg cells.
Materials and Methods
Mice.
Tg4 CTLA-4WT and CTLA-4KO mice as well as their Rag-deficient counterparts were described previously (6, 27). These mice and B10.PL mice were bred under specific pathogen-free conditions. Experiments were carried out under a United Kingdom Home Office Project License and subject to assessment by the University of Bristol ethical review committee.
Peptides.
The acetylated N-terminal peptide of murine MBP, Ac1–9 (Ac-ASQKRPSQR), and its higher MHC affinity analog with K-Y substitution were custom synthesized (purity > 85%; GL Biochem).
In Situ Immunofluorescent Staining.
Thymi from Tg4 CTLA-4WT and B10.PL mice (6–7 wk) were embedded in OCT Compound (Tissue-Tek) and frozen over liquid nitrogen immediately after removal; 6-μm-thick sections were fixed in ice-cold acetone, permeabilized with 0.1% Triton X-100 (Sigma) in PBS, and then blocked with 4% (wt/vol) BSA in PBS. Sections were first incubated with polyclonal rabbit anticytokeratin-5 (Covance Research Products) at 1 μg/mL in MAXBind buffer (Active Motif). This antibody was detected with donkey anti-rabbit Cyanine 3 (Jackson ImmunoReseach) used at 1 μg/mL Sections were simultaneously incubated with AlexaFluor488-conjugated hamster anti–CTLA-4 (clone 1B8; AbD Serotec) and AlexaFluor647-conjugated rat anti-CD80 (clone GL-1; Biolegend), both at 5 μg/mL Sections were mounted with ProLong Gold antifade reagent (Invitrogen). Images were acquired on an SP5 confocal imaging system attached to a DMI 6000 inverted microscope (Leica) with a 20× objective lens using 488-, 561-, and 633-nm laser lines. Images were captured in Leica Application Suite and exported to Volocity 5 (Perkin-Elmer) for analysis, and Photoshop CS4 (Adobe) was used to present images.
Flow Cytometry.
Cell sorting was performed using a FACSVantage or Influx cell sorter (BD). Flow cytometric analysis was performed using an LSR II flow cytometer (BD). CTLA-4 expression on thymocytes was determined using anti-CD69–FITC, anti–CTLA-4 (clone UC10-4B9) -PE, anti-FoxP3 (FJK-16S) -efluor 450, anti-CD8–APC, and anti-CD4–AlexaFluor700 antibodies, with fixable viability dye efluor 780 (eBioscience) used to exclude dead cells. Anti-CD69–FITC, anti-CD4–AlexaFluor700, and viability dye efluor 780 were used for naïve T-cell activation studies. Results were analyzed using FlowJo analysis software (Tree Star).
T-Cell Isolation.
CD4+CD62L+ T cells were isolated from splenocytes using a naïve T-cell isolation kit (Miltenyi Biotec). CD4+CD25+ Treg cells from the spleen were isolated using the CD4+CD25+ Treg isolation kit (Miltenyi). CD4SP thymocytes for clustering were isolated using a CD4+ T-cell isolation kit II with added anti-CD8a microbeads at the second stage of labeling (Miltenyi Biotec). CD4SPCD25− and CD4SPCD25+ thymocytes for TCRα analysis were FACS-sorted. Freshly isolated thymocytes were stained with anti-CD8–FITC, anti-CD4–APC, and CD25-PE before sorting, with propidium iodide used to exclude dead cells.
Intracellular Cytokine Staining.
CD4+CD62L+ splenocytes were stimulated with 1 μg/mL MBP Ac1–9 for 7 d in the presence of irradiated B10.PL splenocytes as APC. Cells were treated with PMA and ionomycin (Sigma-Aldrich) at a final concentration of 5 or 500 ng/mL, respectively, for 4 h in the presence of GolgiStop (BD). Cells were surface-stained with anti-CD4–AlexaFluor700 followed by intracellular staining with a combination of anti–IL-2–efluor 450, anti–IL-4–PE, anti–IL-10–APC, anti–IL-17–PE-Cy7, and anti–IFN-γ–FITC using fixation and permeabilization buffers (eBioscience). Fixable viability dye efluor 780 (eBioscience) was used to exclude dead cells.
T cell–DC clustering.
BMDCs were generated from the bone marrow of B10.PL mice by in vitro culture for 10–12 d in RPMI medium containing 20 ng/mL recombinant murine granulocyte-macrophage colony-stimulating factor (rmGM-CSF) (Biolegend or Miltenyi Biotec). Before coculture, some BMDCs were preloaded with 0.1 μg/mL high-affinity MBP Ac1–9 4Y peptide for 3 h at 37 °C. CD4SP thymocytes were labeled with 1 μM CFSE (Invitrogen) or 2.5 μM CPD ef670 (eBioscience), whereas BMDCs were labeled with 5 μM CPD ef450 (eBioscience). 5.105 thymocytes were cocultured with 1.105 BMDCs in 48-well plates, harvested at set times, and fixed in PBS containing 2% (wt/vol) FCS, 2 mM EDTA, and 2% (wt/vol) paraformaldehyde (PFA). In some cultures, functional grade anti-mouse MHC II (I-A/I-E) (Ebioscience) was added at 1 μg/mL to block clustering. T cell–DC clustering was determined using flow cytometry.
cDNA Synthesis and Real-Time PCR Amplification.
cDNA synthesis was performed using Oligo dT (Promega) with the Super Script II reverse transcriptase (Invitrogen) according to the manufacturer’s instructions. cDNA was diluted 10× in water before use for real-time PCR amplification.
The optimal annealing temperature was determined for each primer set; 25 ng cDNA template were mixed with 500 nM appropriate primers, 2 mM MgCl2, and 2 μL LightCycler FastStart DNA Master SYBR Green (Roche) in a total volume of 20 μL. Amplification was performed after an initial denaturation step at 95 °C for 10 min using the following protocol: 40 cycles of 5 s at 95 °C, 5 s at the optimal annealing temperature, and 20 s at 72 °C followed by data acquisition. After the final amplification, dissociation curves were assessed in the range of 60–95 °C. Ct values were determined with the Fitpoint algorithm of the Lightcycler software (version 3.5). The slope (efficiency) of each amplification was calculated by linear regression of four different Ct values taken in the linear phase of the amplification (0.2, 0.4, 0.8, and 1.6 units fluorescence).
Illumina Sequencing.
Before sequencing, libraries were prepared as follows. The PCR product was amplified for five cycles with primers specific for the TRAV and constant region containing the solexa adapters at their 5′ ends, thus conserving the orientation of the fragment. PCR amplification was performed using the Phusion DNA polymerase (New England Biolabs). The library was purified on MinElute columns (Qiagen) and quantified by spectrophotometer. Quality control was performed by cloning an aliquot of the libraries into a TOPO plasmid (Zero Blunt TOPO PCR Cloning Kit for Sequencing; Invitrogen), transforming into Escherichia coli TOP10, and capillary sequencing 8–10 clones per library. Preparation of the DNA colonies and sequencing on the Genome Analyzer II (Illumina) were performed according to the manufacturer’s instructions. In contrast to standard procedures, the sequencing primer was designed on the constant region (5′-TACACAGCAGGTTCTGGGTTCTGGATGT-3′) such that the sequences start in the TRAJ segment.
Sequence Analysis.
Sequence reads were identified by alignment to published TRAJ sequences (www.imgt.org) using align0 (55). TRAJ assignment was determined by the best-match score. The align0 output was analyzed to (i) assign a TRAJ identifier to a read to determine the identity of each TRAJ; (ii) classify the TRAV.TRAJ.TRAC recombination event as in or out of frame; (iii) determine the abundance (sequence count) of the CDR3 region within each TRAV.TRAJ recombination event; (iv) determine the sequence and length of each unique CDR3 region; and (v) determine the amino acid sequence of each unique CDR3 region. Average hydrophilicity of CDR3 sequences was calculated using values for each amino acid as set by Hopp and Woods (56). PI of CDR3 regions was determined using the free PI calculator on www.endmemo.com.
Statistical Analysis.
Where indicated, data were analyzed for statistical significance using GraphPad Prism software.
Supplementary Material
Acknowledgments
The authors thank Drs. Laurent Farinelli and Magne Osteras (Fasteris SA, Plan-les-Ouates, Switzerland) for performing the Illumina sequencing; Dr. Cristina Ferreira for very helpful discussions on TCRα analysis; Dr. Andrew Herman for cell sorting at the University of Bristol FMVS Flow Cytometry Facility; Miss Ella Shepard for assistance with breeding and maintenance of animals; and the Medical Research Council and Wolfson Foundation for supporting the Wolfson Bioimaging Facility at the University of Bristol. This work was supported by a Wellcome Trust program grant.
Footnotes
The authors declare no conflict of interest.
This article is a PNAS Direct Submission.
See Author Summary on page 816 (volume 110, number 3).
This article contains supporting information online at www.pnas.org/lookup/suppl/doi:10.1073/pnas.1208573110/-/DCSupplemental.
References
- 1.Liston A, Lesage S, Wilson J, Peltonen L, Goodnow CC. Aire regulates negative selection of organ-specific T cells. Nat Immunol. 2003;4(4):350–354. doi: 10.1038/ni906. [DOI] [PubMed] [Google Scholar]
- 2.Anderson MS, et al. The cellular mechanism of Aire control of T cell tolerance. Immunity. 2005;23(2):227–239. doi: 10.1016/j.immuni.2005.07.005. [DOI] [PubMed] [Google Scholar]
- 3.Marrack P, et al. The effect of thymus environment on T cell development and tolerance. Cell. 1988;53(4):627–634. doi: 10.1016/0092-8674(88)90578-8. [DOI] [PubMed] [Google Scholar]
- 4.Ramsdell F, Lantz T, Fowlkes BJ. A nondeletional mechanism of thymic self tolerance. Science. 1989;246(4933):1038–1041. doi: 10.1126/science.2511629. [DOI] [PubMed] [Google Scholar]
- 5.Roberts JL, Sharrow SO, Singer A. Clonal deletion and clonal anergy in the thymus induced by cellular elements with different radiation sensitivities. J Exp Med. 1990;171(3):935–940. doi: 10.1084/jem.171.3.935. [DOI] [PMC free article] [PubMed] [Google Scholar]
- 6.Liu GY, et al. Low avidity recognition of self-antigen by T cells permits escape from central tolerance. Immunity. 1995;3(4):407–415. doi: 10.1016/1074-7613(95)90170-1. [DOI] [PubMed] [Google Scholar]
- 7.Jordan MS, et al. Thymic selection of CD4+CD25+ regulatory T cells induced by an agonist self-peptide. Nat Immunol. 2001;2(4):301–306. doi: 10.1038/86302. [DOI] [PubMed] [Google Scholar]
- 8.Apostolou I, Sarukhan A, Klein L, von Boehmer H. Origin of regulatory T cells with known specificity for antigen. Nat Immunol. 2002;3(8):756–763. doi: 10.1038/ni816. [DOI] [PubMed] [Google Scholar]
- 9.Lio CW, Hsieh CS. Becoming self-aware: The thymic education of regulatory T cells. Curr Opin Immunol. 2011;23(2):213–219. doi: 10.1016/j.coi.2010.11.010. [DOI] [PMC free article] [PubMed] [Google Scholar]
- 10.Takahama Y. Journey through the thymus: Stromal guides for T-cell development and selection. Nat Rev Immunol. 2006;6(2):127–135. doi: 10.1038/nri1781. [DOI] [PubMed] [Google Scholar]
- 11.Bour-Jordan H, et al. Intrinsic and extrinsic control of peripheral T-cell tolerance by costimulatory molecules of the CD28/ B7 family. Immunol Rev. 2011;241(1):180–205. doi: 10.1111/j.1600-065X.2011.01011.x. [DOI] [PMC free article] [PubMed] [Google Scholar]
- 12.Punt JA, Osborne BA, Takahama Y, Sharrow SO, Singer A. Negative selection of CD4+CD8+ thymocytes by T cell receptor-induced apoptosis requires a costimulatory signal that can be provided by CD28. J Exp Med. 1994;179(2):709–713. doi: 10.1084/jem.179.2.709. [DOI] [PMC free article] [PubMed] [Google Scholar]
- 13.Punt JA, Havran W, Abe R, Sarin A, Singer A. T cell receptor (TCR)-induced death of immature CD4+CD8+ thymocytes by two distinct mechanisms differing in their requirement for CD28 costimulation: Implications for negative selection in the thymus. J Exp Med. 1997;186(11):1911–1922. doi: 10.1084/jem.186.11.1911. [DOI] [PMC free article] [PubMed] [Google Scholar]
- 14.Salomon B, et al. B7/CD28 costimulation is essential for the homeostasis of the CD4+CD25+ immunoregulatory T cells that control autoimmune diabetes. Immunity. 2000;12(4):431–440. doi: 10.1016/s1074-7613(00)80195-8. [DOI] [PubMed] [Google Scholar]
- 15.Tang Q, et al. Cutting edge: CD28 controls peripheral homeostasis of CD4+CD25+ regulatory T cells. J Immunol. 2003;171(7):3348–3352. doi: 10.4049/jimmunol.171.7.3348. [DOI] [PubMed] [Google Scholar]
- 16.Tai X, Cowan M, Feigenbaum L, Singer A. CD28 costimulation of developing thymocytes induces Foxp3 expression and regulatory T cell differentiation independently of interleukin 2. Nat Immunol. 2005;6(2):152–162. doi: 10.1038/ni1160. [DOI] [PubMed] [Google Scholar]
- 17.Collette Y, Benziane A, Razanajaona D, Olive D. Distinct regulation of T-cell death by CD28 depending on both its aggregation and T-cell receptor triggering: A role for Fas-FasL. Blood. 1998;92(4):1350–1363. [PubMed] [Google Scholar]
- 18.Boise LH, et al. CD28 costimulation can promote T cell survival by enhancing the expression of Bcl-XL. Immunity. 1995;3(1):87–98. doi: 10.1016/1074-7613(95)90161-2. [DOI] [PubMed] [Google Scholar]
- 19.Waterhouse P, et al. Lymphoproliferative disorders with early lethality in mice deficient in Ctla-4. Science. 1995;270(5238):985–988. doi: 10.1126/science.270.5238.985. [DOI] [PubMed] [Google Scholar]
- 20.Tivol EA, et al. Loss of CTLA-4 leads to massive lymphoproliferation and fatal multiorgan tissue destruction, revealing a critical negative regulatory role of CTLA-4. Immunity. 1995;3(5):541–547. doi: 10.1016/1074-7613(95)90125-6. [DOI] [PubMed] [Google Scholar]
- 21.Scalapino KJ, Daikh DI. CTLA-4: A key regulatory point in the control of autoimmune disease. Immunol Rev. 2008;223:143–155. doi: 10.1111/j.1600-065X.2008.00639.x. [DOI] [PubMed] [Google Scholar]
- 22.Gough SC, Walker LS, Sansom DM. CTLA4 gene polymorphism and autoimmunity. Immunol Rev. 2005;204:102–115. doi: 10.1111/j.0105-2896.2005.00249.x. [DOI] [PubMed] [Google Scholar]
- 23.Buhlmann JE, Elkin SK, Sharpe AH. A role for the B7-1/B7-2:CD28/CTLA-4 pathway during negative selection. J Immunol. 2003;170(11):5421–5428. doi: 10.4049/jimmunol.170.11.5421. [DOI] [PubMed] [Google Scholar]
- 24.Takahashi S, et al. In vivo overexpression of CTLA-4 suppresses lymphoproliferative diseases and thymic negative selection. Eur J Immunol. 2005;35(2):399–407. doi: 10.1002/eji.200324746. [DOI] [PubMed] [Google Scholar]
- 25.Cilio CM, Daws MR, Malashicheva A, Sentman CL, Holmberg D. Cytotoxic T lymphocyte antigen 4 is induced in the thymus upon in vivo activation and its blockade prevents anti-CD3-mediated depletion of thymocytes. J Exp Med. 1998;188(7):1239–1246. doi: 10.1084/jem.188.7.1239. [DOI] [PMC free article] [PubMed] [Google Scholar]
- 26.Wagner DH, Jr, et al. Rescue of thymocytes from glucocorticoid-induced cell death mediated by CD28/CTLA-4 costimulatory interactions with B7-1/B7-2. J Exp Med. 1996;184(5):1631–1638. doi: 10.1084/jem.184.5.1631. [DOI] [PMC free article] [PubMed] [Google Scholar]
- 27.Verhagen J, et al. Enhanced selection of FoxP3+ T-regulatory cells protects CTLA-4-deficient mice from CNS autoimmune disease. Proc Natl Acad Sci USA. 2009;106(9):3306–3311. doi: 10.1073/pnas.0803186106. [DOI] [PMC free article] [PubMed] [Google Scholar]
- 28.Wing K, et al. CTLA-4 control over Foxp3+ regulatory T cell function. Science. 2008;322(5899):271–275. doi: 10.1126/science.1160062. [DOI] [PubMed] [Google Scholar]
- 29.Schmidt EM, et al. Ctla-4 controls regulatory T cell peripheral homeostasis and is required for suppression of pancreatic islet autoimmunity. J Immunol. 2009;182(1):274–282. doi: 10.4049/jimmunol.182.1.274. [DOI] [PubMed] [Google Scholar]
- 30.Friedline RH, et al. CD4+ regulatory T cells require CTLA-4 for the maintenance of systemic tolerance. J Exp Med. 2009;206(2):421–434. doi: 10.1084/jem.20081811. [DOI] [PMC free article] [PubMed] [Google Scholar]
- 31.Nelson AJ, Hosier S, Brady W, Linsley PS, Farr AG. Medullary thymic epithelium expresses a ligand for CTLA4 in situ and in vitro. J Immunol. 1993;151(5):2453–2461. [PubMed] [Google Scholar]
- 32.Zheng X, et al. B7-CD28 interaction promotes proliferation and survival but suppresses differentiation of CD4-CD8- T cells in the thymus. J Immunol. 2004;173(4):2253–2261. doi: 10.4049/jimmunol.173.4.2253. [DOI] [PubMed] [Google Scholar]
- 33.Inaba K, et al. The tissue distribution of the B7-2 costimulator in mice: Abundant expression on dendritic cells in situ and during maturation in vitro. J Exp Med. 1994;180(5):1849–1860. doi: 10.1084/jem.180.5.1849. [DOI] [PMC free article] [PubMed] [Google Scholar]
- 34.Takahashi T, et al. Immunologic self-tolerance maintained by CD25(+)CD4(+) regulatory T cells constitutively expressing cytotoxic T lymphocyte-associated antigen 4. J Exp Med. 2000;192(2):303–310. doi: 10.1084/jem.192.2.303. [DOI] [PMC free article] [PubMed] [Google Scholar]
- 35.Khattri R, Auger JA, Griffin MD, Sharpe AH, Bluestone JA. Lymphoproliferative disorder in CTLA-4 knockout mice is characterized by CD28-regulated activation of Th2 responses. J Immunol. 1999;162(10):5784–5791. [PubMed] [Google Scholar]
- 36.Bour-Jordan H, et al. CTLA-4 regulates the requirement for cytokine-induced signals in T(H)2 lineage commitment. Nat Immunol. 2003;4(2):182–188. doi: 10.1038/ni884. [DOI] [PubMed] [Google Scholar]
- 37.Ying H, et al. Cutting edge: CTLA-4—B7 interaction suppresses Th17 cell differentiation. J Immunol. 2010;185(3):1375–1378. doi: 10.4049/jimmunol.0903369. [DOI] [PMC free article] [PubMed] [Google Scholar]
- 38.Fairchild PJ, Wildgoose R, Atherton E, Webb S, Wraith DC. An autoantigenic T cell epitope forms unstable complexes with class II MHC: A novel route for escape from tolerance induction. Int Immunol. 1993;5(9):1151–1158. doi: 10.1093/intimm/5.9.1151. [DOI] [PubMed] [Google Scholar]
- 39.Wraith DC, Bruun B, Fairchild PJ. Cross-reactive antigen recognition by an encephalitogenic T cell receptor. Implications for T cell biology and autoimmunity. J Immunol. 1992;149(11):3765–3770. [PubMed] [Google Scholar]
- 40.Mathisen PM, Pease S, Garvey J, Hood L, Readhead C. Identification of an embryonic isoform of myelin basic protein that is expressed widely in the mouse embryo. Proc Natl Acad Sci USA. 1993;90(21):10125–10129. doi: 10.1073/pnas.90.21.10125. [DOI] [PMC free article] [PubMed] [Google Scholar]
- 41.Fritz RB, Zhao ML. Thymic expression of myelin basic protein (MBP). Activation of MBP-specific T cells by thymic cells in the absence of exogenous MBP. J Immunol. 1996;157(12):5249–5253. [PubMed] [Google Scholar]
- 42.Harrington CJ, et al. Differential tolerance is induced in T cells recognizing distinct epitopes of myelin basic protein. Immunity. 1998;8(5):571–580. doi: 10.1016/s1074-7613(00)80562-2. [DOI] [PubMed] [Google Scholar]
- 43.Pacholczyk R, Ignatowicz H, Kraj P, Ignatowicz L. Origin and T cell receptor diversity of Foxp3+CD4+CD25+ T cells. Immunity. 2006;25(2):249–259. doi: 10.1016/j.immuni.2006.05.016. [DOI] [PubMed] [Google Scholar]
- 44.Hsieh CS, et al. Recognition of the peripheral self by naturally arising CD25+ CD4+ T cell receptors. Immunity. 2004;21(2):267–277. doi: 10.1016/j.immuni.2004.07.009. [DOI] [PubMed] [Google Scholar]
- 45.Ferreira C, et al. Non-obese diabetic mice select a low-diversity repertoire of natural regulatory T cells. Proc Natl Acad Sci USA. 2009;106(20):8320–8325. doi: 10.1073/pnas.0808493106. [DOI] [PMC free article] [PubMed] [Google Scholar]
- 46.Maynard J, et al. Structure of an autoimmune T cell receptor complexed with class II peptide-MHC: Insights into MHC bias and antigen specificity. Immunity. 2005;22(1):81–92. doi: 10.1016/j.immuni.2004.11.015. [DOI] [PubMed] [Google Scholar]
- 47.Pacholczyk R, Kern J. The T-cell receptor repertoire of regulatory T cells. Immunology. 2008;125(4):450–458. doi: 10.1111/j.1365-2567.2008.02992.x. [DOI] [PMC free article] [PubMed] [Google Scholar]
- 48.Liu X, et al. T cell receptor CDR3 sequence but not recognition characteristics distinguish autoreactive effector and Foxp3(+) regulatory T cells. Immunity. 2009;31(6):909–920. doi: 10.1016/j.immuni.2009.09.023. [DOI] [PMC free article] [PubMed] [Google Scholar]
- 49.Nguyen P, et al. Discrete TCR repertoires and CDR3 features distinguish effector and Foxp3+ regulatory T lymphocytes in myelin oligodendrocyte glycoprotein-induced experimental allergic encephalomyelitis. J Immunol. 2010;185(7):3895–3904. doi: 10.4049/jimmunol.1001550. [DOI] [PMC free article] [PubMed] [Google Scholar]
- 50.Padovan E, et al. Expression of two T cell receptor alpha chains: Dual receptor T cells. Science. 1993;262(5132):422–424. doi: 10.1126/science.8211163. [DOI] [PubMed] [Google Scholar]
- 51.Tuovinen H, Salminen JT, Arstila TP. Most human thymic and peripheral-blood CD4+ CD25+ regulatory T cells express 2 T-cell receptors. Blood. 2006;108(13):4063–4070. doi: 10.1182/blood-2006-04-016105. [DOI] [PubMed] [Google Scholar]
- 52.Genolet R, Stevenson BJ, Farinelli L, Osterås M, Luescher IF. Highly diverse TCRα chain repertoire of pre-immune CD8⁺ T cells reveals new insights in gene recombination. EMBO J. 2012;31(7):1666–1678. doi: 10.1038/emboj.2012.48. [DOI] [PMC free article] [PubMed] [Google Scholar]
- 53.Boyton RJ, Zaccai N, Jones EY, Altmann DM. CD4 T cells selected by antigen under Th2 polarizing conditions favor an elongated TCR alpha chain complementarity-determining region 3. J Immunol. 2002;168(3):1018–1027. doi: 10.4049/jimmunol.168.3.1018. [DOI] [PubMed] [Google Scholar]
- 54.Lee C, et al. Evidence that the autoimmune antigen myelin basic protein (MBP) Ac1-9 binds towards one end of the major histocompatibility complex (MHC) cleft. J Exp Med. 1998;187(9):1505–1516. doi: 10.1084/jem.187.9.1505. [DOI] [PMC free article] [PubMed] [Google Scholar]
- 55.Myers EW, Miller W. Optimal alignments in linear space. Comput Appl Biosci. 1988;4(1):11–17. doi: 10.1093/bioinformatics/4.1.11. [DOI] [PubMed] [Google Scholar]
- 56.Hopp TP, Woods KR. Prediction of protein antigenic determinants from amino acid sequences. Proc Natl Acad Sci USA. 1981;78(6):3824–3828. doi: 10.1073/pnas.78.6.3824. [DOI] [PMC free article] [PubMed] [Google Scholar]
