Abstract
To explore the adaptability of bread wheat to dehydration stress, we screened 28 cultivars collected from different agroclimatic zones, on the basis of malonaldehyde content as biochemical marker in roots of wheat seedlings during germination and classified them as highly tolerant, tolerant, sensitive and highly sensitive. From this primary screening, ten cultivars that showed differential responses to dehydration stress were selected to understand the biochemical and physiological basis of stress tolerance mechanisms. The highly tolerant cultivars showed lower levels of lipid peroxidation, less membrane damage, increased levels of antioxidants, enzymes like catalase, ascorbate peroxidase, glutathione reductase activities, and maintained higher relative water content in comparison to sensitive cultivars, indicating better protection mechanism operating in tolerant cultivars. Correspondingly, highly tolerant cultivars exhibited more accumulation of proline and less H2O2 content across different time points of polyethylene glycol treatments in comparison to sensitive ones. The above biochemical and physiological parameters were further validated through northern analysis of catalase (CAT1) gene, that showed differential expression patterns in tolerant and sensitive cultivars largely in confirmation with the biochemical and physiological analyses. Our study positively correlates the differences in the redox status and antioxidant defense system between tolerant and sensitive cultivars for the establishment of wheat seedlings in typical dehydration conditions.
Electronic supplementary material
The online version of this article (doi:10.1007/s12298-012-0117-7) contains supplementary material, which is available to authorized users.
Keywords: Wheat, Dehydration, Oxidative stress, Antioxidant enzymes, Catalase gene
Introduction
Plant growth and crop productivity is progressively affected by shortage of water leading to significant decline in agricultural production (Lata et al. 2011). Among crops, wheat (Triticum aestivum L. em Thell) is an essential staple food, which fulfills the need of more than 1/3 of world’s population and known to be severely affected by drought stress (Chaves and Oliveira 2004). The effect of drought stress on plants depends upon various factors like duration, intensity of stress as well as on its developmental stage (Simova-Stoilova et al. 2008). Therefore, evaluation of genetic variation in trait to drought tolerance is crucial (Loggini et al. 1999).
Available reports have demonstrated that drought stress eventually results in a wide gamut of various biochemical and physiological modifications in plant leading to changes in relative water content (RWC), generation of free radicals and inactivation of enzymes thus affecting cell viability (Bartels and Sunkar 2005). The determination of RWC has been a widely accepted measure to assess the plant water status (Smart and Bingham 1974). At the cellular level, these changes dictate damage to membrane lipids by oxidizing array of unsaturated fatty acids. Thus, the assessment of reaction products of lipid peroxidation (LP), e.g. the conjugated dienes, hydroperoxides and malonaldehyde (MDA), potentially indicate dehydration stress susceptibility of a plant (Varghese and Naithani 2008).
Reactive oxygen species (ROS) are natural byproducts of normal plant metabolism, but its excess production leads to oxidative damage in plant cell (Wang et al. 2009; Silva et al. 2010). Drought induced oxidative stress leads to the excessive production of free electrons during the process of photosynthesis and respiration in different organelles such as chloroplast, mitochondria and peroxisomes due to altered process of energy dissipation (Wang et al. 2009). The generation of free radicals in different compartments negatively affects various cellular components like lipids and proteins resulting in membrane damage of different organelles (Noctor and Foyer 1998). In order to mitigate the oxidative damage, plants have a well developed machinery of antioxidant system that involves the low molecular weight antioxidants as well as antioxidant enzymes, which strongly regulate the generation of ROS and its consumption in different compartments of plant. The action of these antioxidant enzymes is highly compartmentalized. Superoxide dismutase (SOD) is a family of enzymes which involves the conversion of O−2 in to H2O2 in cytosol, mitochondria and chloroplast. However, catalase (CAT) is also one of the antioxidant enzymes which directly neutralize the concentration of H2O2 to form water and oxygen in different sub-cellular compartments like glyoxysomes and peroxisomes (Leprince et al. 2000). In addition to that ascorbate peroxidases (APX) and glutathione reductase (GR) are the key components of ascorbate-glutathione cycle that also involves the detoxification of H2O2 in other sub-cellular compartments like chloroplast, mitochondria and cytosol (Foyer and Harbinson 1994; Asada 1999).
To the best of our knowledge, responses of the bread wheat cultivars used in this study at germination stage for various biochemical and physiological levels to dehydration stress has not been yet reported. Roots are the first to sense the water-depletion condition (Selote and Khanna-Chopra 2010) and become important tissue to study the response of dehydration stress. Therefore, this study was designed to understand the adaptability of wheat cultivars to dehydration stress by assesssing LP, RWC, accumulation of H2O2, proline content, antioxidant enzyme activity (CAT, APX and GR) and expression of catalase (CAT1) gene in roots of young wheat seedings.
Materials and methods
Plant material, growth and stress conditions
Twenty eight wheat cultivars were obtained from G.B. Pant University of Agriculture & Technology, Pantnagar, Uttarakhand, India (Table 1). Seeds were surface sterilized with 1 % sodium hypochlorite solution for 5 min, thoroughly rinsed 7–8 times by distilled water and allowed to germinate on one-third strength Hoagland solution and grown under aseptic conditions for 3 days in the dark and 4 days in 12 h light/dark cycle with the light intensity of 500 μmol m−2 s−1 and at a temperature 22/16 °C. Wheat seeds were considered to have germinated when the radicle visibly protruded from the seed coat at least 2 mm. Seven days old germinated seedlings were subjected to dehydration stress in Petri dishes containing Hoagland nutrient solution containing 20 % polyethylene glycol (PEG-6000) (Lata et al. 2011) for the durations of 1, 12, and 24 h. Stressed and control samples of roots were collected at the same time to avoid any diurnal variation and then immediately frozen in liquid nitrogen and stored at −70 °C for biochemical analysis (Wang et al. 2009). Electrolytic leakage, Proline content and H2O2 content were measured in fresh samples after stress recovery durations. All the experimental data were recorded as the means of three independent experiments.
Table 1.
Details of 28 wheat cultivars used in the present study
| Sl No. | Cultivar | Pedigree | Year of release | Originating Breeding Institutea | Recommended for | Remarks | ||
|---|---|---|---|---|---|---|---|---|
| Conditionsb | States/Area/Region | Agro climatic Zonec | ||||||
| 1 | RAJ3765 | HD 2402/VL 639 | 1995 | ARS, DURGAPURA | LS, IR | Orissa, West Bengal,Assam, Uttrakand | NW/NEPZ | Heat tolerance |
| 2 | UP2382 | CPAN 2004/HD 2204 | 1998 | GBPUAT, PANTNAGAR | TS, IR | Uttarpradesh, Uttrakand, Jammu Kashmir | NWPZ | High yield, better adaptability and good for chapatti making |
| 3 | C306 | RGN/CSK3//2*C5913/C217/N14//C281 | 1965 | CCS HAU, HISAR | TS, RF | Haryana,Punjab and Uttar Pradesh | NWPZ/NEPZ | Good for chapatti making |
| 4 | K9162 | K 7827/HD 2204 | 1999 | CSUA&T, KANPUR | LS,IR | Uttar Pradesh, Rajasthan | NEPZ | Heat tolerant, better adaptability in less irrigation conditions |
| 5 | HDR77 | PARTIZANKA/HD 2204//HD 2204 | 1990 | IARI, NEW DELHI | LS, RF | West Bengal, Assam, Plains of NE states | NEPZ | Amber semi hard and bold grains |
| 6 | K7903 | HD 1982/K 816 | 1999 | CSUA&T, KANPUR | VLS, IR | Uttar Pradesh, Uttaranchal | NEPZ | Heat tolerant, resistance to various viral diseases and bread making |
| 7 | DBW14 | RAJ 3765/PBW 343 | 2002 | DWR, KARNAL | LS, IR | Eastern UP,Bihar,West Bengal and Assam | NEPZ | Tolerant to late blight |
| 8 | NIAW34 | CNO 79/PRL “S” | 1995 | NIPHAD | LS, IR | Maharashtra, Karnataka, Andhra Pradesh | PZ | Resistance to pathogens, good grain appearance with amber |
| 9 | HD2808 | WH542/DL 377-8 | 1995 | IARI,NEW DELHI | TS,IR | Bihar, Orissa, Rajasthan | NEPZ | Heat tolerant |
| 10 | HUW468 | CPAN 1962/TONI HLIRA ‘s’/PRL ‘s’ | 1999 | BHU, Varanasi | LS,IR | West Bengal, Orissa, Assam | NEPZ | Having SR2 gene for rust resistance and good chapatti making |
| 11 | RAJ4104 | DL 802-5/K9011 | NA | DURGAPURA,JAIPUR | TS/LS | NA | NA | Broad waxy leaves, lustrous grains |
| 12 | DBW17 | CMH79A.95/3*CNO 79//RAJ 3777 | 2006 | DWR, Karnal | TS, IR | Punjab,Haryana,Delhi,Uttarpradesh | NWPZ | Resistance to new yellow rust race |
| 13 | HYB65 | GB-AUS/A115 | 1975 | POWERKHEDA | TS, IR/RF | Madhya Pradesh, Maharashtra | CZ | Good for chapatti making, high yielding better adaptability |
| 14 | GW322 | GW 173/GW 196 | 2002 | VIJAPUR Gujrat | TS, IR | Madhyapradesh, Maharashtra, Rajasthan and Karnataka | CZ, PZ | Susceptible to no of pathogens, resistance to leaf rust virus and good chapatti making |
| 15 | GW366 | DL 802-3/GW 232 | 2006 | VIJAPUR, Gujrat | TS, IR | Madhya Pradesh,Karnataka,Rajasthan and Chhattisgarh | CZ | High yield, better adaptability, resistance to leaf rust virus |
| 16 | WH730 | NA | NA | CCSHAU, HISAR | TS,IR | NA | NA | Heat tolerant |
| 17 | PBN51 | BVC ‘S’/FIK ‘S’/VEES | 1996 | MARATHUAD AGRICULTURAL UNIVERSITY | TS,IR | Punjab, Delhi, Rajasthan | NWPZ | High temperature tolerant, moderately tolerance to wheat rust |
| 18 | NW1014 | HAHN ‘S’ | 1997 | NDUAT, FAIZABAD | LS, IR | Eastern UP, Bihar, West Bengal | NEPZ | Heat tolerance |
| 19 | K9465 | HD2160/K68 | 1997 | CSUA&T, KANPUR | LS, RF | West Bengal, Assam, plains of NE states | NEPZ | Heat tolerant |
| 20 | K8027 | NP875/4/N10B/Y53//Y50/3/KT54B/5/2*K852 | 1984 | CSUA&T, KANPUR | TS, RF | Bihar, Orissa, Rajasthan | NEPZ | Resistance to leaf rust virus |
| 21 | K9423 | HP1633/KAL/UP262 | 2004 | POWERKHEDA | LS,IR | Eastern Uttar Pradesh,Bihar, Orissa | NEPZ | Resistance to viral pathogens |
| 22 | K8962 | K 7401/HD2160 | 1995 | CSUA&T, KANPUR | LS, RF | Eastern Uttarpradesh, Bihar, Orissa, West Bengal | NEPZ | Moderate tolerance to heat, better adaptability |
| 23 | HI1544 | ALD/CO C/URESH/HD2160M/HD2278 | 2007 | IARI, INDORE | TS, IR | Rajasthan,Madyapradesh,Uttarpradesh and Gujarat | CZ | High yield and high level of field resistance to stem and leaf rust, seedling resistance to all pathogens |
| 24 | HD2967 | ALD/CO C/URESH/HD2160M/HD2278 | 2009 | IARI DELHI | TS,IR | Punjab, Haryana, Uttarpradesh | NW/NEPZ | Resistance to leaf rust diseases and virulence of yellow rust diseases |
| 25 | WH542 | JUP/BJY“S”//URES | 1992 | CCSHAU, HISAR | TS. IR | Punjab, Delhi, Rajasthan and parts of Madhya Pradesh | NWPZ | Inbuilt resistance to rust and other wheat diseases |
| 26 | HUW234 | HUW 12-2/CPAN 1666 | 1984 | BHU,VARANASI | LS,IR | Eastern regions of Uttrakand, Bihar, Orissa and West Bengal | NEPZ | Heat tolerant |
| 27 | PBW343 | ND/VG 9144//KAL/BB/3// | 1994 | PAU | TS,IR | Areas of Punjab, Uttaranchal and Rajasthan | NWPZ | High level of resistance to viral diseases, wider adaptability |
| 28 | WH147 | E4870/C286/C273/4/S339/PV18 | 1978 | CCSHAU, HISAR | TS, IR | Madhya Pradesh, Chhattisgarh, Gujarat and Uttarpradesh | CZ | Salt tolerant, high protein, stripe rust resistance |
a Originating breeding institutes: IARI Indian Agricultural Research Institute; GBPAUT Govind Ballabhs Pant University of Agriculture and Technology; VPKAS Vivekananda Parvatiya Krishi Anusandhan Sansthan; DWR Directorate of Wheat Research; BHU Banaras Hindu University; PAU Punjab Agricultural University; CCHAU = Chaudhary Charan Singh Haryana Agricultural University; NA Not available
b Conditions: LS Late sown; IR Irrigated conditions; TS Timely sown; RF Rainfed
c Agroclimatic zones: NHZ Northern Hills Zone; NWPZ North Western Plains Zone; NEPZ North Eastern Plain Zone; CZ Central Zone; PZ Peninsular Zone
Relative water content
The RWC was estimated in control as well as stressed root samples of wheat. RWC was calculated following the method of Barrs and Weatherley (1962).
Lipid peroxidation
The LP level in root tissues was determined by measuring the malonaldehyde (MDA) content, which is an end product of oxidation of polyunsaturated fatty acid via 2-thiobarbituric acid (TBA) reaction (Hodgson and Raison 1991). Samples (100 mg) were homogenized in 1 ml of 10 mM sodium phosphate buffer (pH 7.4) and centrifuged at 5,000 g for 5 min at room temperature. Two hundred micro-liter of the supernatant was added to a reaction mixture containing 100 μl of 8.1 % (w/v) SDS, 750 μl of 20 % (w/v) acetic acid (pH 3.5), 750 μl of 0.8 % (w/v) aqueous TBA and 200 μl of Milli-Q water. Blank was set up simultaneously by substituting supernatant with equal volume of buffer. Both reaction mixtures were then incubated at 98 °C for 1 h. After cooling to room temperature, the mixtures were centrifuged at 8,000 g for 10 min. Specific absorbance was measured at 535 nm and nonspecific absorbance at 600 nm. The level of lipid peroxidation was expressed as μmol of MDA formed derived from the difference in absorbance at 535 and 600 nm using an extinction coefficient of 156 mM−1 cm−1.
Electrolyte leakage was assessed according to Lata et al. (2011).
Antioxidant enzyme assay
Samples were ground in liquid nitrogen prior to homogenization using ice cold enzyme specific buffer in mortar. Homogenate was centrifuged at 15,000 g for 10 min at 4 °C. Supernatant was separated and used for different enzyme assays. Protein content was determined by Bradford (1976) using BSA as standard.
Catalase (EC 1.11.1.6)
For the estimation of catalase activity, plant samples were homogenized in 50 mM phosphate buffer (pH 7.0) and 1 mM DTT (dithiothreitol). CAT activity was measured by using assay solution containing 50 mM phosphate buffer (pH 7.0), 33.5 mM H2O2 and 0.1 ml enzyme extract. Decrease in absorbance of H2O2 (ε = 39.4 mM−1 cm−1) was recorded within 2 min at 240 nm (Aebi 1984). One unit of CAT activity was defined as the amount of enzyme required to oxidize 1 μmol of H2O2 per minute.
Ascorbate Peroxidase (EC 1.11.1.11)
For the estimation of APX activity separate extraction was carried out with the extraction buffer solution containing 100 mM phosphate buffer (pH 7.0), 0.1 mM EDTA, 1.0 mM ascorbate and 1 mM DTT. APX activity was determined by monitoring the rate of hydrogen peroxide-dependent oxidation of ascorbic acid in assay buffer that contained 50 mM phosphate buffer (pH 7.0), 0.5 mM ascorbate and enzyme extract, in a total volume of 1 ml (Chen and Asada 1999). The rate of ascorbic acid oxidation was initiated by adding 10 μl of 10 % (v/v) H2O2 and the decrease in absorbance was monitored at 290 nm (ε = 2.8 mM−1 cm−1) for 2 min. One unit of enzyme activity was defined as amount of enzyme required to oxidize 1 μ mol of ascorbate per minute.
Glutathione Reductase (EC 1.6.4.2)
For GR estimation, tissues were homogenized in extraction buffer containing 100 mM phosphate buffer (pH 7.5) and 0.5 mM EDTA. The assay mixture contained 100 mM phosphate buffer (pH 7.5), 0.5 mM EDTA, 0.75 mM DTNB, 0.1 mM NADPH, enzyme extract and reaction was initiated by adding 1.0 mM oxidized glutathione (GSSG) when 5, 5-dithiobis (2 nitrobenzoic acid) (DTNB) was reduced by glutathione (GSH) to form TNB (Smith et al. 1988). GR was assayed by monitoring the increase in absorbance at 412 nm (ε = 6.22 mM−1 cm−1). One unit of enzyme was defined by amount of enzyme required to form 1 μ mol of GS-TNB min-1 by the reduction of DTNB.
Glutathione and ascorbate measurement
Total glutathione (GSH + GSSG) and oxidized GSSG were estimated by the 5,5-dithiobis-nitrobenzoic acid (DTNB)—GR cycling procedure (Selote and Khanna-Chopra 2010). Around 0.4 gm of leaf tissue was homogenized in ice cold 5 % sulphosalicyclic acid (w/v), homogenate was filtered through chesse cloth and centrifuged at 10,000 g for 10 min at 4 °C. Supernatant was further used for the estimation of GSSG and total glutathione assay. GSSG was determined from the sample after 2-vinyl pyridine derivatization of GSH, changes in absorbance due to 5-thio-2 nitrobenzene (TNB) were measured at 412 nm and the glutathione content was calculated using a standard curve. GSH was calculated after subtraction of GSSG value from total glutathione. Total ascorbate (AsA + DHA) and AsA ascorbate measurement was also done by following the method of Selote and Khanna-Chopra (2010).
H2O2 measurement
The level of H2O2 was assessed as described by Velikova et al. (2000). Fresh root tissues of wheat were extracted in 5.0 ml of TCA (0.1 % w/v) in ice cold bath, and the homogenate was centrifuged at 13,000 g for 15 min. Equal volume of 10 mM sodium phosphate buffer (pH 7.5) and double volume of 1 M potassium iodide were added to 0.5 ml of supernatant. The absorbance of the sample was measured at 390 nm. H2O2 content was determined using extinction coefficient (ε = 0.28 μM−1 cm−1) and expressed as nM of H2O2 g−1 fresh weight of plant tissue.
Proline estimation
Proline was determined as described by Bates et al. (1973). Fresh tissues (500 mg) of roots were homogenized in 10 ml of 3 % sulphosalicyclic acid (w/v) with pestle and mortar in ice cold bath. Homogenate was centrifuged at 10,000 g for 15 min. Two milliliters of filtrate was mixed with 2 ml of acid ninhydrin and 2 ml of glacial acetic acid. The mixture was incubated at 100 °C for 1 h until the colored complex is developed in water bath and terminated the reaction by cooling in ice. Four milliliters of toluene was added to the coloured complex. Reaction mixture was vortexed for 15–20 s. Optical density of layer with chromophore was read at 520 nm. Proline content was estimated by using standard curve of L-Proline.
Partial cDNA cloning and northern hybridization of CAT1 gene from Wheat
Total RNA was isolated from roots of young germinated wheat seedlings exposed to dehydration stress (0 h, 1 h, 12 h and 24 h) using TRIzol Reagent (Life technologies, Rockville, MD,USA). DNA contamination was removed from the RNA samples using RNase free DNaseI (50U/μl, Fermentas, USA). About 1 μg of total RNA was used to synthesize first strand cDNA primed with OligodT in a 20 μl reaction mix using Protoscript M-MuLV reverse transcriptase (New England Biolabs, USA) following the manufacturer’s instructions. For PCR amplification of the desired cDNA fragments, gene specific primers (F: 5′-ATGGACCCCTAGAAGTACCG-3′ and R: 5′-GATGAAGAAGACGGGGAAGTTG-3′) based on wheat CAT1 (GenBank accession number E16461) were synthesized. The PCR cycling conditions were: 94 °C for 3 min, 94 °C for 30 s, 57 °C for 45 s, and 72 °C for 1 min for 28 cycles, and 72 °C for 8 min. The desired sized band were excised and eluted from gel, and cloned into pGEM-T Easy vector (Promega, USA). The isolated plasmids were sequenced with ABI Sequencer, Version No. 3770 using M13 forward and reverse primers. Expression profiling of CAT1 gene in response to dehydration stress was observed by northern hybridization in which 20 μg of RNA from control as well as stressed seedlings of different durations was electrophoresed on 1.2 % denaturing formaldehyde agarose gel in 1X MOPS running buffer and transferred to a positively charged nylon membrane (Hybond-N+, Amersham Bioscience, USA) following the method as described in Sambrook et al. (1989). Internal control β-actin of wheat was amplified using actin-F: (5′-CCCAAGGCCAACAGAGAGAA-3′ and actin-R: 5′- GCCTGGATTGCGACATACATT-3′). Probes were prepared by labeling the PCR-amplified fragments of cDNA clones with [α32P] dCTP using high prime DNA labeling kit (Roche, USA) and purified by using G-50 sephadex column (Amersham Bioscience, USA). Labeled probe was added to hybridization buffer and kept for 16–18 h at 60 °C. Blots were scanned in a Phosphor-imager (Typhoon-9210, GE Healthcare, USA) and quantified using Quantity One software (Bio-Rad, USA).
Statistical analysis
All experimental data obtained are the means of three independent experiments under the same environmental conditions and the results are expressed as mean with standard deviation (mean ± SD). One way analysis of variance (ANOVA) was used to test significance between mean values of control and stressed plants and comparison among means was carried out using Tukey-Kramer multiple comparisons test with the help of Graph Pad InStat software (version 3.0). The cultivars at P < 0.05, P < 0.01 and P < 0.001 were considered as statistically significant.
Results and discussion
Screening of wheat cultivars for dehydration tolerance
In this study, 28 cultivars of wheat were screened to evaluate the effect of dehydration stress with PEG-6000 (Table 1). Based on the data of LP at different time points viz. 1, 12 and 24 h as compared to their relative controls, we have classified the cultivars as highly tolerant (HT), tolerant (T), sensitive (S) and highly sensitive (HS) as described by Lata et al. (2011) (Supplementary table: S1). Seven cultivars (C306, HDR77, RAJ3765, UP2382, DBW14, K7903, K9162) that showed >50 % decrease in MDA levels up to 24 h of dehydration stress were selected as highly tolerant, however 11 cultivars namely NIAW34, HD2808, HUW234, RAJ4104, DBW17, HYB65, GW322, GW366, WH730, PBN51 and NW1014, that maintained <50 % MDA level under stress conditions were grouped as tolerant. While four cultivars (K9465, K8027, K9423 and K8962) that showed <100 % increased MDA content were categorized as sensitive and six cultivars (HI1544, HD2967, WH542, HUW234, PBW343, WH147) that showed increased MDA levels by >100 were chosen as highly sensitive. The level of MDA increased significantly in the sensitive cultivars at all stress durations with respect to control (P < 0.01). The level of lipid peroxidation in sensitive cv. HI1544 was much higher up to 12 h which declined at 24 h. In highly tolerant cultivars C306 and UP2382 the MDA levels were quite low in comparison to sensitive cultivars throughout the dehydration period exhibiting maximum membrane integrity to withstand stress conditions. Drought-induced increase in MDA content has shown relationship with the degree of stress tolerance in wheat genotypes (Selote and Khanna-Chopra 2010; Hamid et al. 2011). The increased accumulation of lipid peroxides upon oxidative stress reflects the higher production of reactive oxygen species (ROS). ROS are responsible for stress induced peroxidation of membrane lipids due to more production of MDA and often used as indicator of increased oxidative damage. Our study showed that the magnitude of LP varied in all cultivars at different durations of dehydration stress. Cultivars have different efficiency for the activation of antioxidant machinery to prevent the membrane damage. Thus, it can be concluded that tolerant cultivars may possess higher capacity to control the damage by LP and, thereby the membrane integrity than the sensitive ones studied. On the basis of LP data set, five highly tolerant (C306, RAJ3765, UP2382, HDR77 and K9162) and five highly sensitive cultivars (HI1544, HD2967, HUW234, WH147 and WH542) were further selected to assess cellular defense mechanisms against dehydration stress. Lipid peroxidation together with electrolytic leakage was widely accepted as a function of membrane integrity in foxtail plants exposed to dehydration stress, has been shown to be a direct indicator of dehydration stress tolerance (Lata et al. 2011).
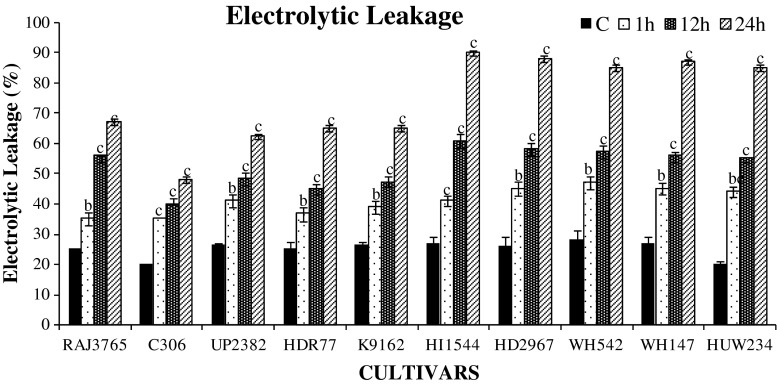
In crop plants, determination of cell membrane integrity has been most important criterion to differentiate stress tolerant and sensitive cultivars. Capacity to avoid membrane damage has been correlated with abiotic stress tolerance (Bhusan et al. 2007; Lata et al. 2011). A significant and time dependent increase in membrane permeability was observed in all cultivars. However, highly tolerant cultivars were relatively less permeable except at later durations of dehydration stress treatments (Fig. 1). Maximum ion leakage was found in cv. HI1544 followed by HD2967 at all durations of dehydration stress. Low level of ion leakage suggests the better maintainence of cell membrane integrity in the tolerant cultivars. The above result is in agreement with other studies involving various crop plants (Kumutha et al. 2009; Lata et al. 2011).
Fig. 1.
Percentage electrolytic leakage estimates in ten cultivars of wheat exposed to 0, 1, 12 and 24 h of dehydration treatment. Data represent the means of ± SD of three independent experiments (n = 3), a P < 0.05, b P < 0.01, c P < 0.001
Evaluation of relative water content
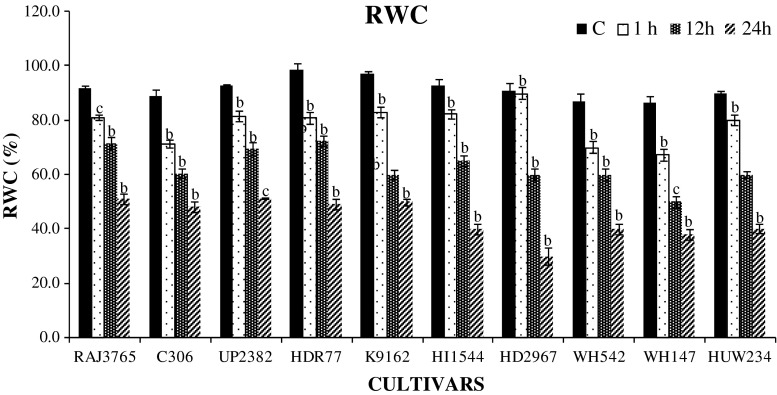
Relative water content (RWC) is considered as an important marker to assess the water balance of plant (González and González-vilar 2001). RWC was also measured in ten highly tolerant and highly sensitive wheat cultivars exposed to different durations of PEG-induced dehydration stress. In plants, roots are the first tissue to sense water depletion condition and thus induce primary stress signaling pathway. Our present study showed highly tolerant cultivars have the capacity to maintain high RWC, whereas sensitive ones showed greater decline with increasing duration of stress. Cultivars that showed approximately, >50 % decline in RWC up to 24 h were considered as sensitive. Highest decline in water content was observed in highly sensitive cultivars HD2967 (66 %), HI1544 (56 %) whereas the highly tolerant other (C306 and UP2382) showed <50 % decrease in RWC (P < 0.01; Fig. 2). This shows that highly tolerant cultivars have more capability to retain water in roots than sensitive ones. Previously reported studies on different crop species like wheat and foxtail millet have also shown wide genotypic variations in RWC under water stressed conditions (Selote and Khanna-Chopra 2010; Lata et al. 2011).
Fig. 2.
Percent Relative water content (RWC) estimates in roots of ten wheat cultivars exposed to 0, 1, 12 and 24 h of dehydration stress treatment. Data represent the means ± SD of three independent experiments (n = 3), a P < 0.05, b P < 0.01, c P < 0.001
Changes in the activities of antioxidant enzymes
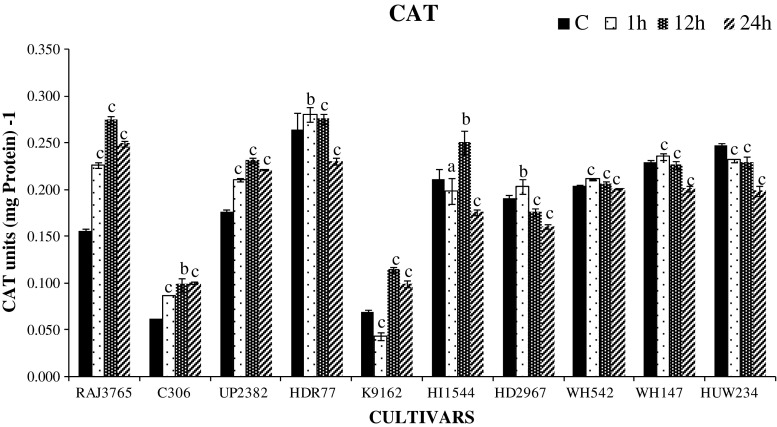
Abiotic stresses like drought, salinity and heat stress cause oxidative stress via production of ROS. H2O2, a toxic ROS, produced by the activity of SOD should be converted in to H2O in further reaction involving antioxidant defense system that includes low molecular weight antioxidants and antioxidant enzymes including CAT, APX and GR which maintains the H2O2 level in plants (Wang et al. 2009; Selote and Khanna-Chopra 2010; Lata et al. 2011). CAT is exceptionally one of the universal enzymes that removes H2O2 by breaking down directly into water and oxygen without any requirement of reducing power (Lata et al. 2011). In this study, highly tolerant cultivars largely showed significant increase in total CAT activities (P < 0.01) till 12 h, but there was a slight reduction at 24 h (Fig. 3). Interestingly, in highly sensitive cultivars a slight increase in activity was observed till 12 h with a reduction at 24 h (P < 0.001). Furthermore, two highly sensitive cultivars viz., HI1544 and WH147 showed more drastic reduction in CAT activity at 24 h. Therefore, more H2O2 scavenging ability of CAT in tolerant cultivars inhibits the accumulation of ROS and thus protected the plant from membrane damage and oxidative stress under dehydration stress during germination. Previously reported studies in different crop species also observed that tolerant cultivars showed higher antioxidant enzyme activity than the sensitive cultivars subjected to drought stress (Lata et al. 2011; Hamid et al. 2011).
Fig. 3.
Catalase (CAT) activity in roots of wheat cultivars during germination exposed to 0, 1, 12 and 24 h dehydration stress treatment. One unit of enzyme activity defined as 1 μmol H2O2 oxidized min−1. Data represent the means ± SD of three independent experiments (n = 3), a P < 0.05, b P < 0.01, c P < 0.001
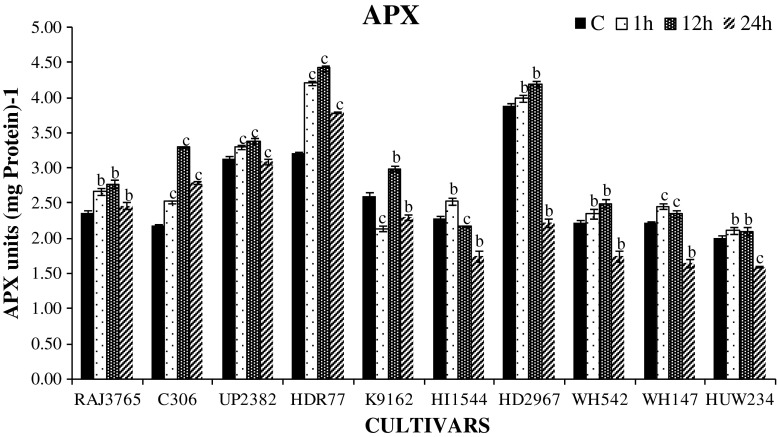
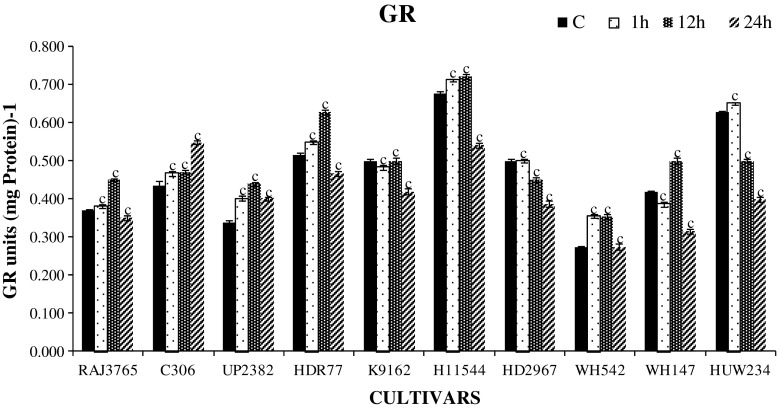
Further, APX and GR activities were also found to be influenced by different levels of dehydration stress in tolerant and sensitive cultivars. APX is one of the important enzymes which utilizes ascorbate as electron donor and used as key component of ascorbate-glutathione (AsA-GSH cycle) pathway and regulates the level of H2O2 in plant (Asada 1999). We found a significant increase in APX activity among highly tolerant cultivars except K9162 than sensitive ones in response to dehydration stress (Fig. 4). In highly tolerant cultivars, total APX activity gradually increased up to 12 h treatment and then reduced significantly (P < 0.001) at 24 h. Similarly, the APX activity was increased up to12 h with greater decline at later durations of stress in sensitive cultivars. Cultivars RAJ3765 and C306 showed increased APX activity than sensitive ones (HI1544 and HD2967) (Fig. 4). Increase in APX activity was also observed in tolerant cultivars of other crop species (Garg and Noor 2009; Lata et al. 2011; Hamid et al. 2011). GR is also one of the key enzymes, which plays a central role in maintaining the redox environment of plants by converting oxidized glutathione (GSSG) to reduced glutathione (GSH) using NADPH as a reducing agent. A significant and time dependent increase in GR activity was also found in most cultivars (P < 0.001) up to 12 h dehydration stress and decreased (P < 0.001) at 24 h (Fig. 5). Interestingly, the cultivar C306 showed increase in GR all throughout till 24 h. Increased GR activity in tolerant cultivars reflects an increased ROS scavenging capacity and decreased damage to plants under stress conditions. Higher GR activity was also reported in crop plants like wheat, sorghum, pigeonpea and foxtail millet (Jogeshwar et al. 2006; Kumutha et al. 2009; Selote and Khanna-Chopra 2010; Lata et al. 2011). The efficiency of antioxidant enzymes determines the amount of dehydration induced H2O2 in plant cell (Luna et al. 2005). When the activities of ROS scavenging enzymes were compared, it was observed that CAT and GR had a higher ROS scavenging activity than APX. Therefore, it could be assumed that CAT and GR are the most important ROS scavenging enzymes in root.
Fig. 4.
Changes in ascorbate peroxidase (APX) enzyme activity in highly stress tolerant and sensitive wheat roots exposed to 20 % PEG 6000 for 0, 1, 12 and 24 h. One unit of enzyme activity defined as 1 μ mol of ascorbate oxidized min−1. Data represent the means ± SD of three independent experiments (n = 3), a P < 0.05, b P < 0.01, c P < 0.001
Fig. 5.
Changes in glutathione reductase (GR) enzyme activity in highly stress tolerant and sensitive cultivars exposed to 20 % PEG 6000 for 0, 1, 12 and 24 h. One unit of enzyme activity defined as 1 μ mol of GS-TNB formed min−1 due to reduction of DTNB. Data represent the means ± SD of three independent experiments (n = 3), a P < 0.05, b P < 0.01, c P < 0.001
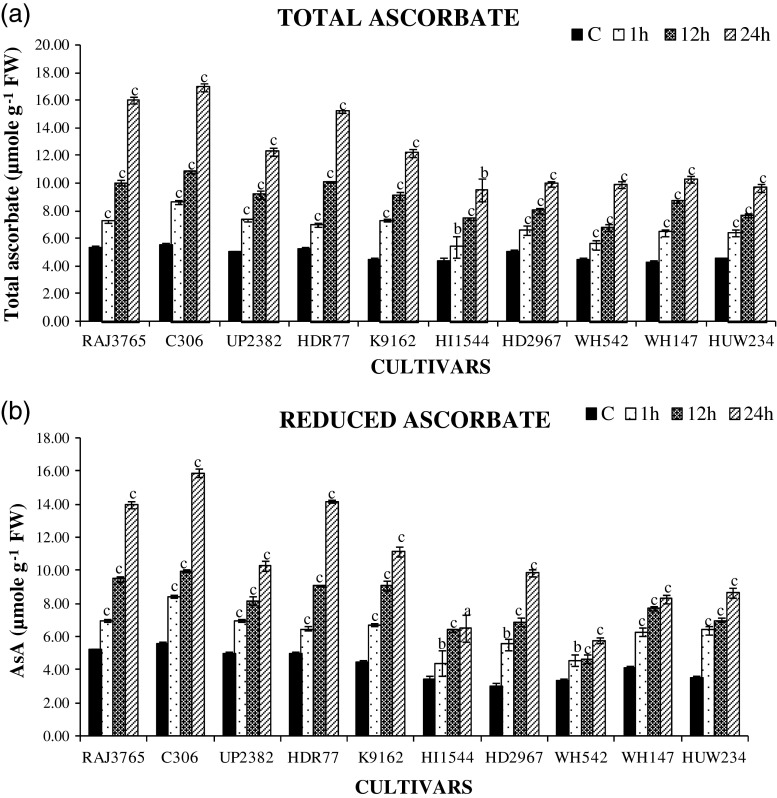
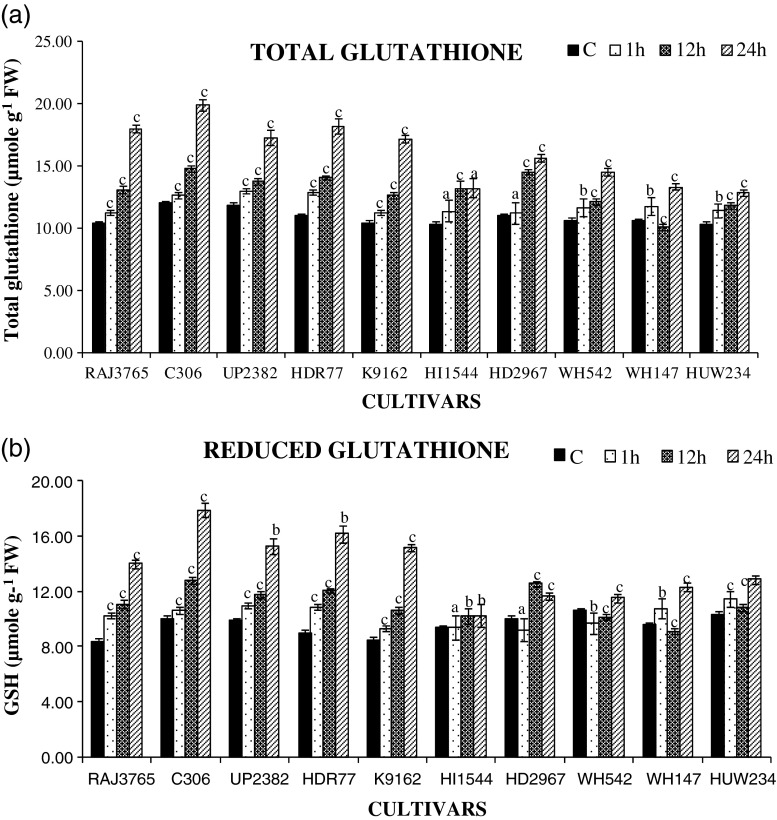
Highly tolerant cv. of wheat showed significantly increased level of total ascorbate content (AsA plus DHA) (Fig. 6a) and reduced ascorbate (AsA) contents (Fig. 6b) as well as total glutathione (GSSG plus GSH) and reduced glutathione (GSH) contents than highly sensitive cultivrs. C306 exhibited maximum increase in total ascorbate content (250 %) and followed by HDR77 (217 %), HI1544 (150 %), HD2967 (100 %) at 24 h of dehydration stress. Similarly, highly tolerant cultivars also exhibited increase in total glutathione (Fig. 7a) C306 (250 %) and RAJ3765 (180 %) and reduced glutathione GSH (Fig. 7b) C306 (90 %) and RAJ3765 (66 %), as compared to control plants at later stages. However, highly sensitive cultivars maintained significantly lesser amount of total glutathione and reduced glutathione respectively HI1544 (100 %) and (40 %) during later stages of stress, when compared with tolerant cultivars. Exposure to dehydration stress resulted in higher increase in AsA and GSH redox pool in the roots of highly tolerant wheat cultivars than that of highly sensitive cultivars. This might be due to higher biosynthesis or regeneration of AsA and GSH due to enhanced activities of Ascorbate-glutathione cycle enzymes during stress condition. The higher amounts of AsA and GSH in highly tolerant cultivars may have provided the better protection against ROS during dehydration stress than highly sensitive cultivars. The importance of AsA and GSH against ROS during drought has been highlighted in wheat cultivars (Selote and Khanna-Chopra 2010).
Fig. 6.
Estimation of ascorbate content. a changes in total ascorbate content b reduced ascorbate (AsA) content in highly tolerant and sensitive cultivars of wheat exposed to 0, 1, 12 and 24 h of dehydration stress treatment. Data represent the means ± SD of three independent experiments (n = 3), a P < 0.05, b P < 0.01, c P < 0.001
Fig. 7.
Estimation of glutathione content. a changes in total glutathione content b reduced glutathione (GSH) content in highly tolerant and sensitive cultivars of wheat exposed to 0, 1, 12 and 24 h of dehydration stress treatment. Data represent the means ± SD of three independent experiments (n = 3), a P < 0.05, b P < 0.01, c P < 0.001
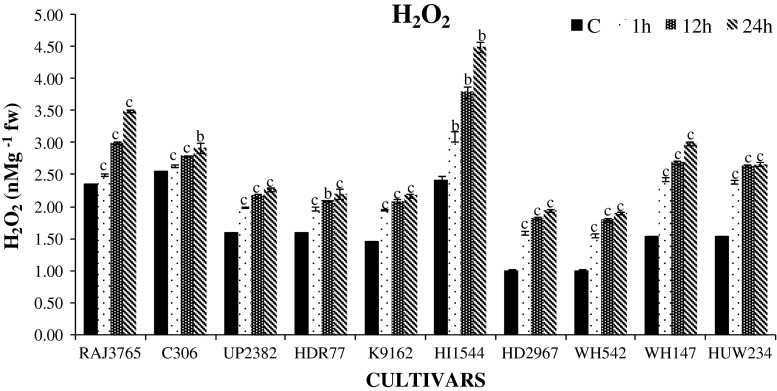
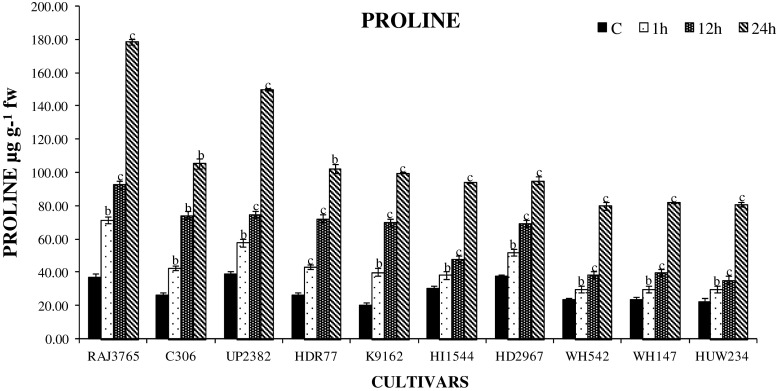
To evaluate the correlation between activity of antioxidant enzymes and H2O2 content under dehydration stress, accumulation of H2O2 content was also measured. The H2O2 content was found to be enhanced in all cultivars studied at different durations of stress (Fig. 8). On comparing with other time intervals, 24 h showed maximum increase in H2O2 levels (P < 0.001) in both highly tolerant and sensitive cultivars with higher accumulation of H2O2 in highly sensitive cultivars. Cultivar HI1544 (96 %) and WH147 (86 %) showed higher accumulation of H2O2 than tolerant cultivars C306 (14 %) and RAJ3765 (20 %). Efficient detoxification of increased H2O2 by antioxidant enzymes is essential to prevent the formation of OH− radical, which further causes the membrane damage. Lower levels of lipid peroxidation and H2O2 were observed in tolerant cultivars, suggesting an enhanced capacity for protection from oxidative stress in wheat. Similar findings have also been reported in wheat and other crops (Luna et al. 2005; Selote and Khanna-Chopra 2010). Accumulation of proline may act as good osmoprotectant, also contributing towards maintenance of water balance and reducing the membrane damage. Proline content was significantly (P < 0.001) increased in the seedlings of wheat subjected to all durations of stress as compared to unstressed control seedlings to counter the imposed stress (Fig. 9). The degree of proline accumulation was observed as highest at 24 h PEG treatment (P < 0.001). The highest increment was observed in cultivars C306 (383 %) and RAJ3765 (303 %), while the lowest accumulation was in cv. HD2967 (152 %). Roots are the first organ to sense the water deficit, and the accumulation of proline by roots was higher in tolerant cultivars, the dehydration induced accumulation of proline in roots may help in the maintenance of water absortion by roots and its flux to shoots. Thus, our observation suggests that accumulation of more proline in roots explains the greater tolerance of C306 to dehydration stress when compared to other genotypes. This was experimentally proved in earlier studies that crops under various abiotic stresses accumulate the maximum amount of proline in their root and leaf tissues (Tijen and Ismail 2005; Singh et al. 2010).
Fig. 8.
Changes in the level of hydrogen peroxide (H2O2) content in highly tolerant and sensitive cultivars of wheat exposed to 0, 1, 12, 24 h dehydration stress treatment. Data represent the means ± SD of three independent experiments (n = 3), a P < 0.05, b P < 0.01, c P < 0.001
Fig. 9.
Changes in the level of proline accumulation in highly tolerant and sensitive cultivars of wheat exposed to 0, 1, 12 and 24 h dehydration stress treatment. Data represent the means ± SD of three independent experiments (n = 3), a P < 0.05, b P < 0.01, c P < 0.001
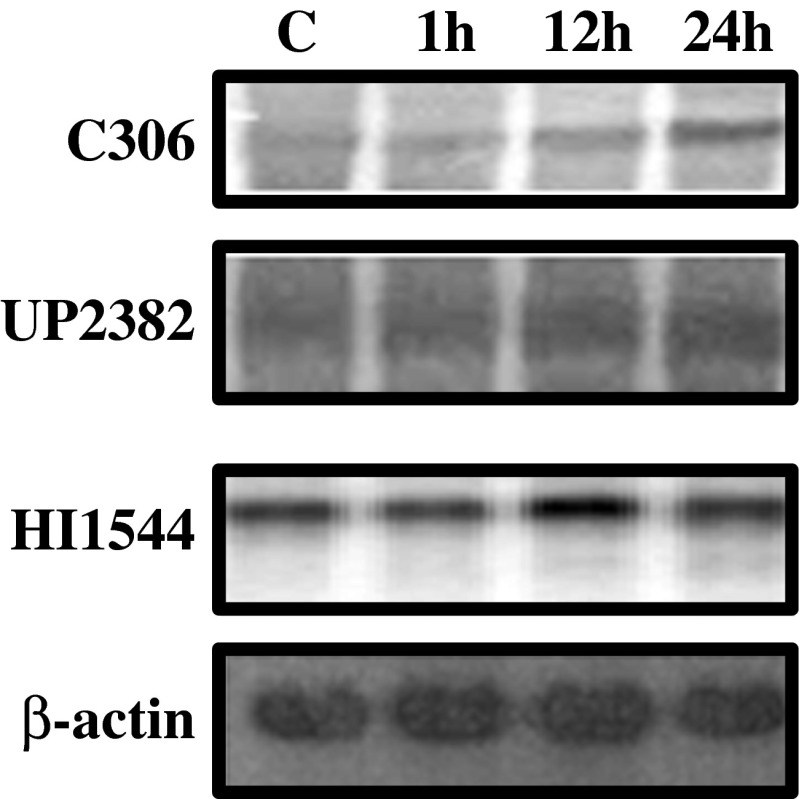
Whether the number of enzyme molecules cumulatively contributes to the enzymatic activities of antioxidant enzymes? With this intent, we analyzed the expression of CAT1 gene using northern hybridization in tolerant and sensitive cultivars for different durations of dehydration stress (0, 1, 12, and 24 h). To clone partial CAT1 cDNA fragment, gene specific sequence obtained from gene bank of accession (wheat CAT1 E16461) was used to design forward and reverse primers of product size 435 bp. The amplified sequence was used as probe in northern analysis. The relative expression of CAT1 gene was constantly increased in all cultivars up to 12 h of dehydration stress followed by decrease at 24 h except the highly tolerant cultivars (C306, UP2382) which showed threefold induction up to 24 h of stress (Fig. 10). These results are in agreement with evidences from rice and Arabidopsis depicted that expression of catalase always increased in tolerant cultivars due to abiotic stresses (Xing et al. 2007; Ye et al. 2011). Significant increase in CAT1 gene expression with increasing stress durations was positively correlated with increased CAT1 activity. Increased CAT1 gene expression and its activity during dehydration stress serves to limit the accumulation of H2O2, thus allowing essential signaling to occur during dehydration stress.
Fig. 10.
Northern blot showing the expression of CAT1 gene in highly tolerant (C306, UP2382) and highly sensitive (HI1544) cultivars of wheat exposed to 0, 1, 12, 24 h dehydration stress
Conclusion
Highly tolerant cultivars, when subjected to dehydration regime, showed better response in maintaining higher RWC and less oxidative adducts, which may have further initiated various events involving the activation of well organized antioxidant enzyme machinery resulting in less oxidative damage to plants. Higher accumulation of proline, lesser H2O2 content and more antioxidant enzymatic activity and antioxidants like ascorbate and glutathione in tolerant cultivars may thus provide better protection against dehydration induced stress in wheat. On the other hand, highly sensitive cultivars showed more oxidative damage and less antioxidant enzymes as expected. Further, northern analysis of CAT1 gene was largely confirmatory to our biochemical and physiological studies and proved that expression profile and activity of catalase is genotype dependent, mainly depending upon plant’s ability to stimulate antioxidant defense. Therefore, this study provides understanding of important role of CAT in removal of H2O2 and dehydration-induced regulation of catalase. It is hoped that the observations in this study may help select dehydration tolerant cultivars of wheat, which would prove beneficial in plant breeding.
Electronic supplementary material
Below is the link to the electronic supplementary material.
Description of 28 cultivars of wheat used in the present study. The values (a, b, c and d) of lipid peroxidation obtained in Control, 1, 12 and 24 h of dehydration stress in 20 % polyethylene glycol (PEG-6000) respectively expressed as μmole g−1 FW MDA concentration. Standard deviations were calculated from three independent experiments (n = 3). (DOC 84 kb)
Acknowledgements
We are thankful to Vice-Chancellor of the Banasthali University for providing necessary facilities.
Conflict of interest
The authors declare that they have no conflict of interest.
References
- Aebi M. Catalase in vitro. Methods Enzymol. 1984;105:121–126. doi: 10.1016/S0076-6879(84)05016-3. [DOI] [PubMed] [Google Scholar]
- Asada K. The water-water cycle in chloroplast: scavenging of active oxygen’s and dissipation of excess photons. Annu Rev Plant Physiol Plant Mol Biol. 1999;50:601–639. doi: 10.1146/annurev.arplant.50.1.601. [DOI] [PubMed] [Google Scholar]
- Barrs HD, Weatherley PE. A re-examination of the relative turgidity technique for estimating water deficit in leaves. Aust J Biol Sci. 1962;15:413–428. [Google Scholar]
- Bartels D, Sunkar R. Drought and salt tolerance in plants. Crit Rev Plant Sci. 2005;24:23–58. doi: 10.1080/07352680590910410. [DOI] [Google Scholar]
- Bates LS, Waldren RP, Teare ID. Rapid determination of proline in water stress studies. Plant Soil. 1973;39:205–207. doi: 10.1007/BF00018060. [DOI] [Google Scholar]
- Bhusan D, Pandey A, Choudary MK, Datta A, Chakraborty N. Comparative proteomics analysis of differentially expressed proteins in chickpea extracellular matrix during dehydration stress. Mol Cell Proteomics. 2007;6:1868–1884. doi: 10.1074/mcp.M700015-MCP200. [DOI] [PubMed] [Google Scholar]
- Bradford MM. A rapid and sensitive method for quantitation of microgram quantities of protein utilizing the principle of protein-dye binding. Ann Biochem. 1976;72:248–254. doi: 10.1016/0003-2697(76)90527-3. [DOI] [PubMed] [Google Scholar]
- Chaves MM, Oliveira MM. Mechanisms underlying plant resilience to water deficits: prospects for watersaving agriculture. J Exp Bot. 2004;55:2365–2384. doi: 10.1093/jxb/erh269. [DOI] [PubMed] [Google Scholar]
- Chen GX, Asada K. Ascorbate peroxidase in tea leaves: occurrence of two isozymes and the differences in their enzymatic and molecular properties. Plant Cell Physiol. 1999;30:987–998. [Google Scholar]
- Foyer CH, Harbinson J. Oxygen metabolism and the regulation of photosynthetic electron transport. In: Foyer CH, Mullineaux PM, editors. Causes of photo-oxidative stress and amelioration of defense systems in plants. Boca Raton: CRC Press; 1994. pp. 1–4. [Google Scholar]
- Garg N, Noor Z. Genotypic differences in plant growth, osmotic and antioxidative defense of Cajanus cajan (L.) Millisp. Modulated by salt stress. Arch Agron Soil Sci. 2009;55:3–33. doi: 10.1080/03650340802393303. [DOI] [Google Scholar]
- González L, González-vilar M. Determination of relative water content. In: Reigosa MJ, editor. Handbook of plant ecophysiology techniques. Dordrecht: Kluwer, Academic Publishers; 2001. pp. 207–212. [Google Scholar]
- Hamid A, Bibi N, Akhter J, Iqbal N. Differential changes in antioxidants, proteases, and lipid peroxidation in flag leaves of wheat genotypes under different levels of water deficit conditions. J Plant Physiol and Biochem. 2011;49:178–185. doi: 10.1016/j.plaphy.2010.11.009. [DOI] [PubMed] [Google Scholar]
- Hodgson RAJ, Raison JK. Lipid peroxidation and superoxide dismutase activity in relation to photoinhibition induced by chilling in moderate light. Planta. 1991;185:215–219. doi: 10.1007/BF00194063. [DOI] [PubMed] [Google Scholar]
- Jogeshwar G, Pallela R, Jakka NM, Reddy PS, Rao JV, Sreenivasulu N, Kishor PBK. Antioxidative response in different sorghum species under short-term salinity stress. Acta Physiol Plant. 2006;28:465–475. doi: 10.1007/BF02706630. [DOI] [Google Scholar]
- Kumutha D, Ezhilmathi K, Sairam RK, Srivastava GC, Deshmukh PS, Meena RC. Water logging induced oxidative stress and antioxidant activity in pigeon pea genotypes. Biol Plant. 2009;53:75–84. doi: 10.1007/s10535-009-0011-5. [DOI] [Google Scholar]
- Lata C, Jha S, Dixit V, Sreenivasulu N, Prasad M. Differential antioxidative responses to dehydration-induced oxidative stress in core set of foxtail millet cultivars (Setaria italica L.) Protoplasma. 2011;248:817–828. doi: 10.1007/s00709-010-0257-y. [DOI] [PubMed] [Google Scholar]
- Leprince O, Harren FJM, Buitink J, Alberda M, Hoekstra FA. Metabolic dysfunction and unabated respiration precede the loss of membrane integrity during dehydration of germinating radicles. Plant Physiol. 2000;122:597–608. doi: 10.1104/pp.122.2.597. [DOI] [PMC free article] [PubMed] [Google Scholar]
- Loggini B, Scartazza A, Brugnoli E, Navari-Izzo F. Antioxidant defense system, pigment composition and photosynthetic efficiency in two wheat cultivars subjected to drought. Plant Physiol. 1999;119:1091–1099. doi: 10.1104/pp.119.3.1091. [DOI] [PMC free article] [PubMed] [Google Scholar]
- Luna CM, Pastori GM, Driscoll S, Groten K, Stephanie B. Drought controls on H2O2 accumulation, catalase (CAT) activity and CAT gene expression in wheat. J Exp Bot. 2005;56:417–423. doi: 10.1093/jxb/eri039. [DOI] [PubMed] [Google Scholar]
- Noctor G, Foyer CH. Ascorbate and glutathione: keeping active oxygen under control. Annu Rev Plant Physiol Plant Mol Biol. 1998;49:249–279. doi: 10.1146/annurev.arplant.49.1.249. [DOI] [PubMed] [Google Scholar]
- Sambrook J, Fritsch EF, Maniatis T. Molecular Cloning: a laboratory manual. Cold Spring Harbour: Cold spring Harbour Laboratory Press; 1989. pp. 742–750. [Google Scholar]
- Selote DS, Khanna-Chopra R. Antioxidant response of wheat genotypes tolerance. Protoplasma. 2010;245:153–163. doi: 10.1007/s00709-010-0169-x. [DOI] [PubMed] [Google Scholar]
- Silva EN, Ferreira-Silv SL, Fontenele AV, Ribeiro RV, Viégas RA, Silveira JAG. Photosynthetic changes and protective mechanisms against oxidative damage subjected to isolated and combined drought and heat stresses in Jatrophacurcas plants. J Plant Physiol. 2010;167:1157–1164. doi: 10.1016/j.jplph.2010.03.005. [DOI] [PubMed] [Google Scholar]
- Simova-Stoilova L, Demirevska K, Petrova T, Tsenov N, Feller U. Anti-oxidative protection in wheat varieties under severe recoverable drought at seedling stage. Plant Soil Environ. 2008;54:529–536. doi: 10.1111/j.1747-0765.2008.00272.x. [DOI] [Google Scholar]
- Singh V, Bhatt I, Aggarwal A, Tripathi B, Munjal A, Sharma V. Proline improves copper tolerance in chickpea (Cicer arientinum) Protoplasma. 2010;245:173–181. doi: 10.1007/s00709-010-0178-9. [DOI] [PubMed] [Google Scholar]
- Smart RE, Bingham GE. Rapid estimates of relative water content. Plant Physiol. 1974;53:258–260. doi: 10.1104/pp.53.2.258. [DOI] [PMC free article] [PubMed] [Google Scholar]
- Smith IK, Vierheller TL, Thorne CA. Assay of glutathione reductase in crude tissue homogenates using 5, 5 -dithiobis (2-nitrobenzoic acid) Ann Biochem. 1988;175:408–413. doi: 10.1016/0003-2697(88)90564-7. [DOI] [PubMed] [Google Scholar]
- Tijen D, Ismail T. Comparative lipid peroxidation, antioxidant defense systems and proline content in roots of two rice cultivars differing in salt tolerance. Environ Exp Bot. 2005;53:247–257. doi: 10.1016/j.envexpbot.2004.03.017. [DOI] [Google Scholar]
- Varghese B, Naithani SC. Oxidative metabolism-related changes in cryogenically stored neem (Azadirachta indica A. Juss) seeds. J Plant Physiol. 2008;165:755–756. doi: 10.1016/j.jplph.2007.03.009. [DOI] [PubMed] [Google Scholar]
- Velikova V, Yordanov I, Edreva RA. Oxidative stress and some antioxidants in acid rain- treated bean plants. Plant Sci. 2000;151:59–66. doi: 10.1016/S0168-9452(99)00197-1. [DOI] [Google Scholar]
- Wang WB, Kim YH, Lee HS, Kim KY, Deng XP, Kwak SS. Analysis of antioxidant enzyme activity during germination of alfalfa under salt and drought stresses. Plant Physiol Biochem. 2009;47:570–577. doi: 10.1016/j.plaphy.2009.02.009. [DOI] [PubMed] [Google Scholar]
- Xing Y, Jia W, Zhang J. AtMEK1 mediates stress-induced gene expression of CAT1 catalase by triggering H2O2 production in Arabidopsis. J Exp Bot. 2007;58:2969–2981. doi: 10.1093/jxb/erm144. [DOI] [PubMed] [Google Scholar]
- Ye N, Zhu G, Liu Y, Li Y, Zhang J. ABA controls H2O2 accumulation through the induction of OsCATB in rice leaves under water stress. Plant Cell Physiol. 2011;52:689–698. doi: 10.1093/pcp/pcr028. [DOI] [PubMed] [Google Scholar]
Associated Data
This section collects any data citations, data availability statements, or supplementary materials included in this article.
Supplementary Materials
Description of 28 cultivars of wheat used in the present study. The values (a, b, c and d) of lipid peroxidation obtained in Control, 1, 12 and 24 h of dehydration stress in 20 % polyethylene glycol (PEG-6000) respectively expressed as μmole g−1 FW MDA concentration. Standard deviations were calculated from three independent experiments (n = 3). (DOC 84 kb)


