

Abstract
Glucocorticoids are important regulators of metabolism and immune function. Synthetic glucocorticoids are extensively used for immunosuppression/anti-inflammatory therapy. Since the glucocorticoid receptor (GR) is central to most hormone effects; its in vivo regulation will influence hormone/drug action. An alternative splice variant, GRβ, is present in humans and may function as a dominant negative regulator of GR transcriptional activity. Recently, a similar splice variant was reported in mouse, although the mechanism of alternative splicing differs from that in humans. We present evidence that a splice variant of GR with an alternative C-terminus also occurs in the rat by a mechanism of intron inclusion. A highly quantitative qRT-PCR assay for the simultaneous measurement of both splice variants in a single sample was developed in order to accurately measure their regulation. We used this assay to assess the tissue specific expression of both mRNAs, and demonstrate that GRα is predominant in all tissues. In addition, the regulation of both GRα and GRβ mRNA by various physiological factors in rat liver was assessed. GRα showed a robust circadian rhythm, which was entrained with the circadian oscillation of the endogenous hormone. Time series experiments showed that both corticosteroids and LPS but not insulin dosing resulted in the transient down-regulation of GRα mRNA. LPS treatment also resulted in down-regulation of GRβ expression. A modest up-regulation in GRβ expression was observed only in animals having chronically elevated plasma insulin concentrations. However the expression of GRβ was significantly lower than that of GRα in all cases.
Keywords: glucocorticoids, glucocorticoid receptor, GRβ, qRTPCR
Introduction
Glucocorticoids, a class of steroid hormones which are produced in a distinct circadian pattern by the adrenal cortex, have wide-ranging regulatory effects on both development and metabolism. The regulation of glucose metabolism /energy flux via systemic control of gluconeogenesis is a prominent homeostatic effect. Regulation of energy flux by glucocorticoids involves skeletal muscle and adipose tissue as well as liver. In addition, glucocorticoids have immune modulatory effects which are clinically exploited in the extensive pharmacologic use of synthetic glucocorticoids (corticosteroids) for anti-inflammatory therapy. However, their clinical use is often limited by adverse effects with long term and/or high dose treatment, which primarily stem from a magnification of normal metabolic effects [1, 2].
The driving force mediating most glucocorticoid/corticosteroid effects is the glucocorticoid receptor (GR) [3, 4]. GR is localized to the cytoplasm in an inactive form complexed with heat shock and associated proteins in the absence of hormone. High affinity binding releases the receptor from the complex when hormone is present and the hormone-receptor complex translocates into the nucleus. Most metabolic effects are mediated by homodimer binding of hormone-bound receptor to specific DNA regulatory sites (GREs) with a subsequent alteration in that gene s rate of transcription, a process generally referred to as transactivation. In contrast, many immune related effects appear to be mediated by a different molecular mechanism, termed transrepression, whereby hormone-bound receptor interacts with and modulates the action of other transcription factors such as NfκB and AP-1. GR is central to most of the molecular actions of glucocorticoids in either case. GR has been documented to be present in most mammalian tissues and cell types consistent with the wide-ranging effects of glucocorticoids.
In humans, an alternative form of the receptor, which data suggests acts as a dominant negative regulator of GR-mediated effects on gene transcription, has been characterized [3, 4]. This alternative isoform was first predicted in 1985 by Hollenberg and colleagues in conjunction with cDNA cloning of human GR [5]. Subsequently, genomic cloning by Encio et al. demonstrated that this alternative form arises by differential splicing of the same gene [6]. In humans, exons 1–8 are common to both the major receptor isoform (GRα) and the alternative form (GRβ), while the two isoforms diverge in the use of different regions of exon 9. For several years it was generally accepted that the beta isoform of GR did not exist in rodents based on observations by Otto and colleagues [7]. They demonstrated that exon 9 of mouse did not contain alternative splice sites, and RT-PCR with primers specific for the regions of mouse exon 9 comparable to the human GRβ isoform produced no product. However, Hinds et al. more recently demonstrated that an alternative form of GR (termed GRβ) is expressed in mouse both in vivo and in vitro [8]. In contrast to humans, alternative splicing in the mouse occurs by inclusion of intron 8 rather than differential splicing of exon 9. As with the human isoform, in vitro transfection experiments with GRβ expressing plasmids suggest that the beta isoform may function as a negative regulator of GRα transcriptional regulation. Evidence was presented that expressions of the two murine isoforms may be regulated by glucocorticoids, cytokines, and insulin. However, since GRα and GRβ mRNAs were measured separately and reported as relative expression, more quantitative measurements may be useful in assessing the physiological relevance of splice variant expression.
Here we demonstrate alternative splicing of GR occurs in the rat by a mechanism attributed to intron inclusion. A TAQMAN-based real-time qRTPCR assay was developed for the simultaneous and specific measurement of both isoforms in the same sample, quantitated against a chimeric cRNA standard containing both alpha-specific and beta-specific as well as common sequences. In vivo expression was measured in a panel of tissues taken from control animals, and physiologically relevant dynamics of regulation in rat liver were examined.
Experimental
Animal experimentation
Tissues used in these experiments were taken from population-based animal studies previously conducted in our laboratories. All protocols adhered to the Principles of Laboratory Animal Care (NIH publication 85-23, revised in 1985) and were approved by the University at Buffalo Institutional Animal Care and Use Committee. Details of MPL administration [9], circadian regulation [10], and diabetic animals [11] have been published. For LPS administration, male Lewis rats (Harlan, Indianapolis, IN) were injected (ip) with a single dose of E. Coli LPS (serotype 111:B8) purchased from Sigma Chemicals and prepared in sterile saline. Animals received a single sub-lethal dose (50 ug/kg) and were sacrificed under ketamine:xylazine anesthesia at various times after dosing. For acute insulin studies, male Wistar rats (Harlan) were injected with a single dose of human insulin (Humulin R, Eli Lilly, Indianapolis, IN) administered through the penile vein under Nembutal anesthesia. Tissues from all studies were rapidly dissected, frozen in liquid nitrogen, and were stored at −80°C.
RNA preparation
Frozen tissue samples were ground into a fine powder in a mortar cooled by liquid nitrogen. Frozen tissue was extracted with Trizol Reagent (InVitrogen, Carlsbad CA) and further purified by passage through RNeasy mini-columns (QIAGEN, Valencia, CA) as previously described [10, 11]. All samples exhibited 260/280 absorbance ratios of approximately 2.0, and all showed intact ribosomal 28S and 18S RNA bands in an approximate ratio of 2:1 as visualized by ethidium bromide staining.
In silico comparison of rat and mouse GR sequences
cDNA RefSeq data were downloaded for GR (nuclear receptor subfamily 3, group C, member 1; Nr3C1) for mouse (NM_008173.3) and rat (NM_012576), and aligned using the BLAST algorithm, NCBI. Alignment of full sequence data for mouse (6345 nts) and rat (6327 nts) indicated 93% homology in the full sequences and 95% homology in identified coding regions. Exon boundary information and sequence data were retrieved from ENSEMBL, with 9 exons delineated in mouse and 8 exons in rat. Intron sequence datum was then obtained from NCBI using this information. Alignment of exon sequences from rat and mouse demonstrated that ENSEMBL exon 1 in mouse (which contains exclusively non-coding sequence) is not present in rat, but otherwise exon boundaries show perfect alignment (Supplementary Table 1, Supplementary Figure 1); therefore the exon designated as 2 by ENSEMBL in mouse is equivalent to exon 1 in rat and so on. Corresponding introns in rat and mouse are roughly similar in size, but show less size similarity and less homology than exons; intron 7 in rat and intron 8 in mouse have 73% identity.
Conventional RT-PCR
Reverse transcription of rat spleen RNA was carried out using oligo(dT) primer and Superscript III (InVitrogen) in a 20 μl reaction volume containing 1 μg total rat spleen RNA according to manufacturer s instructions. PCR amplification was carried out with Platinum TAQ (InVitrogen) in a 50 μl reaction volume using 1–2 μl of the RT reaction as template. PCR was carried out in a GeneAmp 9700 thermo cycler (Perkin-Elmer) with the following conditions: 94°- 5 minutes followed by 40 cycles of : 94°- 1 minute, 60° -1 minute, 72° - 1 minute, and an extension step of 72° - 7 minutes. PCR products were visualized by agarose gel electrophoresis. Where indicated, PCR products were extracted and purified from agarose gels for sequencing using Illustra GFX PCR DNA and Gel Band Purification kits (GE Healthcare). Automated Sanger sequencing was performed at the Roswell Park Memorial Institute DNA Facility (Buffalo, NY).
Cloning and cRNA production
A cRNA was used to construct standard curves for subsequent qRTPCR analysis. The cRNA standard was synthesized from a cloned chimeric construct containing sequences included in exons 5–7 (common to alpha and beta) and intron 7 (beta specific) linked to sequences contained in exon 8 (alpha specific) as depicted in Figure 1. PCR product 1 consisted of a 5-prime Sac I site, positions 1832–2245 of the reference sequence (NM_0012576), positions 1–230 of Intron 7, and a 3-prime Xho I site. PCR product 2 consisted of a 5-prime Xho I site, positions 2259–2661 of the reference sequence, and a 3-prime Bam H1 site. Both PCR products were simultaneously cloned into pGEM 3Z using T4 ligase of restriction digested PCR products. Purified cloned DNA (Qiaprep Spin Miniprep, Qiagen) was verified by sequencing, linearized with Xba I, and a cRNA standard was in vitro transcribed from the linear construct (Megascript T7 Kit, Ambion, Austin TX). Size, purity and integrity of the cRNA were assessed by formaldehyde agarose gel electrophoresis and spectrophotometry.
Figure 1.
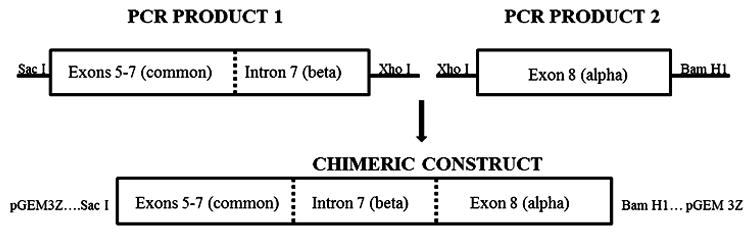
Construction of cRNA standard for qRTPCR analysis of GRα and GRβ mRNA.
Development of qRTPCR Assay
A TAQMAN based real-time qRTPCR assay was developed and validated according to MIQE standards [12]. The developed assay allows for the simultaneous measurement of alpha and beta splice variants in a single multiplexed reaction. Primer sets and probes were designed using RealTime Design software (Biosearch Technologies Inc., Novato, CA) and were custom synthesized by that company. qRT-PCR was performed in a Stratagene MX3005P real-time cycler. Assays employed Stratagene Brilliant II RT-PCR One Step Core Reagent kits (Agilent Technologies, Cedar Creek, TX). Final assay volumes were 25 μl, and included 2.5 μl total RNA at a concentration of 25 ng/μl (final RNA concentration of 62.5 ng). Three sets of TAQMAN based probe-primer pairs were designed to measure common, beta-specific and alpha-specific sequences as presented in Table 1. Assay conditions (MgCl2, forward primer, reverse primer and probe concentrations) were optimized for each primer-probe set alone, and for alpha and beta multiplexed using total rat spleen RNA in a 25 ul reaction volume. Final qRTPCR conditions for assays are provided in Table 2. A standard curve consisting of 7 concentrations of cRNA (0.505 to 245 femtograms per tube) was run in each experiment; R2 values were in all cases greater than 0.99. Efficiencies of all runs were greater than 95%. Experimental samples were run in triplicate; intra- and inter-assay variabilities were less than 18% in all cases. Parallel tubes were run for every sample without reverse transcription (no RT controls) to ensure absence of genomic contamination. In addition, a quality control consisting of a single rat spleen RNA sample was included in every qRTPCR run to ensure equivalency of individual experiments. QC measurements were 1587 ± 136 molecules/ng RNA for GRα and 112 ± 19 molecules/ng RNA for GRβ.
Table 1.
qRTPCR Probes and Primers
| Description | Sequence | Amplicon size |
|---|---|---|
| Beta Forward Primer | GCGCTTGAGGCTAAGATAGCT | 108 |
| Beta Reverse Primer | CCCATGTTTCTGCCTCTTTCTTTG | |
| Beta Probe | CFO560-AGTCTGCCTTCAGAATGCCTGTCA-BHQ1 | |
| Alpha Forward Primer | GCGACAGAAGCAGTTGAGTCATC | 103 |
| Alpha Reverse primer | CCATGCCTCCACGTAACTGTTAG | |
| Alpha Probe | FAM-TGAAGTGATAGCACAGCAGACAGTGA-BHQ1 | |
| Common Forward Primer | GCCCTGGGTTGGAGATCATAC | 99 |
| Common Reverse Primer | CATGCAGGGTAGAGACATTCTC | |
| Common Probe | FAM-ACAATCAAGTGGAAACCTGCTCTGC-BHQ1 |
Table 2.
qRTPCR Assay Conditions
| A. Multiplexed Assay
| |
|---|---|
| Component | Concentration |
| Beta forward primer | 150 nM |
| Beta reverse primer | 200 nM |
| Beta probe | 200 nM |
| Alpha forward primer | 100 nM |
| Alpha reverse primer | 150 nM |
| Alpha probe | 200 nM |
| MgCl2 | 4.5 mM |
| B. GRcommon Assay
| |
|---|---|
| Component | Concentration |
| Common forward primer | 100 nM |
| Common reverse primer | 200 nM |
| Common probe | 300 nM |
| MgCl2 | 4.5 mM |
Statistical analysis
One-way ANOVA with Bonferroni post-hoc analysis or two-tailed Student s t-tests were performed where indicated using SigmaStat software.
Results
RT-PCR confirmation of GRβ expression in rat
Conventional RT-PCR confirmed transcription of an alternative splice variant of rat GR containing intron 7 sequences. Total RNA prepared from rat spleen was reverse transcribed followed by PCR amplification with primer pairs designed to span various regions of rat exons 1–7 and intron 7. The sequence of rat intron 7 is given in Supplementary Figure 2. Table 3A presents the sequences and locations of various primers used in this study; Table 3B presents predicted sizes of PCR products with various primer combinations. PCR products were separated by agarose gel electrophoresis and visualized by ethidium bromide staining. In selected cases cDNA fragments were isolated from the gel and sequenced (Table 3B). PCR products were of expected size based on inclusion of intron 7, and sequenced fragments exhibited 100% identity with appropriate exon and intron sequences in all cases. Figure 2 presents results of a subset of these PCR reactions.
Table 3.
Rat GR PCR Primers and Expected PCR Products
| A: PCR PRIMERS
| |||
|---|---|---|---|
| Primer Designation | Sequence | Position | Location |
| F1 | TACCACAGCTCACCCCTACC | RefSeq 1638–1657 | Exon 4 |
| F2 | ATAAAAGCCTGAGGGGAGGA | RefSeq 101–124 | Exon 1 |
| F3 | GATGACCAAATGACCCTGCT | RefSeq 1832–1851 | Exon 5 |
| F4 | ACGGGACCACCTCCCAAGCTC | RefSeq 1307–1327 | Exon 2 |
| F5 | GTCAGAACTGGCAACGGTTT | RefSeq 2190–2209 | Exon 7 |
| F6 | CCACTGCAGGAGTCTCACAA | RefSeq 1575–1594 | Exon 4 |
| F7 | AGTGCCACATGCCTTTAACC | Intron7 57–76 | Intron 7 |
| ALPHA FOR | GAGTCTCACAAGACACTTC | RefSeq 1584–1602 | Exon 4 |
| R1 | CCCATGTTTCTGCCTCTTTC | Intron 7 192–211 | Intron 7 |
| R2 | GGTTAAAGGCATGTGGCACT | Intron 7 57–76 | Intron 7 |
| R4 | ATCCAGCATTTGGGAAACTG | Intron 7 523–542 | Intron 7 |
| R5 | GCACTGCCCACAACCGAGTTTT | Intron 7 40–61 | Intron 7 |
| R6 | TCATGCTTTATTGGCCTTCA | Intron 7 682–701 | Intron 7 |
| R7 | CTCAGGAATCCCACAAAAACA | Intron 7 755–775 | Intron 7 |
| R8 | ATTATGGCATCCCCTCCTTC | Intron 7 958–977 | Intron 7 |
| R9 | AGCAAAGCAGAGCAGGTTTC | RefSeq 1917–1936 | Exon 5 |
| ALPHA REV | CAGCTAACATCTCTGGGAATTC | RefSeq 2306–2327 | Exon 8 |
| B: Expected Products
| |||
|---|---|---|---|
| Primer pair | Location | Predicted size | Sequenced |
| F1 R1 | Exon 4 to Intron 7 (211) | 819 | yes |
| F1 R2 | Exon 4 to Intron 7 (76) | 684 | yes |
| F2 R2 | Exon 1 to Intron 7 (76) | 2217 | |
| F3 R4 | Exon 5 to Intron 7 (542) | 942 | yes |
| F4 R5 | Exon 2 to Intron 7 (61) | 1000 | yes |
| F5 R6 | Exon 7 to Intron 7 (701) | 743 | |
| F7 R7 | Intron 7 | 705 | |
| F7 R8 | Intron 7 | 907 | |
| F6 R9 | Exon 4 to Exon 5 | 362 | |
| AlphaF AlphaR |
Exon 4 to Exon 8 | 744 | yes |
Figure 2.
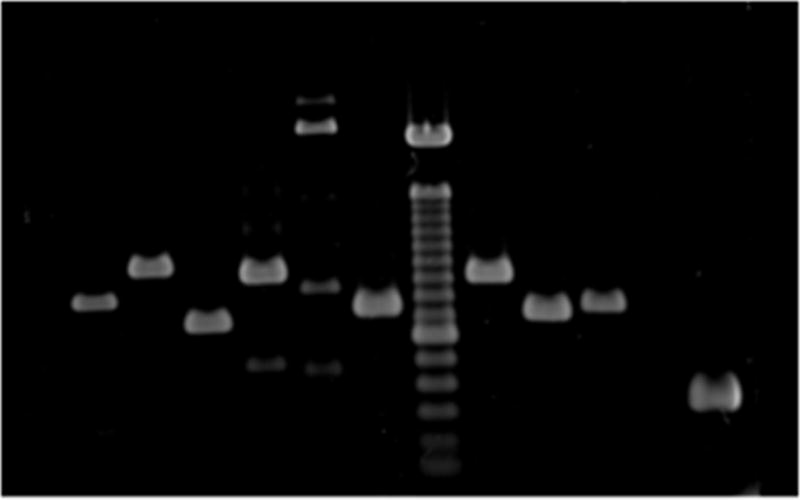
Gel electrophoresis of RT-PCR demonstrating expression of intron 7. Primer combinations (Table 2) and predicted product sizes are as follows: lane 1 = F1R1, 819 bp; lane 2 = F4R4, 1000 bp; lane 3 = F1R2, 684 bp; lane 4 = F3R4, 942 bp; lane 5 = F2R2, 2217 bp; lane 6 = F5R6, 743 bp; lane 7 = 100 bp ladders; lane 8 = F7R8, 907 bp; lane 9 = F7R7, 705 bp; lane 10 = GRα control, 744 bp; lane 11 = minus RT control; lane 12 = F6R9 (exon 4–5 control), 362 bp.
GR mRNA expression in normal animals
Expression levels of GRα and GRβ were simultaneously measured in liver, spleen, thymus, lung, skeletal muscle, kidney, heart, and adipose tissue from normal male Wistar rats. The tissues employed here were obtained from control animals from our previously conducted time-course study that entailed acute dosing with glucocorticoids [9]. The total number of control animals in that study was six, but 3 animals were sacrificed in the early light phase of the light:dark cycle, and 3 sacrificed during the early dark phase of a tightly controlled 12 hr:12 hr light:dark cycle. Figure 3 presents the expression of the alpha isoform (A), beta isoform (B), and the ratio of alpha:beta (C) in these tissues. Only liver exhibited significant differences in expression of the alpha splice variant when comparing light and dark sacrificed animals (P < .001, Student s t-test). Neither the beta splice variant from liver, nor either variant from any other tissue exhibited significant differences. Parallel measurements of total GR expression were carried out using the primer-probe set specific for the region common to both alpha and beta isoforms; the ratio of alpha+beta/common was approximately 1 for all tissues (Supplementary Table 2) providing a further validation of the multiplex assay. Expression of mRNA for both splice variants differed between tissues with alpha expression being highest in lung and lowest in skeletal muscle (Figure 3A), while beta expression was highest in thymus and lowest in skeletal muscle (Figure 3B). In all cases, beta expression ranged between 2.5% (muscle) to 12% (thymus) of total GR expression. Therefore, expression of alpha can be as much as 40-fold that of beta (muscle) or as little as 7–8 fold higher in spleen and thymus.
Figure 3.
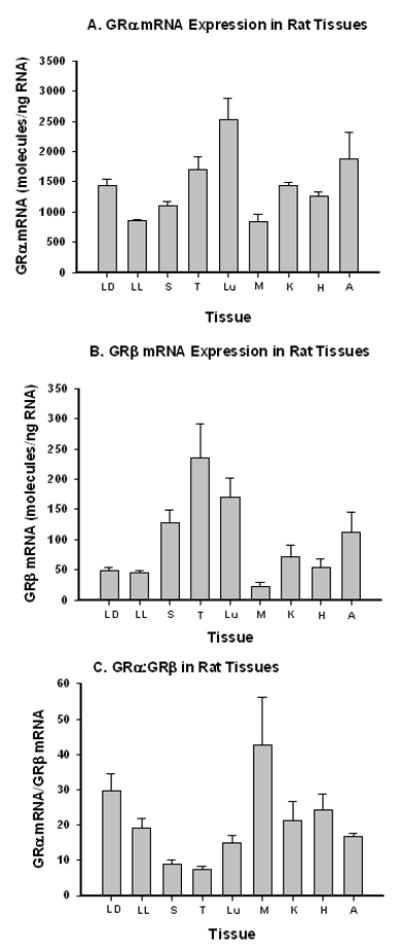
GRα and GRβ mRNA expression in rat tissues. LD = liver, dark harvest; LL = liver, light harvest; S = spleen; T=thymus; Lu = lung; M = gastrocnemius muscle; K = kidney; H = heart; A = adipose tissue. Bars represent means and error bars one standard deviation of means. N=3.
Circadian regulation of GR mRNA
Daily cyclic expression of GR splice variants was examined utilizing liver tissue taken from a large circadian study previously conducted in our laboratories [10]. In this study, 54 male Wistar rats were maintained in tightly controlled environmental conditions with a 12 hr:12 hr light:dark cycle. Three animals were sacrificed at each of 18 different time points across the 24 hour cycle. Figure 4 presents the expression of GRα mRNA, which shows rhythmic expression, with higher expression in the dark period. Peak (13 hr) and trough (8 hr) expressions were significantly different (P = .009, Student s t-test). Superimposed on that figure is the profile of corticosterone (the endogenous glucocorticoid in the rat) measured by HPLC in plasma samples taken from these same animals as reported previously [18]. Rhythmicity was not observed in the beta splice variant.
Figure 4.
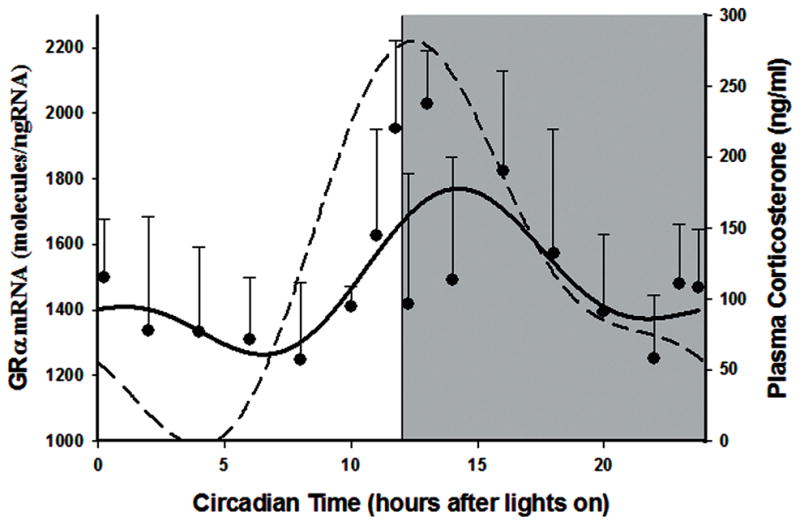
GRα mRNA expression in rat liver as a function of circadian time. Closed circles represent mean and error bars one standard deviation of mean measurements on 3 animals per time point. The dashed line presents plasma corticosterone measurements from the same animals. Unshaded regions depict light phase and shaded regions dark phase of the 24 hour cycle.
Liver GR mRNA regulation in vivo
Down-regulation of GR mRNA by glucocorticoids is well documented. Expression of alpha and beta were simultaneously measured in RNA extracted from livers of animals that had been given a single 50 mg/kg dose of methylprednisolone (MPL) and sacrificed at various times after injection (15 minutes to 96 hours; N = 3 animals per time point) in order to explore regulation of the individual isoforms. Plasma concentrations of drug in these animals have been previously published; drug is eliminated in a biexponential manner and is undetectable by 8 hours [9]. Figure 5 demonstrates that both isoforms show different time profiles. Alpha expression is significantly down-regulated (P < .001, one-way ANOVA) between 4 and 12 hours after injection. Maximal down-regulation to approximately 600 molecules/ng RNA was reached at 4–5 hours, with slow recovery beginning around 24 hours after injection. In contrast, GRβ expression was not down-regulated by hormone treatment; only values at 0.5 hr tested as significantly up-regulated. However, GRβ expression remained substantially lower than GRα at all time points.
Figure 5.
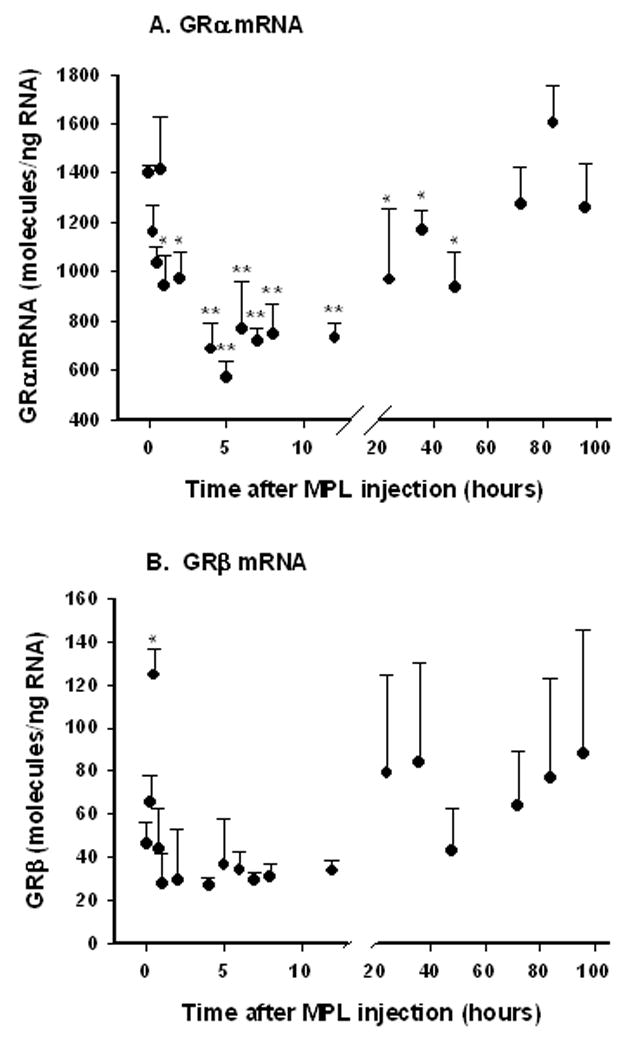
GRα and GRβ mRNA expression in rat liver after methylprednisolone (50 mg/kg) administration. Symbols represent means and error bars one standard deviation of means of measurements of 3 animals per time point. * P < 0.05; ** P < 0.001.
Apart from auto-regulation by the ligand itself, it has been reported that cytokines (particularly TNFα) and insulin also regulate GR mRNA expression in murine tissue [8]. In addition, several studies suggest increased human GRβ in response to increases in various cytokines [13–16]. GR expression was measured in livers taken from animals that had received a single sub-lethal injection of LPS (50 ug/kg ip) and sacrificed at various times after injection as an in vivo test of cytokine regulation. Results indicated that both isoforms were transiently down-regulated by LPS treatment, but with different temporal profiles. Figure 6A shows that GRα mRNA significantly declines by 4 hours after injection (P = .004) but recovers back to baseline by 8 hours. GRβ expression (Figure 6B) declines more rapidly, reaching its lowest concentration by 2 hours and recovers back to pre-dose levels by 8 hours, and were significantly different than controls between 1 and 4 hours post-treatment (P< .05). Therefore, the ratio of alpha:beta mRNA reaches it s maximum at 1–2 hours and rapidly returns to pre-dose levels by 4 hours (Figure 6C). It should be noted that plasma TNFα measured in these same animals exhibited a sharp peak at 1–2 hours after injection with a rapid decline thereafter (Supplementary Figure 3). Male rats were injected intravenously with a single dose of human insulin (10 U/kg) and sacrificed at various times from 2 minutes to 30 minutes post-injection (N = 3 animals per time point) to examine insulin effects of GR mRNA expression. However, no regulation of liver GR mRNA expression by insulin was noted. Mean GRα and GRβ expressions were 1133 ± 160 and 56 ± 13 molecules/ng RNA respectively; no significant differences from controls for either isoform were noted by one-way ANOVA analysis. In addition, splice variant expression was determined in livers taken from 8 week old Goto-Kakizaki diabetic rats and Wistar Kyoto controls (N = 6 animals per group) [11]. These diabetic animals had significantly higher plasma insulin concentrations compared to control animals at this age (GK = 14 ± 4, WKY = 5 ± 4 ng/ml). Although GRα expression tended to be lower in diabetic GK animals compared to controls (GK = 988 ± 169; WKY = 1306 ± 377 molecules/ng RNA), this difference did not test as significant (P = .088, Student s t-test). In contrast, GRβ expression was somewhat higher in diabetic samples as compared to control samples (GK = 33 ± 7; WKY = 22 ± 8 molecules/ng RNA), which was significantly different at the P<0.05 level (P = 0.03).
Figure 6.
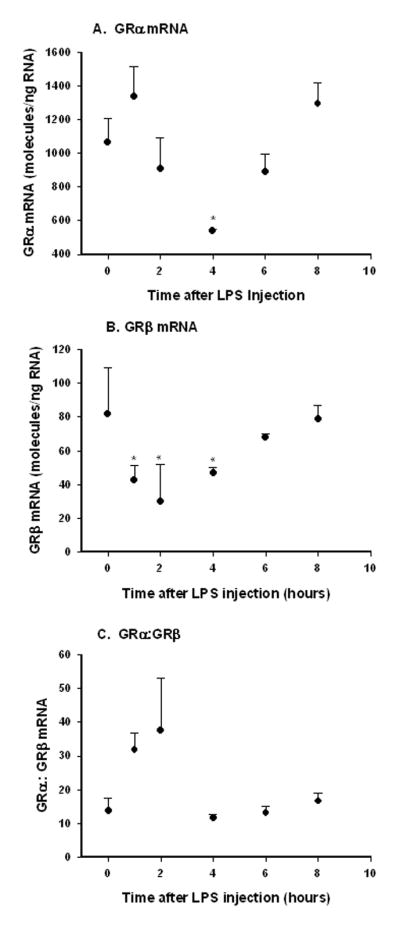
GRα and GRβ mRNA expression in rat liver as a function of time after LPS injection (50 μg/kg). Symbols represent means and error bars one standard deviation of means of measurements of 3 animals per time point. * P < 0.05
Discussion
The existence of an isoform of the glucocorticoid receptor, termed GRβ, arising from alternative splicing of the terminal exon has been well documented in human cell lines and tissue [3, 17, 18]. The two isoforms are identical through amino acid 727, but the beta isoform contains an additional 15 amino acids and the alpha isoform 50 amino acids which share little homology. The additional C-terminal amino acids in the alpha isoform are part of the ligand binding domain of the receptor, and consistent with their absence, GRβ is unable to bind glucocorticoids. Transfection experiments with either cultured cells or reporter constructs in a variety of studies suggest that the beta isoform acts as a dominant negative regulator of GRα, inhibiting its ability to modulate transcription [19–27]. However, other reports have failed to document inhibition of GRα transcriptional activity by GRβ [28–31]. Increased relative levels of GRβ at both the mRNA and protein levels have been reported in many steroid resistant states and some autoimmune diseases [15, 22, 32–35]. As a result, increased GRβ expression has been suggested as causative in these conditions. Thus, the physiological significance of GRβ expression and its regulation are still controversial but of potential clinical importance.
For many years, it was widely assumed that GRβ did not exist in rodents, since evidence was presented that alternative splicing of the terminal exon does not occur, and lack of conservation across species even brought into question its possible physiological significance [7]. However, Scraaf et al. reported a splice variant of GR in zebrafish that occurs by alternative splicing between the last two exons [36]. Hinds et al. have conclusively demonstrated the expression of an alternative form of GR in mouse with sequence divergence in the C-terminal region through inclusion of all or most of intron 8. [8]. We demonstrate here that in rats, like in mice, an alternative splice variant occurs by inclusion of the intron between the penultimate and last exon (Figure 2). In mouse, translation of the alternative splice variant results in an isoform containing 15 amino acids at the C-terminal end that diverge from the 50 C-terminal amino acids in the alpha isoform. In humans, the beta isoform also contains 15 divergent C-terminal amino acids; however they share little homology to those present in the mouse beta variant. It is predicted that translation of the alternative splice variant in rats will result in a protein with a divergent 28 amino acids (Supplementary Figure 2B) at the C-terminal. The data of Hinds as well as the data presented here are not inconsistent with the original reports by Otto et al. which reported no GRβ in rodents, since splicing in rodents occurs by different mechanisms and in different gene regions compared with humans.
It is widely reported that the concentrations of GRα are much greater than GRβ at both the mRNA and protein levels in both human and mouse. However, estimates of differential expression of the two splice variants differ widely. Some variation of RT-PCR analysis is generally used for examination of message expression, which is most often reported as relative levels of expression. Relative mRNA expressions have varied from 5-fold to 200-fold higher alpha, depending on the particular study. Quantitative assessment is even more difficult at the protein level, as both Western analysis and immunohistochemistry are only semi-quantitative; furthermore, the relatively low sensitivity of Western analysis often requires an initial immunoprecipatation of protein. In addition, it has recently been reported that some commercially available antibodies exhibit cross-reactivity with clathrin, which may overestimate beta expression in some studies [37]. With these caveats in mind, the protein expression of alpha may be as low as only 5-fold higher than that of beta. Furthermore, limited information is available regarding the physiological significance of relative expression of the two isoforms. In vitro transfection experiments suggest that an approximate 15-fold excess of GRβ would be necessary to decrease the activity of GRα by 90% [19], which brings into question the physiological significance of the rather low expression of the beta isoform. In contrast, others have demonstrated significant transcriptional effects at GRα:GRβ ratios of 1:1 [21]. However, one must consider that results from experiments with artificial constructs may not quantitatively translate to in vivo conditions. There have also been varying reports on whether and/or to what degree the beta inhibition of alpha transcriptional effects applies to only transactivation, only transrepression, or both [24–27, 38]. Furthermore, there have been reports that GRβ has transcriptional modulatory activities independent of their effects on GRα [39–41]. Therefore, more accurate assessment of expression levels of the two splice variants would provide insight to the roles of these GR variants and their physiological regulation. Rodents provide a useful model system to study physiological regulation since they allow for studies impossible to conduct in humans.
One of our goals was to develop a highly quantitative assay for the measurement of GRα and GRβ mRNA expression in rat tissues, and to examine the regulation of both isoforms in vivo. To that end, a multiplexed kinetic-based qRTPCR assay was developed for simultaneous measurement of GRα and GRβ. The salient features of this assay include: 1) the use of a one-step assay, where reverse transcription using gene specific primers and PCR occur sequentially in the same reaction tube, 2) use of a TAQMAN based assay which increases specificity, 3) use of a single chimeric cRNA standard constructed to contain both alpha and beta specific sequences , allowing measurements to be reported in terms of numbers of molecules rather than relative expression, 4) multiplexing, which allows for simultaneous measurement of alpha and beta in the same reaction. While we avoid use of the term “absolute quantification” (since one limitation is that we cannot be sure that the efficiency of RT is identical for an artificial cRNA construct and endogenous message), this assay is highly quantitative with good reproducibility, linearity, and efficiency, and allows for direct comparison of expression levels of both splice variants between different tissue samples.
This assay was applied to various rat tissue samples acquired and warehoused by our laboratory during previously conducted large population-based animal studies. While quantitative assessment of GRα and GRβ mRNA in various tissues from the same animals demonstrated expression of both splice variants in all tissues examined, absolute amounts of both variants as well relative expression of the two varied widely between tissues. Relative alpha expression was lowest in spleen and thymus which had only 7 to 8-fold more alpha than beta, followed by lung and adipose tissue which had approximately 15-fold more alpha than beta mRNA expressed. Highest alpha:beta ratios were seen in skeletal muscle which had approximately 40-fold more alpha than beta expression. No differences were found in either GRα or GRβ mRNA expression in comparing light and dark sacrificed animals in any tissue except for liver, where differences in GRα expression were significant. This is consistent with the circadian expression of GRα mRNA (Figure 4). An interesting point illustrated by Figure 4 is that while both endogenous hormone and GRα mRNA expression show circadian variation the two are largely entrained, with receptor message expression showing only a very slight lag with plasma hormone concentrations. This suggests that endogenous hormone within the normal physiological concentration range, unlike more potent pharmacologic agents, do not cause down-regulation of receptor expression. One limitation of use of whole tissue is the heterogeneity of cell types in such samples. However, it is interesting to note that there appears to be a correlation between higher expression levels of beta in proportion to richness of immune related cell types in a given tissue, which is consistent with observations in humans that immune-related cells express higher amounts of GRβ [18].
Down-regulation of glucocorticoid receptor by its ligand is well documented. While GRα mRNA was clearly down-regulated in response to drug dosing, down-regulation of GRβ mRNA by ligand did not occur. In fact, the beta variant showed up-regulation at the 0.5 hr time point. However, large inter-animal variations occurred in beta expression. In any case, the expression of the beta splice variant, which does not bind hormone, remained substantially lower than that of the major alpha variant. In contrast, Hinds demonstrated that cultured mouse epithelial cells showed down-regulation of alpha expression but up-regulation of beta expression with dexamethasone treatment [8]. However, in human respiratory epithelial cells Pujols et al. have also demonstrated down-regulation of both GRα and GRβ by dexamethasone [42]. These distinctly different results could possibly be attributed to in vitro versus in vivo differences, but could also stem from differences in species, cell type, or duration of treatment and/or time at which these measurements were done.
We also examined expression of the alternative splice variants after acute sublethal injection of bacterial lipopolysacchride (LPS). GRα reached its nadir at 4 hours, while GRβ declined more rapidly and was at its nadir by 2 hours. The decreased expression of both splice variants in vivo is in contrast to the results for mouse macrophages as reported by Hinds. In their study, a macrophage cell line was cultured in the presence of TNFα, and while there was a slight increase in expression levels of GRα, there was a more pronounced increase in GRβ expression. Increased relative levels of human GRβ have also been reported in response to various cytokines [13–16]. As with glucocorticoid treatment, our differing results could possibly be attributed to in vitro versus in vivo differences, but could also stem from species differences, cell type differences, or differences in duration of treatment. In our studies, as a result of differential dynamics , GRα levels are higher relative to GRβ levels during the first 2 hours after injection (Figure 6C), which it should be noted is the time when blood cytokine concentrations are high (Supplementary Figure 3). It is interesting to observe that the GRα:GRβ ratio increased in parallel to the cytokine surge. This increased ratio can potentially increase the sensitivity of the tissue to the actions of glucocorticoids, magnifying anti-inflammatory effects to protect the tissue from damage.
We also addressed the question of regulation of GR mRNA expression by insulin in vivo. Previously, Hinds reported that treatment of mouse epithelial cell cultures with insulin resulted in no change in alpha expression but significantly higher beta expression by 4 hours [8]. Similarly, refeeding of previously fasted rats resulted in no change in alpha expression but increased beta expression by 7 hours. Acute insulin administration in our studies had no effect on expression of either splice variant. Because it was possible that the time frame of this design was too short to capture possible effects, livers taken from genetically diabetic (GK) rats were analyzed for GR mRNA expression. At 8 weeks of age, these animals had elevated plasma insulin concentrations as determined by RIA on blood harvested at sacrifice, and thus tissues were chronically exposed to increased insulin concentrations. Expression of GRα was slightly but not significantly lower in livers from GK animals, whereas GRβ expression was significantly higher. However, it is interesting that the livers of these GK rats also show chronic inflammation, and are also exposed to a chronically higher glucose milieu [11]. Therefore, changes in GR mRNA expression cannot necessarily be directly linked to increased insulin exposure.
This study demonstrates the presence of an alternative splice variant of the rat glucocorticoid receptor that, like in mouse, arises by intron inclusion. By mechanistic analogy with mouse, we have referred to this variant as GRβ. We have developed a highly quantitative qRTPCR assay that allows for simultaneous measurement of both splice variants in the same sample and have applied this assay to several tissues from normal animals, as well as liver taken from animals subjected to various physiological manipulations. Comparison across tissues demonstrates that both splice variants are expressed at different levels in different tissues. Differential dynamic regulation of the two variants occurs with increased ligand exposure, increased cytokine exposure, and possibly with increased prolonged insulin exposure. However, in all cases the expression level of the alpha variant is substantially higher than that of the beta variant, which begs the question of physiological relevance in the absence of chronic inflammatory disease. Quantitative assessment of negative regulation of GRα transcriptional effects has been limited to in vitro experiments and evidence suggests that GRβ effects may be gene specific. Furthermore, there is some evidence that GRβ may have transcriptional effects independent of GRα. Therefore, in vivo significance of differential isoform expression requires further exploration. In addition, the analyses of physiological regulation presented here are limited to liver and to adult male animals. It is possible that age and sex effects occur in mRNA isoform expression. It is also possible that splice variant expression may differ across tissues, with speculation that tissues that play a major role in immune surveillance (such as spleen or lung) may differ from those involved primarily in metabolic regulation.
Supplementary Material
Highlights.
An alternative splice variant of GR (GRβ) occurs in rat by intron inclusion.
GRα is the predominant mRNA in all tissue types, while GRβ mRNA is a minor component.
Liver GRα, but not GRβ, is circadian regulated and down-regulated by hormone.
LPS treatment of down-regulated both variants, but with different time profiles.
Livers from diabetic animals showed a modest up-regulation in GRβ expression.
Acknowledgments
This work was supported by National Institutes of Health Grant GM24211
Footnotes
Publisher's Disclaimer: This is a PDF file of an unedited manuscript that has been accepted for publication. As a service to our customers we are providing this early version of the manuscript. The manuscript will undergo copyediting, typesetting, and review of the resulting proof before it is published in its final citable form. Please note that during the production process errors may be discovered which could affect the content, and all legal disclaimers that apply to the journal pertain.
References
- 1.Bialis M, Routledge P. Adverse effects of corticosteroids. Adverse Drug Reactions & Toxicological Reviews. 1998;17:227–235. [PubMed] [Google Scholar]
- 2.Schacke H, Docke WD, Asadullah K. Mechanisms involved in the side effects of glucocorticoids. Pharmacol Ther. 2002;96:23–43. doi: 10.1016/s0163-7258(02)00297-8. [DOI] [PubMed] [Google Scholar]
- 3.Oakley RH, Cidlowski JA. Cellular processing of the glucocorticoid receptor gene and protein: New mechanisms for generating tissue-specific actions of glucocorticoids. J Biol Chem. 2011;286:3177–3184. doi: 10.1074/jbc.R110.179325. [DOI] [PMC free article] [PubMed] [Google Scholar]
- 4.Pujols L, Mullol J, Picado C. Glucocorticoid receptor in human respiratory epithelial cells. Neuroimmunomodulation. 2009;16:290–299. doi: 10.1159/000216187. [DOI] [PubMed] [Google Scholar]
- 5.Hollenberg SM, Weinberger C, Ong ES, Cerelli G, Oro A, Lebo R, Thompson EB, Rosenfeld MG, Evans RM. Primary structure and expression of a functional human glucocorticoid receptor cdna. Nature. 1985;318:635–641. doi: 10.1038/318635a0. [DOI] [PMC free article] [PubMed] [Google Scholar]
- 6.Encio IJ, Detera-Wadleigh SD. The genomic structure of the human glucocorticoid receptor. J Biol Chem. 1991;266:7182–7188. [PubMed] [Google Scholar]
- 7.Otto C, Reichardt HM, Schutz G. Absence of glucocorticoid receptor-beta in mice. J Biol Chem. 1997;272:26665–26668. doi: 10.1074/jbc.272.42.26665. [DOI] [PubMed] [Google Scholar]
- 8.Hinds TD, Ramakrishnan S, Cash HA, Stechschulte LA, Heinrich G, Najjar SM, Sanchez ER. Discovery of glucocorticoid receptor-beta in mice with a role in metabolism. Mol Endocrinol. 2010;24:1715–1727. doi: 10.1210/me.2009-0411. [DOI] [PMC free article] [PubMed] [Google Scholar]
- 9.Hazra A, Pyszczynski N, DuBois DC, Almon RR, Jusko WJ. Modeling receptor/gene-mediated effects of corticosteroids on hepatic tyrosine aminotransferase dynamics in rats: Dual regulation by endogenous and exogenous corticosteroids. J Pharmacokinet Pharmacodyn. 2007;34:643–667. doi: 10.1007/s10928-007-9063-3. [DOI] [PMC free article] [PubMed] [Google Scholar]
- 10.Almon RR, Yang E, Lai W, Androulakis IP, DuBois DC, Jusko WJ. Circadian variations in rat liver gene expression: Relationships to drug actions. J Pharmacol Exp Ther. 2008;326:700–716. doi: 10.1124/jpet.108.140186. [DOI] [PMC free article] [PubMed] [Google Scholar]
- 11.Almon RR, DuBois DC, Lai W, Xue B, Nie J, Jusko WJ. Gene expression analysis of hepatic roles in cause and development of diabetes in goto-kakizaki rats. J Endocrinol. 2009;200:331–346. doi: 10.1677/JOE-08-0404. [DOI] [PubMed] [Google Scholar]
- 12.Bustin SA, Benes V, Garson JA, Hellemans J, Huggett J, Kubista M, Mueller R, Nolan T, Pfaffl MW, Shipley GL, Vandesompele J, Wittwer CT. The MIQE guidelines: Minimum information for publication of quantitative real-time pcr experiments. Clin Chem. 2009;55:611–622. doi: 10.1373/clinchem.2008.112797. [DOI] [PubMed] [Google Scholar]
- 13.Orii F, Ashida T, Nomura M, Maemoto A, Fujiki T, Ayabe T, Imai S, Saitoh Y, Kohgo Y. Quantitative analysis for human glucocorticoid receptor alpha/beta mrna in ibd. Biochem Biophys Res Commun. 2002;296:1286–1294. doi: 10.1016/s0006-291x(02)02030-2. [DOI] [PubMed] [Google Scholar]
- 14.Strickland I, Kisich K, Hauk PJ, Vottero A, Chrousos GP, Klemm DJ, Leung DY. High constitutive glucocorticoid receptor beta in human neutrophils enables them to reduce their spontaneous rate of cell death in response to corticosteroids. J Exp Med. 2001;193:585–593. doi: 10.1084/jem.193.5.585. [DOI] [PMC free article] [PubMed] [Google Scholar]
- 15.Towers R, Naftali T, Gabay G, Carlebach M, Klein A, Novis B. High levels of glucocorticoid receptors in patients with active crohn's disease may predict steroid resistance. Clin Exp Immunol. 2005;141:357–362. doi: 10.1111/j.1365-2249.2005.02846.x. [DOI] [PMC free article] [PubMed] [Google Scholar]
- 16.Vazquez-Tello A, Semlali A, Chakir J, Martin JG, Leung DY, Eidelman DH, Hamid Q. Induction of glucocorticoid receptor-beta expression in epithelial cells of asthmatic airways by t-helper type 17 cytokines. Clin Exp Allergy. 2010;40:1312–1322. doi: 10.1111/j.1365-2222.2010.03544.x. [DOI] [PubMed] [Google Scholar]
- 17.Colli LM, Do Amaral FC, Torres N, De Castro M. Interindividual glucocorticoid sensitivity in young healthy subjects: The role of glucocorticoid receptor alpha and beta isoforms ratio. Horm Metab Res. 2007;39:425–429. doi: 10.1055/s-2007-980191. [DOI] [PubMed] [Google Scholar]
- 18.Pujols L, Mullol J, Roca-Ferrer J, Torrego A, Xaubet A, Cidlowski JA, Picado C. Expression of glucocorticoid receptor alpha- and beta-isoforms in human cells and tissues. Am J Physiol Cell Physiol. 2002;283:C1324–1331. doi: 10.1152/ajpcell.00363.2001. [DOI] [PubMed] [Google Scholar]
- 19.Bamberger CM, Bamberger AM, De Castro M, Chrousos GP. Glucocorticoid receptor beta, a potential endogenous inhibitor of glucocorticoid action in humans. J Clin Invest. 1995;95:2435–2441. doi: 10.1172/JCI117943. [DOI] [PMC free article] [PubMed] [Google Scholar]
- 20.Charmandari E, Chrousos GP, Ichijo T, Bhattacharyya N, Vottero A, Souvatzoglou E, Kino T. The human glucocorticoid receptor (hgr) beta isoform suppresses the transcriptional activity of hgralpha by interfering with formation of active coactivator complexes. Mol Endocrinol. 2005;19:52–64. doi: 10.1210/me.2004-0112. [DOI] [PubMed] [Google Scholar]
- 21.Fruchter O, Kino T, Zoumakis E, Alesci S, De Martino M, Chrousos G, Hochberg Z. The human glucocorticoid receptor (gr) isoform {beta} differentially suppresses gr{alpha}-induced transactivation stimulated by synthetic glucocorticoids. J Clin Endocrinol Metab. 2005;90:3505–3509. doi: 10.1210/jc.2004-1646. [DOI] [PubMed] [Google Scholar]
- 22.Goleva E, Li LB, Eves PT, Strand MJ, Martin RJ, Leung DY. Increased glucocorticoid receptor beta alters steroid response in glucocorticoid-insensitive asthma. Am J Respir Crit Care Med. 2006;173:607–616. doi: 10.1164/rccm.200507-1046OC. [DOI] [PMC free article] [PubMed] [Google Scholar]
- 23.Hauk PJ, Goleva E, Strickland I, Vottero A, Chrousos GP, Kisich KO, Leung DY. Increased glucocorticoid receptor beta expression converts mouse hybridoma cells to a corticosteroid-insensitive phenotype. Am J Respir Cell Mol Biol. 2002;27:361–367. doi: 10.1165/rcmb.4861. [DOI] [PubMed] [Google Scholar]
- 24.Li LB, Leung DY, Hall CF, Goleva E. Divergent expression and function of glucocorticoid receptor beta in human monocytes and t cells. J Leukoc Biol. 2006;79:818–827. doi: 10.1189/jlb.0805466. [DOI] [PubMed] [Google Scholar]
- 25.Oakley RH, Jewell CM, Yudt MR, Bofetiado DM, Cidlowski JA. The dominant negative activity of the human glucocorticoid receptor beta isoform. Specificity and mechanisms of action. J Biol Chem. 1999;274:27857–27866. doi: 10.1074/jbc.274.39.27857. [DOI] [PubMed] [Google Scholar]
- 26.Oakley RH, Sar M, Cidlowski JA. The human glucocorticoid receptor beta isoform. Expression, biochemical properties, and putative function. J Biol Chem. 1996;271:9550–9559. doi: 10.1074/jbc.271.16.9550. [DOI] [PubMed] [Google Scholar]
- 27.Taniguchi Y, Iwasaki Y, Tsugita M, Nishiyama M, Taguchi T, Okazaki M, Nakayama S, Kambayashi M, Hashimoto K, Terada Y. Glucocorticoid receptor-beta and receptor-gamma exert dominant negative effect on gene repression but not on gene induction. Endocrinology. 2010;151:3204–3213. doi: 10.1210/en.2009-1254. [DOI] [PubMed] [Google Scholar]
- 28.Brogan IJ, Murray IA, Cerillo G, Needham M, White A, Davis JR. Interaction of glucocorticoid receptor isoforms with transcription factors ap-1 and nf-kappab: Lack of effect of glucocorticoid receptor beta. Mol Cell Endocrinol. 1999;157:95–104. doi: 10.1016/s0303-7207(99)00156-2. [DOI] [PubMed] [Google Scholar]
- 29.De Lange P, Koper JW, Brinkmann AO, De Jong FH, Lamberts SW. Natural variants of the beta isoform of the human glucocorticoid receptor do not alter sensitivity to glucocorticoids. Mol Cell Endocrinol. 1999;153:163–168. doi: 10.1016/s0303-7207(99)00072-6. [DOI] [PubMed] [Google Scholar]
- 30.Gougat C, Jaffuel D, Gagliardo R, Henriquet C, Bousquet J, Demoly P, Mathieu M. Overexpression of the human glucocorticoid receptor alpha and beta isoforms inhibits ap-1 and nf-kappab activities hormone independently. J Mol Med (Berl) 2002;80:309–318. doi: 10.1007/s00109-001-0302-6. [DOI] [PubMed] [Google Scholar]
- 31.Hecht K, Carlstedt-Duke J, Stierna P, Gustafsson J, Bronnegard M, Wikstrom AC. Evidence that the beta-isoform of the human glucocorticoid receptor does not act as a physiologically significant repressor. J Biol Chem. 1997;272:26659–26664. doi: 10.1074/jbc.272.42.26659. [DOI] [PubMed] [Google Scholar]
- 32.Piotrowski P, Burzynski M, Lianeri M, Mostowska M, Wudarski M, Chwalinska-Sadowska H, Jagodzinski PP. Glucocorticoid receptor beta splice variant expression in patients with high and low activity of systemic lupus erythematosus. Folia Histochem Cytobiol. 2007;45:339–342. [PubMed] [Google Scholar]
- 33.Rai T, Monoe K, Kanno Y, Saito H, Takahashi A, Irisawa A, Ohira H. Expression of human glucocorticoid receptor beta of peripheral blood mononuclear cells in patients with severe autoimmune hepatitis. Fukushima J Med Sci. 2006;52:65–70. doi: 10.5387/fms.52.65. [DOI] [PubMed] [Google Scholar]
- 34.Sousa AR, Lane SJ, Cidlowski JA, Staynov DZ, Lee TH. Glucocorticoid resistance in asthma is associated with elevated in vivo expression of the glucocorticoid receptor beta-isoform. J Allergy Clin Immunol. 2000;105:943–950. doi: 10.1067/mai.2000.106486. [DOI] [PubMed] [Google Scholar]
- 35.Zhang H, Ouyang Q, Wen ZH, Fiocchi C, Liu WP, Chen DY, Li FY. Significance of glucocorticoid receptor expression in colonic mucosal cells of patients with ulcerative colitis. World J Gastroenterol. 2005;11:1775–1778. doi: 10.3748/wjg.v11.i12.1775. [DOI] [PMC free article] [PubMed] [Google Scholar]
- 36.Schaaf MJ, Champagne D, Van Laanen IH, Van Wijk DC, Meijer AH, Meijer OC, Spaink HP, Richardson MK. Discovery of a functional glucocorticoid receptor beta-isoform in zebrafish. Endocrinology. 2008;149:1591–1599. doi: 10.1210/en.2007-1364. [DOI] [PubMed] [Google Scholar]
- 37.Butler CA, Mcquaid S, Taggart CC, Weldon S, Carter R, Skibinski G, Warke TJ, Choy DF, Mcgarvey LP, Bradding P, Arron JR, Heaney LG. Glucocorticoid receptor beta and histone deacetylase 1 and 2 expression in the airways of severe asthma. Thorax. 2011 doi: 10.1136/thoraxjnl-2011-200760. [DOI] [PubMed] [Google Scholar]
- 38.Kim SH, Kim DH, Lavender P, Seo JH, Kim YS, Park JS, Kwak SJ, Jee YK. Repression of tnf-alpha-induced il-8 expression by the glucocorticoid receptor-beta involves inhibition of histone h4 acetylation. Exp Mol Med. 2009;41:297–306. doi: 10.3858/emm.2009.41.5.033. [DOI] [PMC free article] [PubMed] [Google Scholar]
- 39.Kelly A, Bowen H, Jee YK, Mahfiche N, Soh C, Lee T, Hawrylowicz C, Lavender P. The glucocorticoid receptor beta isoform can mediate transcriptional repression by recruiting histone deacetylases. J Allergy Clin Immunol. 2008;121:203–208. e201. doi: 10.1016/j.jaci.2007.09.010. [DOI] [PubMed] [Google Scholar]
- 40.Kino T, Manoli I, Kelkar S, Wang Y, Su YA, Chrousos GP. Glucocorticoid receptor (gr) beta has intrinsic, gralpha-independent transcriptional activity. Biochem Biophys Res Commun. 2009;381:671–675. doi: 10.1016/j.bbrc.2009.02.110. [DOI] [PMC free article] [PubMed] [Google Scholar]
- 41.Lewis-Tuffin LJ, Jewell CM, Bienstock RJ, Collins JB, Cidlowski JA. Human glucocorticoid receptor beta binds ru-486 and is transcriptionally active. Mol Cell Biol. 2007;27:2266–2282. doi: 10.1128/MCB.01439-06. [DOI] [PMC free article] [PubMed] [Google Scholar]
- 42.Pujols L, Mullol J, Perez M, Roca-Ferrer J, Juan M, Xaubet A, Cidlowski JA, Picado C. Expression of the human glucocorticoid receptor alpha and beta isoforms in human respiratory epithelial cells and their regulation by dexamethasone. Am J Respir Cell Mol Biol. 2001;24:49–57. doi: 10.1165/ajrcmb.24.1.4024. [DOI] [PubMed] [Google Scholar]
Associated Data
This section collects any data citations, data availability statements, or supplementary materials included in this article.