

Abstract
In cardiomyocyte subcellular structures, colocalization of mitochondria with Ca2+ release sites is implicated in regulation of cardiac energetics by facilitating Ca2+ influx into mitochondria to modulate the tricarboxylic acid (TCA) cycle. However, current experimental techniques limit detailed examination of this regulatory mechanism. Earlier, we developed a three-dimensional (3D) finite-element cardiomyocyte model featuring a subcellular structure that integrates excitation-contraction coupling and energy metabolism. Here, using this model, we examined the influence of distance between mitochondria and Ca2+ release sites by comparing a normal (50-nm) distance model and a large (200-nm) distance model (LD). The influence of distance was minimal under a low pacing rate (0.25 Hz), but under a higher pacing rate (2 Hz), lower levels of mitochondrial Ca2+ and NADH, elevated phosphate, and suppressed force generation became apparent in the LD model. Such differences became greater when functional impairments (reduced TCA cycle activity, uncoupling effect, and failing excitation-contraction coupling) were additionally imposed. We concluded that juxtaposition of the mitochondria and the Ca2+ release sites is crucial for rapid signal transmission to maintain cardiac-energy balance. The idealized 3D model of cardiac excitation-contraction and metabolism is a powerful tool to study cardiac energetics.
Introduction
Recent studies have identified an important role for mitochondrial Ca2+ in myocardial energy metabolism by upregulating the tricarboxylic acid (TCA) cycle to stimulate ATP production. Because the rise in cytosolic Ca2+ triggers contractions in the sarcomeres—the primary locus of energy consumption—incidental Ca2+ flux to mitochondria may constitute a feed-forward regulatory mechanism for rapid and fine tuning of energy balance. However, the high half-maximal effective concentration (EC50; ∼10 μM) of mitochondrial Ca2+ uniporters poses a question as to whether such a mechanism functions in the face of low cytosolic Ca2+ transient (peak value, 1–2 μM) (1,2).
Subcellular cardiomyocyte structures may provide a clue to the answer to this question. Electron micrographic studies of subcellular myocyte structures show that mitochondria occupy the entire space between muscle Z-lines; the ends of mitochondria are located near calcium release units (CaRUs), where L-type Ca2+ channels (LCCs) and junctional sarcoplasmic reticulum (JSR) face each other in close proximity (3–7). Upon depolarization of the sarcolemma, Ca2+ entry through LCCs induces Ca2+ release from the JSR and possibly generates a transiently high Ca2+ concentration that exceeds the EC50 in this subspace, thereby facilitating Ca2+ influx to mitochondria (6,8–13). Because of mitochondrial remodeling and dislocation (e.g., swelling, proliferation, and clustering), loss of cytoskeletal connections have been reported in failing myocardium (8,14–16). Elucidation of subcellular structure and function in both healthy and diseased myocardium is of paramount importance. However, limitations of the available experimental techniques have made it difficult to obtain sufficient information for a thorough understanding of these mechanisms.
We have already developed a three-dimensional (3D) model of cardiomyocytes based on the finite-element method (17–19). In this model, cardiac electrophysiology, contraction, and ATP metabolism localized to specific loci of each organelle, diffusion of Ca2+ and energy metabolites, and deformation by sarcomere force generation were simulated in detail with subcellular structures.
In this study, we used this model to study the structure-function relationship of mitochondria in cardiac energy metabolism, with particular focus on the significance of the distance between mitochondria and CaRUs. We found the effect of distance on energetic state to be minimal when myocytes were stimulated at low frequency, but we saw significant differences between the normal and large-distance models in mitochondrial [Ca2+], [NADH], and cytosolic phosphate [Pi] at higher stimulation rates. Simulation results of failing myocytes modeling increased proton leak and depressed TCA cycle activity will also be presented.
Materials and Methods
3D cardiomyocyte model
The details of 3D cardiomyocyte models have been reported and validated previously (18,19). Briefly, a segment containing three myofibrils of one sarcomere length, together with the adjacent cell membrane and organelle, were modeled by the finite-element method (Fig. 1 A). Subcellular components—including mitochondria, myofibril (A-zone, I-zone, and M-line), JSR, network SR (NSR), surface, and t-tubular sarcolemma—were located at the appropriate finite-element-method nodes to reproduce the anatomical structure. Each subcellular component exchanges ions and/or metabolites according to the mathematical formulations expressed as a function of the molecular concentrations in the surrounding cytosol (20,21). These molecules diffuse freely through the cytosolic space; the processes were calculated by solving reaction-diffusion equations. Further details outlining the model can be found in the Supporting Material.
Figure 1.
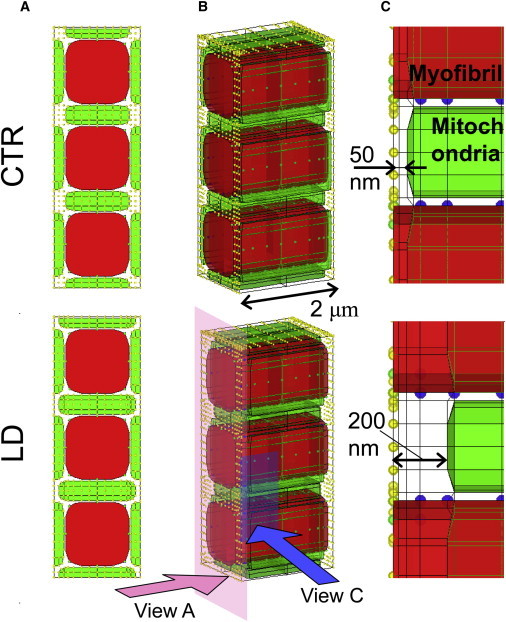
Three-dimensional cardiomyocyte models with two different distances between mitochondria and the Ca2+ release site: the 50-nm distance model (CTR) (upper) and the 200-nm distance model (LD) (lower). (A) Short-axis views. (B) 3D presentations. (C) Magnified view of the region near the Ca release sites on the right. Mitochondria are green and myofibrils red. Other subcellular components (channels, pumps, etc.) were assigned to nodes, representing sarcolemma (yellow) or SR (blue).
Acto-myosin ATPase model
To examine the influence of metabolic state on the cardiac contraction, we coupled a cross-bridge kinetics model with ATP hydrolysis by myosin (22,23). We adopted a simplified four-state model, schematically shown in Fig. 2 , in which M indicates myosin and A indicates actin. Governing equations are shown in the Appendix, with rate constants taken from the literature (24–27). In this model, [Pi] affects force generation by interfering with the transition from a weakly binding state (A⋅M⋅ADP⋅Pi) to a strongly binding (force-bearing) state (AM⋅ADP) (28); see also Appendix). Depletion of ATP shifts the distribution into the rigor (AM) state.
Figure 2.
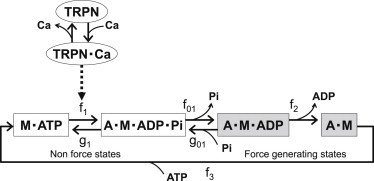
State diagrams for the actomyosin ATPase model. A, actin; M, myosin; TRPN, troponin; fx and gx, transition rate constants. White boxes correspond to non-force-bearing states. Gray boxes correspond to force-generating states. Transition from M⋅ATP to A⋅M⋅ADP⋅Pi is cooperatively facilitated by Ca2+ binding to troponin. See text for details.
The model of Ca2+ regulation of contraction was adopted from Rice et al. (29), with parameters refined for guinea pig by Cortassa et al. (20), in which binding of Ca2+ to troponin C (TnC) modulates the rate constant of the transition from [A⋅ATP] to [A⋅M⋅ADP⋅Pi] to cooperatively activate the myofilament. Model equations are shown in the Appendix.
Large-distance model
To investigate the effect of the distance between mitochondria and CaRUs, we created a model with an abnormally large distance (LD) of 200 nm and compared it with a model with a normal-sized 50-nm distance (CTR) (Fig. 1, A and B). To examine only the effect of the distance between mitochondria and CaRUs, we adjusted the thickness of mitochondria to keep their volume constant in the LD model (Fig. 1 B). Accordingly, the volumes of other subcellular structures and the total segment volume were maintained. The normal size, 50 nm, was adopted from electron microscopic observations (8) by taking into account the shrinkage introduced by the fixation procedure (30). The larger size was the maximum value we could attain without changing the volumes of mitochondria, other organelles, and the whole cell.
Failing cardiomyocyte model
Three types of functional abnormality often observed in failing myocardium, i.e., the uncoupling effect (proton leak), depressed TCA cycle activity, and failing excitation-contraction (EC) coupling, were modeled to investigate the influence of distance under diseased conditions. The uncoupling effect was modeled by increasing the proton leak factor, gH, to 4.0 × 10⁻⁵. The resultant leak flux was comparable to F0F1 ATPase proton flux under pacing at 3 Hz. TCA-cycle activity was depressed by reducing all of the catalytic constants by 40%. Failing EC coupling was modeled by decreasing sarcoplasmic Ca2+ pump (SERCA) activity (Vmax 50% of control) and increasing sarcolemmal sodium-calcium exchanger (NCX) activity to 200% of control.
Protocol
Current pulse (100 μA/cm2; duration, 0.5 ms) was applied to sarcolemma to simulate electrical pacing. Cardiomyocyte responses to abrupt changes in workload were examined by switching pacing frequency between 0.25 Hz (low load) and 2 Hz (high load) for comparisons with the experimental study (31).
Calculation
All the program codes were written in-house using Fortran language. Computation was performed using an Intel Xeon CPU (3.2 GHz).
Results
Responses of global and local concentrations of Ca2+ and metabolites and ion currents of the CTR model were similar to those reported in our previous article (18).
Effect of distance between mitochondria and Ca2+ release site
Fig. 3 (left) compares the responses of mitochondrial [Ca2+] ([Ca2+]mito), [NADH], mitochondrial [ADP] ([ADP]mito), and cytosolic [Pi] ([Pi]cyto) to abrupt changes in pacing rates between CTR (black line) and LD (gray line) models. The responses of the CTR model were similar to our previous results (18) and agree with both previous simulation (20) and experimental (31) studies. The LD model showed a similar pattern of responses under the low-workload condition (0.25 Hz), with levels of [Ca2+]mito, [NADH], [ADP]mito, and [Pi] close to those observed for the CTR model. However, increasing the workload to 2 Hz introduced significant differences in these parameters. After 200 s of 2-Hz pacing, the respective CTR and LD values were 1.63 and 1.35 μM for [Ca2+]mito (–17% relative change); 5.40 and 4.82 mM for [NADH] (–11%); 39.96 and 40.78 μM for [ADP]mito (+2.1%); and 3.16 and 3.28 mM for [Pi] (+3.6%). The developed force dropped 1.1% in LD compared to CTR; thus, ATP consumption by myofibrils decreased in the LD model (data not shown). We also compared fluxes in metabolic pathways between the two models (Fig. 3, right) and found that TCA flux (representing NADH production velocity), electron transport chain flux (NADH consumption velocity), and F0F1 ATPase flux (ATP production velocity) were all higher in CTR. Values for CTR versus LD at 200 s after the initiation of 2-Hz pacing were 61.2 and 59.5 μM/s for TCA flux (–2.85% relative change), 2.08 and 2.03 mM/s for electron transport chain flux (–2.57%), and 0.422 and 0.417 mM/s for F0F1 ATPase flux (–1.35%). We also note that whereas the responses of electron transport chain flux and F0F1 ATPase flux were prompt, the response of the TCA cycle was slow, probably reflecting the slow rise and fall in [Ca2+]mito.
Figure 3.
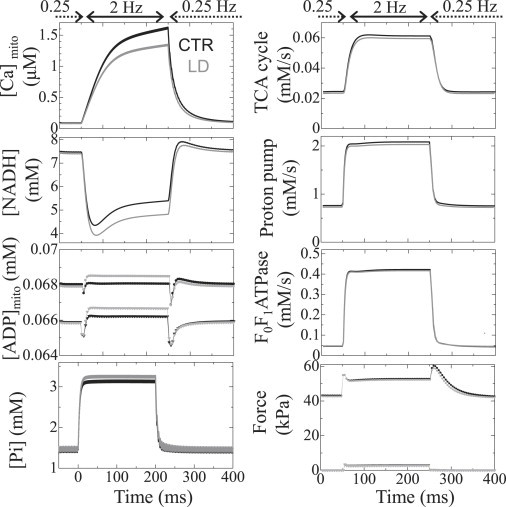
Transient responses of the CTR model (black) and the LD model (gray) to abrupt changes in pacing rate between 0.25 Hz and 2 Hz. (Left, top to bottom) Mitochondrial Ca2+, NADH, ADP, and cytosolic Pi concentrations. (Right, top to bottom) Mitochondrial metabolic fluxes for TCA, electron transport chain, and F0F1 ATPase, and generated force. In each panel, data averaged over the cytosolic or mitochondrial space are shown. In the graphs of ADP and force, only the maximum (circles) and the minimum (triangles) values are plotted for visibility.
Spatiotemporal distributions of [Ca2+]cyto and [ADP]cyto are plotted and compared between 0.25 Hz and 2 Hz in Fig. 4 . The black line indicates the position at 50 nm from the Z-line, and the gray line shows the position at 200 nm. Both [Ca2+]cyto and [ADP]cyto display higher concentrations near the Z-line, but the spatial gradient of [Ca2+]cyto is much larger compared to that of [ADP]cyto. Rapid pacing at 2 Hz made this gradient steeper, so that the difference in [Ca2+]cyto between 50 nm and 200 nm became greater. On the other hand, although the 2-Hz pacing raised the [ADP]cyto homogeneously, the difference between 50 nm and 200 nm remained small due to the shallow slope in distribution.
Figure 4.
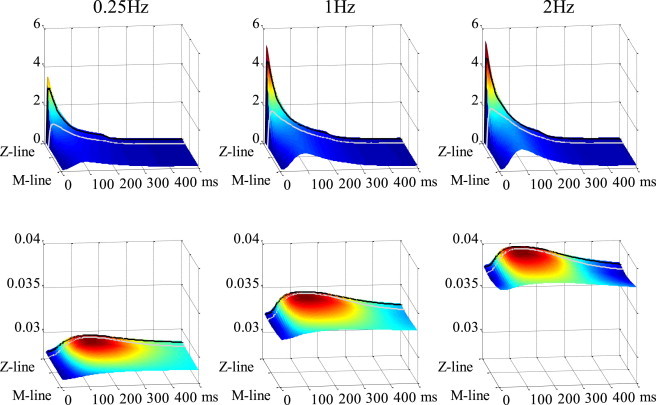
Spatiotemporal distributions of cytosolic Ca2+ (upper) and ADP (lower) are shown at pacing rates of 0.25 Hz (left), 1 Hz (middle), and 2 Hz (right). Locations at 50 nm and 200 nm from the Z-line are indicated with black and gray lines, respectively.
Failing-myocyte models
The effect of distance between mitochondria and Ca2+ release site on responses to changing workload was examined in the presence of depressed TCA activity (TCA−; Fig. 5 , left), uncoupling effect (UNC; Fig. 5, middle), and failing-EC coupling (EC; Fig. 5, right). The first two functional abnormalities (TCA− and UNC) lowered [NADH] at 0.25 Hz (Fig. 5, rows 2 and 3), but phosphorylation potential was relatively constant in both CTR and LD models (data not shown). As seen in the absence of functional abnormalities (Fig. 3), rapid pacing at 2 Hz decreased [NADH] and increased [ADP]mito and [Pi], but these changes were greater. Notably, the differences in [Pi] and force at 2 Hz between CTR and LD models also increased with both TCA− (+9.0%) and UNC (+6.7%) (Fig. 5, rows 4 and 5).
Figure 5.
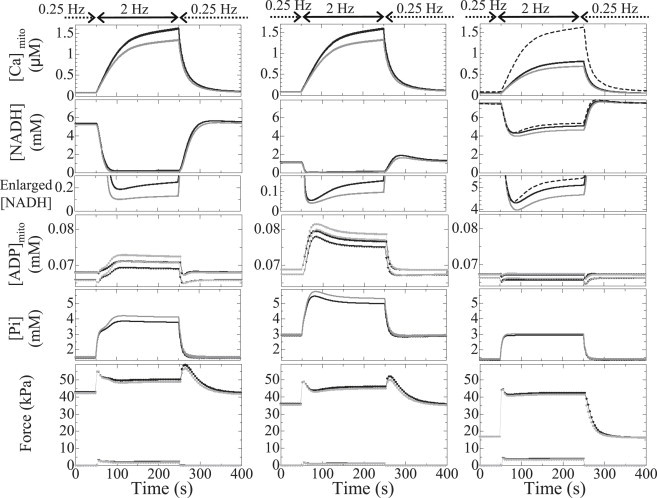
Transient responses of the CTR model (black) and the LD model (gray) under conditions of depressed TCA activity (left), uncoupling (middle), and failing EC coupling (right) with respect to (top to bottom) mitochondrial Ca2+, NADH, NADH magnification of bottom parts, mitochondrial ADP, cytosolic Pi, and generated force. Data shown are averaged over the cytosolic or mitochondrial space. In the three upper panels on the right, the responses of the CTR model without functional abnormalities are shown by dashed lines for comparison. In the graphs of ADP and force, only the maximum (circles) and minimum (triangles) values are plotted for visibility.
However, the two types of functional abnormalities gave distinct response patterns. Although [NADH] dropped acutely upon increasing the pacing rate in both TCA− and UNC models, [ADP] and [Pi] increased gradually only in TCA− models. Moreover, closer examination shows that these gradual increases consisted of a rapid first phase and a slow second phase, with differences between CTR and LD becoming apparent in the second phase. In the UNC model, rapid pacing reduced [NADH] to >0.1 mM within 20 s; [ADP] and [Pi] increased rapidly and monotonically to give even overshoots in both CTR and LD models.
On the other hand, the EC model showed unique responses. Reflecting the decreased Ca2+ uptake and release of SR, both force level and mitochondrial Ca2+ at 2 Hz were low compared to the control (Fig. 5, right (bottom and top, respectively)), but the reduced energy consumption resulting from the impaired force development made the mitochondrial ADP and Pi responses similar to those of control. The response of NADH to the increased pacing rate showed clear contrast to those of the other two models (Fig. 5, right). When the distance between mitochondria and CaRU was small, introduction of the EC condition did not change the initial fall in NADH compared to the normal-function model (dashed line), but the increase in distance significantly decreased it (–7.5%).
Discussion
In this study, we utilized the 3D integrated cardiomyocyte model we developed earlier (18,19) to examine the significance of distance between CaRUs and mitochondria in cardiac energetics. The simulation study gave us a free hand in setting the experimental conditions and allowed us to focus solely on morphological factors that contribute to cardiac energetics.
Subcellular distributions of metabolites
As in our previous studies (18,19), we identified a steep gradient in [Ca2+]cyto, ranging from 10 μM near the CaRUs to 0.1 μM in the M-line region. Such a distribution is consistent with experimental findings (32), and could facilitate mitochondrial Ca2+ uptake from the Z-line region. ATP and ADP also showed spatial distributions. Contractile myosin activity hydrolyzes ATP, letting ADP accumulate in the myofibril A-zone. As M-line-bound creatine kinase (CK) synthesizes ATP from ADP, ADP is distributed homogeneously over the myofibril I zone (Fig. 4) and stimulates mitochondrial ATP synthesis (Fig. S1 and Movie S1 in the Supporting Material); ATP and ADP distribution patterns are complementary. Spatial distributions of other metabolites—creatine, creatine phosphate, and Pi—are negligible because of their high diffusiveness.
Effect of distance between mitochondria and Ca2+ release site
The effect of distance can be shown by the differences in cytosolic concentration of signal molecules surrounding the mitochondria. Fig. 6 summarizes the regulatory mechanisms of mitochondrial respiration incorporated in this model. Because ATP is synthesized from ADP by F0F1 ATPase, which decreases membrane potential, ATP production is activated in two ways: [Ca2+]mito activates the TCA cycle to produce NADH that is used by the electron transport chain to push up the inner membrane potential (Fig. 6, red arrows) and pull up the F0F1 ATPase activity by ADP feedback (Fig. 6, blue arrow) (20). Because of the distinct distributions of [Ca2+]cyto and [ADP]cyto described above, CTR myocytes can make full use of both these pushing and pulling effects, whereas the LD myocyte cannot. Rapid pacing increases the Ca2+ content of the SR and Ca2+ release to raise [Ca2+]mito, thereby exaggerating the difference in availability of the pushing-up reactants between the CTR and LD models (Fig. 4). On the other hand, because ADP shows fairly flat distribution along the myofibril, even during rapid pacing, the effect of larger distance that emerges under rapid pacing is the pushing-up activation by Ca2+. The decreased pushing-up reactants for the LD model induces lower [NADH] and higher [Pi], resulting in lower force development.
Figure 6.
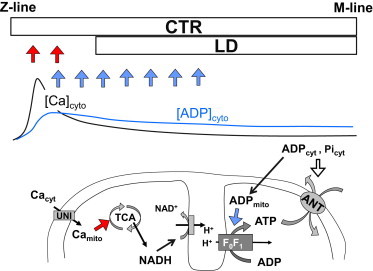
Schematic illustrating the effect of distance between mitochondria and the Ca2+ release site. (Upper) Positions of mitochondria in the CTR and LD models relative to the typical distributions of [Ca2+]cyto and [ADP]cyto. (Lower) Summary of the mechanisms regulating mitochondrial metabolism incorporated in our model. Red arrows indicate the pushing-up effect and blue arrows the pulling-up effect on mitochondrial membrane potential to facilitate F0F1 ATPase. See text for details.
Effect of distance on failing-myocyte models
In diseased myocardium, morphological abnormalities are usually accompanied by functional impairment. Increased levels of mitochondrial uncoupling proteins and decreased mitochondrial efficiency have been reported in heart failure (33). Decreased TCA cycle flux without anaplerosis might also be responsible for the contractile failure (34,35). Both depressed TCA cycle activity and uncoupling decrease the baseline (0.25 Hz) [NADH] level and expand differences in [ADP]mito, [Pi]cyto, and force between CTR and LD models under high workload. The reason for this enhanced difference is the higher gain of electron transport chain activity to [NADH] when it is <0.5 mM (Fig. 5, row 3) (36). Although the depression in force in these failing-myocyte models is still relatively small, its effect in combination with other abnormalities may cause severe disorders in cardiac function.
This response pattern may provide an insight into the mechanism. Depression of the TCA cycle significantly retarded the response to the abrupt change in workload (Fig. 5). Because the TCA cycle plays a central role in the pushing-up mechanism (Fig. 6), the loss of this feed-forward mechanism is expected to slow response, whereas the proton leak reduces the efficiency of ATP synthesis; thus, greater ADP feedback signals are required to meet the higher workload.
We also examined the responses of the failing-EC-coupling model characterized by reduced energy consumption (impaired force generation) and normal mitochondrial function. The initial fall of NADH in response to increased pacing rate was much larger than those of two other disease models but comparable to the normal model. The normally functioning respiratory chain in this model responded even to a small ADP signal to cause the initial fall in NADH (owing to its conversion to NAD+ for ATP production), but the Ca2+-sensitive pushing-up mechanism (NADH production via the TCA cycle) counteracts this initial fall, depending on the distance between mitochondria and the Ca release site.
Taken together, this simulation study indicated that the effect of the distance between mitochondria and the Ca release site significantly affects regulation of NADH dynamics in response to abrupt change in pacing rate only when both TCA cycle and respiratory chain in mitochondria function normally; the function of EC coupling proteins may not be a dominant factor.
Very recently, Chen et al. (37) studied the role of Mitofusion 2 (Mfn2) protein, which tethers the mitochondria and SR, and found a large initial drop in NADH with rapid pacing in Mfn2-deficient myocytes compared to the wild-type. Because they did not detect any significant changes in expression and function of EC coupling proteins, despite prominent alterations in mitochondrial SR architecture, they concluded that the physical tethering of SR and mitochondria via Mfn2 is essential for cardiomyocyte bioenergetics feedback response. These experimental results are consistent with those of the simulation study presented here, thus validating our 3D myocyte model.
Study limitation
In this study, due to the limitation in computational power, we had to use a small-scale model that assumed periodicity and symmetry. Therefore, we focused on the effect of distances between mitochondria and CaRUs by changing them uniformly along the t-tubule. Because the configuration of the resultant model was physiologically unrealistic, we performed a simulation on a model in which the distances were periodically different (Fig. A2 A in the Appendix). As shown in (Fig. A2 B, see figure in the Appendix), however, we could obtain an intermediate result between the control and the uniform large-distance models. A future study using a larger-scale model is necessary to examine the effect of heterogeneous distribution of distances between mitochondria and CaRUs.
Figure A2.
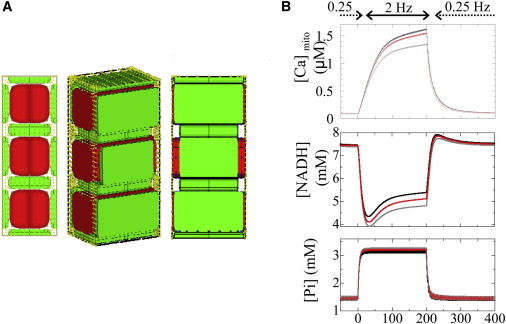
(A) Model with mixed distances between mitochondria and CaRUs. The distances were adjusted to 50, 200, and 50 nm. (B) Reponses of [Ca]mito (upper), NADH (middle), and Pi (lower) to alterations in pacing rate. Black line, control model (distance = 50 nm); gray line, large-distance model (distance = 200 nm); red line, mixed distance.
Conclusion
Our 3D model showed that the small difference in distance between CaRUs and mitochondria could alter metabolic control, reduce robustness to change in workload, and make the cell vulnerable to several pathological conditions. We suggest that juxtaposition of the mitochondria to CaRU is crucial for rapid signal transmission to maintain cardiac energy balance. The 3D integrated model of cardiac EC and metabolism provides a powerful tool for investigating cardiomyocyte physiology in ways not afforded by other experimental methods.
Acknowledgments
This research was supported by the Japan Society for the Promotion of Science (JSPS) through its Funding Program for World-Leading Innovative R&D on Science and Technology (FIRST Program).
Appendix
Equations describing the sarcomere dynamics:
| (A1) |
| (A2) |
| (A3) |
| (A4) |
| (A5) |
| (A6) |
| (A7) |
| (A8) |
| (A9) |
| (A10) |
A, actin; LTRPN, troponin low-affinity sites; M, myosin; SL, sarcomere length; VAM, ATPase rate. Parameters are shown in Table A1 .
Table A1.
Parameter values of acto-myosin ATPase model
| Parameter | Value | Unit | Description | Reference |
|---|---|---|---|---|
| f01 | 1.2 | ms−1 | Rate constant from A⋅M⋅ADP⋅Pi to A⋅M⋅ADP | (27) a |
| g01min | 0.08 | mM−1 ms−1 | Minimum rate constant from A⋅M⋅ADP to A⋅M⋅ADP⋅Pi | (27) a |
| f1max | 0.005 | ms−1 | Maximum rate constant from M⋅ATP to A⋅M⋅ADP⋅Pi | |
| g1 | 0.05 | ms−1 | Rate constant from A⋅M⋅ADP⋅Pi to M⋅ATP | |
| f2 | 0.004 | ms−1 | Rate constant from A⋅M⋅ADP to A⋅M | |
| f3max | 0.9 | ms−1 | Maximum rate constant for A⋅M to M⋅ATP | |
| Km | 0.03 | mM | ATP half-saturation constant | (25) |
| Ki | 0.1 | mM | ADP inhibition constant | (26) |
| kltrpnp | 100 | ms−1 | Ca2+ on-rate for troponin low-affinity sites | (20) |
| kltrpnm | 4.0 × 10⁻² | mM−1 ms−1 | Ca2+ off-rate for troponin low-affinity sites | (20) |
| [LTRPN]tot | 0.07 | mM | Total troponin low-affinity sites | |
| ζ | 0.1 | mM−1 kPa | Conversion factor normalizing to physiological force |
Parameters were doubled considering the temperature.
Fig. A1 , left, shows the isometric twitch force of the CTR model paced at 1 Hz under various [Pi] conditions. Peak twitch force decreases almost linearly with increasing [Pi], and at 10 mM [Pi], the peak twitch force becomes about half of that under 0.1 mM [Pi] (Fig. A2, right).
Figure A1.
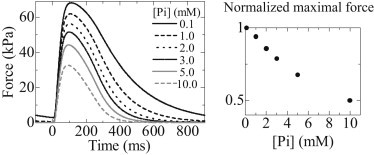
(Left) Time courses of twitch force under various [Pi] (0.1, 1.0, 2.0, 3.0, 5.0, and 10.0 mM). (Right) Normalized maximal twitch force as a function of [Pi].
Supporting Material
References
- 1.Gunter T.E., Gunter K.K., Gavin C.E. Mitochondrial calcium transport: physiological and pathological relevance. Am. J. Physiol. 1994;267:C313–C339. doi: 10.1152/ajpcell.1994.267.2.C313. [DOI] [PubMed] [Google Scholar]
- 2.Sedova M., Dedkova E.N., Blatter L.A. Integration of rapid cytosolic Ca2+ signals by mitochondria in cat ventricular myocytes. Am. J. Physiol. Cell Physiol. 2006;291:C840–C850. doi: 10.1152/ajpcell.00619.2005. [DOI] [PubMed] [Google Scholar]
- 3.Fawcett D.W., McNutt N.S. The ultrastructure of the cat myocardium. I. Ventricular papillary muscle. J. Cell Biol. 1969;42:1–45. doi: 10.1083/jcb.42.1.1. [DOI] [PMC free article] [PubMed] [Google Scholar]
- 4.Ohata H., Chacon E., Lemasters J.J. Mitochondrial Ca2+ transients in cardiac myocytes during the excitation-contraction cycle: effects of pacing and hormonal stimulation. J. Bioenerg. Biomembr. 1998;30:207–222. doi: 10.1023/a:1020588618496. [DOI] [PubMed] [Google Scholar]
- 5.Csordás G., Thomas A.P., Hajnóczky G. Calcium signal transmission between ryanodine receptors and mitochondria in cardiac muscle. Trends Cardiovasc. Med. 2001;11:269–275. doi: 10.1016/s1050-1738(01)00123-2. [DOI] [PubMed] [Google Scholar]
- 6.Lukyanenko V., Chikando A., Lederer W.J. Mitochondria in cardiomyocyte Ca2+ signaling. Int. J. Biochem. Cell Biol. 2009;41:1957–1971. doi: 10.1016/j.biocel.2009.03.011. [DOI] [PMC free article] [PubMed] [Google Scholar]
- 7.Hayashi T., Martone M.E., Hoshijima M. Three-dimensional electron microscopy reveals new details of membrane systems for Ca2+ signaling in the heart. J. Cell Sci. 2009;122:1005–1013. doi: 10.1242/jcs.028175. [DOI] [PMC free article] [PubMed] [Google Scholar]
- 8.Sharma V.K., Ramesh V., Sheu S.S. Transport of Ca2+ from sarcoplasmic reticulum to mitochondria in rat ventricular myocytes. J. Bioenerg. Biomembr. 2000;32:97–104. doi: 10.1023/a:1005520714221. [DOI] [PubMed] [Google Scholar]
- 9.Bers D.M. Cardiac excitation-contraction coupling. Nature. 2002;415:198–205. doi: 10.1038/415198a. [DOI] [PubMed] [Google Scholar]
- 10.Shannon T.R., Wang F., Bers D.M. A mathematical treatment of integrated Ca dynamics within the ventricular myocyte. Biophys. J. 2004;87:3351–3371. doi: 10.1529/biophysj.104.047449. [DOI] [PMC free article] [PubMed] [Google Scholar]
- 11.Maack C., Cortassa S., O’Rourke B. Elevated cytosolic Na+ decreases mitochondrial Ca2+ uptake during excitation-contraction coupling and impairs energetic adaptation in cardiac myocytes. Circ. Res. 2006;99:172–182. doi: 10.1161/01.RES.0000232546.92777.05. [DOI] [PMC free article] [PubMed] [Google Scholar]
- 12.Belmonte S., Morad M. “Pressure-flow”-triggered intracellular Ca2+ transients in rat cardiac myocytes: possible mechanisms and role of mitochondria. J. Physiol. 2008;586:1379–1397. doi: 10.1113/jphysiol.2007.149294. [DOI] [PMC free article] [PubMed] [Google Scholar]
- 13.O’Rourke B., Blatter L.A. Mitochondrial Ca2+ uptake: tortoise or hare? J. Mol. Cell. Cardiol. 2009;46:767–774. doi: 10.1016/j.yjmcc.2008.12.011. [DOI] [PMC free article] [PubMed] [Google Scholar]
- 14.Milner D.J., Mavroidis M., Capetanaki Y. Desmin cytoskeleton linked to muscle mitochondrial distribution and respiratory function. J. Cell Biol. 2000;150:1283–1298. doi: 10.1083/jcb.150.6.1283. [DOI] [PMC free article] [PubMed] [Google Scholar]
- 15.Capetanaki Y. Desmin cytoskeleton: a potential regulator of muscle mitochondrial behavior and function. Trends Cardiovasc. Med. 2002;12:339–348. doi: 10.1016/s1050-1738(02)00184-6. [DOI] [PubMed] [Google Scholar]
- 16.Maloyan A., Sanbe A., Robbins J. Mitochondrial dysfunction and apoptosis underlie the pathogenic process in α-B-crystallin desmin-related cardiomyopathy. Circulation. 2005;112:3451–3461. doi: 10.1161/CIRCULATIONAHA.105.572552. [DOI] [PMC free article] [PubMed] [Google Scholar]
- 17.Hatano A., Okada J., Sugiura S. Juxtaposition of mitochondria to the Ca2+ release site is crucial for the cardiac energy balance: a 3-D simulation study of cardiomyocyte. Trans. Jap. Soc. Med. Biolog. Eng. 2011;49:829–835. [Google Scholar]
- 18.Hatano A., Okada J., Sugiura S. A three-dimensional simulation model of cardiomyocyte integrating excitation-contraction coupling and metabolism. Biophys. J. 2011;101:2601–2610. doi: 10.1016/j.bpj.2011.10.020. [DOI] [PMC free article] [PubMed] [Google Scholar]
- 19.Hatano A., Okada J., Sugiura S. Critical role of cardiac t-tubule system for the maintenance of contractile function revealed by a 3D integrated model of cardiomyocytes. J. Biomech. 2012;45:815–823. doi: 10.1016/j.jbiomech.2011.11.022. [DOI] [PubMed] [Google Scholar]
- 20.Cortassa S., Aon M.A., Winslow R.L. A computational model integrating electrophysiology, contraction, and mitochondrial bioenergetics in the ventricular myocyte. Biophys. J. 2006;91:1564–1589. doi: 10.1529/biophysj.105.076174. [DOI] [PMC free article] [PubMed] [Google Scholar]
- 21.Dash R.K., Beard D.A. Analysis of cardiac mitochondrial Na+-Ca2+ exchanger kinetics with a biophysical model of mitochondrial Ca2+ handling suggests a 3:1 stoichiometry. J. Physiol. 2008;586:3267–3285. doi: 10.1113/jphysiol.2008.151977. [DOI] [PMC free article] [PubMed] [Google Scholar]
- 22.Hibberd M.G., Dantzig J.A., Goldman Y.E. Phosphate release and force generation in skeletal muscle fibers. Science. 1985;228:1317–1319. doi: 10.1126/science.3159090. [DOI] [PubMed] [Google Scholar]
- 23.Goldman Y.E., Brenner B. Special topic: molecular mechanism of muscle contraction. General introduction. Annu. Rev. Physiol. 1987;49:629–636. doi: 10.1146/annurev.ph.49.030187.003213. [DOI] [PubMed] [Google Scholar]
- 24.Kawai M., Saeki Y., Zhao Y. Crossbridge scheme and the kinetic constants of elementary steps deduced from chemically skinned papillary and trabeculae muscles of the ferret. Circ. Res. 1993;73:33–50. doi: 10.1161/01.res.73.1.35. [DOI] [PubMed] [Google Scholar]
- 25.Sugiura S., Yamashita H., Sugimoto T. Active movement of cardiac myosin on Characeae actin cables. Pflugers Arch. 1992;421:32–36. doi: 10.1007/BF00374730. [DOI] [PubMed] [Google Scholar]
- 26.Yamashita H., Sata M., Iizuka M. ADP inhibits the sliding velocity of fluorescent actin filaments on cardiac and skeletal myosins. Circ. Res. 1994;74:1027–1033. doi: 10.1161/01.res.74.6.1027. [DOI] [PubMed] [Google Scholar]
- 27.Araujo A., Walker J.W. Phosphate release and force generation in cardiac myocytes investigated with caged phosphate and caged calcium. Biophys. J. 1996;70:2316–2326. doi: 10.1016/S0006-3495(96)79797-7. [DOI] [PMC free article] [PubMed] [Google Scholar]
- 28.Kusuoka H., Inoue M., Watari H. Cyclical changes in energy-related metabolites in myocardium detected by phosphorus nuclear magnetic resonance. In: Kitamura A.H., Abe H., Sagawa K., editors. New Approaches in Cardiac Mechanics. Routledge; Tokyo: 1986. pp. 99–109. [Google Scholar]
- 29.Rice J.J., Winslow R.L., Hunter W.C. Comparison of putative cooperative mechanisms in cardiac muscle: length dependence and dynamic responses. Am. J. Physiol. 1999;276:H1734–H1754. doi: 10.1152/ajpheart.1999.276.5.H1734. [DOI] [PubMed] [Google Scholar]
- 30.Parfenov A.S., Salnikov V., Lukyánenko V. Aqueous diffusion pathways as a part of the ventricular cell ultrastructure. Biophys. J. 2006;90:1107–1119. doi: 10.1529/biophysj.105.071787. [DOI] [PMC free article] [PubMed] [Google Scholar]
- 31.Brandes R., Bers D.M. Simultaneous measurements of mitochondrial NADH and Ca2+ during increased work in intact rat heart trabeculae. Biophys. J. 2002;83:587–604. doi: 10.1016/S0006-3495(02)75194-1. [DOI] [PMC free article] [PubMed] [Google Scholar]
- 32.Weber C.R., Piacentino V., 3rd, Bers D.M. Na+-Ca2+ exchange current and submembrane [Ca2+] during the cardiac action potential. Circ. Res. 2002;90:182–189. doi: 10.1161/hh0202.103940. [DOI] [PubMed] [Google Scholar]
- 33.Abel E.D., Doenst T. Mitochondrial adaptations to physiological vs. pathological cardiac hypertrophy. Cardiovasc. Res. 2011;90:234–242. doi: 10.1093/cvr/cvr015. [DOI] [PMC free article] [PubMed] [Google Scholar]
- 34.Russell R.R., 3rd, Taegtmeyer H. Changes in citric acid cycle flux and anaplerosis antedate the functional decline in isolated rat hearts utilizing acetoacetate. J. Clin. Invest. 1991;87:384–390. doi: 10.1172/JCI115008. [DOI] [PMC free article] [PubMed] [Google Scholar]
- 35.Gibala M.J., Young M.E., Taegtmeyer H. Anaplerosis of the citric acid cycle: role in energy metabolism of heart and skeletal muscle. Acta Physiol. Scand. 2000;168:657–665. doi: 10.1046/j.1365-201x.2000.00717.x. [DOI] [PubMed] [Google Scholar]
- 36.Magnus G., Keizer J. Minimal model of β-cell mitochondrial Ca2+ handling. Am. J. Physiol. 1997;273:C717–C733. doi: 10.1152/ajpcell.1997.273.2.C717. [DOI] [PubMed] [Google Scholar]
- 37.Chen Y., Csordás G., Maack C. Mitofusin 2-containing mitochondrial-reticular microdomains direct rapid cardiomyocyte bioenergetic responses via interorganelle Ca2+ crosstalk. Circ. Res. 2012;111:863–875. doi: 10.1161/CIRCRESAHA.112.266585. [DOI] [PMC free article] [PubMed] [Google Scholar]
Associated Data
This section collects any data citations, data availability statements, or supplementary materials included in this article.