

Abstract
Many signaling circuits face a fundamental tradeoff between accelerating their response speed while maintaining final levels below a cytotoxic threshold. Here, we describe a transcriptional circuitry that dynamically converts signaling inputs into faster rates without amplifying final equilibrium levels. Using time-lapse microscopy, we find that transcriptional activators accelerate human cytomegalovirus (CMV) gene expression in single cells without amplifying steady-state expression levels, and this acceleration generates a significant replication advantage. We map the accelerator to a highly self-cooperative transcriptional negative-feedback loop (Hill coefficient ~ 7) generated by homo-multimerization of the virus’s essential transactivator protein IE2 at nuclear PML bodies. Eliminating the IE2-accelerator circuit reduces transcriptional strength through mislocalization of incoming viral genomes away from PML bodies and carries a heavy fitness cost. In general, accelerators may provide a mechanism for signal-transduction circuits to respond quickly to external signals without increasing steady-state levels of potentially cytotoxic molecules.
Keywords: gene expression, mathematical model, negative feedback, single-cell imaging, cytomegalovirus, IE2-86, Hill coefficient
INTRODUCTION
Biological signaling circuits, like electrical circuits, face a fundamental tradeoff between speed and amplitude (Alon, 2007; Savageau, 1976). That is, a faster rate of initial increase is typically obtained at the cost of a higher steady-state level. This tradeoff creates an evolutionary pressure when quick turn-on of a signaling molecule is essential but the signaling molecule is cytotoxic at high levels, as with inflammatory cytokines (Cauwels and Brouckaert, 2007), many viral systems (Dwarakanath et al., 2001), and even the fever response (Roth et al., 2006). For example, herpesviruses must quickly express viral genes that modulate the host-cell environment into a replication-favorable state, but these genes often yield cytotoxic products when expressed at high levels and can prematurely damage the cell before an optimal number of viral progeny are produced. Here, we investigate mechanisms that may optimize this “rate-versus-level” tradeoff to generate a functional advantage.
We utilize the human herpesvirus cytomegalovirus (CMV), since many of the viral processes that alter the host-cell environment have been well characterized (Mocarski et al., 2006). CMV infects a majority of the world’s population and is a leading cause of birth defects and is a leading cause of morbidity and mortality in the immunocompromised population. The virus initiates an infectious program within the cell by expressing its 86-kDa viral transactivator protein Immediate-Early 2 (IE2), which is a promiscuous transactivator of viral promoters and is essential for viral replication (Stinski and Petrik, 2008), but also highly cytotoxic (Dwarakanath et al., 2001; Sanders et al., 2008). CMV must quickly express IE2 to establish a replication-favorable environment but also limit IE2 levels to avoid prematurely compromising the cell’s ability to produce viral progeny. IE2, along with IE1, is encoded by a precursor mRNA expressed from the CMV Major Immediate-Early (MIE) promoter, which directs all subsequent viral gene expression and is considered to be the chief regulator of the lytic cycle (Stinski and Petrik, 2008). The MIE promoter (MIEP) is exceptionally strong and encodes multiple transcription factor–binding sites within its ~500-nucleotide enhancer (Stinski and Isomura, 2008). The MIEP is also auto-repressed by IE2 via direct DNA binding to a 12-nucleotide cis repression sequence (crs) located between positions −13 and +1 relative to the transcriptional start site (Macias and Stinski, 1993). The impact of IE2 autoregulation upon the virus life cycle is largely unknown.
Using an integrated approach that couples mathematical modeling with quantitative time-lapse microscopy, we show that IE2 negative feedback is highly cooperative, which allows the virus to overcome the rate-versus-level tradeoff (Fig. 1A) by accelerating IE2 gene expression without any measureable increase in the steady-state expression level. To simplify comparison of level and rate, we introduce the “response vector”, which maps time-lapse trajectories into points on a two-dimensional plane in terms of time to reach steady state and level of expression. Circuits that respond upward (or upward and to the right) in response-vector space are amplifiers, while circuits that respond in a horizontal leftward direction, like the IE2 circuit, are accelerators (Fig. 1B). Strikingly, the IE2 circuit appears to be a “pure” accelerator circuit that exhibits an almost perfectly horizontal response vector. This finding may lead to other examples where tuning the expression rate, rather than the expression level, enhances fitness.
Figure 1. CMV encodes an endogenous accelerator of gene expression and acceleration provides a viral replication advantage.

A, Schematic of the CMV genome (~230 kb), with the MIE regulatory circuit (~5 kb) magnified. Increased inputs (transcriptional activation) to the MIE promoter could result in either increased output of protein levels (amplifier) or acceleration of gene expression without amplification of level (accelerator). B, The “response-vector” allows convenient comparison between output time-lapse trajectories (i.e. white versus red points) in terms of steady-state level versus the time to steady state. Circuits that act as amplifiers respond to increased input by shifting vertically or diagonally to the upper right, while circuits that act as ‘accelerators’ respond by shifting horizontally left. C, Quantitative Western-blot analysis of IE2 expression levels during CMV infection from 3 hours post-infection (h.p.i.), showing acceleration in presence of VPA (pink) but no amplification in IE2 levels compared to the untreated control (white). D, Response-vector map of Western blot data. VPA pre-treatment (pink) decreases time to steady-state without increasing steady-state IE2-YFP levels when compared to the untreated control (open circles). Error bars (gray) = ± one standard error. E, Single-cell time-lapse microscopy of IE2-YFP levels for an untreated infection (open circles) and infection in the presence of increasing exposure to the histone-deacetylase inhibitor VPA (72-hour VPA pre-treatment in red, 24-hour VPA pre-treatment in pink). Each trajectory is an average of 20 cells with ± one standard error in lighter background color. F, Response-vector map of single-cell microscopy data, showing that increasing VPA pre-treatment (pink, red) decreases time to steady-state without increasing steady-state IE2-YFP levels when compared to the untreated control (open circles). Error bars (gray) = ± one standard error. G, Acceleration produces a significant fitness advantage for the virus as measured by CMV wild-type viral titers after a single round of infection (measured by plaque forming units, PFU/ml) on the peak day of viral production (day 4) after infection at MOI = 1. Average viral titers are shown in the absence of VPA (white) and for increasing VPA exposure (red, pink); Error bars = ± one standard deviation. See also Figure S1 and Movies S1–S3.
RESULTS
Transcriptional Acceleration-Without-Amplification in CMV
We examined MIE gene–expression levels after increasing MIEP activity using transcriptional activators known to upregulate MIEP activity (Choi et al., 2005; Fan et al., 2005; Hummel and Abecassis, 2002). These transcriptional activators, Valproic Acid (VPA), Trichostatin A (TSA), or Tumor Necrosis Factor Alpha (TNF-α), appear to accelerate IE2 expression but do not amplify IE2 protein levels, as measured by quantitative Western blot (Fig. 1C–D, see also Fig. S1). To test whether IE2 was being accelerated (but not amplified) within single cells, quantitative live time-lapse microscopy was used to track single cells undergoing infection by a recombinant CMV encoding yellow fluorescent protein (YFP) fused to the IE2 open reading frame (Movie S1). This recombinant CMV IE2-YFP virus replicates with wild-type kinetics and IE2-YFP levels are equivalent to wild-type IE2 levels (Fig. S1). In agreement with previously reported IE2 fusion viruses, the IE2-YFP fusion protein correctly localizes to ND10 domains during infection (Sourvinos et al., 2007). Strikingly, increasing the activity of the MIEP by VPA pretreatment significantly accelerates IE2 expression in single cells but does not amplify steady-state IE2 levels in these single cells (Fig. 1E–F)—a result also observed under TSA or TNF-α treatment (Fig. S1). Flow cytometry analysis (Fig. S1), confirms that acceleration without amplification is not an artifact of image processing.
To rule out the possibility that these results were caused by changes in cell physiology induced by pre-treatment with VPA (or TSA or TNF-α), we also generated an IE2-YFP virus that carried increased levels of the viral transactivator pp71 (Bresnahan and Shenk, 2000) and confirmed that this pp71+ virus, with high levels of packaged pp71 tegument factor, accelerates IE2 expression in the absence of pretreatment (Fig. S1). As an additional control, a generalized transcriptional activator that does not specifically activate the MIE promoter during active infection was used, and it fails to accelerate IE2 expression in single cells (Fig. S1). These controls argue that accelerated rates of MIE expression result specifically from increased activation of the MIE promoter and not from generalized activation of the target cell. Thus, the MIE circuit appears to act as an ‘accelerator’ that allows only the rate of IE2 expression to change without allowing significant change in the steady-state levels of IE2.
Acceleration Provides a Fitness Advantage for the Virus
Previous studies in RNA viruses have noted that small increases in a single round of replication are sufficient to allow a viral strain to competitively exclude other ‘less fit’ strains in resource-limited environments; in other words, the strain with the highest basic reproductive number (R0), which is measured during a single round of infection, wins and excludes all other competing strains, even if that strain’s R0 is only marginally greater than the closest competitor (Nowak and May, 2000).
To test if acceleration of IE2 expression provides any functional advantage for the virus, we analyzed viral replication kinetics after the first round of viral maturation (~96 hours) from cells infected with CMV IE2-YFP virus (Fig. 1G). The results show that incremental increases in transcriptional activation, and the resulting acceleration in MIE kinetics, generate correlated increases in viral replication fitness with a 72-hour VPA pre-treatment, yielding an approximately five-fold increase in viral replication compared to the untreated control. IE2 acceleration and enhanced replication are also observed in the low-passage clinical CMV isolate TB40-E, which exhibits a nine-fold increase in titer (Fig. S1).
Acceleration-Without-Amplification Requires Highly Self-Cooperative Negative Feedback, and IE2 Exhibits a Hill Coefficient (H) of H ≈ 7
Next, we set out to identify the mechanisms driving acceleration in the CMV MIE circuit. Based on previous studies showing that negative feedback speeds a circuit’s “response time”, i.e., the time required for a circuit to approach to its respective steady-state level (Black, 1999; Gardner et al., 2000; Kobayashi et al., 2004; Rosenfeld et al., 2002; Savageau, 1976), we hypothesized that acceleration-without-amplification would likely utilize negative feedback. By employing a rate-balance analysis, we find that negative feedback encoding a high ‘Hill’ coefficient (H) is theoretically sufficient to generate acceleration without amplification (Fig. 2A), while alternate simple models cannot generate acceleration without amplification (Supplementary Information, Fig. S2), in agreement with previous studies (Black, 1999; Rosenfeld et al., 2002; Savageau, 1976). Based on this analysis, we constructed a nonlinear ordinary differential equation (ODE) model of the CMV MIE circuit (Supplementary Information, Fig. S7, Table S1) and performed nonlinear least-squares regression of the model using the single-cell microscopy data to estimate the H value of the IE2 negative feedback. H ≈ 7 generates the best fit to the single-cell time-lapse microscopy data (Fig. 2B), and sensitivity analysis demonstrates that H < 6 and H > 8 cannot generate good fits to the data even when all other parameters are allowed to vary across all physiological parameter space (Fig. S2). These simulation results demonstrate that a negative-feedback model with a high H is sufficient to generate acceleration without amplification and predict that the IE2 circuit requires negative feedback with H ≫ 1 in order to function as an accelerator.
Figure 2. Highly self-cooperative negative feedback is needed to generate an accelerator circuit and IE2 encodes negative feedback with a high Hill coefficient (H ≈ 7).

A, Schematic and rate-balance analysis of a simplified negative-feedback model: for different values of the Hill coefficient (H). The dashed gray line represents the decay rate while solid lines (black and pink) represent synthesis rates for increasing values of β (1.0 and 1.5, respectively), which accounts for induction by a transcriptional activator that increases basal promoter activity by 1.5-fold. The points at which solid and dashed lines meet represents the steady-state and the distance separating the solid and dashed lines represents the rate of expression. Rate-balance analysis is shown for four values of H. High values of H allow expression rate to increase without amplification in the steady-state level. Insets: response vectors showing the change in steady-state level and the change in time to steady-state for each H value. B, Nonlinear least-squares regression of single-cell time-lapse microscopy data from Fig. 1E to a mathematical model of the CMV MIE circuit (Supplementary Information) showing best-fit curve of H = 7.3 (right panel). Gray data points are untreated trajectories from Fig 1D while pink data points are VPA+ trajectories from Fig 1D. Poor data fits are generated when H is fixed at H = 1 or H = 0 (no feedback) despite letting all other free parameters in the model vary (middle and left panels, respectively); sensitivity analysis shows that setting H < 6 or H > 8 generates poor fits to the data (Fig. S2). C, Closed-loop dose-response analysis to measure H for the IE2 circuit. Left panel: steady-state solutions for the minimal negative-feedback ODE model (from panel A) as a function of increasing basal promoter strength β for different H values. Right panel: live-cell flow cytometry measurements of a non-feedback CMV MIEP-mCherry-IRES-GFP control circuit (black) and a minimal negative-feedback CMV MIEP-IE2-IRES-GFP circuit (red) induced to different levels of activation by TSA treatment. CMV MIEP-mCherry-IRES-GFP shows a linear increase in final level while CMV MIEP-IE2-IRES-GFP shows saturation in steady-state level consistent with H ≈ 7. See also Figure S2, Table S1, and Movie S4.
H is traditionally measured by dose-response approaches, which are ‘open-loop’ (i.e., whereby feedback is removed from the system). However, for transactivators that are cytotoxic at high doses, such as IE2, the dose-response method destroys the cell before the response can be measured (data not shown). To circumvent this cytotoxicity problem, we developed a ‘closed-loop’ single-cell analysis method to analyze how a circuit’s output (steady-state protein levels) saturates as a function of increasing promoter activation and varying H values (Fig. 2C). This method essentially measures the change in steady-state levels as a function of increasing promoter strength.
To measure H via this closed-loop method, flow-cytometry measurements of steady-state GFP levels were collected for a minimal negative-feedback circuit encoding the full-length MIEP driving IE2 and GFP (MIEP-IE2-IRES-GFP), and compared to a minimal non-feedback circuit encoding the full-length MIEP driving GFP (MIEP-mCherry-IRES-GFP), which acts as the non-feedback control circuit. By increasing the MIEP activity using transcriptional activators (e.g. TSA or VPA) the response of each circuit can be measured (Fig. 2C) and these responses can then be compared to theoretically predicted responses for varying H levels (Fig. 2C). As expected for the non-feedback circuit, a linear increase in activator resulted in a linear increase in GFP steady-state levels (black). However, for the MIEP-IE2-IRES-GFP negative-feedback circuit (red), the equivalent linear increase in activator input results in a significant saturation in GFP steady state. This saturation in the GFP steady-state values is consistent with the regression analysis indicating H ≈ 7 for IE2 negative feedback. These results indicate that IE2 negative feedback acts early during CMV infection (i.e., during the first 12 hours), which has not previously been reported. Taken together, the results demonstrate that the IE2 circuit encodes a highly self-cooperative negative feedback with an H value sufficient to generate an accelerator that effectively abolishes IE2 amplification under different inputs.
Highly Self-Cooperative IE2 Feedback Results from IE2 Homo-Multimerization
We suspected that the high H value might be due to IE2 homo-multimerization, based on (i) in vitro biochemical studies reporting that IE2 peptide fragments can homo-multimerize when binding to DNA (Chiou et al., 1993; Waheed et al., 1998), and (ii) well-characterized mechanisms in other negative-regulation circuits encoding H > 1 (Chen et al., 1994; Hooshangi et al., 2005). To assay for IE2 homo-multimerization in real time during CMV infection, we utilized polarization anisotropy Förster Resonance Energy Transfer (FRET) imaging, which can differentiate between monomers and higher-order homo-multimers (Gautier et al., 2001). During the first 16 hours of infection, IE2-YFP exhibits a strong homo-FRET anisotropy (r) signal corresponding to high-order IE2 homo-multimerization (Fig. 3A).
Figure 3. IE2 forms a high-order homo-multimer that can account for a high H value.

A, Direct measurement of IE2 homo-multimerization by two-photon steady-state homo-FRET in live cells during CMV infection. CMV IE2-YFP infected cells were imaged to determine fluorescence polarization anisotropy (r) at 15 hours post-infection and compared to cells infected with a control CMV GFP virus. An r ≈ 0.5 represents no FRET exchange and is the two-photon theoretical maximum anisotropy for a GFP or YFP monomer. IE2-YFP exhibits significant homo-FRET exchange in the nucleus and especially at sub-nuclear foci, indicating the presence of a high-order IE2 homo-multimer. B, Calculation of number of IE2 monomers present in the IE2 multimer based on measured anisotropy values. Plotted surface is the solution to the theoretical formula which accounts for the number of IE2-YFP monomers (N) in a complex participating in FRET exchange that could account for a given value of r based on the distance between each monomer (R). The formula estimates a lower limit for YFP monomers in a homo-multimer that could generate a given r. Under the maximally-conservative assumption that all YFP monomers are as tightly packed as physically possible (R = 24 Å), the minimum number of IE2-YFP monomers participating in homo-FRET exchange that could generate an anisotropy value of r = 0.1 is approximately 6. See also Figure S3.
We next used an established theoretical model (Runnels and Scarlata, 1995) to estimate the number of individual IE2 monomers that might be interacting within an IE2 homo-multimer to generate the measured polarization anisotropy signal. While the model cannot precisely calculate the number of monomers making up the homo-multimer—since the distance between individual IE2 monomers is not known—a lower limit on the number of IE2 monomers within the homo-multimer can be estimated with confidence, under the most conservative assumption that the distance between each IE2-YFP monomer is the diameter of the YFP molecule (24 Å). Under this maximally conservative assumption, the measured anisotropy shift (r ≥ 0.5 → r ≈ 0.1) is consistent with an IE2 homo-multimer composed of at least five to six IE2 monomers (Fig. 3B). Importantly, the IE2-YFP monomers are likely separated by > 24 Å, and the results of Fig. 3B show that the measured anisotropy shift is well within the theoretical range of IE2 forming a homo-heptamer or higher order homo-multimer at the ND10 foci. Measurements of IE2 diffusion kinetics, from fluorescence recovery after photobleaching (FRAP), support the assertion that IE2 aggregates at ND10 domains in infected cells (Fig. S3). Despite these direct measurements of IE2 homo-multimerization in live cells during active infection, structural studies would definitively establish the presence of a high-order IE2 homo-multimer bound to DNA.
In summary, results from three independent measurements, namely (i) regression fitting of a minimal ODE model to single-cell CMV IE2-YFP trajectories, (ii) the ‘closed-loop’ analysis of the isolated IE2 feedback circuit, and (iii) homo-FRET imaging of IE2-YFP, all point toward the IE2 negative-feedback circuit as operating with a high Hill coefficient (H ≈ 7). These data argue that IE2 homo-multimerization is a core factor in establishing the high Hill coefficient of this transcriptional negative-feedback circuit, and that homo-multimerization underlies the circuit’s ability to act as an accelerator.
A Minimal-Accelerator Circuit Provides a Fitness Advantage Outside the Infection Setting
To verify that highly self-cooperative negative feedback is sufficient to generate an accelerator, we reconstructed a minimal IE2 feedback circuit lacking all other viral elements and analyzed it completely outside the virus infection setting. The minimal IE2 feedback circuit was constructed using a lentiviral vector expressing only IE2 and GFP from either the full-length wild-type MIEP or a mutant version of the MIEP where three nucleotides in the crs binding site are mutated to eliminate IE2 binding (Macias and Stinski, 1993) (Fig. 4A). Both wild-type and mutant Δcrs lentiviral circuits were stably integrated into the cellular genome. The minimal wild-type circuit stably expresses IE2 (Fig. S4), and two-color imaging confirms that the MIEP exhibits comparable kinetics both within the context of the virus and stably integrated in host-genome DNA (Fig. S4). As predicted from the model, the minimal mutant circuit exhibits substantially increased mean GFP fluorescence intensity (Figs. 4B and S4). The minimal mutant circuit fails to generate acceleration, instead acting as an amplifier (Fig. 4C), while the wild-type feedback circuit generates acceleration (Fig. S4), even in the absence of all other viral elements. Cells carrying the wild-type accelerator circuit also exhibit a profound viability advantage over cells carrying mutant amplifier circuit (Fig. 4D). Dramatically, cell populations carrying the minimal wild-type accelerator circuit maintain IE2 and GFP expression while cell populations carrying the minimal mutant circuit exhibit a rapid loss of IE2 and GFP expression that increases over time (Fig. 4E, Fig. S4). Genomic PCR (Fig. 4F) confirms that loss of IE2 and GFP expression is due to a loss of cells carrying the stably integrated mutant circuit, not from silencing of the integrated MIEP. These data argue that cells carrying the mutant circuit express higher IE2 levels and undergo increased cell death, leading to these cells being outcompeted from the population. Thus, a minimal IE2 accelerator circuit provides cells with a dramatic fitness advantage over a comparable IE2 amplifier circuit, even in the absence of all other viral factors.
Figure 4. A minimal IE2 accelerator circuit provides a fitness advantage outside the context of viral infection.

A, Schematics of the minimal wild-type accelerator circuit MIEP-IE2-IRES-GFP (left) and minimal mutant amplifier circuit MIEPΔcrs-IE2-IRES-GFP (right). Both circuits are lentiviral vectors and encode an IRES element between IE2 and GFP. B, Flow cytometry density plot of cells stably expressing the wild-type accelerator (left) or the mutant amplifier (right) circuit that exhibits ~8-fold higher mean GFP. C, Fold increase in GFP for the wild-type accelerator and mutant amplifier circuits in the absence (white, black) or presence (red) of TSA. D, Percentage of live cells (by flow cytometry) after 14 days of TSA treatment. TSA treatment has little effect on viability of cells expressing the wild-type accelerator circuit (white) but leads to significantly decreased viability in cells expressing the mutant amplifier cells (black). E, Flow cytometry time-course of the % of GFP expressing cells for the accelerator (white) and amplifier (black) circuits. GFP expression is lost from the cells transduced with the mutant amplifier circuit but is maintained in cells transduced with wild-type accelerator circuit (averages of 3 replicates shown in bold with ± one standard deviation). F, PCR amplification of the MIEP locus from: cellular genomic DNA of cells transduced with either wild-type accelerator circuit or mutant amplifier circuit on day 14 (lanes 1–2); plasmid DNA of wild-type accelerator or mutant amplifier lentiviral vector (lanes 3–4, positive PCR controls); naïve non-transduced cells, negative control (lane 5). At day 14, the mutant amplifier circuit has been lost from the genomic DNA of the transduced population but the wild-type accelerator circuit remains present in the genomic DNA of the transduced population. See also Figure S4.
Converting the Accelerator to an Amplifier Generates a Severe Fitness Cost for the Virus
To determine if negative feedback is necessary for the MIE circuit to act as an accelerator in the context of the virus, we constructed a Δcrs virus by BAC mutagenesis of the three nucleotides in the crs binding site (Fig. 5A). In agreement with modeling predictions and the minimal circuit observations (Fig. 4), this Δcrs mutant virus acts as an amplifier generating a ~1.5-fold amplification in single-cell expression levels in the presence of MIEP activators (Fig. 5B and Fig. S5) and exhibits virtually no acceleration (Fig. 5C).
Figure 5. Converting the IE2 accelerator to an amplifier – by eliminating negative feedback – generates a severe fitness cost for the virus.
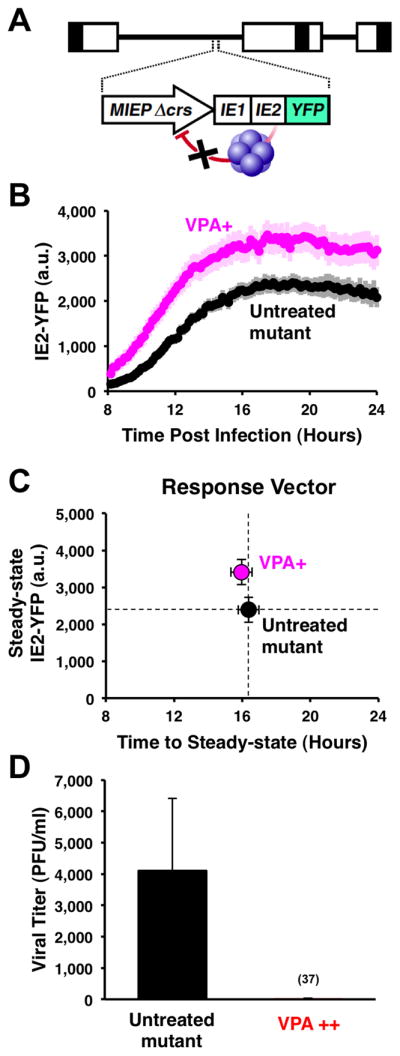
A, Schematic of the mutant CMV Δcrs mutant virus. B, Single-cell time-lapse microscopy of cells undergoing infection with CMV Δ crs mutant in presence of 24-hour pre-treatment of VPA (pink) or absence of VPA (black). Trajectories are averages of 20 cells (bold) together with ± one standard deviation (lighter background). The CMV Δcrs mutant displays an ~1.5-fold amplification in IE2 levels in single cells in response to VPA. C, Response-vector map of single-cell microscopy data showing that the Δcrs mutant virus amplifies steady-state IE2-YFP levels compared to the untreated control (black). Error bars (gray) = ± one standard error. D, Replicative fitness of the CMV Δcrs mutant in presence (red) and absence (black) of a 72-hour VPA treatment as measured by PFU/ml on the peak day of viral production (day 10) after infection at MOI=1. Averages are shown in bold gray with ± one standard deviation. Decreased replication is not due to drug toxicity on the infected cells (see Fig. S5).
Strikingly, replication of this mutant amplifier virus is severely compromised in the presence of activators (Fig. 5D and Fig. S5). These data agree with the minimal-circuit data that amplification of IE2 levels is deleterious for the cell, leading to decreased viral output. Potential toxicity of VPA or TSA exposure alone cannot account for reduced viral replication since neither activator reduces replication fitness of the parent virus (Fig. S5).
To rule out secondary mutations outside the crs region that could be responsible for amplification, these results were verified in two independently isolated BAC clones, and sequencing 1kb upstream and downstream of the crs verified the absence of secondary mutations (data not shown). The generation of a ‘rescue’ virus with wild-type IE2 expression kinetics (described below and in Fig. 7) independently verifies that secondary mutations do not account for the amplifier phenotype or reduced fitness. This absence of secondary mutations is not unexpected given the reported stability and specificity of BAC mutagenesis for CMV (Reddehase and Lemmermann, 2006).
Figure 7. Loss of IE2 acceleration, despite equivalent IE2 levels, carries a heavy fitness cost.

A, Schematic of ‘rescue’ experiment that represents a growth competition between the Δcrs amplifier mutant virus and ‘wild-type’ CMV IE2-YFP. B, Response-vector map of single-cell microscopy showing that the rescue virus (green) generated from the mutant amplifier virus (black), has regained the accelerated expression kinetics of the wild-type virus (white) and all viruses exhibit equivalent IE2-YFP steady-state levels; all viruses (wild-type, mutant, and rescue) were imaged in parallel on the same day under the same conditions. Error bars (gray) = ± one standard error. C, Viral replication titers for the rescue virus (green) compared to Δcrs amplifier mutant (black) and wild-type viruses (white) as measured by PFU/ml on the peak day of viral production in a multi-step assay (MOI=0.1). Despite all viruses exhibiting equivalent IE2-YFP steady-state levels, the rescue virus, which has reacquired the wild-type accelerator, replicates with the same high efficiency as wild-type virus while the Δcrs amplifier mutant virus exhibits a severe fitness disadvantage. Averages are shown in bold gray with ± one standard deviation. See also Figure S7.
The Loss of the Accelerator Circuit in the Δcrs Amplifier Mutant is Buffered by Reduced MIEP Activity through Mislocalization of Incoming Viral Genomes
While theory predicts that removal of negative feedback should increase IE2 steady-state levels (as in the minimal circuit), the biology of IE2 cytotoxicity and the presence of the accelerator circuit in the wild-type virus suggests that over the course of viral evolution, there is strong selection for mechanisms to maintain low IE2 levels. Therefore, to determine how the Δcrs amplifier mutant virus was able to maintain any viability even in the absence of activators (Fig. 5D), we tested if IE2 steady-state levels were increased similar to the minimal virus setting or if the mutant virus employed compensatory mechanisms to keep IE2 levels low. Single-cell imaging and flow cytometry analysis reveal that IE2 steady-state levels in the Δcrs mutant amplifier virus (in the absence of activators) are essentially the same as IE2 levels in the wild-type virus (Fig. 6A and Fig. S6) but the rate of IE2 expression is significantly slower in the mutant (Fig. 6B). Based on literature indicating that sub-nuclear PML bodies facilitate transcription from the MIEP (Sourvinos et al., 2007), we tested if reduced IE2 levels were the result of decreased MIEP activity due to Δcrs mutation–induced mislocalization of incoming viral genomes away from PML bodies. While the wild-type virus exhibits IE2 localization to PML bodies, the Δcrs mutant virus displays virtually no IE2-positive foci during early infection (Fig. S3), and immunofluorescence analysis shows that Δcrs mutant viral genomes do not co-localize with PML bodies (Fig. 6C). To confirm that PML-body mislocalization reduces IE2 levels, we infected a cell line lacking PML bodies (Everett and Chelbi-Alix, 2007) and observed significantly reduced steady-state IE2 levels (Fig. 6D). In summary, the Δcrs mutant amplifier virus appears to compensate for the lack of accelerator circuitry by reducing MIEP transcriptional strength, through misdirecting incoming viral genomes away from sub-nuclear PML bodies.
Figure 6. Mutation of the crs in the CMV genome results in inefficient formation of IE transcriptional centers and lower IE2-YFP expression.

A, Single-cell time-lapse microscopy analysis comparing CMV IE2-YFP virus, referred to as “wild type” (white), to Δcrs amplifier mutant virus (black); infections imaged in parallel on the same day under the same conditions. Error bars (gray) = ± one standard error. B, Response-vector map showing that the Δcrs amplifier mutant virus (black) exhibits decelerated IE2 kinetics but no change in IE2 steady-state level compared to wild-type (white). C, Immunofluorescence micrographs of cells infected with either wild-type CMV (top panels) or the Δcrs mutant virus (bottom panels) and stained for CMV genome (red), PML protein (green), and DNA (blue). CMV genomes and PML bodies appear to co-localize at a significantly higher frequency (P < 0.01) in cells infected with wild-type CMV virus compared to Δcrs amplifier mutant virus. Insets: representative co-localization of CMV genomes and PML bodies. D, Steady-state IE2-YFP levels from single-cell microscopy in conventional PML+ cells (green) cells or PML− knockdown cells (black). Both cell types were infected with “wild-type” CMV IE2-YFP virus. Bold black lines in the box plot are the median IE2-YFP levels, boxes represent lower and upper quartile, and whiskers represent 1.5 interquartile range (IQR) of the lower and upper quartiles. PML knockdown significantly reduces IE2-YFP levels (P < 0.001). See also Figure S6.
The minimal circuit is integrated into the genome as a single-copy lentiviral provirus and MIEP does not appear to be influenced by PML body localization in this context.
Reduced MIEP Activity Decelerates IE2 Expression and Carries a Heavy Fitness Cost
Since the amplifier mutant and wild-type accelerator viruses exhibit equivalent IE2 steady-state levels but different rates of IE2 expression, we next tested if the mutant’s reduced fitness could be rescued by acceleration. To do this, we provided the mutant virus with the opportunity to regain accelerator circuitry through homologous recombination, by co-transfecting cells with the full Δcrs mutant virus genome together with a short 1kb DNA fragment of the MIEP encoding the wild-type crs sequence. This approach to generate recombinant “rescue” virus (Fig. 7A) creates a “fitness competition” since the mutant must compete with any rescue that arises within the culture. After culturing the co-transfected cells for two weeks (the typical time for growth of CMV IE2-YFP in culture), all observable CMV-positive plaques analyzed were, rescue virus that exhibited accelerated expression kinetics (Fig. 7B) and fitness that was comparable to wild-type virus (Fig. 7C). The fact that high-titer accelerator rescue virus can be isolated from a background Δcrs infection, and that no detectable Δcrs virus can be isolated from this background, indicates that viruses encoding the accelerator circuit directly outcompete viruses encoding the mutant amplifier even in the absence of transcriptional activator drugs. Sequencing results confirm that in the rescue virus the Δcrs locus is restored to the wild-type sequence, and that the rescue virus exhibits a complete recovery of the accelerator phenotype (Fig. S7). These results show that a slower rate of IE2 expression is sufficient to generate a heavy fitness cost even when IE2 levels are not elevated.
DISCUSSION
This study characterizes an endogenous accelerator circuit, and shows that acceleration of transcriptional response time, without modulation of steady-state levels, can confer a fitness advantage. The fitness advantage is unlikely to result solely from faster IE2 expression but rather from IE2 driving acceleration of downstream viral expression, since viral cytopathic effect (CPE) is observed earlier when IE2 kinetics are accelerated (Movies S2–S3), and other key steps in the viral life cycle are decelerated in Δcrs viruses (Isomura et al., 2008). Conversely, it is unlikely that the fitness advantage results from non-IE2-driven alternate pathways, since the same transcriptional activators that generate acceleration in the wild-type virus generate amplification with severe fitness loss in the Δcrs mutant amplifier virus and in minimal synthetic circuits where only the accelerator has been removed. The alternate pathway hypothesis is also difficult to reconcile with our finding that MIEP activators (pp71, VPA, TSA, and TNF-α) generate acceleration while broad-spectrum non-MIEP activators (5Aza-C) cannot generate acceleration (Fig. S1). The finding that a rescue virus (which only differs in rate of IE2 expression not level) outcompetes the Δcrs amplifier mutant, further argues that the expression rate drives the fitness advantage. These findings demonstrate a functional role for IE2 negative feedback in maintaining viral fitness.
The unique architecture of IE2 negative feedback and the circuit’s ability to act as an accelerator lies in the high Hill coefficient, H ≈ 7, which to our knowledge is the highest value yet recorded for a transcriptional auto-regulatory circuit. While a number of mechanisms can generate high H values, including multiple binding sites for an auto-regulatory protein on the target DNA (Ozbudak et al., 2004) or sequential covalent modifications of an auto-regulator (Deshaies and Ferrell, 2001), in the case of IE2 the H value can be explained by formation of a homo-multimer, consisting of six to eight IE2 protein monomers that form at or around the 12bp crs DNA–binding site for IE2. The formation of such a large homo-multimer leads to the question of how a 12bp sequence of DNA (just over 40 Å in length) might have the steric space requirements to support binding of this homo-multimer complex, which is likely over half a MegaDalton with a diameter >120 Å, approximately three times as large as the DNA binding site itself. Notably, the eukaryotic transcription factor Sp1 is known to bind a 10bp DNA sequence as a homo-tetramer (Haase, 2010) and many viral proteins cooperatively homo-multimerize to bind short palindromic DNA sequences, including the Rep 78/68 protein in adeno-associated virus, the SV40 large T antigen, and bovine papillomavirus type 1 E1 protein—all of which form homo-hexamers on short palindromic DNA sequences (Flint and American Society for Microbiology., 2009). Thus, homo-multimer formation appears to be a property shared among diverse proteins involved in viral replication as a way to bind short, palindromic DNA sequences. The high cooperativity of IE2 regulation may also be influenced by ‘conditional cooperativity’ (Garcia-Pino et al., 2010), since other host and viral factors, such as viral UL84, are known to functionally interact with IE2 during the viral lifecycle (Gebert et al., 1997) and numerous covalent modifications of IE2 are reported to influence functionality (Barrasa et al., 2005; Hofmann et al., 2000). In general, highly self-cooperative negative feedback may provide a generic mechanism to optimize the rate-versus-level tradeoff.
The mechanics of the accelerator circuit in relation to other negative auto-regulatory circuits
Negative feedback has long been known to speed a circuit’s response time (Black, 1999; Rosenfeld et al., 2002; Savageau, 1976), which is the time required for a circuit to reach its steady-state level or some fixed percentage of its steady-state level (e.g. 50%). Compared to non-feedback circuits, circuits encoding negative feedback (i.e. auto-regulation) approach a lower steady-state level but attain this relative steady-state level faster. However, a long-running biological counter-argument has been that transcriptional circuits must cross an absolute threshold (e.g. 10 molecules) and negative feedback necessarily slows (not speeds) this crossing. This incongruity, in which negative feedback speeds response time but slows threshold crossing, has led to a controversy regarding the kinetic role of negative feedback.
It has been argued that response time (i.e., 50% of some relative steady-state level) is a misleading measure and that negative feedback has no functional role in accelerating responses. The accelerator circuitry characterized here addresses this controversy because it acts as a hybrid between non-feedback and feedback circuits. Rate-balance analysis (Fig. 2A and Movie S4) shows that as the self-cooperativity is increased, the accelerator circuit behaves more and more like a non-feedback circuit at low IE2 concentrations, allowing for faster crossing of an absolute molecular threshold. As IE2 levels approach the concentration threshold where self-cooperative negative feedback becomes active, feedback turns on very quickly (and at almost maximum strength) and sharply auto-represses the MIEP to keep the steady-state level from changing under different inputs. In the framework of electrical-circuit theory, the accelerator inverts the typical input/output transfer function and dynamically redistributes the ‘gain-bandwidth’ relationship (see Supplementary Information). It is possible that diverse signaling pathways that employ negative feedback utilize this inversion of input/output as a means of signal discrimination or as a mechanism to approximate ‘perfect adaptation’ (Ma et al., 2009; Muzzey et al., 2009) in steady-state levels. The high cooperativity in negative feedback may also function to suppress stochastic fluctuations (i.e. noise) that influence the behavior of decision-making circuits (Cagatay et al., 2009).
Potential roles for the accelerator circuit in the evolution of virulence
Why might CMV have evolved the accelerator architecture over other potential mechanisms to maintain low levels of IE2? CMV’s lifecycle in vivo involves replication in diverse cell types and host conditions and the strong, easily activated MIEP is well suited to activate under these diverse conditions. The MIEP’s strength is due to numerous enhancer-binding sites that have the potential to generate large amplifications of input signal through combinatorial binding (Carey et al., 2009). Consequently, CMV’s accelerator circuit may have evolved as a natural consequence of the strong MIEP to counteract and limit the inevitable amplification of signal from MIEP. An alternate mechanism would be to enhance the basal-expression strength of the MIEP while simultaneously increasing the decay (i.e. turnover) rate of IE2. This strategy would difficult to achieve for CMV since the MIEP is one of the strongest known promoters and the IE2 half-life is ~2.5 hours (Fig. S6). Given this short half-life of IE2, coupled with the already exceptional strength of the MIEP, it may not be possible to further reduce IE2 half-life (while maintaining its essential functions) or increase the unstimulated MIEP activity level. However, this strategy may have been an evolutionary precursor to the accelerator circuit.
In settings where host defenses lead to high viral loss, faster expression and increased viral output in response to inflammatory or innate-defense factors may enable the virus to outpace host defenses. Thus, tuning of the expression rate may have evolved as a viral countermeasure to outpace the host cell’s innate immune defenses. Since these considerations are not unique to CMV infection, accelerator circuitry may be a widespread architecture among gene-regulatory circuits.
METHODS
Cloning of recombinant viruses
The CMV IE2-YFP virus was constructed by inserting EYFP (Clontech) to the 3′ end of IE2 exon 5 in the parent AD169 as described (Moorman et al., 2008; Yu et al., 2002).
The CMV GFP control virus (Yu et al., 2003) encodes an SV40 promoter–EGFP cassette. The CMV Δcrs IE2-YFP virus was constructed from the CMV IE2-YFP background as described (Cuevas-Bennett and Shenk, 2008). Viral stocks were titered by TCID50 (Nevels et al., 2004). To verify the integrity of the CMV Δcrs IE2-YFP virus, a rescue virus, CMV ΔcrsREVERT IE2-YFP, was constructed by homologous recombination, whereby CMV Δcrs IE2-YFP BAC DNA (20 μg) and a ~2.5 kb wild-type MIEP DNA fragment (2.5 μg) were co-transfected by electroporation into 106 MRC5 cells, and subjected to two rounds of plaque purification.
Cell-culture conditions and drug perturbations
MRC5 fibroblasts and life-extended human foreskin fibroblasts (HFFs) (Bresnahan and Shenk, 2000) were maintained in Dulbecco’s Modified Eagle’s Medium (DMEM) supplemented with 10% fetal bovine serum (FBS) and 50 U/ml penicillin-streptomycin at 37°C and 5% CO2 in a humidified incubator. ARPE-19 cells were maintained in a 1:1 mixture of DMEM/F-12 (Mediatech Inc.) with 10% FBS (HyClone) and 50 U/ml Penicillin-Streptomycin (Mediatech Inc.). Cells were pretreated in a final concentration of 1mM VPA (Calbiochem).
Quantitative Western blot analysis
MRC5s at ~60% confluency were infected at MOI = 1. To synchronize viral entry, adsorption was done at 4°C for 30 min., cells washed once in PBS (Mediatech, Inc.), fresh media added, and cells placed in a 37°C in a humidified CO2 incubator. Time points were collected every 1–2 hrs for 20–24 hrs as indicated. Sample collection, protein transfer, and blot preparation were as previously described (Bolovan-Fritts et al., 2004) and samples were loaded and separated on precast SDS PAGE 10% or 7.5% bisacrylamide gels (BioRad).
For quantitative IE2 detection, the 1° antibody MAB810 (Millipore) was used at 1:100 and 2° antibody 926-32212 (LI-COR™) was used at a dilution of 1:20,000. For normalization, anti-beta tubulin antibody 26-42211 (LI-COR™) used at a dilution of 1:2000 followed by 2′ antibody 926-68073 (LI-COR™) at a dilution of 1:20,000. Blots were scanned and quantified on a LI-COR™ Odyssey™ according to manufacturer’s protocols.
Time-lapse fluorescence microscopy measurements
Life-extended HFFs and PML knockdown HFFs (a gift from Roger Everett) were passed onto a 96-well glass-bottom plate (Thermo Fisher Scientific) and grown to confluency to hold cells in the G0. Cells were synchronously infected on ice for 30 mins at MOI = 1 (infection with mutant was done at room temperature). Live cells were imaged using a 20X oil objective on a spinning-disk confocal microscope (Olympus DSU™) equipped with a 37°C, humidified, 5% CO2 live-cell chamber. Image collection began when YFP signal was first detected and frames were captured every 10 minutes for 16–24 hours using an exposure time between 200 and 800 msec. Single-cell tracking and segmentation were performed with custom-written code in MatLab™ (Mathworks) as previously described (Weinberger et al., 2008). Homo-FRET imaging was performed as previously described (Weinberger and Shenk, 2007).
Mathematical modeling to estimate H from time-lapse microscopy data and closed-loop analysis to measure H from flow cytometry data
Numerical simulations and fitting of an ODE model (Supplementary Information) were performed in Berkeley Madonna™ (www.berkeleymadonna.com).
Mathematica™ (Wolfram Research) was used for closed-loop analysis. Standard lentiviral cloning was used to create minimal MIE circuits (Dull et al., 1998). The minimal MIEP-IE2-GFP and MIEP-GFP circuits are driven by a full-length ~2.5kb MIE promoter-enhancer (MIEP) that spans the sequence from the MIEP modulator at the 5′ edge to the junction of IE exons 1 and 2. The MIEP was PCR-cloned from AD169 into pLEIGW (a gift from Ihor Lemishka) in place of the EF1a promoter. This full-length MIEP drives an IE2-IRES-GFP or mCherry-IRES-GFP cassette. IE2 was cloned from pRSV-IE86 (a gift from Jay Nelson). ARPE-19 cells were infected and FACS sorted for GFP to create stably expressing cell lines (Fig. S4). Cells were treated with TSA for 17 hours, and GFP expression was quantified by flow cytometry. Live cells were gated by forward-versus-side scattering on a FacsCalibur™ cytometer (BD Biosciences) and mean fluorescence intensity recorded. At least 20,000 live cells were recorded for each experiment and data was analyzed in FlowJo™ (Treestar Inc.).
Replication Kinetics
Confluent MRC5 monolayers at ~5 × 10⁴ cells per well were infected at indicated MOIs using 0.45μm pre-filtered virus inoculum stocks diluted in culture media. Inoculums were calculated based on plaque-assay titrations (Bolovan-Fritts and Wiedeman, 2001), shown as time point 0 in each figure. Inoculum was then removed and replaced with 1mL fresh media. Infected wells were collected in triplicate at indicated time points and stored at −80°C. To measure replication, samples were thawed and prepared as a 10-fold serial-dilution series in culture media, analyzed by TCID50, then converted to PFU/ml. Error ranges were calculated by standard deviation.
Minimal synthetic circuit experiments
MIEPΔcrs-IE2-GFP was constructed by PCR cloning MIEPΔcrs from the CMV Δcrs IE2-YFP bacmid and inserted into MIEP-IE2-GFP. ARPE-19 cells were transduced with the MIEP-IE2-GFP and MIEPΔcrs–IE2-GFP vectors and FACS sorted for GFP. The transduced cell lines were allowed to recover for 24 hours before the percentage of GFP-expressing cells for each cell line was quantified. Live cells were gated by forward versus side scattering on a FacsCalibur cytometer. On the first day after recovery, 2,500 GFP events were recorded. Subsequently, at least 10,000 GFP events were recorded for each experiment and analyzed using FlowJo™. For genomic PCR, genomic DNA was purified using a NucleoSpin Tissue kit (Clontech).
Immunofluoresence and Brdu-labeled virus detection
Brdu-labeled virus was grown and detected by adapting a previously published method (Rosenke and Fortunato, 2004). Cells were grown on 16-well chamber slides (Lab-Tek) and infected with either CMV IE2-YFP or Δcrs IE2-YFP virus on ice and with 1% FCS media to synchronize infection. After 3 hours, cells were washed, fixed, and permeabilized (Rosenke and Fortunato, 2004). PML was detected by a polyclonal PML rabbit antibody (Santa Cruz) at a 1:500 dilution, with secondary goat anti-rabbit Alexa 488 antibody (Invitrogen) at 1:500. After PML detection, the cells were stained with DAPI (Invitrogen) for 15 minutes before a second fixation with 3% formaldehyde. Brdu-labeled viral genomes were detected using a monoclonal rat Brdu antibody (Accurate Chemical Scientific Corp.) at 1:250, followed by secondary donkey anti-rat antibody conjugated with Alexa Fluor 568 (Invitrogen) at 1:500. Cells were mounted with ProLong Gold mounting media (Invitrogen) and a #1.5 cover slip (Nunc). Cover slips were imaged on a Zeiss Observer Z1 spinning-disk confocal microscope with a Plan-FLUAR 100X/1.45 oil objective. Co-localization analysis was performed in Slidebook™ 5.0 (Imaging Innovations, Inc.).
Supplementary Material
RESEARCH HIGHLIGHTS.
A viral gene circuit exclusively speeds expression of the CMV ‘master regulator’ IE2
Transcriptional acceleration without amplification results in enhanced fitness
The accelerator circuit functions via IE2 negative feedback (Hill coefficient ~ 7)
Highly cooperative IE2 feedback is generated by IE2 multimerization at PML bodies
Acknowledgments
We are grateful to J. Ferrell, L. Fortunato, M. Elowitz, E. Mocarski, D, Spector, T. Hwa, A. Hoffmann, R. Tsien, J. Nelson, C Lilley, M. Weitzman, and R. Everett for providing reagents, equipment, helpful discussion, and critical review of previous versions of this manuscript. We thank S. Thiberge and the Lewis-Sigler Imaging Core for invaluable technical expertise. MWT and AW acknowledge support from NSF Graduate Research Fellowships. MLS acknowledges support from the Center for Nanophase Materials Sciences, sponsored by the US Department of Energy. TS received support from the NIH (R01CA85786) and the NIH Center for Systems Biology at Princeton University (P50GM71508). This work was supported by NIH award K25GM083395 (LSW).
Abbreviations
- CMV
cytomegalovirus
- MIE
Major Immediate-Early
- IE2
Immediate-Early 2
- FRET
Fluorescence Resonance Energy Transfer
Footnotes
Author Contributions: LSW conceived and designed the study. MWT, CBF, and LSW designed and performed the experiments. MWT, CBF, RDD, MLS, TS and LSW analyzed the data. AW and TS provided reagents. MWT, CBF, and LSW wrote the paper.
Publisher's Disclaimer: This is a PDF file of an unedited manuscript that has been accepted for publication. As a service to our customers we are providing this early version of the manuscript. The manuscript will undergo copyediting, typesetting, and review of the resulting proof before it is published in its final citable form. Please note that during the production process errors may be discovered which could affect the content, and all legal disclaimers that apply to the journal pertain.
References
- Alon U. An introduction to systems biology : design principles of biological circuits. Boca Raton, FL: Chapman & Hall/CRC; 2007. [Google Scholar]
- Barrasa MI, Harel NY, Alwine JC. The phosphorylation status of the serine-rich region of the human cytomegalovirus 86-kilodalton major immediate-early protein IE2/IEP86 affects temporal viral gene expression. J Virol. 2005;79:1428–1437. doi: 10.1128/JVI.79.3.1428-1437.2005. [DOI] [PMC free article] [PubMed] [Google Scholar]
- Black HS. Stabilized feed-back amplifiers (Reprinted from Electrical Engineering, vol 53, pg 114–120, 1934) Proceedings of the Ieee. 1999;87:379–385. [Google Scholar]
- Bolovan-Fritts C, Wiedeman JA. Human cytomegalovirus strain Toledo lacks a virus-encoded tropism factor required for infection of aortic endothelial cells. J Infect Dis. 2001;184:1252–1261. doi: 10.1086/324010. [DOI] [PubMed] [Google Scholar]
- Bolovan-Fritts CA, Trout RN, Spector SA. Human cytomegalovirus-specific CD4+-T-cell cytokine response induces fractalkine in endothelial cells. J Virol. 2004;78:13173–13181. doi: 10.1128/JVI.78.23.13173-13181.2004. [DOI] [PMC free article] [PubMed] [Google Scholar]
- Bresnahan WA, Shenk TE. UL82 virion protein activates expression of immediate early viral genes in human cytomegalovirus-infected cells. Proc Natl Acad Sci U S A. 2000;97:14506–14511. doi: 10.1073/pnas.97.26.14506. [DOI] [PMC free article] [PubMed] [Google Scholar]
- Cagatay T, Turcotte M, Elowitz MB, Garcia-Ojalvo J, Suel GM. Architecture-dependent noise discriminates functionally analogous differentiation circuits. Cell. 2009;139:512–522. doi: 10.1016/j.cell.2009.07.046. [DOI] [PubMed] [Google Scholar]
- Carey M, Peterson CL, Smale ST. Transcriptional regulation in eukaryotes : concepts, strategies, and techniques. 2. Cold Spring Harbor, N.Y: Cold Spring Harbor Laboratory Press; 2009. [Google Scholar]
- Cauwels A, Brouckaert P. Survival of TNF toxicity: dependence on caspases and NO. Arch Biochem Biophys. 2007;462:132–139. doi: 10.1016/j.abb.2007.01.021. [DOI] [PubMed] [Google Scholar]
- Chen J, Alberti S, Matthews KS. Wild-type operator binding and altered cooperativity for inducer binding of lac repressor dimer mutant R3. J Biol Chem. 1994;269:12482–12487. [PubMed] [Google Scholar]
- Chiou CJ, Zong J, Waheed I, Hayward GS. Identification and mapping of dimerization and DNA-binding domains in the C terminus of the IE2 regulatory protein of human cytomegalovirus. J Virol. 1993;67:6201–6214. doi: 10.1128/jvi.67.10.6201-6214.1993. [DOI] [PMC free article] [PubMed] [Google Scholar]
- Choi KH, Basma H, Singh J, Cheng PW. Activation of CMV promoter-controlled glycosyltransferase and beta -galactosidase glycogenes by butyrate, tricostatin A, and 5-aza-2′-deoxycytidine. Glycoconj J. 2005;22:63–69. doi: 10.1007/s10719-005-0326-1. [DOI] [PubMed] [Google Scholar]
- Cuevas-Bennett C, Shenk T. Dynamic histone H3 acetylation and methylation at human cytomegalovirus promoters during replication in fibroblasts. J Virol. 2008;82:9525–9536. doi: 10.1128/JVI.00946-08. [DOI] [PMC free article] [PubMed] [Google Scholar]
- Deshaies RJ, Ferrell JE., Jr Multisite phosphorylation and the countdown to S phase. Cell. 2001;107:819–822. doi: 10.1016/s0092-8674(01)00620-1. [DOI] [PubMed] [Google Scholar]
- Dull T, Zufferey R, Kelly M, Mandel RJ, Nguyen M, Trono D, Naldini L. A third-generation lentivirus vector with a conditional packaging system. J Virol. 1998;72:8463–8471. doi: 10.1128/jvi.72.11.8463-8471.1998. [DOI] [PMC free article] [PubMed] [Google Scholar]
- Dwarakanath RS, Clark CL, McElroy AK, Spector DH. The use of recombinant baculoviruses for sustained expression of human cytomegalovirus immediate early proteins in fibroblasts. Virology. 2001;284:297–307. doi: 10.1006/viro.2001.0924. [DOI] [PubMed] [Google Scholar]
- Everett RD, Chelbi-Alix MK. PML and PML nuclear bodies: implications in antiviral defence. Biochimie. 2007;89:819–830. doi: 10.1016/j.biochi.2007.01.004. [DOI] [PubMed] [Google Scholar]
- Fan S, Maguire CA, Ramirez SH, Bradel-Tretheway B, Sapinoro R, Sui Z, Chakraborty-Sett S, Dewhurst S. Valproic acid enhances gene expression from viral gene transfer vectors. J Virol Methods. 2005;125:23–33. doi: 10.1016/j.jviromet.2004.11.023. [DOI] [PubMed] [Google Scholar]
- Flint SJ American Society for Microbiology. Principles of virology. 3. Washington, DC: ASM Press; 2009. [Google Scholar]
- Garcia-Pino A, Balasubramanian S, Wyns L, Gazit E, De Greve H, Magnuson RD, Charlier D, van Nuland NA, Loris R. Allostery and intrinsic disorder mediate transcription regulation by conditional cooperativity. Cell. 2010;142:101–111. doi: 10.1016/j.cell.2010.05.039. [DOI] [PubMed] [Google Scholar]
- Gardner TS, Cantor CR, Collins JJ. Construction of a genetic toggle switch in Escherichia coli. Nature. 2000;403:339–342. doi: 10.1038/35002131. [DOI] [PubMed] [Google Scholar]
- Gautier I, Tramier M, Durieux C, Coppey J, Pansu RB, Nicolas JC, Kemnitz K, Coppey-Moisan M. Homo-FRET microscopy in living cells to measure monomer-dimer transition of GFP-tagged proteins. Biophys J. 2001;80:3000–3008. doi: 10.1016/S0006-3495(01)76265-0. [DOI] [PMC free article] [PubMed] [Google Scholar]
- Gebert S, Schmolke S, Sorg G, Floss S, Plachter B, Stamminger T. The UL84 protein of human cytomegalovirus acts as a transdominant inhibitor of immediate-early-mediated transactivation that is able to prevent viral replication. J Virol. 1997;71:7048–7060. doi: 10.1128/jvi.71.9.7048-7060.1997. [DOI] [PMC free article] [PubMed] [Google Scholar]
- Haase AT. Targeting early infection to prevent HIV-1 mucosal transmission. Nature. 2010;464:217–223. doi: 10.1038/nature08757. [DOI] [PubMed] [Google Scholar]
- Hofmann H, Floss S, Stamminger T. Covalent modification of the transactivator protein IE2-p86 of human cytomegalovirus by conjugation to the ubiquitin-homologous proteins SUMO-1 and hSMT3b. J Virol. 2000;74:2510–2524. doi: 10.1128/jvi.74.6.2510-2524.2000. [DOI] [PMC free article] [PubMed] [Google Scholar]
- Hooshangi S, Thiberge S, Weiss R. Ultrasensitivity and noise propagation in a synthetic transcriptional cascade. Proc Natl Acad Sci U S A. 2005;102:3581–3586. doi: 10.1073/pnas.0408507102. [DOI] [PMC free article] [PubMed] [Google Scholar]
- Hummel M, Abecassis MM. A model for reactivation of CMV from latency. J Clin Virol. 2002;25(Suppl 2):S123–136. doi: 10.1016/s1386-6532(02)00088-4. [DOI] [PubMed] [Google Scholar]
- Isomura H, Stinski MF, Kudoh A, Nakayama S, Murata T, Sato Y, Iwahori S, Tsurumi T. A cis element between the TATA Box and the transcription start site of the major immediate-early promoter of human cytomegalovirus determines efficiency of viral replication. J Virol. 2008;82:849–858. doi: 10.1128/JVI.01593-07. [DOI] [PMC free article] [PubMed] [Google Scholar]
- Kobayashi H, Kaern M, Araki M, Chung K, Gardner TS, Cantor CR, Collins JJ. Programmable cells: interfacing natural and engineered gene networks. Proc Natl Acad Sci U S A. 2004;101:8414–8419. doi: 10.1073/pnas.0402940101. [DOI] [PMC free article] [PubMed] [Google Scholar]
- Ma W, Trusina A, El-Samad H, Lim WA, Tang C. Defining network topologies that can achieve biochemical adaptation. Cell. 2009;138:760–773. doi: 10.1016/j.cell.2009.06.013. [DOI] [PMC free article] [PubMed] [Google Scholar]
- Macias MP, Stinski MF. An in vitro system for human cytomegalovirus immediate early 2 protein (IE2)-mediated site-dependent repression of transcription and direct binding of IE2 to the major immediate early promoter. Proc Natl Acad Sci U S A. 1993;90:707–711. doi: 10.1073/pnas.90.2.707. [DOI] [PMC free article] [PubMed] [Google Scholar]
- Mocarski ES, Shenk T, Pass RF. Cytomegaloviruses. In: Knipe DM, editor. Fields’ virology. Philadelphia: Lippincott Williams & Wilkins; 2006. pp. 2708–2772. [Google Scholar]
- Moorman NJ, Cristea IM, Terhune SS, Rout MP, Chait BT, Shenk T. Human cytomegalovirus protein UL38 inhibits host cell stress responses by antagonizing the tuberous sclerosis protein complex. Cell Host Microbe. 2008;3:253–262. doi: 10.1016/j.chom.2008.03.002. [DOI] [PMC free article] [PubMed] [Google Scholar]
- Muzzey D, Gomez-Uribe CA, Mettetal JT, van Oudenaarden A. A systems-level analysis of perfect adaptation in yeast osmoregulation. Cell. 2009;138:160–171. doi: 10.1016/j.cell.2009.04.047. [DOI] [PMC free article] [PubMed] [Google Scholar]
- Nevels M, Brune W, Shenk T. SUMOylation of the human cytomegalovirus 72-kilodalton IE1 protein facilitates expression of the 86-kilodalton IE2 protein and promotes viral replication. J Virol. 2004;78:7803–7812. doi: 10.1128/JVI.78.14.7803-7812.2004. [DOI] [PMC free article] [PubMed] [Google Scholar]
- Nowak MA, May RM. Virus dynamics : mathematical principles of immunology and virology. Oxford ; New York: Oxford University Press; 2000. [Google Scholar]
- Ozbudak EM, Thattai M, Lim HN, Shraiman BI, Van Oudenaarden A. Multistability in the lactose utilization network of Escherichia coli. Nature. 2004;427:737–740. doi: 10.1038/nature02298. [DOI] [PubMed] [Google Scholar]
- Reddehase MJ, Lemmermann N. Cytomegaloviruses : molecular biology and immunology. Wymondham: Caister Academic Press; 2006. [Google Scholar]
- Rosenfeld N, Elowitz MB, Alon U. Negative autoregulation speeds the response times of transcription networks. J Mol Biol. 2002;323:785–793. doi: 10.1016/s0022-2836(02)00994-4. [DOI] [PubMed] [Google Scholar]
- Rosenke K, Fortunato EA. Bromodeoxyuridine-labeled viral particles as a tool for visualization of the immediate-early events of human cytomegalovirus infection. J Virol. 2004;78:7818–7822. doi: 10.1128/JVI.78.14.7818-7822.2004. [DOI] [PMC free article] [PubMed] [Google Scholar]
- Roth J, Rummel C, Barth SW, Gerstberger R, Hubschle T. Molecular aspects of fever and hyperthermia. Neurol Clin. 2006;24:421–439. v. doi: 10.1016/j.ncl.2006.03.004. [DOI] [PubMed] [Google Scholar]
- Runnels LW, Scarlata SF. Theory and application of fluorescence homotransfer to melittin oligomerization. Biophys J. 1995;69:1569–1583. doi: 10.1016/S0006-3495(95)80030-5. [DOI] [PMC free article] [PubMed] [Google Scholar]
- Sanders RL, Clark CL, Morello CS, Spector DH. Development of cell lines that provide tightly controlled temporal translation of the human cytomegalovirus IE2 proteins for complementation and functional analyses of growth-impaired and nonviable IE2 mutant viruses. J Virol. 2008;82:7059–7077. doi: 10.1128/JVI.00675-08. [DOI] [PMC free article] [PubMed] [Google Scholar]
- Savageau MA. Biochemical systems analysis : a study of function and design in molecular biology. Reading, Mass: Addison-Wesley Pub. Co., Advanced Book Program; 1976. [Google Scholar]
- Sourvinos G, Tavalai N, Berndt A, Spandidos DA, Stamminger T. Recruitment of human cytomegalovirus immediate-early 2 protein onto parental viral genomes in association with ND10 in live-infected cells. J Virol. 2007;81:10123–10136. doi: 10.1128/JVI.01009-07. [DOI] [PMC free article] [PubMed] [Google Scholar]
- Stinski MF, Isomura H. Role of the cytomegalovirus major immediate early enhancer in acute infection and reactivation from latency. Med Microbiol Immunol. 2008;197:223–231. doi: 10.1007/s00430-007-0069-7. [DOI] [PubMed] [Google Scholar]
- Stinski MF, Petrik DT. Functional roles of the human cytomegalovirus essential IE86 protein. Curr Top Microbiol Immunol. 2008;325:133–152. doi: 10.1007/978-3-540-77349-8_8. [DOI] [PubMed] [Google Scholar]
- Waheed I, Chiou CJ, Ahn JH, Hayward GS. Binding of the human cytomegalovirus 80-kDa immediate-early protein (IE2) to minor groove A/T-rich sequences bounded by CG dinucleotides is regulated by protein oligomerization and phosphorylation. Virology. 1998;252:235–257. doi: 10.1006/viro.1998.9448. [DOI] [PubMed] [Google Scholar]
- Weinberger LS, Dar RD, Simpson ML. Transient-mediated fate determination in a transcriptional circuit of HIV. Nat Genet. 2008;40:466–470. doi: 10.1038/ng.116. [DOI] [PubMed] [Google Scholar]
- Weinberger LS, Shenk T. An HIV feedback resistor: auto-regulatory circuit deactivator and noise buffer. PLoS Biol. 2007;5:e9. doi: 10.1371/journal.pbio.0050009. [DOI] [PMC free article] [PubMed] [Google Scholar]
- Yu D, Silva MC, Shenk T. Functional map of human cytomegalovirus AD169 defined by global mutational analysis. Proc Natl Acad Sci U S A. 2003;100:12396–12401. doi: 10.1073/pnas.1635160100. [DOI] [PMC free article] [PubMed] [Google Scholar]
- Yu D, Smith GA, Enquist LW, Shenk T. Construction of a self-excisable bacterial artificial chromosome containing the human cytomegalovirus genome and mutagenesis of the diploid TRL/IRL13 gene. J Virol. 2002;76:2316–2328. doi: 10.1128/jvi.76.5.2316-2328.2002. [DOI] [PMC free article] [PubMed] [Google Scholar]
Associated Data
This section collects any data citations, data availability statements, or supplementary materials included in this article.