

Summary
The vacuolar (H+)-ATPases (V-ATPases) facilitate the release of influenza A virus (IAV) genome into the cytoplasm by acidifying the endosomal interior. The regulation of V-ATPases by signaling pathways has been demonstrated in various model systems. However, little is known about signaling-regulated V-ATPase activation during IAV infection. Here we show that V-ATPase activity is elevated during infection of cell monolayers with IAV, as measured by intracellular pH change, via a mechanism mediated by extracellular signal-regulated kinase (ERK) and phosphatidylinositol 3-kinase (PI3K). Inhibition of IAV-induced early activation of these kinases reduced V-ATPase activity and the acidification of intracellular compartments in infected cells. IAV-activated ERK and PI3K appear to interact directly, and they colocalize with the E subunit of V-ATPase V1 domain. Further, siRNAs targeting the E2 subunit isoform significantly reduced virus titers. Interestingly, suppression of PI3K early activation, but not that of ERK or V-ATPase, negatively affected virus internalization, suggesting the involvement of the pathway in earlier, V-ATPase-independent infection-promoting events. Treatment of cells with a V-ATPase-specific inhibitor impaired the nuclear localization of incoming viral ribonucleoproteins, inhibiting replication/transcription of viral RNAs. Taken together, these results indicate that IAV-induced early activation of ERK and PI3K mediates V-ATPase-stimulated endosomal acidification required for fusion.
Introduction
Influenza A virus (IAV) is still a major cause of morbidity and mortality worldwide. Infection is initiated by attachment of the IAV hemagglutinin (HA) spike glycoprotein to host cell surface receptors. IAV enters the cells via the cellular endocytosis machinery and then traffics through the early and late endosomes (Sieczkarski et al., 2003). The viral envelope M2 ion-channel protein facilitates an influx of H+ ions from the acidified endosomes into the interior of the virus to dissociate the viral ribonucleoprotein (RNP) complex from the rest of the viral components. Exposure to low pH triggers HA-catalyzed fusion between the viral and endosomal membranes, releasing RNPs into the cytoplasm of the infected host cell (Pinto et al., 1992). This HA-mediated fusion process within the late endosome appears to be effective only between pH 4.5 and pH 5.5 (Hoekstra & Klappe, 1993, Sieczkarski et al., 2003).
Vacuolar H+-ATPases (V-ATPases) are ATP-dependent proton pumps that maintain acidification of early and late endosomes, lysosomes, and Golgi-derived secretory vesicles in all eukaryotic cells (Forgac, 2007, Nishi & Forgac, 2002). V-ATPase-dependent acidification of the endosomal interior is crucial for the entry of various enveloped viruses (Gruenberg & van der Goot, 2006), such as IAV (Guinea & Carrasco, 1995, Ochiai et al., 1995). Most recently, 23 cellular factors, including members of the V-ATPases, have been identified as essential for virus entry (Konig et al., 2010). V-ATPases are large multi-subunit complexes composed of the peripheral complex V1, containing eight subunits (A, B, C, D, E, F, G, H), and the membrane complex V0, containing five subunits (a, d, c, c′ and c″) (Kane & Smardon, 2003). V-ATPase activity is uniquely regulated via the reversible dissociation and reassembly of both domains (Kane, 2006). V-ATPase-mediated proton transport is controlled by several known extrinsic regulatory factors, including mineralocorticoid hormones, endothelin, angiotensin II (Gluck et al., 1998, Gluck et al., 1996), glucose (Sautin et al., 2005) and cytokines, such as interleukin (IL)-1 (Brisseau et al., 1996) and IL-4 and -13 (Van Den Berg et al., 2002). Several studies have also implicated intracellular signaling molecules in V-ATPase activation (Gluck et al., 1998, Gluck et al., 1996, Parra et al., 2000, Rothenberger et al., 2007, Sautin et al., 2005, Voss et al., 2007).
IAV infection triggers an array of antiviral signal transduction events (Ludwig et al., 2003, Ludwig et al., 2006). Activation of extracellular signal-regulated kinase (ERK), which is part of the mitogen-activated protein kinase (MAPK) Raf/MEK/ERK cascade, upon productive IAV infection contributes to cytokine production and airway inflammation (Mizumura et al., 2003), whereas phosphatidylinositol 3-kinase (PI3K), belonging to a family of lipid kinases, is involved in double-stranded RNA–induced activation of the antiviral transcription factor interferon-regulatory factor 3 (IRF3) (Sarkar et al., 2004). However, mounting evidence suggests that IAV exploits these signaling functions to support its replication. Both ERK and PI3K are activated in a biphasic manner. Viral HA-mediated late activation of ERK is required for nuclear export of viral RNPs (Pleschka et al., 2001), and viral non-structural protein 1 (NS1)-induced late activation of the PI3K effector Akt prevents premature apoptosis (Ehrhardt et al., 2007, Shin et al., 2007, Zhirnov & Klenk, 2007) by negatively regulating the JNK pathway via ASK1 (Lu et al., 2010). Virus-induced early activation of PI3K appears to regulate the early phase of virus entry (Ehrhardt et al., 2006), although the molecular mechanism remains elusive. The role of ERK early activation is largely unknown.
Because intracellular signaling pathways mediate the activation of V-ATPase, we studied the stimulatory effect of IAV-induced ERK and PI3K early activation on V-ATPase activity during the viral entry process. Here we present evidence that ERK and PI3K function as signaling mediators of V-ATPase-dependent intracellular pH (pHi) change (ΔpHi) in response to IAV infection of cell monolayers. We observed a decrease in V-ATPase activity and V-ATPase-dependent acidification of intracellular compartments when IAV-induced early activation of ERK and/or PI3K was inhibited. Our results demonstrate that IAV-activated ERK and PI3K molecules colocalize with subunit E of the V-ATPase V1 domain and appear to interact directly. Gene silencing of the E2 subunit isoform of V-ATPase by small interfering RNA (siRNA) resulted in significantly lower virus titers in infected cells. The V-ATPase-specific inhibitor bafilomycin A1 (Baf-A1) impaired the nuclear accumulation of viral RNP complexes, reducing replication and transcription of viral RNAs. We found that suppression of PI3K early activation, but not of ERK or V-ATPase early activation, negatively affected virus internalization. This finding suggests the involvement of the PI3K pathway in earlier, V-ATPase-independent infection-promoting events.
Results
Influenza A virus infection induces early activation of the Raf/MEK/ERK and PI3K-Akt signaling cascades
It has been shown that phosphorylation of IAV-induced ERK and Akt occurs in a biphasic manner (Ehrhardt et al., 2006, Pleschka et al., 2001). The early activation phase of both kinases appears to occur during the first hour of virus infection, whereas the late activation phase commences about 4 h after infection. To confirm these findings, we investigated the kinase phosphorylation pattern in Madin-Darby canine kidney (MDCK) and human lung (A549) epithelial cells infected with the human A/Puerto-Rico/8/34 (H1N1) virus (PR/8) at a multiplicity of infection (MOI) of 5. Since V-ATPases play an important role during the early stage of IAV infection, we paid particular attention to the early-phase activation of the kinases, 30 min and 60 min after virus addition (a.v.a). The level of ERK- and AKT-phosphorylation was higher 30 min a.v.a. in MDCK cells and both 30 min and 60 min a.v.a. in A549 cells than in the respective mock-infected control cells (Fig. 1). We also tested the effect of U0126 (20 μM), a highly selective inhibitor of MEK1/2 (Davies et al., 2000), and ZSTK474 (5 μM), the most specific PI3K inhibitor (Kong et al., 2009), on IAV-induced kinase activation. The early activation of the kinases MEK and Akt was strongly suppressed in the presence of either signaling inhibitor at the indicated concentrations (Fig. 1).
Fig. 1. Infection with human influenza virus A/PR/8/34 (H1N1) induces early activation of Raf/MEK/ERK and PI3K/Akt signaling cascades.

MDCK or A549 cells were infected with PR/8 at an MOI = 5 and were simultaneously treated with solvent only, MEK inhibitor (U0126, 20 μM) or PI3K inhibitor (ZSTK474, 5 μM) for the times indicated. Phosphorylated ERK1/2 (P-ERK1/2) and phosphorylated Akt (P-Akt) were detected by Western blotting with the respective phospho-specific antibodies. Equal protein loading of the kinases was verified in ERK2 and Akt-Western blots.
Influenza A virus-induced V-ATPase stimulation is mediated by ERK and PI3K
V-ATPase-dependent proton transport is controlled by various extrinsic regulatory factors through different signaling pathways (Parra et al., 2000, Rothenberger et al., 2007, Sautin et al., 2005, Voss et al., 2007). We examined the effect of IAV-induced early activation of ERK and PI3K on V-ATPase-stimulated intracellular pH (pHi) change (ΔpHi), a surrogate measure of V-ATPase activity, by modifying an established rapid fluorometric ΔpHi assay (Salvi et al., 2002) for use in IAV-infected MDCK and A549 cells. To control the enzyme activity of V-ATPases we used bafilomycin A1 (Baf A1), a specific V-ATPase inhibitor (Bowman et al., 1988, Hanada et al., 1990). It was first necessary to confirm that vesicular acidification could be inhibited without cellular toxicity or interference with assays for infectious virus. We determined the concentration at which Baf A1 influences the proliferative and metabolic activity of cultured cells. An MTT cell proliferation assay, which measures the metabolic activity of a mitochondrial enzyme in proliferating healthy cells (Mosmann, 1983), showed comparable numbers of viable cells after 60 min and after 24 h of treatment with various concentrations of Baf A1 up to 1 μM and with solvent (Fig. 2A). We also monitored early and late apoptosis events in Baf A1-treated cells by observing changes in mitochondrial membrane potential (using the fluorescent cationic dye MitoSense Red) and changes in cellular activity (measured as intracellular esterase activity using the non-fluorescent, cell permeant compound Calcein AM) (Fig. 2B). The positive control cells treated with the apoptosis inducer camptothecin (12 μM) for 2 h showed two distinct cell populations (apoptotic and healthy cells) in both early and late apoptosis assays. However, no mitochondrial membrane damage (early apoptosis) or reduced cellular activity (late apoptosis) was detected in cells treated for 60 min or for 24 h with either 1 μM Baf A1 or solvent only (Fig. 2B). These data show that concentrations of Baf A1 up to 1 μM have neither a cytotoxic nor a proapoptotic effect on the two cell lines under these experimental conditions.
Fig. 2. Treatment with ≤ 1.0 μM V-ATPase inhibitor (bafilomycin A1) for 60 min or for 24 h is not cytotoxic or proapoptotic.

(A) MDCK (red) and A549 (blue) cells were treated with solvent or with the indicated concentrations of Baf A1 for 60 min or 24 h. The metabolic activity of cells (calculated as a percentage of activity in untreated controls) was measured by MTT assay. Values are the means (SE) from four independent experiments. (B) MDCK and A549 cells were treated for 60 min or 24 h with solvent (red) or 1.0 μM Baf A1 (black) or for 2 h with 12 μM camptothecin (blue; positive control for metabolically inactive/dead cells). FACS analysis of MitoSense Red and Calcein AM staining were performed to measure mitochondrial membrane potential changes (early apoptosis) or changes in cellular activity (late apoptosis), respectively. The histogram plots represent the total number of cells from three independent experiments.
To measure V-ATPase-stimulated ΔpHi, cells were glucose-starved for 60 min before virus addition (b.v.a.) in medium containing a very low glucose concentration (0.1 mM) to induce dissociation (i.e., inactivation) of the V-ATPase complex (Kane, 2006). As shown in Fig. 3A, ΔpHi was measured as relative fluorescence units (RFU) 0 min and 60 min a.v.a. in the presence of solvent, Baf A1, U0126 or ZSTK474 or after stimulation with 25 mM glucose (a positive control for V-ATPase stimulation) (Beyenbach & Wieczorek, 2006, Kane, 2006, Sautin et al., 2005). At 0 min, mean fluorescence values did not differ significantly in any samples. At 60 min, the highest mean RFU was obtained from negative controls (no virus, no glucose stimulation) and was assigned a ΔpHi value of 1.0. Glucose stimulation (25 mM) efficiently upregulated V-ATPase activity at 60 min a.v.a., causing pHi to decline ~0.55 pH units in MDCK and ~0.52 pH units in A549 cells as compared to unstimulated cells (Fig. 3A). Infection with PR/8 at MOI = 5 induced a similar reduction of pHi; ~0.58 pH units and ~0.51 pH units in MDCK and A549, respectively (Fig. 3A). In contrast, after inhibition of V-ATPase activation with 0.5 μM Baf-A1, the drop in pHi was significantly reduced by ~0.47 units in MDCK cells and ~0.25 units in A549 cells as compared to solvent-treated infected cells. Reduction of pHi was also prevented when infected cells were treated with signaling inhibitors. In infected cells treated with U0126 (20 μM), the pHi was ~0.40 (MDCK cells) and ~0.20 (A549 cells) units higher than the pHi in untreated infected cells. In our model system, the effect of ZSTK474 (5 μM) on V-ATPase-mediated intracellular acidification was less marked than that of Baf-A1 and U0126 (ΔpHi was ~0.29 units higher in MDCK cells and ~0.16 units in A549 cells compared to those in untreated infected cells) but was statistically significant.
Fig. 3. Infection with human influenza virus A/PR/8/34 (H1N1) stimulates V-ATPase activity mediated by ERK and PI3K signaling.

(A) MDCK and A549 cells were glucose-starved for 60 min. Intracellular pH change (ΔpHi) was measured 0 min and 60 min after virus addition (PR/8, MOI = 5) in the presence of Baf-A1 (yellow), U0126 (green) or ZSTK474 (blue). Treatment with solvent (red) and 25 mM glucose (gray) served as negative and positive controls, respectively, for V-ATPase activation. Results are the mean (SE) of three independent experiments. ** P < 0.001, * P < 0.01, one-way ANOVA and Tukey’s post test. (B) V-ATPase-dependent acidification of intracellular compartments 60 min after addition of PR/8 (MOI = 5) in the presence or absence of the indicated inhibitors. Green fluorescence indicates acidity-specific DAMP labeling. Nuclei are red. Magnification 63x. (C) Colocalization of DAMP-positive structures (green) with mannose 6-phosphate receptor (M6PR, red), a marker of late endosomes, 60 min after addition of PR/8 (MOI = 5). Nuclei are blue. Magnification 63x. (D) Effect of glucose deprivation and stimulation on viral replication in infected cells (PR/8, MOI =1). Virus-containing supernatants were assayed 9 h p.i. Values are the mean (SE) of four independent experiments. *P < 0.001, one-way ANOVA and Tukey’s post test.
We next studied the V-ATPase-stimulated acidification of intracellular compartments upon IAV infection. The acidic pH probe 3-(2,4-dinitroanillino)-3′-amino-N-methyldipropylamine (DAMP), which penetrates the plasma membrane and accumulates in cellular compartments with low pH, was previously shown to colocalize with V-ATPases in renal tubular epithelial cells, and all DAMP-positive compartments were also found to be stained with V-ATPase V1-specific antibody (Yurko & Gluck, 1987). Therefore, we used DAMP to detect V-ATPase-dependent acidic compartments. Unstimulated and uninfected MDCK and A549 cells maintained in 0.1 mM glucose showed few acidic intracellular compartments (Fig. 3B). After glucose stimulation (25 mM) for 60 min, bright vesicles were scattered asymmetrically in the cytoplasm and around the nuclei. The fluorescence intensity and distribution of DAMP-positive structures were similar in glucose-stimulated cells and in IAV-infected cells (PR/8, MOI = 5) 60 min a.v.a. DAMP accumulation was more prevalent in MDCK cells, indicating higher V-ATPase activity in the kidney epithelial cell line. The acidic vesicle content of IAV-infected cells treated with Baf-A1, U0126 or ZSTK474 was comparable to or less than that of control cells (Fig. 3B). Therefore, the V-ATPase activation necessary for maintaining low pH in intracellular compartments is induced upon IAV infection and requires active ERK and PI3K signaling pathways.
We next examined whether DAMP-positive structures colocalized with cation-independent mannose 6-phosphate receptor (CI-M6PR), a well-established marker of late endosomes (Kornfeld & Mellman, 1989). MDCK and A549 cells were PR/8-infected (MOI = 5) and DAMP/CI-MPR colocalization was analyzed 60 min a.v.a. The intensity of DAMP-positive structures was substantially lower in uninfected control cells than in virus-infected cells (Fig. 3C). In contrast, V-ATPase-induced DAMP accumulation colocalized well with the CI-M6PR marker in the merged images of virus-infected cells, suggesting that IAV infection induces higher V-ATPase activity in late endosomes.
Despite glucose deprivation, cells infected with IAV showed upregulated V-ATPase activity. We therefore compared virus replication under glucose-deprived (0.1 mM) and glucose-stimulated (25 mM) conditions. MDCK and A549 cells were infected with PR/8 (MOI = 1), and virus-containing supernatants were collected after 9 h (one viral replication cycle). Consistent with the above results, glucose stimulation did not substantially increase virus titers (Fig. 3D); V-ATPase was fully activated upon IAV infection regardless of the glucose concentration. Treatment with Baf-A1 (0.5 μM) impeded glucose-induced V-ATPase activation and significantly reduced virus titers (Fig. 3D).
Influenza A virus-activated ERK and PI3K interact with subunit E of the V1 domain of V-ATPase
Subunit E of V-ATPase interacts directly with cellular factors involved in regulation of signal transduction pathways. It was shown that the V-ATPase E protein colocalizes with and binds to the Dbl homology domain of the guanine nucleotide exchange factor mSOS, linking V-ATPase with the small G protein Rac1 (Miura et al., 2001). In addition, subunits E and G of V1 V-ATPase interact with the regulator of H+-ATPase of vacuolar and endosomal membranes (RAVE) complex (Kane & Smardon, 2003, Smardon et al., 2002). To evaluate whether IAV-activated ERK or PI3K interact with V1 subunit E, we immunoprecipitated V-ATPase holoenzyme from lysates of MDCK and A549 cells 60 min a.v.a. (PR/8, MOI = 5) by using antibodies specific for phosphorylated ERK1/2 (P-ERK) and for phosphorylated regulatory subunit p85α of PI3K (P-PI3K). Cells were glucose-deprived (0.1 mM) for 60 min b.v.a. Immunoblot analyses using anti-subunit E antibody distinctly revealed these proteins in infected MDCK cells and A549 cells (Fig. 4A), suggesting that P-ERK and P-PI3K interact directly or form a complex with V1 subunit E. Although mock-infected control cells yielded P-ERK and P-PI3K bands after immunoprecipitation with anti-subunit E antibody, these bands were much less prominent than those from infected cells.
Fig. 4. The V-ATPase V1 domain subunit E interacts with ERK and PI3K in influenza A virus-infected cells.

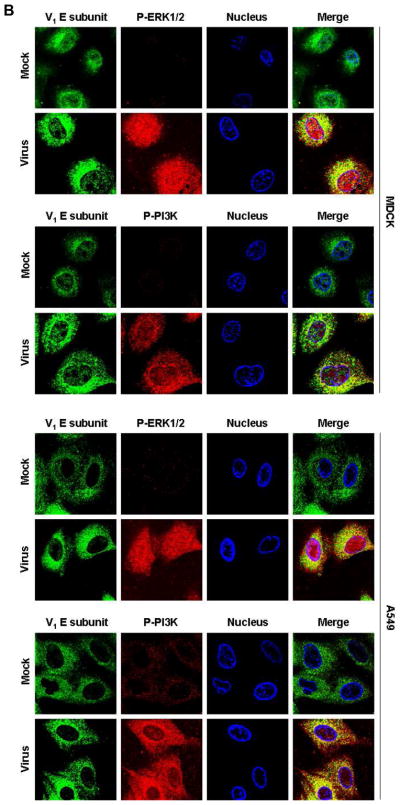
(A) V-ATPase was immunoprecipitated from MDCK or A549 cell lysates 60 min after addition of PR/8 (MOI = 5) with antibodies specific for the phosphorylated form of ERK1/2 (P-ERK1/2) or PI3K (P-PI3K p85α) (upper panels), and P-ERK1/2 and P-PI3K p85α were immunoprecipitated with antibody to subunit E of the V-ATPase V1 (lower panels). Co-immunoprecipitated products were analyzed by Western blotting. Equal protein loading of P-ERK1/2, P-PI3K and V1 E subunit was verified by Western blots using the respective specific antibodies. (B) Colocalization of V-ATPase V1 subunit E (green) with P-ERK1/2 and P-PI3K p85α (both shown in red) 60 min after addition of PR/8 (MOI = 5). Merged images show colocalization of V1 E subunit with P-ERK1/2 or P-PI3K. Magnification 63x.
To corroborate the interaction of P-ERK and P-PI3K with V1 subunit E, we performed immunofluorescence experiments in cells that had been glucose-starved (0.1 mM glucose) for 60 min b.v.a. Immunostaining of V1 subunit E showed clear localization of V-ATPases in vesicles scattered throughout the cytoplasm and clustered around the nuclei in PR/8-infected (MOI = 5) MDCK and A549 cells (Fig. 4B). When activated, ERK1/2 phosphorylates nearby targets in the cytoplasm or translocates to the nucleus (Yao & Seger, 2009). Here, we observed that P-ERK had indeed migrated into the nuclei of infected cells, although a considerable amount remained scattered in the cytoplasm. Phosphorylation and nuclear localization of ERK were nearly undetectable in uninfected cells. Merged images of V1 subunit E and P-ERK in infected cells showed partial colocalization of both proteins in the cytoplasm (Fig. 4B). Similarly, P-PI3K signal was negligible in uninfected cells. In infected cells, predominantly cytoplasmic staining of P- PI3K was seen. Both V1 subunit E and P-PI3K colocalized exclusively in the cytoplasm in infected cells.
Active V-ATPase is required for efficient nuclear RNP import and replication/transcription of viral RNAs
V-ATPase is responsible for creating the low-pH environment of the endosomal compartment (Nishi & Forgac, 2002, Schoonderwoert & Martens, 2001), which allows IAV uncoating at an early stage of infection (Guinea & Carrasco, 1995, Ochiai et al., 1995). To verify that V-ATPase activity is crucial for the downstream nuclear import of viral RNP complexes, we employed a strategy previously used to examine endocytotic entry of IAV (Sieczkarski et al., 2003). MDCK and A549 cells were inoculated with a very high virus dose (MOI = 200, to allow detection of incoming virus), kept at 4°C for 30 min to allow virus binding, and then incubated at 37°C for 60 min in the presence of solvent, Baf A1 (0.5 μM), U0126 (20 μM) or ZSTK474 (5.0 μM). Nuclear RNP import was analyzed 2 h post-infection (p.i.) by confocal microscopy. Immunofluorescence analysis with an antibody to the viral nucleoprotein (NP, the major constituent of the viral RNPs) showed entry of the viral RNP complexes into the nuclei of solvent-treated cells 2 h p.i. (Fig. 5A); the greater number of nuclear NP-positive MDCK cells indicated greater susceptibility of this cell line to IAV infection. In contrast, RNP complexes were retained in the cytoplasm (MDCK) or the cytoplasm and cell membrane (A549) in Baf A1-treated cells, demonstrating that Baf A1 inhibits virus entry at the stage of endosomal acidification. Although the effect of ZSTK474 treatment was less remarkable than the effect of Baf A1 treatment, the majority of RNPs were found in the cytoplasm of infected cells (particularly MDCK cells) treated with ZSTK474. ERK inhibition had a negligible effect on nuclear RNP import; RNP complexes were localized predominantly in the nuclei of infected cells (Fig. 5A).
Fig. 5. Inhibition of V-ATPase activation impairs release of viral genome and nuclear accumulation of viral RNA.


(A) Nuclear import of viral ribonucleoprotein (RNP) complexes (green) 2 h after infection with PR/8 (MOI = 200) in the presence of solvent, Baf-A1 (0.5 μM), U0126 (20 μM) or ZSTK474 (5.0 μM). RNPs were detected with anti-nucleoprotein (NP) antibody. Magnification 40x. (B) Quantification of NP-positive cells 60 min after virus addition (PR/8, MOI = 10) in the presence of solvent, Baf-A1 (0.5 μM), U0126 (20 μM) or ZSTK474 (5.0 μM). Stained cells were visualized and quantified by FACS. Results in solvent-control cells were assigned a value of 100%. Values are the mean (SE) of three individual experiments. *, P < 0.001, two-tailed unpaired t-test. (C) Effect of Baf A1 on replication and transcription of viral vRNA, cRNA, and mRNA. MDCK or A549 cells (upper panels) were infected with PR/8 (MOI = 2.5) and treated with Baf A1 at the indicated concentrations. Total RNA was isolated 6 h p.i. and analyzed by primer extension assay using PB1 gene-specific primers. 293T cells (lower panel) were treated with the indicated Baf A1 concentrations for 60 min before transfection with the pol I-CAT-RT plasmid encoding CAT in the negative sense, and plasmids expressing viral PB2, PB1, PA and NP. Total RNA was isolated 24 h post-transfection and analyzed by primer extension assay using CAT gene-specific primers. Expression of cellular 5s rRNA was used as a loading control. (D) MDCK cells were infected with PR/8 (MOI = 0.0025) and treated with 0.01 μM Baf A1 (i) 60 min before virus addition or (ii) 0 min, (iii) 15 min, (iv) 30 min, or (v) 60 min after virus addition. Supernatants were assayed 24 h p.i. ** P < 0.001, * P < 0.01, two-tailed unpaired t-test. (E) MDCK cells were simultaneously infected with PR/8 (MOI = 0.0025) and treated with the indicated concentrations of the H+/K+-ATPase inhibitor esomeprazole for 60 min. Virus was titrated in supernatants collected 24 h p.i. Values are the mean (SE) from three experiments. (F) Left panel: MDCK cells were transfected simultaneously with the indicated concentrations of 2 siRNAs specific for the E2 subunit isoform (ATP6V1E2) of the V-ATPase V1 domain for 24 h prior to virus infection (PR/8, MOI = 0.0025). Virus- containing supernatants were harvested 24 h p.i. Values are the mean (SE) of three independent experiments. * P < 0.05, 1-way ANOVA with Dunnet’s post-test. Right panel: the relative percentage of viable cells was measured by MTT cell proliferation assay to rule out cytotoxicity caused by the siRNA treatment. Each bar represents the means (SE) from three independent experiments.
To verify whether the blockade of virus binding and internalization was the mechanism of impaired nuclear RNP import, we performed FACS analysis as in the immunofluorescence experiment above but with an MOI = 10. Comparable proportions of Baf A1-, U0126- and solvent-treated MDCK cells were NP+, showing that inhibition of V-ATPase and ERK activation did not influence virus uptake (Fig. 5B). In contrast, significantly fewer cells (~50% fewer than with solvent-only treatment) were NP+ after treatment with ZSTK474, indicating that the PI3K/Akt pathway can directly regulate virus internalization. The number of NP+ A549 cells was lower after ZSTK474 treatment than after Baf A1 and U0126 treatment, but no statistically significant difference was found (Fig. 5B).
Next, to confirm that replication and transcription of viral RNAs within the nucleus are dependent on upstream V-ATPase activity, we infected MDCK and A549 cells with PR/8 (MOI = 2.5) and treated them with different concentrations of Baf A1. Cells were lysed 6 h p.i. and total RNAs were isolated. The presence of viral vRNA, cRNA, and mRNA was detected by primer extension assay using radioactively labeled primers for viral negative-strand and positive-strand RNAs derived from the PB1 gene segment. Small cellular 5s rRNA served as a loading control for total RNA. The three viral RNA species were detected in cells treated with solvent (Fig. 5C, upper panels). Overall, less viral cRNA than vRNA and mRNA was identified. Baf A1 completely inhibited replication/transcription of viral RNAs in both cell lines, although a 10-fold increase in Baf-A1 concentration was required in MDCK cells.
Since V-ATPase activity is essential for efficient RNP release and subsequent viral genome replication/transcription in infected cells, cell treatment with Baf A1 should not affect the expression of RNP complexes in transfected cells. In a mini genome–based expression assay, human embryonic kidney epithelial 293T cells were treated with Baf A1 for 60 min, then transfected with the pol I-driven plasmid (pol-I-CAT-RT) encoding the chloramphenicol acetyltransferase (CAT) open reading frame in negative polarity (Pleschka et al., 1996) and pol I/pol II-responsive plasmids that express the viral PB2, PB1, PA, and NP proteins of the PR/8 virus (Hoffmann et al., 2000). The primer extension assay was performed by using two CAT-specific primers to detect viral vRNA, mRNA and cRNA. As anticipated, no difference in viral vRNA and mRNA accumulation was detected in cells treated with different Baf A1 concentrations versus solvent (Fig. 5C, lower panel). An increase, rather than a decrease, was found in samples after Baf A1 treatment. The negative control (without PB1 plasmid) showed only the vRNA band expressed from the pol I-CAT-RT, but no viral mRNA was visible.
To demonstrate the timing of the inhibitory effect of Baf A1 on the IAV entry process, we performed a growth kinetic assay by adding the inhibitor at different time points before and after infection. MDCK cells were infected with PR/8 at an MOI = 0.0025 and treated for 60 min with 0.01 μM Baf A1, starting 60 min b.v.a or 0, 15, 30, or 60 min a.v.a. Virus-containing supernatants were collected 24 h p.i. A significant reduction in virus titers (2–3 log10 lower than in solvent-treated controls) was observed when Baf A1 was added 60 min b.v.a. and 0 min a.v.a. (Fig. 5D). The differences in virus titers between solvent- and Baf A1-treated cells declined progressively as the inhibitor was added at increasingly later time points, supporting the role of V-ATPase in an early stage of the virus replication cycle. However, differences were statistically significant at all analyzed time points.
Finally, we investigated the specificity of Baf A1 on V-type ATPases by cell treatment with esomeprazole, a proton pump inhibitor that inhibits H+/K+-ATPase in gastric parietal cells (Beck, 2004). MDCK cells were infected (PR/8, MOI = 0.0025) and simultaneously treated for 60 min with different concentrations of esomeprazole. Virus-containing supernatants were collected and titrated 24 h p.i. Esomeprazole treatment did not affect IAV replication (Fig. 5E). No significant reduction in virus titers was observed in infected cells treated with this type of proton inhibitor, demonstrating the specific effect of Baf A1 on V-ATPases essential for replication of IAV. In contrast, infectious virus titers decreased significantly (as compared to control titers) in infected MDCK cells (PR/8, MOI = 0.0025, 24 h p.i.) in which expression of the E2 subunit isoform (ATP6V1E2) of V1 V-ATPase (found in all tissues [Sun-Wada et al., 2002]), was suppressed by treatment for 24 h with siRNA (Fig. 5E; left panel) at non-toxic concentrations as measured by MTT assays (Fig. 5E; right panel). These results provide further evidence of the important role of the E subunit of V1 V-ATPase in viral replication.
Discussion
It was previously unknown whether IAV-induced early activation of ERK and PI3K plays a role in V-ATPase activity. Here we present a novel mechanism of signaling-regulated influenza virus entry in which IAV-induced early activation of the ERK and PI3K pathways mediates the upregulation of V-ATPase activity, leading to endosomal acidification and allowing the fusion of virus particles with the endosomal membrane (see model, Fig. 6). We used Baf A1 as a high-affinity inhibitor of V-ATPase (Bowman et al., 1988) that interacts with the V0 subunit c (Bowman & Bowman, 2002, Bowman et al., 2004) and impairs translocation of protons into acidic compartments. This class of antibiotic is able to clearly differentiate between the three types of ATPases: F-ATPases are not affected, whereas P-ATPases are inhibited at micromolar concentrations and V-ATPases at nanomolar concentrations (Drose & Altendorf, 1997). Because all of our studies used a nanomolar range of Baf A1 concentrations, it is highly likely that we targeted only V-ATPases. Moreover, treatment of infected cells with another proton pump inhibitor, esomeprazole, which inhibits the activity of H+/K+-ATPase, had no significant effect on IAV titers, confirming the specific action of Baf A1 on V-ATPases.
Fig. 6. Schematic representation of V-ATPase activation by influenza A virus-induced ERK and PI3K signaling.

The virus-induced early activation of ERK and PI3K pathways during the viral entry stage upregulates V-ATPase activity (measured 60 min after virus addition), causing acidification of the endosomal compartment. Acidification is necessary for successful fusion of virus particles with the endosomal membrane and release of the viral genome into the cytoplasm, from which it translocates to the nucleus. ERK and PI3K p85α (the regulatory subunit of PI3K) colocalize and interact with V-ATPase in late endosomes.
V-ATPase activity, as measured by reduction of pHi, was diminished in infected cells treated with the V-ATPase inhibitor Baf A1. Interestingly, inhibition of either ERK or PI3K activation by specific inhibitors prevented the reduction of pHi, indicating that both kinases are involved in regulation of V-ATPase activation. PI3K has been shown to mediate glucose-stimulated V-ATPase activation in porcine renal epithelial cells (Sautin et al., 2005). However, PI3K-mediated ΔpHi in our model system was less remarkable than that mediated by ERK. Therefore, the ERK pathway may more strongly influence V-ATPase activity in the context of IAV infection.
Angiotensin II has been shown to stimulate V-ATPase in acid-secretory type A intercalated cells through Ca2+-dependent and -independent isoforms of protein kinase C (PKC) (Rothenberger et al., 2007). Because different isoforms of PKC can directly or indirectly activate the Raf/MEK/ERK signal cascade (Rozengurt, 2007), PKC may contribute to IAV-induced early activation of ERK, and subsequently to V-ATPase activation. In addition, PKCβII is required for successful endocytic trafficking during IAV entry (Sieczkarski et al., 2003). The phosphorylation of PKCβII, however, does not appear to affect the V-ATPase-dependent endosomal acidification needed to trigger HA conformational change (Sieczkarski et al., 2003).
We also analyzed V-ATPase-dependent acidification by using a probe (DAMP) to visualize intracellular acidic compartments. In both MDCK and A549 cells, DAMP visualization was reduced by glucose starvation but was greatly increased by glucose stimulation or virus inoculation. DAMP visualization was substantially greater in MDCK cells than in A549 cells after IAV infection, consistent with the finding that the kidney (particularly its epithelium) has the highest V-ATPase activity among mammalian tissues (Gluck et al., 1996). DAMP accumulation in response to IAV infection was effectively diminished by inhibition of ERK or PI3K, confirming that these kinases are involved in V-ATPase regulation. Moreover, V-ATPase-induced acidic compartments colocalized with a well-established marker of late endosomes, suggesting that IAV-stimulated V-ATPases accumulate predominantly in endocytic compartments.
Although it is not clear whether V-ATPase subunits have 3-phosphoinositide-binding domains, V-ATPase is reported to colocalize with the p85 regulatory subunit of PI3K in osteoclasts (Nakamura et al., 1997). No direct interaction between ERK and V-ATPase has previously been shown. We found that the V1 subunit E protein of V-ATPase was immunoprecipitated by antibodies specific for P-ERK1/2 or P-PI3K (p85α) and vice versa. In addition, the kinases ERK (partially) and PI3K (fully) colocalized with V1 subunit E in the cytoplasm. Unlike E1, the E2 subunit isoform is present in all mouse tissues, including kidney and lung (Sun-Wada et al., 2002). The fact that siRNA-mediated gene silencing of E2 resulted in decreased virus titers confirmed the important role of the E subunit of V1 V-ATPase in viral replication, and based upon our findings, V-ATPase activation seems to be regulated, at least in part, through interaction of E subunit with virus-activated ERK and PI3K signaling molecules.
We speculate that upon IAV infection, activated ERK and PI3K bind to V-ATPase, presumably on the endosomal membrane, and thereby mediate V-ATPase activation. While ERK1/2 undergo massive translocation into the nucleus upon IAV infection, considerable quantities remain in the cytoplasm. This finding is consistent with the observed translocation of many ERK1/2 molecules to different intracellular organelles, mainly the nucleus, upon stimulus-dependent release from their cytoplasmic anchors (Yao & Seger, 2009). Other findings appear to be consistent with interaction between the V1 subunit E and the ERK and PI3K kinases in the endosomal compartment. First, upon stimulation-induced phosphorylation of ligand-bound G-protein coupled receptor (GPCR) by GPCR kinase (GRK), MEK1/2 and ERK1/2 are reported to localize in early endosomes, to which they are recruited mainly by β-arrestin (Luttrell et al., 2001, Yao & Seger, 2009). Second, the PI3K product, phosphatidylinositol 3-phosphate, is highly enriched in early endosomes and in the internal vesicles of multivesicular endosomes and colocalizes extensively with the early endosomal autoantigen EEA1 (Gillooly et al., 2000). However, the potential role of scaffold proteins in mediating the interaction between V1 subunit E and P-ERK or P-PI3K should also be considered.
Scaffold proteins are known to be involved in tethering signaling components (Ferrell, 2000, Levchenko et al., 2000) and localizing these components to specific areas of the cell (Wong & Scott, 2004). The virus entry assay indicates that Baf A1-mediated V-ATPase inhibition efficiently prevents the nuclear import of incoming RNP complexes and that this effect is not a result of impaired virus binding or internalization. Interestingly, while U0126-mediated inhibition of early ERK activation did not affect virus internalization, ZSTK474-mediated inhibition of early PI3K activation significantly inhibited nuclear RNP import and reduced the number of NP+ cells. This finding suggests that PI3K functions as a signaling mediator that may be involved in earlier, V-ATPase-independent infection-promoting events. These results are consistent with a previous report demonstrating the role of the PI3K/Akt signaling cascade in influenza virus uptake (Ehrhardt et al., 2006). Upregulation of the pathway appears to be mediated through the epidermal growth factor receptor (EGFR) and other receptor tyrosine kinases (RTKs) upon virus binding (Eierhoff et al., 2010). Taken together, our observations indicate that V-ATPase activity is a crucial factor for IAV replication and that IAV infection stimulates V-ATPase activity by triggering ERK and PI3K signaling during virus entry.
Experimental Procedures
Cells, viruses, and infection
MDCK, A549 and 293T cells were cultured at 37°C with 5% CO2 in MEM, FK12 and OptiMEM medium (ATCC), respectively, supplemented with 10% fetal bovine serum (FBS), penicillin (100 U/ml), and streptomycin (10 μg/ml). A/Puerto-Rico/8/34 (H1N1) was rescued by using 8-plasmid reverse genetics as previously described (Hoffmann et al., 2000). For virus infection, cells were washed with phosphate-buffered saline (PBS) and incubated with virus at the indicated MOI for 60 min. The inoculum was aspirated and cells were incubated with medium containing 4% bovine serum albumin (BSA) and antibiotics. Supernatants were collected at specific intervals to determine virus titers by standard plaque assay.
Measurement of intracellular pH
Intracellular pH was measured as described by Salvi et al. (Salvi et al., 2002), with adjustments for MDCK and A549 cell lines. Cells were grown to 90% confluence and detached with trypsin. Cellular activity was immediately quenched with culture medium containing 10% FBS, and the cells were pelleted and rinsed once. The cells were resuspended in fresh medium, allowed to recover in 5% CO2 at 37°C for 60 min, rinsed twice with bicarbonate-free Krebs-Hepes buffer (130 mM NaCl, 4.7 mM KCl, 1.2 mM MgSO4, 1.2 mM KH2PO4, 11.7 mM D-glucose, 1.3 mM CaCl2, 10 mM HEPES, pH 7.4), and then treated with 0.5 μM CellTracker Green CMFDA (5-chloromethylfluorescein diacetate, the most stable pH-dependent fluorescent indicator dye (Invitrogen)), in bicarbonate-free Krebs-Hepes buffer (pH 7.4) under agitation for 15 min at 37°C. Cells were rinsed twice with buffer, resuspended in fresh medium, and allowed to recover in 5% CO2 at 37°C for 60 min. The cells were then rinsed 3 times with bicarbonate-free Krebs-Hepes buffer (pH 7.4), resuspended, diluted, distributed evenly (approximately 35, 000 cells/well) into an opaque black 96-well plate, and incubated for 2 h in bicarbonate- free Krebs-Hepes buffer (pH 7.4) containing 5% FBS at 5% CO2 and 37°C for 2 h (MDCK) or 4 h (A549). Cells were then glucose-starved for 60 min in bicarbonate-free Krebs-Hepes buffer (pH 7.4) containing 0.1 mM glucose. Each 16-well section was left untreated or was treated with 25 mM glucose, virus (MOI = 5), virus and 0.5 μM bafilomycin A1 (Tocris Bioscience), virus and 20 μM U0126 (Promega), or virus and 5 μM ZSTK474 (LC Laboratories). The intracellular pH was measured 0 min and 60 min after treatment at 37°C with the Synergy 2 fluorescence plate reader (BioTek). For each experiment, an in situ calibration procedure with the H+/K+ exchanger nigericin (Invitrogen) was performed to relate the fluorescence intensity at 485 nm to pH value by exposing the cells to different pH buffers (pH 2–9) in a depolarizing high-K+ buffer (140 mM KCl, 1.2 mM MgSO4, 1.2 mM KH2PO4, 11.7 mM D-glucose, 1.3 mM CaCl2, 10 mM HEPES, pH 3.0 to pH 9.0) in the presence of 20 μM nigericin.
Detection of acidic intracellular compartments
The acidic pH probe DAMP (Molecular Probes) was used to visualize intracellular compartments acidified by V-ATPase activity. Cells growing on coverslips were incubated for 60 min in culture medium containing 0.1 mM glucose. Cells were stimulated with 25 mM glucose, virus infection (MOI = 5) or virus with inhibitor in the presence of 50 μM DAMP for 60 min. Cells were fixed in 4% paraformaldehyde, permeabilized with 1% triton x-100, and incubated with rabbit polyclonal anti-DNP antibody (1:100) (Invitrogen) for 60 min, then with donkey anti-rabbit antibody AlexaFluor (AF)-488 (1:100) (Invitrogen) for 60 min. To detect the late endosome, cells were stained with mouse monoclonal anti-M6PR antibody (1:100) (Abcam) and donkey anti-mouse AF-555 (1:100) (Invitrogen).
Indirect immunofluorescence assay and confocal laser scanning microscopy
Cells were grown to 80% confluence on collagen-coated glass coverslips (BD). After stimulation or infection, cells were washed with PBS and fixed with 4% PFA in PBS for 30 min at room temperature or overnight at 4°C. Cells were permeabilized with 1% Triton X-100 in PBS for 10 min and incubated with mouse monoclonal antibody to influenza A virus NP (clone AA5H) (1:100) (Abcam), rabbit polyclonal antibody to vacuolar H+ ATPase subunit E (1:100) (Abcam), mouse monoclonal antibody to phosphorylated ERK1/2 (E-4) (1:00) (Santa Cruz Biotechnology), or goat polyclonal antibody to phosphorylated PI3K (p85α) (1:100) (Santa Cruz Biotechnology) for 60 min, then incubated with the respective AF-conjugated secondary antibody (1:100) (Invitrogen) for 60 min in the dark. Cells were washed twice with PBS and then with double-distilled water and mounted with para-phenylene diamine (Sigma Aldrich) containing 500 nM TO-PRO-3 (Invitrogen) nuclear stain. Fluorescence was visualized with a Zeiss LSM 510 META confocal laser scanning microscope.
RNA isolation and primer extension assays
Intracellular viral vRNA, cRNA, and mRNA were quantified as described by Robb et al. (Robb et al., 2009). Briefly, total RNA was isolated from cell lysates 6 h p.i. by using the RNeasy kit (Qiagen). Total RNA (~ 1 μg) was mixed with an excess of DNA primers, labeled at the 5′ end with 30 μCi of [γ-32P]ATP and T4 polynucleotide kinase, and denatured by heating to 95°C for 3 min. For primer extension, the mixture was cooled to 50°C, 100 U of SuperScript III reverse transcriptase in the accompanying reaction buffer (Invitrogen) was added, and the mixture was incubated for 90 min at 50°C. Two PB1 gene-specific primers for A/PR/8/34 were used in the separate reverse transcription reactions: 5′-TGATTTCGAATCTGGAAGGA-3′ (to detect vRNA) and 5′-TCCATGGTGTATCCTGTCCC-3′ (to detect mRNA and cRNA). A specific primer for cellular 5s rRNA (5′-TCCCAGGCGGTCTCCCATCC-3′) was included as an internal control for total RNA. Transcription products were separated on 8% polyacrylamide gel containing 7 M urea in TBE buffer and were detected by autoradiography.
Immunoprecipitation and Western blotting
Cells were lysed on ice for 30 min with Triton lysis buffer (TLB; 20 mM Tris-HCl, pH 7.4; 137 mM NaCl; 10% glycerol; 1% Triton X-100; 2 mM EDTA; 50 mM sodium glycerophosphate, 20 mM sodium pyrophosphate; 5 μg/ml aprotinin; 5 μg/ml leupeptin; 1 mM sodium vanadate, and 5 mM benzamidine). Immunoprecipitation using magnetic Dynabeads Protein A (Invitrogen) was performed according to the manufacturer’s instructions. Briefly, cell lysates were cleared by centrifugation and incubated with magnetic Dynabeads protein A that had been pre-incubated with 7.5 μg of rabbit polyclonal antibody to V-ATPase subunit E, mouse monoclonal antibody to phosphorylated ERK1/2 (E-4), goat polyclonal antibody to phosphorylated PI3K (p85α), or no antibody, for 1.5 h with rotation. Immunoprecipitated samples were separated by SDS-PAGE for Western blotting.
Fluorescence-activated cell sorting
One hour after virus addition, cells were detached with trypsin, fixed and permeabilized with Cytofix/Cytoperm solution (BD), and incubated with FITC-conjugated mouse anti-NP monoclonal antibody (clone IA52, 1:500; Argene) in PBS/3% BSA for 15 min on ice. The percentage of NP-expressing cells was determined by analysis on a FACSCalibur (BD Biosciences) flow cytometer.
MTT cell proliferation and apoptosis detection assay
Cells were grown in 96-well plates and treated with different concentration of Baf A1 or solvent for 60 min. Thereafter, cells were allowed to recover for 60 min in the fresh media. The tetrazolium bromide MTT (175 μg/ml) Sigma-Aldrich) was added for 90 min. Cells were fixed with 4% paraformaldehyde for 30 min at room temperature, air dried for 15 min and, after addition of isopropanol (150 μl/well), plates were vigorously agitated for 10 min. The plates were photometrically analyzed at 550 nm in an ELISA microplate reader (Bio-Rad). The mean value of each Baf A1 concentration was obtained from 16 wells. The solvent-treated control result was arbitrarily set as 100% metabolic active cells. To measure the level of drug-induced apoptosis, cells were grown in 6-well plates and treated under the same condition as for MTT assay. Detection of early (mitochondrial membrane potential) and late apoptotic events (change in cellular activity) were performed using the FlowCellect MitoLive Kit (Millipore) according to the manufacturer’s instructions.
Transient siRNA transfection
Homo sapiens ATP6V1E2 siRNA (Ambion) is a pool of 2 target-specific 21-nt siRNAs designed to silence gene expression of the E2 subunit isoform in human and mammalian cells. MDCK cells (in suspension) were transfected with siRNA duplex (0.5 μg or 1 μg) by using Lipofectamine 2000 (Invitrogen). A nontargeting siRNA was used as the control siRNA (Ambion) that does not cause specific degradation of any known cellular mRNA. Cells were transfected for 24 h, then inoculate at the indicated MOI. Virus-containing supernatants were harvested 24 h p.i.
Statistical analysis
ΔpHi and infectious virus titers in cultured MDCK and A549 cells were compared by two-tailed unpaired t-test or one-way analysis of variance (ANOVA) followed by Tukey’s or Dunnet’s post-test, using GraphPad Prism 5 (GraphPad). A probability value of P < 0.05 was considered to indicate statistical significance.
Acknowledgments
This work was supported by the National Institutes of Health, U.S. Department of Health and Human Services, under Contract No. HHSN266200700005C, and by the American Lebanese Syrian Associated Charities (ALSAC). We thank the World Health Organization’s Global Influenza Surveillance Network for providing the parental viruses. We acknowledge Stephan Pleschka, Stephan Ludwig, Christopher Scholtissek and Stacey Schultz-Cherry for advice and suggestions; Nicholas Negovetich, Jasmine McNeal and John Franks for excellent technical assistance; and James Knowles for administrative assistance. Scientific editing was provided by Sharon Naron.
Footnotes
Conflict of interest
The authors declare that they have no conflict of interest.
References
- Beck J. Efficacy of esomeprazole in patients with acid-peptic disorders. Gastroenterol Nurs. 2004;27:44–49. doi: 10.1097/00001610-200403000-00002. [DOI] [PubMed] [Google Scholar]
- Beyenbach KW, Wieczorek H. The V-type H+ ATPase: molecular structure and function, physiological roles and regulation. J Exp Biol. 2006;209:577–589. doi: 10.1242/jeb.02014. [DOI] [PubMed] [Google Scholar]
- Bowman BJ, Bowman EJ. Mutations in subunit C of the vacuolar ATPase confer resistance to bafilomycin and identify a conserved antibiotic binding site. J Biol Chem. 2002;277:3965–3972. doi: 10.1074/jbc.M109756200. [DOI] [PubMed] [Google Scholar]
- Bowman EJ, Graham LA, Stevens TH, Bowman BJ. The bafilomycin/concanamycin binding site in subunit c of the V-ATPases from Neurospora crassa and Saccharomyces cerevisiae. J Biol Chem. 2004;279:33131–33138. doi: 10.1074/jbc.M404638200. [DOI] [PubMed] [Google Scholar]
- Bowman EJ, Siebers A, Altendorf K. Bafilomycins: a class of inhibitors of membrane ATPases from microorganisms, animal cells, and plant cells. Proc Natl Acad Sci U S A. 1988;85:7972–7976. doi: 10.1073/pnas.85.21.7972. [DOI] [PMC free article] [PubMed] [Google Scholar]
- Brisseau GF, Grinstein S, Hackam DJ, Nordstrom T, Manolson MF, Khine AA, Rotstein OD. Interleukin-1 increases vacuolar-type H+-ATPase activity in murine peritoneal macrophages. J Biol Chem. 1996;271:2005–2011. doi: 10.1074/jbc.271.4.2005. [DOI] [PubMed] [Google Scholar]
- Davies SP, Reddy H, Caivano M, Cohen P. Specificity and mechanism of action of some commonly used protein kinase inhibitors. Biochem J. 2000;351:95–105. doi: 10.1042/0264-6021:3510095. [DOI] [PMC free article] [PubMed] [Google Scholar]
- Drose S, Altendorf K. Bafilomycins and concanamycins as inhibitors of V-ATPases and P-ATPases. J Exp Biol. 1997;200:1–8. doi: 10.1242/jeb.200.1.1. [DOI] [PubMed] [Google Scholar]
- Ehrhardt C, Marjuki H, Wolff T, Nurnberg B, Planz O, Pleschka S, Ludwig S. Bivalent role of the phosphatidylinositol-3-kinase (PI3K) during influenza virus infection and host cell defence. Cell Microbiol. 2006;8:1336–1348. doi: 10.1111/j.1462-5822.2006.00713.x. [DOI] [PubMed] [Google Scholar]
- Ehrhardt C, Wolff T, Pleschka S, Planz O, Beermann W, Bode JG, Schmolke M, Ludwig S. Influenza A virus NS1 protein activates the PI3K/Akt pathway to mediate antiapoptotic signaling responses. J Virol. 2007;81:3058–3067. doi: 10.1128/JVI.02082-06. [DOI] [PMC free article] [PubMed] [Google Scholar]
- Eierhoff T, Hrincius ER, Rescher U, Ludwig S, Ehrhardt C. The Epidermal Growth Factor Receptor (EGFR) Promotes Uptake of Influenza A Viruses (IAV) into Host Cells. PLoS Pathog. 2010:6. doi: 10.1371/journal.ppat.1001099. [DOI] [PMC free article] [PubMed] [Google Scholar]
- Ferrell JE., Jr What do scaffold proteins really do? Sci STKE. 2000;2000:pe1. doi: 10.1126/stke.2000.52.pe1. [DOI] [PubMed] [Google Scholar]
- Forgac M. Vacuolar ATPases: rotary proton pumps in physiology and pathophysiology. Nat Rev Mol Cell Biol. 2007;8:917–929. doi: 10.1038/nrm2272. [DOI] [PubMed] [Google Scholar]
- Gillooly DJ, I, Morrow C, Lindsay M, Gould R, Bryant NJ, Gaullier JM, Parton RG, Stenmark H. Localization of phosphatidylinositol 3-phosphate in yeast and mammalian cells. EMBO J. 2000;19:4577–4588. doi: 10.1093/emboj/19.17.4577. [DOI] [PMC free article] [PubMed] [Google Scholar]
- Gluck SL, Lee BS, Wang SP, Underhill D, Nemoto J, Holliday LS. Plasma membrane V-ATPases in proton-transporting cells of the mammalian kidney and osteoclast. Acta Physiol Scand Suppl. 1998;643:203–212. [PubMed] [Google Scholar]
- Gluck SL, Underhill DM, Iyori M, Holliday LS, Kostrominova TY, Lee BS. Physiology and biochemistry of the kidney vacuolar H+-ATPase. Annu Rev Physiol. 1996;58:427–445. doi: 10.1146/annurev.ph.58.030196.002235. [DOI] [PubMed] [Google Scholar]
- Gruenberg J, van der Goot FG. Mechanisms of pathogen entry through the endosomal compartments. Nat Rev Mol Cell Biol. 2006;7:495–504. doi: 10.1038/nrm1959. [DOI] [PubMed] [Google Scholar]
- Guinea R, Carrasco L. Requirement for vacuolar proton-ATPase activity during entry of influenza virus into cells. J Virol. 1995;69:2306–2312. doi: 10.1128/jvi.69.4.2306-2312.1995. [DOI] [PMC free article] [PubMed] [Google Scholar]
- Hanada H, Moriyama Y, Maeda M, Futai M. Kinetic studies of chromaffin granule H+-ATPase and effects of bafilomycin A1. Biochem Biophys Res Commun. 1990;170:873–878. doi: 10.1016/0006-291x(90)92172-v. [DOI] [PubMed] [Google Scholar]
- Hoekstra D, Klappe K. Fluorescence assays to monitor fusion of enveloped viruses. Methods Enzymol. 1993;220:261–276. doi: 10.1016/0076-6879(93)20088-k. [DOI] [PubMed] [Google Scholar]
- Hoffmann E, Neumann G, Kawaoka Y, Hobom G, Webster RG. A DNA transfection system for generation of influenza A virus from eight plasmids. Proc Natl Acad Sci U S A. 2000;97:6108–6113. doi: 10.1073/pnas.100133697. [DOI] [PMC free article] [PubMed] [Google Scholar]
- Kane PM. The where, when, and how of organelle acidification by the yeast vacuolar H+-ATPase. Microbiol Mol Biol Rev. 2006;70:177–191. doi: 10.1128/MMBR.70.1.177-191.2006. [DOI] [PMC free article] [PubMed] [Google Scholar]
- Kane PM, Smardon AM. Assembly and regulation of the yeast vacuolar H+-ATPase. J Bioenerg Biomembr. 2003;35:313–321. doi: 10.1023/a:1025724814656. [DOI] [PubMed] [Google Scholar]
- Kong D, Yaguchi S, Yamori T. Effect of ZSTK474, a novel phosphatidylinositol 3-kinase inhibitor, on DNA-dependent protein kinase. Biol Pharm Bull. 2009;32:297–300. doi: 10.1248/bpb.32.297. [DOI] [PubMed] [Google Scholar]
- Konig R, Stertz S, Zhou Y, Inoue A, Hoffmann HH, Bhattacharyya S, Alamares JG, Tscherne DM, Ortigoza MB, Liang Y, Gao Q, Andrews SE, Bandyopadhyay S, De Jesus P, Tu BP, Pache L, Shih C, Orth A, Bonamy G, Miraglia L, Ideker T, Garcia-Sastre A, Young JA, Palese P, Shaw ML, Chanda SK. Human host factors required for influenza virus replication. Nature. 2010;463:813–817. doi: 10.1038/nature08699. [DOI] [PMC free article] [PubMed] [Google Scholar]
- Kornfeld S, Mellman I. The biogenesis of lysosomes. Annu Rev Cell Biol. 1989;5:483–525. doi: 10.1146/annurev.cb.05.110189.002411. [DOI] [PubMed] [Google Scholar]
- Levchenko A, Bruck J, Sternberg PW. Scaffold proteins may biphasically affect the levels of mitogen-activated protein kinase signaling and reduce its threshold properties. Proc Natl Acad Sci U S A. 2000;97:5818–5823. doi: 10.1073/pnas.97.11.5818. [DOI] [PMC free article] [PubMed] [Google Scholar]
- Lu X, Masic A, Li Y, Shin Y, Liu Q, Zhou Y. The PI3K/Akt pathway inhibits influenza A virus-induced Bax-mediated apoptosis by negatively regulating the JNK pathway via ASK1. J Gen Virol. 2010 doi: 10.1099/vir.0.018465-0. [DOI] [PubMed] [Google Scholar]
- Ludwig S, Planz O, Pleschka S, Wolff T. Influenza-virus-induced signaling cascades: targets for antiviral therapy? Trends Mol Med. 2003;9:46–52. doi: 10.1016/s1471-4914(02)00010-2. [DOI] [PubMed] [Google Scholar]
- Ludwig S, Pleschka S, Planz O, Wolff T. Ringing the alarm bells: signalling and apoptosis in influenza virus infected cells. Cell Microbiol. 2006;8:375–386. doi: 10.1111/j.1462-5822.2005.00678.x. [DOI] [PubMed] [Google Scholar]
- Luttrell LM, Roudabush FL, Choy EW, Miller WE, Field ME, Pierce KL, Lefkowitz RJ. Activation and targeting of extracellular signal-regulated kinases by beta-arrestin scaffolds. Proc Natl Acad Sci U S A. 2001;98:2449–2454. doi: 10.1073/pnas.041604898. [DOI] [PMC free article] [PubMed] [Google Scholar]
- Miura K, Miyazawa S, Furuta S, Mitsushita J, Kamijo K, Ishida H, Miki T, Suzukawa K, Resau J, Copeland TD, Kamata T. The Sos1-Rac1 signaling. Possible involvement of a vacuolar H(+)-ATPase E subunit. J Biol Chem. 2001;276:46276–46283. doi: 10.1074/jbc.M102387200. [DOI] [PubMed] [Google Scholar]
- Mizumura K, Hashimoto S, Maruoka S, Gon Y, Kitamura N, Matsumoto K, Hayashi S, Shimizu K, Horie T. Role of mitogen-activated protein kinases in influenza virus induction of prostaglandin E2 from arachidonic acid in bronchial epithelial cells. Clin Exp Allergy. 2003;33:1244–1251. doi: 10.1046/j.1365-2222.2003.01750.x. [DOI] [PubMed] [Google Scholar]
- Mosmann T. Rapid colorimetric assay for cellular growth and survival: application to proliferation and cytotoxicity assays. J Immunol Methods. 1983;65:55–63. doi: 10.1016/0022-1759(83)90303-4. [DOI] [PubMed] [Google Scholar]
- Nakamura I, Sasaki T, Tanaka S, Takahashi N, Jimi E, Kurokawa T, Kita Y, Ihara S, Suda T, Fukui Y. Phosphatidylinositol-3 kinase is involved in ruffled border formation in osteoclasts. J Cell Physiol. 1997;172:230–239. doi: 10.1002/(SICI)1097-4652(199708)172:2<230::AID-JCP10>3.0.CO;2-D. [DOI] [PubMed] [Google Scholar]
- Nishi T, Forgac M. The vacuolar (H+)-ATPases--nature’s most versatile proton pumps. Nat Rev Mol Cell Biol. 2002;3:94–103. doi: 10.1038/nrm729. [DOI] [PubMed] [Google Scholar]
- Ochiai H, Sakai S, Hirabayashi T, Shimizu Y, Terasawa K. Inhibitory effect of bafilomycin A1, a specific inhibitor of vacuolar-type proton pump, on the growth of influenza A and B viruses in MDCK cells. Antiviral Res. 1995;27:425–430. doi: 10.1016/0166-3542(95)00040-s. [DOI] [PubMed] [Google Scholar]
- Parra KJ, Keenan KL, Kane PM. The H subunit (Vma13p) of the yeast V-ATPase inhibits the ATPase activity of cytosolic V1 complexes. J Biol Chem. 2000;275:21761–21767. doi: 10.1074/jbc.M002305200. [DOI] [PubMed] [Google Scholar]
- Pinto LH, Holsinger LJ, Lamb RA. Influenza virus M2 protein has ion channel activity. Cell. 1992;69:517–528. doi: 10.1016/0092-8674(92)90452-i. [DOI] [PubMed] [Google Scholar]
- Pleschka S, Jaskunas R, Engelhardt OG, Zurcher T, Palese P, Garcia-Sastre A. A plasmid-based reverse genetics system for influenza A virus. J Virol. 1996;70:4188–4192. doi: 10.1128/jvi.70.6.4188-4192.1996. [DOI] [PMC free article] [PubMed] [Google Scholar]
- Pleschka S, Wolff T, Ehrhardt C, Hobom G, Planz O, Rapp UR, Ludwig S. Influenza virus propagation is impaired by inhibition of the Raf/MEK/ERK signalling cascade. Nat Cell Biol. 2001;3:301–305. doi: 10.1038/35060098. [DOI] [PubMed] [Google Scholar]
- Robb NC, Smith M, Vreede FT, Fodor E. NS2/NEP protein regulates transcription and replication of the influenza virus RNA genome. J Gen Virol. 2009;90:1398–1407. doi: 10.1099/vir.0.009639-0. [DOI] [PubMed] [Google Scholar]
- Rothenberger F, Velic A, Stehberger PA, Kovacikova J, Wagner CA. Angiotensin II stimulates vacuolar H+-ATPase activity in renal acid-secretory intercalated cells from the outer medullary collecting duct. J Am Soc Nephrol. 2007;18:2085–2093. doi: 10.1681/ASN.2006070753. [DOI] [PubMed] [Google Scholar]
- Rozengurt E. Mitogenic signaling pathways induced by G protein-coupled receptors. J Cell Physiol. 2007;213:589–602. doi: 10.1002/jcp.21246. [DOI] [PubMed] [Google Scholar]
- Salvi A, Quillan JM, Sadee W. Monitoring intracellular pH changes in response to osmotic stress and membrane transport activity using 5-chloromethylfluorescein. AAPS PharmSci. 2002;4:E21. doi: 10.1208/ps040421. [DOI] [PMC free article] [PubMed] [Google Scholar]
- Sarkar SN, Peters KL, Elco CP, Sakamoto S, Pal S, Sen GC. Novel roles of TLR3 tyrosine phosphorylation and PI3 kinase in double-stranded RNA signaling. Nat Struct Mol Biol. 2004;11:1060–1067. doi: 10.1038/nsmb847. [DOI] [PubMed] [Google Scholar]
- Sautin YY, Lu M, Gaugler A, Zhang L, Gluck SL. Phosphatidylinositol 3-kinase-mediated effects of glucose on vacuolar H+-ATPase assembly, translocation, and acidification of intracellular compartments in renal epithelial cells. Mol Cell Biol. 2005;25:575–589. doi: 10.1128/MCB.25.2.575-589.2005. [DOI] [PMC free article] [PubMed] [Google Scholar]
- Schoonderwoert VT, Martens GJ. Proton pumping in the secretory pathway. J Membr Biol. 2001;182:159–169. doi: 10.1007/s00232-001-0040-2. [DOI] [PubMed] [Google Scholar]
- Shin YK, Liu Q, Tikoo SK, Babiuk LA, Zhou Y. Influenza A virus NS1 protein activates the phosphatidylinositol 3-kinase (PI3K)/Akt pathway by direct interaction with the p85 subunit of PI3K. J Gen Virol. 2007;88:13–18. doi: 10.1099/vir.0.82419-0. [DOI] [PubMed] [Google Scholar]
- Sieczkarski SB, Brown HA, Whittaker GR. Role of protein kinase C betaII in influenza virus entry via late endosomes. J Virol. 2003;77:460–469. doi: 10.1128/JVI.77.1.460-469.2003. [DOI] [PMC free article] [PubMed] [Google Scholar]
- Smardon AM, Tarsio M, Kane PM. The RAVE complex is essential for stable assembly of the yeast V-ATPase. J Biol Chem. 2002;277:13831–13839. doi: 10.1074/jbc.M200682200. [DOI] [PubMed] [Google Scholar]
- Van Den Berg JG, Aten J, Annink C, Ravesloot JH, Weber E, Weening JJ. Interleukin-4 and -13 promote basolateral secretion of H(+) and cathepsin L by glomerular epithelial cells. Am J Physiol Renal Physiol. 2002;282:F26–33. doi: 10.1152/ajprenal.0102.2001. [DOI] [PubMed] [Google Scholar]
- Voss M, Vitavska O, Walz B, Wieczorek H, Baumann O. Stimulus-induced phosphorylation of vacuolar H(+)-ATPase by protein kinase A. J Biol Chem. 2007;282:33735–33742. doi: 10.1074/jbc.M703368200. [DOI] [PubMed] [Google Scholar]
- Wong W, Scott JD. AKAP signalling complexes: focal points in space and time. Nat Rev Mol Cell Biol. 2004;5:959–970. doi: 10.1038/nrm1527. [DOI] [PubMed] [Google Scholar]
- Yao Z, Seger R. The ERK signaling cascade--views from different subcellular compartments. Biofactors. 2009;35:407–416. doi: 10.1002/biof.52. [DOI] [PubMed] [Google Scholar]
- Yurko MA, Gluck S. Production and characterization of a monoclonal antibody to vacuolar H+ATPase of renal epithelia. J Biol Chem. 1987;262:15770–15779. [PubMed] [Google Scholar]
- Zhirnov OP, Klenk HD. Control of apoptosis in influenza virus-infected cells by up-regulation of Akt and p53 signaling. Apoptosis. 2007;12:1419–1432. doi: 10.1007/s10495-007-0071-y. [DOI] [PubMed] [Google Scholar]