

Abstract
We are only beginning to understand the depth and breadth of microbial associations across the eukaryotic tree of life. Reliably assessing bacterial diversity is a key challenge, and next-generation sequencing approaches are facilitating this endeavor. In this study, we used 16S rRNA amplicon pyrosequencing to survey microbial diversity in ants. We compared 454 libraries with Sanger-sequenced clone libraries as well as cultivation of live bacteria. Pyrosequencing yielded 95,656 bacterial 16S rRNA reads from 19 samples derived from four colonies of one ant species. The most dominant bacterial orders in the microbiome of the turtle ant Cephalotes varians were Rhizobiales, Burkholderiales, Opitutales, Xanthomonadales, and Campylobacterales, as revealed through both 454 sequencing and cloning. Even after stringent quality filtering, pyrosequencing recovered 445 microbe operational taxonomic units (OTUs) not detected with traditional techniques. In comparing bacterial communities associated with specific tissues, we found that gut tissues had significantly higher diversity than nongut tissues, and many of the OTUs identified from these groups clustered within ant-specific lineages, indicating a deep coevolutionary history of Cephalotes ants and their associated microbes. These lineages likely function as nutritional symbionts. One of four ant colonies investigated was infected with a Spiroplasma sp. (order Entomoplasmatales), a potential ant pathogen. Our work shows that the microbiome associated with Cephalotes varians is dominated by a few dozen bacterial lineages and that 454 sequencing is a cost-efficient tool to screen ant symbiont diversity.
INTRODUCTION
Bacteria represent an essential functional component of all ecosystems. Although they form facultative to obligate associations that range from mutualism to parasitism with virtually every organism, we know little about their diversity and prevalence across most of the eukaryotic tree of life (1). At the very least, it is known that among insects, bacterial endosymbionts are widespread and often have a significant impact on their hosts' biology (2, 3). One of the best-characterized groups is comprised of insect-associated bacteria that upgrade their hosts' diets. These bacteria are often highly specialized and coevolved associates, playing particularly important roles in insects with nutritionally limited or deficient diets. Some well-known examples of such insect-microbe symbioses include Buchnera aphidicola in aphids (4), Blochmannia endosymbionts in the Camponotini ants (5), Wiggelsworthia glossinidia in tsetse flies (6), and the diverse microflora of termites (7–9).
Despite these fascinating findings, most studies on the diversity and function of bacterial symbionts are being performed using a limited range of model organisms. We therefore still know little about the identities and significance of bacteria associated with most animal groups (10, 11). Carefully analyzing the bacterial communities present in a wide range of eukaryotic taxa is necessary to understand the diversity and ecological function of such symbionts. Unfortunately, about 99% of all bacteria are not cultivable and we can only reliably assess their diversity using culture-independent methods (1).
With this in mind, it is important to develop efficient methods to assess and analyze bacterial communities across the tree of life. Sanger sequencing of the bacterial 16S rRNA gene has been used successfully to characterize diversity (e.g., see references 12 and 13). Tag-encoded FLX amplicon pyrosequencing is increasingly being used to characterize both bacterial communities (e.g., see references 14 to 16) and fungal communities (e.g., see references 17 and 18) from various environments. Such studies characterizing the microbiomes of insects are facilitating the discovery of the host-associated rare biosphere (19–22).
Ants are among the most abundant animal groups and often comprise more than 80% of the arthropods in tropical rain forests (23, 24). In addition, based on biomass estimates, arboreal ants appear to be much more abundant than their supposed prey organisms. Several hypotheses have been suggested as an explanation for “Tobin's ant-biomass paradox” (25), and it has been shown using stable isotope analyses that ecologically dominant ant taxa are more herbivorous than originally assumed and mainly feed on plant-derived resources (26). As plant-derived resources (e.g., honeydew and extrafloral nectar) are usually poor in nitrogen, it has been hypothesized that ants obtain nitrogen from symbiotic bacteria that recycle nitrogen waste or fix atmospheric nitrogen to provide essential nutrients to the ants (27–31). Taxa that are deprived of rich nitrogen sources, such as obligate plant ants, which exclusively feed on plant-derived food sources (32, 33), and other groups low on the trophic scale are prime candidates for symbiotic nitrogen provisioning.
Turtle ants of the genus Cephalotes are exclusively arboreal, as they nest inside twigs; Cephalotes varians nests primarily in mangroves. Turtle ants mainly make use of plant-derived food sources, such as extrafloral nectar or honeydew, and are considered predominantly herbivorous, as demonstrated in stable isotope analyses (26). The hypothesized core gut microbiota of the turtle ant species Cephalotes varians has been characterized using Sanger sequencing of the 16S rRNA gene, and evidence of symbiotic bacteria has been found (27, 30). In this study, we explored microbial communities from a variety of tissues and individuals. By comparing the results of (i) 454 pyrosequencing with (ii) bacterial 16S rRNA amplification, cloning, and Sanger sequencing and (iii) bacterial cultivation from live ants followed by PCR and Sanger sequencing of the 16S rRNA region, we provide a detailed survey of the microbes associated with herbivorous turtle ants, while directly comparing methods and their abilities to characterize bacterial diversity.
MATERIALS AND METHODS
Study species and sample preparation.
In our study, we focused on Cephalotes varians (Formicidae: Myrmicinae). Specimens were collected in the Florida Keys and either stored in 95% ethanol immediately until further analysis (colony CSM1280) or kept live for cultivation experiments (colonies CSM1235, CSM1323, and CSM1396). Live ants were maintained in the laboratory and supplied only with sterile 30% sucrose and sterile water ad libitum until the time of dissection (more than 14 weeks) to eliminate bacteria that are obtained through the diet, leaving behind the resident and symbiotic gut community. An overview of all samples that were subjected to culture-independent analyses is given in Table S1 in the supplemental material, while information on cultivated bacteria is given in Table S2.
To assess bacterial diversity associated with specific host organs or structures, the following protocols were implemented. In the lab, ants were dissected using a stereomicroscope (Leica M205 C). First, one single ant specimen was taken out of the collection vial (CSM1280) or the nest (CSM1235, CSM1323, and CSM1396) using sterile forceps and placed in a petri dish with 96% ethanol for 2 min to surface sterilize the specimen. Then, the specimen was transferred into a petri dish with sterile double-distilled water (ddH2O) for 2 min and subsequently placed in a sterile watchmaker glass under the stereomicroscope. The head was pulled off and transferred into a 1.5-ml reaction tube; a single leg was removed and put in a separate 1.5-ml reaction tube. The digestive tract was dissected under sterile ddH2O by carefully removing the abdominal segments, beginning at the posterior end. The individual parts of the digestive tract (i.e., the crop, the midgut, and the hindgut) were carefully pulled apart, without rupturing, using forceps. These were then individually placed in 1.5-ml collection tubes. Alternatively, the entire gut (crop, midgut, and hindgut) was used. Between dissecting different individuals, forceps and watchmaker glasses were washed with ddH2O and then with 10% bleach before being sterilized under UV light for 10 min.
For DNA extraction prior to 454 pyrosequencing and cloning, one Qiagen tungsten carbide bead was placed into each tube to break up the cell wall material of bacteria associated with the dissected ant body parts using the Qiagen TissueLyser (20 s at 30 rpm · s−1). To extract total genomic DNA, we used the Qiagen blood and tissue kit (Qiagen), following protocol B for insects. The final elution was performed with ddH2O. We extracted DNA of 21 samples for pyrosequencing, of which 13 were also subjected to cloning and Sanger sequencing.
454 pyrosequencing.
Bacterial tag-encoded titanium amplicon pyrosequencing (bTEFAP) was performed by the Research and Testing Laboratory (Lubbock, TX) as described by Dowd et al. (34). The 16S rRNA universal eubacterial primers 28F (5′-GAGTTTGATCNTGGCTCAG) and 519R (5′-GTNTTACNGCGGCKGCTG) were used to amplify approximately 500 bp of the variable regions V1 to V3. The samples included in the present study were multiplexed with samples not included in this study and were part of two separate quarter plates of different 454 runs.
PCR, cloning, and Sanger sequencing.
For Sanger sequencing of clone libraries, 16S rRNA fragments were amplified from genomic DNA with universal bacterial primers 9Fa (5′-GAGTTTGATCITIGCTCAG-3′) and 1513R (5′-TACIGITACCTTGTTACGACTT-3′) by following the protocols of Russell et al. (30). PCR products were cloned using the Invitrogen TopoTA cloning kit (vector 150 pCR2.1), using One Shot chemically competent E. coli cells for transformation and blue-white colony screening on LB plates with ampicillin and carbenicillin. We picked 24 to 110 white colonies from each cloning reaction. PCR of cloned products was performed with universal primers M13for and M13rev specific to the plasmids. An agarose gel (1% high melt) stained with ethidium bromide was run to verify insert size.
PCR products that had the target length were cleaned using ExoSap before cycle sequencing using the BigDye Terminator reaction kit (ABI PRISM, Applied Biosystems, Foster City, CA). Sequencing primers were the PCR primers 9Fa and 1513R, along with internal primers 319F, 559F, 953F, 559R, and 1072R (30). Sequence products were precipitated and loaded on an ABI 3730 (Applied Biosystems) automatic sequencer. Sequence fragments obtained were assembled with Geneious Pro 5.4 (35) and ambiguities manually corrected. Newly generated 16S rRNA sequences were combined with data published in association with Anderson et al. (27) (n = 304 previously generated sequences).
Primers used in the present study.
Different primers were used for cloning and Sanger sequencing and for 454 sequencing (as described above). Using RDP probe match (36), the first 10 bases of the forward primer 9Fa (cloning and Sanger sequencing) were an exact match to 88.02% of sequences (305,075/346,591) and to 98.97% (343,029/346,591) allowing one mismatch, while the forward primer 28F (454) was an exact match to 87.83% and to 98.64% with one mismatch. The 1513R reverse primer (cloning and Sanger sequencing) exactly matched 95.50% of databased sequences (102,442/107,267) and 99.33% with one mismatch, while the 519R (454) primer exactly matched 94.2% (1,749,896/1,857,322) and 99.13% with one mismatch.
Cultivation of bacteria.
For cultivation of live bacteria, dissected ant body parts were placed in 500 μl of liquid lysogeny broth (LB) medium and homogenized with a micropestle. Using sterile technique, 200 μl of the homogenate was plated onto LB agar plates. Cultures were incubated at 25°C and checked daily for bacterial growth. Morphologically unique colonies from every plate were transferred to new petri dishes, and DNA was extracted from these cultures as described above. PCR was performed using 16S rRNA primers 9Fa and 1513R, and PCR products were sequenced directly.
Bacterial 16S rRNA data processing and analysis.
All 16S rRNA pyrosequencing reads were analyzed using QIIME, version 1.2.0 (37). We imported bar-coded 16S rRNA gene sequences and removed the primers, demultiplexed reads, and then filtered them according to Phred quality scores. Quality criteria were a minimum sequence length of 200 bp, a maximum sequence length of 1,000 bp, and a minimum average quality score of 25. Using stringent quality control parameters, we allowed no ambiguous bases or mismatches in the primer sequence and no barcode errors, and a maximum homopolymer length of 6 bp. Sequence reads were then clustered into operational taxonomic units (OTUs) at 97% sequence similarity using UCLUST (38). We used the longest sequence in a cluster as the representative sequence for that OTU. Singletons, i.e., OTUs with only one read in the entire data set, were removed and chimeras were excluded using ChimeraSlayer (39). The closest BLAST hits for some sequences were from different orders, suggesting that chimeric sequences remained. Therefore, we also used the “BLAST fragments” method as implemented in QIIME to remove chimeras. We conducted a BLAST search against the SILVA database (http://www.arb-silva.de/) with the addition of sequences of all ant-associated bacteria from a previous study (30). The addition of these sequences decreased the number of OTUs that were determined to be chimeric. Bacterial taxonomic classifications of our sequences were obtained by BLAST searching against the SILVA database. Sequences were aligned against the greengenes database (http://greengenes.lbl.gov/cgi-bin/nph-index.cgi) using PyNAST (40) and filtered using the greengenes lanemask. The final alignment was used to construct phylogenetic trees using the default settings in FastTree2 (41). We summarized the proportions of identified taxa in each sample and calculated the amount of bacterial diversity shared between samples using the weighted UniFrac metric (42, 43) as implemented in QIIME. Similarity of samples was visualized for the weighted UniFrac analysis using principal coordinate analysis plots. Rarefaction curves were generated with iterations of 1,000 and increments of 10 (454 sequencing) and 1 (clones) using mothur, version 1.15.0 (44). Rarefaction curves were first generated separately for each sample. In addition, we pooled all parts of an individual ant if it had been dissected into different parts, pooled parts of the gut, pooled all samples per colony, and pooled all samples (excluding colony CSM1323).
In order to identify the most prevalent bacteria and their closest relatives, we clustered 500 random reads from each 454 sample into OTUs (97% similarity) and subjected the clusters to a BLAST search against GenBank. This subset of reads was selected to control for unequal read numbers. Colony CSM1323 was excluded, as it happened to be infected with Spiroplasma; see Results for details. We then inferred a maximum likelihood phylogeny of the most common OTUs and their GenBank relatives using the RAxML (45) on the CIPRES web portal (46). We included the largest clusters that cumulatively accounted for 90% of read numbers generated by 454 sequencing and also the largest clusters that accounted for 90% of sequences generated through cloning. We then uploaded the most likely tree to the iToL website (47) to facilitate graphical illustration of bacterial habitat (i.e., host, other free-living environments), bacterial order, and the methods used to obtain the given sequence.
We subsequently conducted three distinct analyses on our generated data sets. For each of the analyses, a different set of data was used. (i) First, we addressed within-colony variation using colonies CSM1280 and CSM1323, which were each represented by six or more DNA extractions from each of three and four individuals per colony, respectively. (ii) Second, we directly compared results of 454 sequencing to those from cloning, using the same 13 samples for both methods. (iii) Lastly, we used 454 sequencing to evaluate the bacterial communities prevalent in different ant tissues.
Within-colony analyses using 454 pyrosequencing.
From colony CSM1280, we prepared nine samples. We used one entire ant worker (CSM1280 wk-1) and dissected two other workers (CSM1280 individual 2 and CSM1280 individual 3) into four parts: the crop, the head, the midgut, and the hindgut. For colony CSM1323, DNA was extracted from the following six samples: the gut, the head, and one leg from one worker, as well as three guts, three heads, and three legs derived from three workers. We estimated alpha diversity using the number of observed OTUs, the Chao1 estimator, the Shannon index of diversity, and Simpson's index as implemented in QIIME. As OTU number and estimated diversity increased with read number, we repeated the assessment of alpha diversity after rarefying to the lowest read number among samples within colonies. We used the RDP library comparison tool (36) to test for pairwise significant differences between communities and visualized differences between all samples using weighted UniFrac PCoA.
Comparing bacterial diversity methods.
454 pyrosequencing and cloning were used to sample communities from the same DNA extractions, and we were able to directly compare results. As the amount of data obtained from cloned samples was much lower than from 454 pyrosequencing, we rarefied to 17, which was the lowest number of quality sequence reads from a single clone library (CSM1280 head-2 and CSM1323 3-legs; see Table S1 in the supplemental material). Alpha diversity measures were subsequently inferred exactly as described above.
To compare our three methods to characterize bacterial diversity on the level of OTUs (97% similarity), we combined all 454 reads with all Sanger sequences of clone libraries and cultivated bacteria and clustered these into OTUs. Consecutively, we excluded singletons and removed chimeric OTUs as described above. We then determined which OTUs contained (i) only 454 reads, (ii) only Sanger sequences of clone libraries, (iii) only Sanger sequences of cultivated bacteria, (iv) 454 reads and Sanger sequenced clones, (v) 454 reads and Sanger-sequenced cultivated bacteria, (vi) Sanger-sequenced clones and Sanger-sequenced cultivated bacteria, and, lastly, (vii) data retrieved with all three methods. We determined the taxonomy of OTUs by BLAST searching against the SILVA database as described above.
Assessing differences between ant tissues.
In order to test whether the bacterial communities differed between ant tissues, we focused on our 454 sequence data set. Due to a potential pathogenic infection of colony CSM1323 with a Spiroplasma sp. (order Entomoplasmatales), these samples were excluded from the analyses, as almost all sequences returned (92.9%) were from this genus. The 16S rRNA reads from the remaining 13 samples were aligned to infer a phylogenetic tree using FastTree2. UniFrac distances were used for PCoA analysis, and all analyses were carried out using QIIME. Prior to assessing alpha and beta diversity measures, samples were rarefied to 400, which corresponded to the lowest number of quality reads obtained from any individual sample in the third data set.
Nucleotide sequence accession numbers.
454 data are found in GenBank's Short Read Archive under accession number SRA05997, while accession numbers of cloned and cultivated sequences have been deposited in GenBank under accession numbers JQ254320 to JQ254364, JQ254645 to JQ254880, JQ254882, JQ254290 to JQ254311, and JX990131 to JX990334 (see Table S2 in the supplemental material).
RESULTS
Analysis of 454 pyrosequencing data.
A total of 144,679 16S rRNA sequencing reads were obtained for 21 samples subjected to 454 pyrosequencing. The average read length was 424.1 bp. Two of the samples yielded no data (CSM1235 leg and CSM1396 head), possibly due to a low concentration of bacterial DNA in the extractions. Reads clustered into 980 OTUs, of which 77 and 329 were found to be chimeric by ChimeraSlayer and the BLAST fragments method, respectively. Of the remaining OTUs, 290 were singletons. All chimeras and singletons were removed before further analysis. For the 19 samples, 95,656 reads (66.1% of all reads) remained after quality control and chimera detection. The number of reads after quality control per sample ranged from 448 to 11,807 (mean ± standard error [SE], 5,034.5 ± 829.9). Three samples had fewer than 2,000 reads (see Table S1 in the supplemental material).
Pyrosequencing revealed the presence of at least 19 bacterial orders associated with herbivorous Cephalotes varians turtle ants: Acidithiobacillales, Actinobacteriales, Alteromonadales, Burkholderiales, Campylobacterales, Chromatiales, Enterobacteriales, Flavobacteriales, Hydrogenophilales, Lactobacillales, Oceanospirillales, Opitutales (previously referred to as Verrucomicrobiales [30]), Pseudomonadales, Rhizobiales, Rhodobacterales, Rhodocyclales, Sphingobacteriales, Thiotrichales, and Xanthomonadales. The most common orders across all samples were Rhizobiales (40.9%), Opitutales (24.3%), Burkholderiales (9.4%), Campylobacterales (9.3%), and Xanthomonadales (4.7%) (see Fig. S2 in the supplemental material).
The nonparametric Chao1 estimator (48) predicted that the number of OTUs ranged from 8 to 180 across all samples (see Table S1 in the supplemental material). One single OTU (at 97% sequence similarity) accounted for an average of 29.0% of all 454 reads and was a relative of an ant-associated Bartonella sp. (Rhizobiales). Relatives of an ant-associated Opitutus sp. (Opitutales) made up the second largest OTU, with about 20% of all reads. The third most abundant OTU was related to an uncultured Azotobacter (Pseudomonadales) relative (14.3%), which was not detected through cloning (Table 1) and was not related to other ant-associated bacteria (Fig. 1). In fact, this OTU dominated the nongut samples CSM1235 head and CSM1396 leg, which had not been subjected to cloning (see Fig. S3 in the supplemental material). An Acrobacter sp. relative (Campylobacterales [7.3%]), an uncultured gammaproteobacterium (4.1%), another Bartonella sp. relative (Rhizobiales [4.1%]), an Alcaligenaceae bacterium (Burkholderiales [2.0%]), and an uncultured Xanthomonadaceae bacterium (Xanthomonadales [1.6%]) were among the most abundant OTUs, and all related to previously described ant-associated taxa. Characteristics of the most prevalent OTUs accounting for about 90% of all reads and their closest GenBank relatives are summarized in Table 1.
Table 1.
The most common OTUs (at 97% identity level) associated with Cephalotes varians ants as discovered by 454 sequencinga
| Cluster no. | Cluster size | Cumulative % | Bacterial order | Three closest GenBank matches | GenBank accession no. | % identity | Cloning | Cultivation |
|---|---|---|---|---|---|---|---|---|
| 01 | 1392 | 29.0 | Rhizobiales | Uncultured Rhizobiales | FJ477551 | 96.0 | Yes | No |
| Uncultured Rhizobiales | FJ477647 | 93.4 | ||||||
| Uncultured Rhizobiales | FJ477654 | 91.3 | ||||||
| 02 | 963 | 49.0 | Opitutales | Uncultured Opitutus | FJ477619 | 96.3 | Yes | No |
| Uncultured Opitutus | FJ477566 | 96.1 | ||||||
| Uncultured Opitutus | FJ477620 | 95.9 | ||||||
| 03 | 688 | 63.4 | Pseudomonadales | Uncultured bacterium | FM996048 | 96.7 | No | No |
| Uncultured bacterium | FM996869 | 96.7 | ||||||
| Uncultured bacterium | FM996088 | 96.7 | ||||||
| 04 | 350 | 70.7 | Campylobacterales | Acrobacter sp. | GU300768 | 95.1 | Yes | No |
| Acrobacter sp. | FN650333 | 95.1 | ||||||
| Acrobacter sp. | FN650332 | 95.1 | ||||||
| 05 | 197 | 74.8 | Unclassified gammaproteobacterium | Gammaproteobacterium | FJ477677 | 99.0 | Yes | No |
| Uncultured gammaproteobacterium | FJ477626 | 99.0 | ||||||
| Uncultured gammaproteobacterium | FJ477606 | 98.8 | ||||||
| 06 | 196 | 78.9 | Rhizobiales | Uncultured Rhizobiales | FJ477652 | 96.8 | Yes | No |
| Uncultured Rhizobiales | FJ477593 | 96.8 | ||||||
| Uncultured Rhizobiales | FJ477651 | 96.4 | ||||||
| 07 | 96 | 80.9 | Burkholderiales | Alcaligenaceae bacterium | FJ477675 | 98.7 | Yes | No |
| Uncultured Alcaligenaceae | FJ477560 | 98.0 | ||||||
| Uncultured betaproteobacterium | AF507838 | 93.8 | ||||||
| 08 | 77 | 82.5 | Xanthomonadales | Uncultured Xanthomonadaceae | FJ477622 | 96.9 | Yes | No |
| Uncultured Xanthomonadaceae | FJ477598 | 96.7 | ||||||
| Uncultured Xanthomonadaceae | FJ477621 | 96.7 | ||||||
| 09 | 69 | 83.9 | Rhizobiales | Uncultured Rhizobiales | FJ477593 | 95.7 | Yes | No |
| Uncultured Rhizobiales | FJ477654 | 95.7 | ||||||
| Uncultured Rhizobiales | FJ477653 | 95.5 | ||||||
| 10 | 69 | 85.3 | Xanthomonadales | Uncultured Xanthomonadaceae | FJ477618 | 98.3 | Yes | No |
| Uncultured Xanthomonadaceae | FJ477594 | 92.0 | ||||||
| Uncultured Xanthomonadaceae | FJ477554 | 91.8 | ||||||
| 11 | 53 | 86.4 | Sphingobacteriales | Uncultured bacterium | FJ477607 | 97.1 | No | No |
| Uncultured Bacteroidetes | FJ477649 | 88.3 | ||||||
| Uncultured bacterium | GQ263639 | 83.8 | ||||||
| 12 | 47 | 87.4 | Burkholderiales | Uncultured Comamonadaceae | FJ477610 | 99.0 | No | No |
| Uncultured bacterium | HQ728243 | 90.3 | ||||||
| Uncultured bacterium | AF390917 | 90.3 | ||||||
| 13 | 37 | 88.2 | Flavobacteriales | Flavobacterium terrae | EF117329 | 90.3 | Yes | No |
| Flavobacterium columnare | AB015480 | 90.3 | ||||||
| Flavobacterium columnare | AZ842900 | 90.3 | ||||||
| 14 | 36 | 88.9 | Burkholderiales | Uncultured Alcaligenaceae | FJ477612 | 94.5 | Yes | No |
| Uncultured Alcaligenaceae | FJ477592 | 93.9 | ||||||
| Uncultured Alcaligenaceae | FJ477590 | 93.7 | ||||||
| 15 | 33 | 89.6 | Xanthomonadales | Uncultured Xanthomonadaceae | FJ477622 | 96.2 | Yes | No |
| Uncultured Xanthomonadaceae | FJ477603 | 96.1 | ||||||
| Uncultured Xanthomonadaceae | FJ477598 | 96.1 | ||||||
| 16 | 32 | 90.3 | Opitutales | Uncultured Opitutus | FJ477608 | 98.3 | Yes | No |
| Uncultured Opitutus | FJ477619 | 98.0 | ||||||
| Uncultured Opitutus | FJ477620 | 97.5 |
A total of 400 reads were randomly selected for each of 13 C. varians samples. Colony CSM1323 was excluded, as it was infected with Enteroplasmatales bacteria, which strongly biased the data toward this group of bacteria alone. This table provides the cluster size, cumulative percentage, the three top BLAST hits, GenBank accession numbers, percent identity, and the detection of the same OTUs through cloning or cultivation. Sixteen OTUs accounted for about 90% of bacterial diversity. BLAST searches were performed against the NCBI GenBank database on 12 October 2011.
Fig 1.

Phylogenetic tree of bacteria associated with Cephalotes varians turtle ants and their GenBank relatives. Shown is a maximum likelihood phylogeny of the most prevalent OTUs as generated by 454 sequencing and by cloning. For each method, we clustered reads (454 sequencing) or sequences (cloning) at 97% similarity and selected the top clusters that accounted for 90% of reads or sequences, respectively. The branch color and inner circle refer to the source from which the bacteria were isolated, the middle circle refers to the bacterial order, and the outer circle refers to the method used to acquire the respective sequence. Colony CSM1323 was excluded from these analyses due to an infection with Entomoplasmatales bacteria. Please note the misplacement of Campylobacterales, which should group with other Proteobacteria.
A large proportion of the sequences (average of 92.9% of all reads) obtained from ant colony CSM1323 were from the genus Spiroplasma. Given the known life histories of Spiroplasma across the arthropods (49–51), we concluded that this colony was infected by the pathogen and we excluded this colony from further analyses.
Within-colony analyses using 454 pyrosequencing.
For ant colony CSM1280, we obtained 1,199 to 6,539 reads per sample across nine samples after quality control (see Table S1 in the supplemental material). On average, Rhizobiales accounted for 40.03% of reads, followed by Opitutales (22.27%), Burkholderiales (10.46%), Campylobacterales (10.33%), an unclassified gammaproteobacterium (5.66%), and Xanthomonadales (5.24%). The samples CSM1280 crop-2 and CSM1280 midgut-2 stood out, as both had extremely low alpha diversity (see Table S1), with each being dominated by a single bacterial order—Rhizobiales (99.02%) and Campylobacterales (71.58%), respectively (Fig. 2). Across all other samples, the numbers of OTUs ranged from 43 to 68, while the Chao1 estimator ranged between 68.5 and 153.0 after rarefaction to 1,000 reads. In a PCoA based on weighted UniFrac distances, all samples clustered together except CSM1280 midgut-2. The two head samples grouped with the two crop samples along the first and second axes. The samples from the entire worker (CSM1280 wk-1) clustered loosely with the samples from the hindguts and midguts along the first axis. Rhizobiales bacteria were extremely abundant in the head and crop samples compared to the high abundance of Opitutales for mid- and hindguts as well as Burkholderiales in three of four samples (Fig. 3).
Fig 2.

Comparison of bacterial communities in Cephalotes varians ants detected through 454 pyrosequencing (upper rows) and cloning (lower rows). Samples were prepared from dissected ant body parts or entire workers of Cephalotes varians. Sample names are given above pies and sample sizes below pies. The relative abundance of reads at the taxonomic level of bacterial orders is displayed. Orders that accounted for less than 1% in a sample are summarized in a category termed “other.” “Unclass. gamma” refers to an unclassified gammaproteobacterium that clustered with the Pseudomonadales bacteria.
Fig 3.
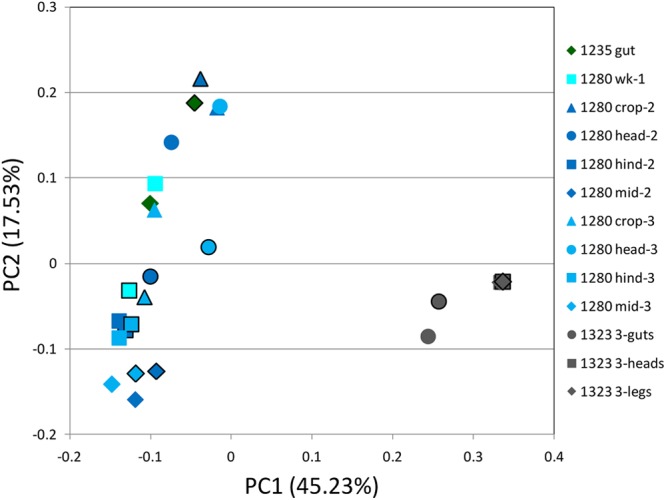
PCoA analysis of bacterial communities from samples that were subjected to 454 sequencing and cloning. Positions of the bacterial communities for each species along the two first principal coordinate axes are illustrated, along with the percentage of variation explained by each axis. Results based on 454 sequencing are displayed with no lines, while the same symbols with black outlines illustrate results obtained through cloning and Sanger sequencing. Note the distinct clustering of samples prepared from colony CSM1323 (gray symbols), which was infected by bacteria of the order Entomoplasmatales (Spiroplasma sp.), and also the clustering of the samples prepared from the hindguts of colony CSM1280 (1280 hind-2 and 1280 hind-3), as well as of the midguts of colony CSM1280 (1280 mid-2 and 1280 mid-3). “Hind” refers to the hindgut, “mid” refers to the midgut, and “wk” refers to samples prepared from whole worker extractions. Results are based on weighted UniFrac distances.
Read numbers retrieved for colony CSM1323 were high and ranged from 3,229 to 11,850 (Fig. 2; see also Table S1 in the supplemental material). The highest diversity of bacterial communities was detected in the two samples prepared from the gut tissues, with 88 and 89 OTUs present and the Chao1 estimator equaling 120.0 and 132.0, respectively (after rarefaction to 3,000). Samples prepared from the head and legs had lower diversity than gut samples, with 39 to 41 OTUs and the Chao1 statistic ranging from 40.71 to 45.12 (see Table S1). The bacterial communities discovered at the ordinal level were very similar among the six samples of colony CSM1323, although this is not surprising considering the high Spiroplasma infection in this sample. In a PCoA plot, the samples prepared from the gut clustered together and were separated from the nongut tissues (Fig. 2).
Comparing 454 sequencing with cloning.
After quality control and singleton removal, we obtained a total of 460 bacterial 16S rRNA sequences from the cloning and Sanger sequencing approach, with the number of clones analyzed ranging from 17 to 103 per sample (mean ± SE, 35.38 ± 6.72) (see Table S1 in the supplemental material). In pairwise comparisons, results obtained through cloning were qualitatively similar to results obtained from 454 sequencing across all samples for each sample (Fig. 2; see also Fig. S2 in the supplemental material) despite using different amplification and sequencing primers. This comparability is further supported by the clustering of bacterial communities obtained by the two methods from the same sample in the PCoA plots (Fig. 3). However, it should be noted that samples also showed systematic differences, as we detected a greater abundance of Xanthomonadales (9 of 9 libraries) and Burkholderiales (5 of 7 libraries) in clone-based data sets, while Rhizobiales (9 of 10) and Opitutales (10 of 10) were found at higher proportions in most 454 sequence libraries (Fig. 2), although we had far less coverage for the clone-based data set. The RDP library comparison tool showed that the differences were significant for all nine Xanthomonadales comparisons, for one Rhizobiales comparison (CSM1280 wk-1), for two Burkholderiales comparisons (CSM1235 gut-1 and CSM1280 crop-3), and for three Opitutales comparisons (CSM1235 gut-1, CSM1280 midgut-2, and CSM1280 wk-1; see Table S3 in the supplemental material for P values).
Across all 454 libraries, 16 OTUs accounted for 90% of reads, while 12 OTUs accounted for 90% of sequences from cloning. We inferred a phylogenetic tree of these most prevalent OTUs from these two methods and their GenBank relatives and found that eight of the dominant OTUs were found using both methods, including two Burkolderiales, two Xanthomonadales, one unclassified gammaproteobacterium, three Rhizobiales, one Sphingobacteriales, and one Campylobacterales OTU (Fig. 1). Using 454 sequencing, additional OTUs, which were in the pool of OTUs accounting for 90% of reads, belonged to the Burkholderiales, an uncultured Pseudomonadales bacterium, Flavobacteriales, and Opitutales. In total, 445 OTUs were detected in 454 libraries that were not recovered in any of the clone libraries. Using cloning, three additional OTUs were detected in clone libraries, but not in 454 libraries. A total of 34 OTUs were shared between the two culture-independent methods.
Within the Burkholderiales, Xanthomonadales, an unclassified gammaproteobacterium, Pseudomonadales, Rhizobiales, Sphingobacteriales, and Opitutales, OTUs from this study and GenBank (i.e., top BLAST hits) grouped within ant-specific lineages, suggesting a long coevolutionary history and specialized role of the microbes. In the case of the Rhizobiales, we detected a clade of ant-specific OTUs that was sister to a clade of bee-specific OTUs (Fig. 1).
Bacterial cultivation.
Using standard cultivation methods, we were able to detect a total of 12 OTUs belonging to the bacterial genera Asaia, Brachybacterium, Bacillus, Enterobacter, Lysinibacillus, Microbacterium, Paenibacillus, Pantoea, Pseudomonas, Rahnella, Serratia, and Streptomyces (see Table S2 in the supplemental material). Four of these OTUs (Asaia, Enterobacter, Pseudomonas, and Serratia) were also detected using 454 sequencing and were represented by 2, 45, 2, and 1 reads of the 95,656 reads across all samples, respectively.
Bacterial communities in different ant tissues.
We would expect potential bacterial symbionts that might upgrade the ants' nutrition (27, 30) to reside in the ant gut, as found in other studies on insects (52–54), and thus, we dissected various ant body parts to characterize their bacterial communities. The highest diversity estimate was found for the one entire worker analyzed. Of the nongut tissues, bacterial diversity associated with heads was higher than that associated with CSM1396 leg, as may be expected since the mouth is connected to the digestive tract. Due to the small sample size, this finding should be considered preliminary. It should be pointed out that the average read number was lower for the nongut samples than for the gut samples. However, even after rarefying all samples to 400 reads in this data set, we still found lower OTU numbers and Chao1 estimator values for nongut samples (see Table S1 in the supplemental material). The bacterial communities associated with gut tissues had significantly higher diversity than nongut tissues but were dominated by a characteristic microbiome of Rhizobiales, Opitutales, Burkholderiales, and Xanthomonadales. Samples prepared from the head and leg, but in part also from one of the crop and one of the midgut samples, often showed a different community composition, as, for example, a Pseudomonadales relative which was not an abundant OTU in other samples dominated the samples CSM1235 head and CSM1396 leg. In a PCoA plot, these two samples cluster closely together (see Fig. S3 in the supplemental material).
DISCUSSION
Many host-associated microbes provide essential functions to their hosts, and we are only beginning to characterize the microbiome diversity across the eukaryotic tree of life. Ants (Hymenoptera: Formicidae) are one of the most abundant animal groups (23, 25), and microbial symbionts may have facilitated their evolution and diversification (29, 55). Recent studies have found a range of putative symbionts in different ant lineages (22, 27, 28, 30, 49), and next-generation sequencing techniques are facilitating the endeavor to characterize the microbiome of such arthropod hosts.
Our study highlights clear differences between the utility of 16S rRNA amplicon 454 pyrosequencing, Sanger-sequenced clone libraries, and bacterial cultivation, but it also shows some surprising similarities. Alpha diversity measures were higher with the next-generation sequencing approach than with cloning (see Fig. S1 in the supplemental material). These differences are to be expected and can be explained by the detection of rare microbes, but they might in part also be due to a higher error rate of 454 sequencing. The cultivation approach uncovered 12 OTUs in total, none of which were revealed with cloning, while 4 were detected in 454 pyrosequencing.
At the level of bacterial orders, results obtained through cloning and 454 sequencing were qualitatively similar despite the use of different primers, but they also showed significant systematic differences in the proportions of Xanthomonadales, Burkholderiales, Rhizobiales, and Opitutales (Fig. 3; see also Fig. S2 in the supplemental material). Cloning bias, PCR bias, or the use of different primers might have caused these differences. While universal 16S rRNA primers are designed for broadly conserved sites, base-pairing exceptions can be present in different bacterial lineages (56). Engelbrektson et al. (20) showed that primer choice affected amplification in their study due to mismatched templates and noted that variations in templates need to be accounted for by degenerate primers. The primers used for 454 sequencing as well as our cloning primers have degenerate bases and yield similar numbers when using RDP's probe match tool (36), revealing comparable applicabilities.
In contrast to the culture-independent methods, we found a total of only 12 OTUs using cultivation approaches belonging to the orders Actinomycetales (genera Brachybacterium, Microbacterium, and Streptomyces), Bacillales (genera Bacillus, Lysinibacillus, and Paenibacillus), Enterobacteriales (genera Enterobacter, Pantoea, Rahnella, and Serratia), Pseudomonadales (genus Pseudomonas), and Rhodospirillales (genus Asaia) (see Table S2 in the supplemental material). The bacteria detected through cultivation were found only in low titers or not at all when using cultivation-independent methods. These results highlight a strong cultivation bias toward bacteria that are able to grow on the media provided. This is not surprising, since about 99% of all bacteria are not cultivable (1), while on the other hand, some bacterial strains are easily cultured even though they comprise only a small portion of the bacterial diversity in a given sample. For example, E. coli is often used as a marker for fecal contamination using cultivation methods but usually comprises less than 1% of the fecal bacterial community (34). Developing reproducible cultivation protocols for bacteria that are abundant in their natural habitats is still a challenge, and future studies should consider using a broad range of growth conditions. As cultivation will unlock opportunities for functional and manipulative assays (see, for example, reference 29), it is clear that advances in this field will greatly expand our understanding of the roles of bacteria in general.
Previous studies have indicated that bacterial symbionts are localized in the gut of Cephalotes spp. (57). The ileum—the anterior region of the hindgut—possesses structural adaptations harboring microbial symbionts (58, 59), while bacteria are also found in association with microvilli in the midgut (60, 61). In Tetraponera (subfamily Pseudomyrmecinae), a pouch in the ileum harbors symbiotic bacteria (62, 63). In accordance, we found the bacterial communities in gut-derived tissues to be much more diverse than the communities in nongut tissues. These gut communities are highly stable, as they persist in colonies exclusively reared on sucrose (reference 30 and the present study). While entire workers, the entire gut (i.e., the crop, midgut, and hindgut), and the hindgut had similar microbial communities, symbiont compositions of the midgut and crop varied. One midgut resembled the respective hindgut communities in one worker (CSM1280 individual 3) but not in a second ant worker (CSM1280 individual 2), whose community was strongly dominated by Campylobacterales. Samples prepared from the crop were dominated by Rhizobiales bacteria in one sample (CSM1280 crop-2) and housed a more diverse bacterial flora consisting of Rhizobiales, Opitutales, Burkholderiales, and Xanthomonadales in a second sample (CSM1280 crop-3). All dissections were carried out with great care, and samples were discarded when tissues were disrupted, reducing the likelihood of sample cross-contamination. Even though leakage of gut compartments when performing dissections is possible, this should only lead to slight deviations, as the concentration of bacteria in the respective compartment is expected to be high. In the study by Russell et al. (30), ant-specific bacterial lineages of the Burkholderiales, Pseudomonadales, Rhizobiales, Verrucomicrobiales (classified as Opitutales in our present study), and Xanthomonadales were found only in gut-derived tissues and absent from nongut tissues based on diagnostic PCR. The clade-specific primers used in the previous study may explain these differences, as the primers and sequencing techniques used in this study were more sensitive.
Across samples, individuals, guts, and colonies, we consistently found the highest diversity of microbes in samples derived from colony CSM1280 (Fig. S1), despite lower read numbers on the individual and colony level than those of colony CSM1323 (see Fig. S1 in the supplemental material). CSM1280 was the only field-caught colony included in the present study, while other colonies had been kept on a sterile diet for several weeks. This suggests that field-caught colonies are associated with transient microbes that are not part of the stable community. However, larger sample sizes are needed to confirm this finding, and there might be other reasons for this finding. At the same time, the gut community of samples from colony CSM1280 had a large proportion of Rhizobiales, Burkholderiales, Opitutales, Xanthomonadales, and an unclassified gammaproteobacterium, which characterize the core gut microbiota of the Cephalotini (27).
Assays on the function of the discovered symbionts in their ant hosts are lacking, and we can only speculate about their role. However, due to the known metabolic capacities of the bacterial lineages consistently found in turtle ants, nutritional supplementation seems highly likely. It has been speculated that Rhizobiales fix atmospheric nitrogen in their ant hosts, but acetylene assays were not able to support this idea under experimental conditions (30). Members of the Opitutales can reduce nitrate to nitrite, and it has been suggested that they are involved in nitrogen recycling for the ant host (27). They could also ferment sugars to propionate and acetate (64), which then might serve as the substrate for other symbionts such as the Xanthomonadales (27). Burkholderiales are extremely diverse, and so are the metabolic capacities known for certain members. Nitrogen fixation has been shown for some taxa, while others can produce antibiotics against fungi. Such functional roles remain speculative to date, and a detailed discussion can be found in the work of Anderson et al. (27).
One colony investigated—CSM1323—was infected with Spiroplasma, which is not uncommon in ants (49). Likely the infection was systemic, as this bacterium accounted for an average of 92.9% of reads from multiple ants and was also detected in the leg and head samples. In a study by Ishak et al. (22), 2 out of 10 fire ant samples (Solenopsis invicta and Solenopsis geminata) also harbored this bacterium at similarly high abundances. Although Spiroplasma has been shown to protect Drosophila neotestacea against the sterilizing effects of a parasitic nematode (65), we have no understanding of the impact of this bacterium in ants. We can only speculate that this Spiroplasma occasionally infects ants as a pathogen (50), although in the lab, no negative effects were observed within our infected colony. The Spiroplasma bacterium sequenced from Cephalotes varians was closely related to spiroplasmas that were sequenced from other insects. While this Spiroplasma strain likely has the tendency to colonize ants and other insects, it does not seem to be a component of the core gut microbiota of the Cephalotini (27, 30) (Fig. 2).
Reliably assessing the bacterial community associated not only with ants but also across the tree of life still remains a challenging endeavor. For herbivorous turtle ants, we found that gut tissues had significantly higher diversity than nongut tissues and that many of the OTUs clustered within ant-specific lineages, indicating a deep coevolutionary history of Cephalotes ants and their associated microbes. Pyrosequencing recovered 445 rare OTUs not detected with traditional techniques even after stringent quality filtering, suggesting that this method will facilitate the discovery of the host-associated rare biosphere. The next-generation techniques explored here are a great tool to characterize many previously underexplored communities and shed light on the diversity of host-associated microbiomes.
Supplementary Material
ACKNOWLEDGMENTS
We thank Research and Testing Laboratory, Lubbock, TX, for performing 454 sequencing.
This study was supported in part by NSF grant 1050243 to C.S.M., NSF grant 1050360 to J.A.R., a Grainger Foundation grant to C.S.M., a Negaunee Foundation grant to C.S.M, and the Pritzker Laboratory for Molecular Evolution and Systematics. Alexandra Gray and NSF REU intern William Montag contributed to data collection. S.K. acknowledges a postdoctoral fellowship from the German Academic Exchange Service (Deutscher Akademischer Austauschdienst [DAAD]) and from the German Academy of Sciences Leopoldina (grant LPDS 2009-29). B.E.R.R. was supported in part by an NSF Graduate Research Fellowship.
Footnotes
Published ahead of print 2 November 2012
Supplemental material for this article may be found at 10.1128/AEM.03107-12.
REFERENCES
- 1. Rappé MS, Giovannoni SJ. 2003. The uncultured microbial majority. Annu. Rev. Microbiol. 57:369–394 [DOI] [PubMed] [Google Scholar]
- 2. Douglas AE. 2011. Lessons from studying insect symbioses. Cell Host Microbe 10:359–367 [DOI] [PMC free article] [PubMed] [Google Scholar]
- 3. Feldhaar H. 2011. Bacterial symbionts as mediators of ecologically important traits of insect hosts. Ecol. Entomol. 36:533–543 [Google Scholar]
- 4. Douglas AE. 2003. The nutritional physiology of aphids. Adv. Insect Physiol. 31:73–140 [Google Scholar]
- 5. Feldhaar H, Straka J, Krischke M, Berthold K, Stoll S, Mueller MJ, Gross R. 2007. Nutritional upgrading for omnivorous carpenter ants by the endosymbiont Blochmannia. BMC Biol. 5:48. [DOI] [PMC free article] [PubMed] [Google Scholar]
- 6. Pais R, Lohs C, Wu Y, Wang JW, Aksoy S. 2008. The obligate mutualist Wigglesworthia glossinidia influences reproduction, digestion, and immunity processes of its host, the tsetse fly. Appl. Environ. Microbiol. 74:5965–5974 [DOI] [PMC free article] [PubMed] [Google Scholar]
- 7. Breznak JA, Bill WJ, Mertins JW, Coppel HC. 1973. Nitrogen fixation in termites. Nature 244:577–579 [DOI] [PubMed] [Google Scholar]
- 8. Ohkuma M. 2001. Symbiosis within the gut microbial community of termites. RIKEN Rev. 41:69–72 [Google Scholar]
- 9. Ohkuma M, Noda S, Usami R, Horikoshi K, Kudo T. 1996. Diversity of nitrogen fixation genes in the symbiotic intestinal microflora of the termite Reticulitermes speratus. Appl. Environ. Microbiol. 62:2747–2752 [DOI] [PMC free article] [PubMed] [Google Scholar]
- 10. Dobson A, Lafferty KD, Kuris AM, Hechinger RF, Jetz W. 2008. Homage to Linnaeus: how many parasites? How many hosts? Proc. Natl. Acad. Sci. U. S. A. 105:11482–11489 [DOI] [PMC free article] [PubMed] [Google Scholar]
- 11. May RM. 1988. How many species are there on Earth? Science 241:1441–1449 [DOI] [PubMed] [Google Scholar]
- 12. Eckburg Bik EM, Bernstein CN, Purdom E, Dethlefsen L, Sargent M, Gill SR, Nelson KE, Relman DA. 2005. Diversity of the human intestinal microbial flora. Science 308:1635–1638 [DOI] [PMC free article] [PubMed] [Google Scholar]
- 13. Hugenholz P, Goebel BM, Pace NR. 1998. Impact of culture-independent studies on the emerging phylogenetic view of bacterial diversity. J. Bacteriol. 18:4765–4774 [DOI] [PMC free article] [PubMed] [Google Scholar]
- 14. Charlson ES, Chen J, Custers-Allen R, Bittinger K, Li H, Sinha R, Hwang J, Bushman FD, Collman RG. 2010. Disordered microbial communities in the upper respiratory tract of cigarette smokers. PLoS One 5:e15216 doi:10.1371/journal.pone.0015216 [DOI] [PMC free article] [PubMed] [Google Scholar]
- 15. De Filippo C, Cavalieri D, Di Paola M, Ramazzotti M, Poullet JB, Massart S, Collini S, Pieraccini G, Lionetti P. 2010. Impact of diet in shaping gut microbiota revealed by a comparative study in children from Europe and rural Africa. Proc. Natl. Acad. Sci. U. S. A. 107:14691–14696 [DOI] [PMC free article] [PubMed] [Google Scholar]
- 16. Wu GD, Lewis JD, Hoffmann C, Chen YY, Knight R, Bittinger K, Hwang J, Chen J, Berkowsky R, Nessel L, Li H, Bushman FD. 2010. Sampling and pyrosequencing methods for characterizing bacterial communities in the human gut using 16S sequence tags. BMC Microbiol. 10:206. [DOI] [PMC free article] [PubMed] [Google Scholar]
- 17. Jumpponen A, Jones KL. 2010. Seasonally dynamic fungal communities in the Quercus macrocarpa phyllosphere differ between urban and nonurban environments. New Phytol. 186:496–513 [DOI] [PubMed] [Google Scholar]
- 18. Jumpponen A, Jones KL, Mattox D, Yaege C. 2010. Massively parallel 454-sequencing of fungal communities in Quercus spp. ectomycorrhizas indicates seasonal dynamics in urban and rural sites. Mol. Ecol. 19:41–53 [DOI] [PubMed] [Google Scholar]
- 19. Andreotti R, Pérez de León AA, Dowd SE, Guerrero FD, Bendele KG, Scoles GA. 2011. Assessment of bacterial diversity in the cattle tick Rhipicephalus (Boophilus) microplus through tag-encoded pyrosequencing. BMC Microbiol. 11:6. [DOI] [PMC free article] [PubMed] [Google Scholar]
- 20. Engelbrektson A, Kunin V, Wrighton KC, Zvenigorodsky Chen NF, Ochman H, Hugenholtz P. 2010. Experimental factors affecting PCR-based estimates of microbial species richness and evenness. ISME J. 4:642–647 [DOI] [PubMed] [Google Scholar]
- 21. Hirsch J, Strohmeier S, Pfannkuchen M, Reineke A. 2012. Assessment of bacterial endosymbiont diversity in Otiorhynchus spp. (Coleoptera: Curculionidae) larvae using a multitag pyrosequencing approach. BMC Microbiol. 12:S6. [DOI] [PMC free article] [PubMed] [Google Scholar]
- 22. Ishak HD, Plowes R, Sen R, Kellner K, Meyer E, Estrada DA, Dowd SE, Mueller UG. 2011. Bacterial diversity in Solenopsis invicta and Solenopsis geminata ant colonies characterized by 16S amplicon 454 pyrosequencing. Microb. Ecol. 61:821–831 [DOI] [PubMed] [Google Scholar]
- 23. Davidson DW, Patrell-Kim L. 1996. Tropical ants: why so abundant?, p 127–140 In Gibson AC. (ed), Neotropical biodiversity and conservation. Mildred E. Mathias Botanical Garden, University of California, Los Angeles, CA [Google Scholar]
- 24. Hölldobler B, Wilson EO. 1990. The ants. Springer, Berlin, Germany [Google Scholar]
- 25. Tobin JE. 1995. Ecology and diversity of tropical forest canopy ants, p 129–147 In Lowman MD, Nadkarni NM. (ed), Forest canopies. Academic Press, San Diego, CA [Google Scholar]
- 26. Davidson DW, Cook SC, Snelling RR, Chua TH. 2003. Explaining the abundance of ants in lowland tropical rainforest canopies. Science 300:969–972 [DOI] [PubMed] [Google Scholar]
- 27. Anderson KE, Russell JA, Moreau CS, Kautz S, Sullam KE, Hu Y, Basinger U, Mott BM, Buck N, Wheeler DE. 2012. Highly similar microbial communities are shared among related and trophically similar ant species. Mol. Ecol. 21:2282–2296 [DOI] [PubMed] [Google Scholar]
- 28. Eilmus S, Heil M. 2009. Bacterial associates of arboreal ants and their putative functions in an obligate ant-plant mutualism. Appl. Environ. Microbiol. 75:4324–4332 [DOI] [PMC free article] [PubMed] [Google Scholar]
- 29. Pinto-Tomás AA, Anderson M, Suen G, Stevenson D, Chu F, Cleland W, Weimer P, Currie C. 2009. Symbiotic nitrogen fixation in the fungus gardens of leaf-cutter ants. Science 326:1120–1123 [DOI] [PubMed] [Google Scholar]
- 30. Russell JA, Moreau CS, Goldman-Huertas B, Fujiwara M, Lohman DJ, Pierce NE. 2009. Bacterial gut symbionts are tightly linked with the evolution of herbivory in ants. Proc. Natl. Acad. Sci. U. S. A. 106:21236–21241 [DOI] [PMC free article] [PubMed] [Google Scholar]
- 31. Stoll S, Gadau J, Gross R, Feldhaar H. 2007. Bacterial microbiota associated with ants of the genus Tetraponera. Biol. J. Linn. Soc. 90:399–412 [Google Scholar]
- 32. Kautz S, Lumbsch HT, Ward PS, Heil M. 2009. How to prevent cheating: a digestive specialization ties mutualistic plant-ants to their ant-plant partners. Evolution 63:839–853 [DOI] [PubMed] [Google Scholar]
- 33. Kautz S, Pauls SU, Ballhorn DJ, Lumbsch HT, Heil M. 2009. Polygynous supercolonies of the acacia-ant Pseudomyrmex peperi, an inferior colony founder. Mol. Ecol. 18:5180–5194 [DOI] [PubMed] [Google Scholar]
- 34. Dowd SE, Callaway TR, Wolcott RD, Sun Y, McKeehan T, Hagevoort RG, Edrington TS. 2008. Evaluation of the bacterial diversity in the feces of cattle using 16S rDNA bacterial tag-encoded FLX amplicon pyrosequencing (bTEFAP). BMC Microbiol. 8:125. [DOI] [PMC free article] [PubMed] [Google Scholar]
- 35. Drummond AJ, Ashton B, Buxton S, Cheung M, Cooper A, Duran C, Field M, Heled J, Kearse M, Markowitz S, Moir R, Stones-Havas S, Sturrock S, Thierer T, Wilson A. 2011. Geneious v5.4. Biomatters Ltd., Auckland, New Zealand [Google Scholar]
- 36. Cole JR, Wang Q, Cardenas E, Fish J, Chai B, Farris RJ, Kulam-Syed-Mohideen AS, McGarrell DM, Marsh T, Garrity GM, Tiedje JM. 2009. The Ribosomal Database Project: improved alignments and new tools for rRNA analysis. Nucleic Acids Res. 37:D141–D145 [DOI] [PMC free article] [PubMed] [Google Scholar]
- 37. Caporaso JG, Kuczynski J, Stombaugh J, Bittinger K, Bushman FD, Costello EK, Fierer N, Peña AG, Goodrich JK, Gordon JI, Huttley GA, Kelley ST, Knights D, Koenig JE, Ley RE, Lozupone CA, McDonald D, Muegge BD, Pirrung M, Reeder J, Sevinsky JR, Turnbaugh PJ, Walters WA, Widmann J, Yatsunenko T, Zaneveld J, Knight R. 2010. QIIME allows analysis of high-throughput community sequencing data. Nat. Methods 7:335–336 [DOI] [PMC free article] [PubMed] [Google Scholar]
- 38. Edgar RC. 2010. Search and clustering orders of magnitude faster than BLAST. Bioinformatics 26:2460–2461 [DOI] [PubMed] [Google Scholar]
- 39. Haas BJ, Gevers D, Earl AM, Feldgarden M, Ward DV, Giannoukos G, Ciulla D, Tabbaa D, Highlander SK, Sodergren E, Methé B, DeSantis TZ, The Human Microbiome Consortium, Petrosino JF, Knight R, Birren BW. 2011. Chimeric 16S rRNA sequence formation and detection in Sanger and 454-pyrosequenced PCR amplicons. Genome Res. 21:494–504 [DOI] [PMC free article] [PubMed] [Google Scholar]
- 40. Caporaso JG, Bittinger K, Bushman FD, DeSantis TZ, Andersen GL, Knight R. 2010. PyNAST: a flexible tool for aligning sequences to a template alignment. Bioinformatics 26:266–267 [DOI] [PMC free article] [PubMed] [Google Scholar]
- 41. Price MN, Dehal PS, Arkin AP. 2010. FastTree 2. Approximately maximum-likelihood trees for large alignments. PLoS One 5:e9490 doi:10.1371/journal.pone.0009490 [DOI] [PMC free article] [PubMed] [Google Scholar]
- 42. Lozupone C, Knight R. 2005. UniFrac: a new phylogenetic method for comparing microbial communities. Appl. Environ. Microbiol. 71:8228–8235 [DOI] [PMC free article] [PubMed] [Google Scholar]
- 43. Lozupone CA, Hamady M, Kelley ST, Knight R. 2007. Quantitative and qualitative beta diversity measures lead to different insights into factors that structure microbial communities. Appl. Environ. Microbiol. 73:1576–1585 [DOI] [PMC free article] [PubMed] [Google Scholar]
- 44. Schloss PD, Westcott SL, Ryabin T, Hall JR, Hartmann M, Hollister EB, Lesniewski RA, Oakley BB, Parks DH, Robinson CJ, Sahl JW, Stres B, Thallinger GG, Van Horn DJ, Weber CF. 2009. Introducing mothur: open-source, platform-independent, community-supported software for describing and comparing microbial communities. Appl. Environ. Microbiol. 75:7537–7541 [DOI] [PMC free article] [PubMed] [Google Scholar]
- 45. Stamatakis A, Hoover P, Rougemont J. 2008. A rapid bootstrap algorithm for the RAxML web servers. Syst. Biol. 57:758–771 [DOI] [PubMed] [Google Scholar]
- 46. Miller MA, Holder MT, Vos R, Liebowitz T, Chan L, Hoover P, Warnow T. 2012. The CIPRES Science Gateway V. 3.1. http://www.phylo.org/sub_sections/portal Accessed 1 November 2011
- 47. Letunic I, Bork P. 2011. Interactive Tree of Life v2: online annotation and display of phylogenetic trees made easy. Nucleic Acids Res. 39:W475–W478 [DOI] [PMC free article] [PubMed] [Google Scholar]
- 48. Chao A, Chazdon RL, Colwell RK, Shen T-J. 2005. A new statistical approach for assessing similarity of species composition with incidence and abundance data. Ecol. Lett. 8:148–159 [Google Scholar]
- 49. Funaro CF, Kronauer DJ, Moreau CS, Goldman-Huertas B, Pierce NE, Russell JA. 2011. Army ants harbor a host-specific clade of Entomoplasmatales bacteria. Appl. Environ. Microbiol. 77:346–350 [DOI] [PMC free article] [PubMed] [Google Scholar]
- 50. Bové JM. 1997. Spiroplasmas: infectious agents of plants, arthropods and vertebrates. Wien. Klin. Wochenschr. 109:604–612 [PubMed] [Google Scholar]
- 51. Mouches C, Bové JM, Albisetti J. 1984. Pathogenicity of Spiroplasma apis and other spiroplasmas for honey-bees in southwestern France. Ann. Microbiol. (Paris) 135A:151–155 [DOI] [PubMed] [Google Scholar]
- 52. Chen XA, Li S, Aksoy S. 1999. Concordant evolution of a symbiont with its host insect species: molecular phylogeny of genus Glossina and its bacteriome-associated endosymbiont, Wigglesworthia glossinidia. J. Mol. Evol. 48:49–58 [DOI] [PubMed] [Google Scholar]
- 53. Hosokawa T, Kikuchi Y, Nikoh N, Shimada M, Fukatsu T. 2006. Strict host-symbiont cospeciation and reductive genome evolution in insect gut bacteria. PLoS Biol. 4:1841–1851 [DOI] [PMC free article] [PubMed] [Google Scholar]
- 54. Login FH, Balmand S, Vallier A, Vincent-Monégat C, Vigneron A, Weiss-Gayet M, Rochat D, Heddi A. 2011. Antimicrobial peptides keep insect endosymbionts under control. Science 334:362–365 [DOI] [PubMed] [Google Scholar]
- 55. Moreau CS, Bell CD, Vila R, Archibald SB, Pierce NE. 2006. Phylogeny of the ants: diversification in the age of angiosperms. Science 312:101–104 [DOI] [PubMed] [Google Scholar]
- 56. Hugenholtz P, Goebel BM. 2001. The polymerase chain reaction as a tool to investigate microbial diversity in environmental samples. In Rochelle PA. (ed), Environmental molecular microbiology: protocols and applications. Horizon Scientific Press, Norfolk, England [Google Scholar]
- 57. Roche RK, Wheeler DE. 1997. Morphological specializations of the digestive tract of Zacryptocerus rohweri. J. Morphol. 234:253–262 [DOI] [PubMed] [Google Scholar]
- 58. Bution ML, Caetano FH. 2008. Ileum of the Cephalotes ants: a specialized structure to harbor symbiont microorganisms. Micron 39:897–909 [DOI] [PubMed] [Google Scholar]
- 59. Bution ML, Caetano FH. 2010. Symbiotic bacteria and the structural specializations in the ileum of Cephalotes ants. Micron 41:373–381 [DOI] [PubMed] [Google Scholar]
- 60. Bution ML, Caetano FH. 2010. The midgut of Cephalotes ants (Formicidae: Myrmicinae): ultrastructure of the epithelium and symbiotic bacteria. Micron 41:448–454 [DOI] [PubMed] [Google Scholar]
- 61. Bution ML, Bresil C, Destéfano RH, Tango MF, da Silveira WD, Paulino LC, Caetano FH, Solferini VN. 2010. Molecular and ultrastructural profiles of the symbionts in Cephalotes ants. Micron 41:484–489 [DOI] [PubMed] [Google Scholar]
- 62. Billen J, Buschinger A. 2000. Morphology and ultrastructure of a specialized bacterial pouch in the digestive tract of Tetraponera ants (Formicidae, Pseudomyrmecinae). Arthropod Struct. Dev. 29:259–266 [DOI] [PubMed] [Google Scholar]
- 63. van Borm S, Buschinger A, Boomsma JJ, Billen J. 2002. Tetraponera ants have gut symbionts related to nitrogen-fixing root-nodule bacteria. Proc. R. Soc. Lond. 296:2023–2027 [DOI] [PMC free article] [PubMed] [Google Scholar]
- 64. Chin K, Janssen PH. 2002. Propionate formation by Opitutus terrae in pure culture and in mixed culture with a hydrogenotrophic methanogen and implications for carbon fluxes in anoxic rice paddy soil. Appl. Environ. Microbiol. 68:2089–2092 [DOI] [PMC free article] [PubMed] [Google Scholar]
- 65. Jaenike J, Unckless R, Cockburn SN, Boelio LM, Perlman SJ. 2010. Adaptation via symbiosis: recent spread of a Drosophila defensive symbiont. Science 329:212–215 [DOI] [PubMed] [Google Scholar]
Associated Data
This section collects any data citations, data availability statements, or supplementary materials included in this article.