Abstract
Identification of differentially expressed subnetworks from protein–protein interaction (PPI) networks has become increasingly important to our global understanding of the molecular mechanisms that drive cancer. Several methods have been proposed for PPI subnetwork identification, but the dependency among network member genes is not explicitly considered, leaving many important hub genes largely unidentified. We present a new method, based on a bagging Markov random field (BMRF) framework, to improve subnetwork identification for mechanistic studies of breast cancer. The method follows a maximum a posteriori principle to form a novel network score that explicitly considers pairwise gene interactions in PPI networks, and it searches for subnetworks with maximal network scores. To improve their robustness across data sets, a bagging scheme based on bootstrapping samples is implemented to statistically select high confidence subnetworks. We first compared the BMRF-based method with existing methods on simulation data to demonstrate its improved performance. We then applied our method to breast cancer data to identify PPI subnetworks associated with breast cancer progression and/or tamoxifen resistance. The experimental results show that not only an improved prediction performance can be achieved by the BMRF approach when tested on independent data sets, but biologically meaningful subnetworks can also be revealed that are relevant to breast cancer and tamoxifen resistance.
INTRODUCTION
Biological systems consist of different multi-functional elements or modules that interact selectively, and often nonlinearly, to coordinately regulate complex behaviours (1). Multiple data sources can reveal different aspects and levels of biological system function. Traditional computational or statistical approaches (2–5), mainly focusing on one type of data source, cannot provide a ‘systems view’ or a ‘global picture’ of a complex biological system, such as cancer (1,6). To achieve a greater understanding of the main features of complex biological processes or systems requires the effective integration of diverse sets of data and knowledge. Many methods have been developed to integrate different types of biological data, including combining protein–DNA interaction and gene expression data for regulatory network identification (7,8) or gene set enrichment analysis for differentially expressed pathway identification (9–11). Integrating protein–protein interaction (PPI) data with gene expression data has also been attempted for active PPI network identification (12–14). The availability of high-dimensional microarray gene expression data and PPI data should support the identification of biologically meaningful and ‘cancer driver’-related networks for cancer studies (15).
Protein–DNA interaction, PPI and/or molecular pathway data are rich in information about biological processes captured at different levels of system function. Some methods have been developed to identify significant gene sets or pathways involved in diseases or biological processes by incorporating prior biological knowledge to help understand underlying biological mechanisms. For example, gene set enrichment analysis or pathway enrichment analysis approaches (9–11) were proposed by using ‘known’ membership information in functional gene clusters or pathways. Prior knowledge can also contain network structure information, such that PPIs, protein–DNA interactions or other knowledge from canonical signalling pathways can be conveniently represented as the edges in graphs. Based on the structure of a PPI network, identification of active subnetworks is becoming increasingly important in systems biology, as it can reveal the underlying mechanisms governing the observed changes in gene expression (12). As such, biomarkers have been extended from traditional individual genes to a network of gene markers that reveal more biologically relevant information, often by incorporating PPI network or pathway information.
From PPI network data, several methods have been proposed to search for subnetworks with significant changes in gene expression under different conditions (12–14,16). For example, Chuang et al. (12) proposed a PPI network-based approach to identify biomarkers of metastasis in conjunction with breast cancer gene expression profiles. In this approach, biomarkers are not individual genes or proteins, but rather subnetworks of interacting proteins within a large human PPI network. Subnetworks identified by these methods not only suggest possible models of the molecular mechanisms underlying metastasis but they can also reveal key network hubs that are usually not detectable by examining only their differential expression. Ideker et al. (14) first converted the significance value (P-value) into a Z-score (measuring the change in gene expression between two phenotypes), and then aggregated the Z-scores of genes in a subnetwork to a network score for overall evaluation. A search algorithm was then implemented to find subnetworks with maximum network scores. Dittrich et al. (13) further revised Ideker’s method by proposing a scoring function based on a mixture model for signal-noise decomposition and a search algorithm based on integer linear programming techniques.
These methods have achieved some success in identifying biologically relevant subnetworks, but with noticeable limitations. The foremost limitation is that genes in a PPI network are treated independently when the network score is calculated; dependency among the genes in a subnetwork is ignored during the network analysis. However, genes in a local subnetwork have functional relevance; therefore, they should form a significant subnetwork even though not all of them have significantly different gene expression values. Another limitation is that many hub genes, which are biologically important and have many interactions in a PPI network, often show little change in expression compared with their downstream genes. By selecting downstream genes rather than hub genes, the resulting subnetwork may not reveal the key upstream regulatory components of the system. Finally, because of the heterogeneity in tissue samples and the inherent noise in microarray data (17), reproducibility of currently identified subnetworks is often low when tested on independent data sets (18,19).
We propose a novel subnetwork identification method for network analysis of microarray data with two different phenotypes. Specifically, we present a bagging Markov random field (BMRF)-based method for subnetwork identification. The BMRF approach is built on a framework of Markov random field modelling and maximum a posteriori estimation (MRF–MAP) to integrate gene expression and PPI data. Note that an MRF model has been applied for network-based analysis to predict protein function using PPI data and has achieved some degree of success (20,21). This success was largely attributed to its flexibility to represent different types of dependency in a network. A modified simulated annealing search algorithm is further implemented to avoid local maxima and reduce computational cost. Finally, an aggregation scheme, called bagging (22,23), is developed to help identify confident subnetworks from bootstrap versions of resampled data. Note that a previous study has applied the bagging scheme to a Bayesian approach to infer gene regulatory networks and has achieved an improved performance over other methods (23). Simulation experiments demonstrate the effectiveness of the proposed method. Comparing results against several benchmark methods show that our method consistently outperforms these other tools in identifying subnetworks and hub genes. For subnetwork identification in the clinical setting, we then apply our method to breast cancer data sets acquired before any drug therapy from two different conditions as follows: ‘untreated’ (patients received no systemic drug therapy) and ‘tamoxifen-treated’ (patients treated only with the anti-oestrogen tamoxifen after surgical removal of their primary breast tumours). Clinical outcome was used to define the output classes for prediction: ‘early recurrence’ (breast cancer subsequently recurred within certain years) and ‘late recurrence’ (breast cancer did not return during the follow-up period within certain years). The results show that our method can improve prediction performance with high reproducibility across different data sets and identify several important subnetworks associated with the development of ER+ breast cancer and/or tamoxifen resistance.
MATERIALS AND METHODS
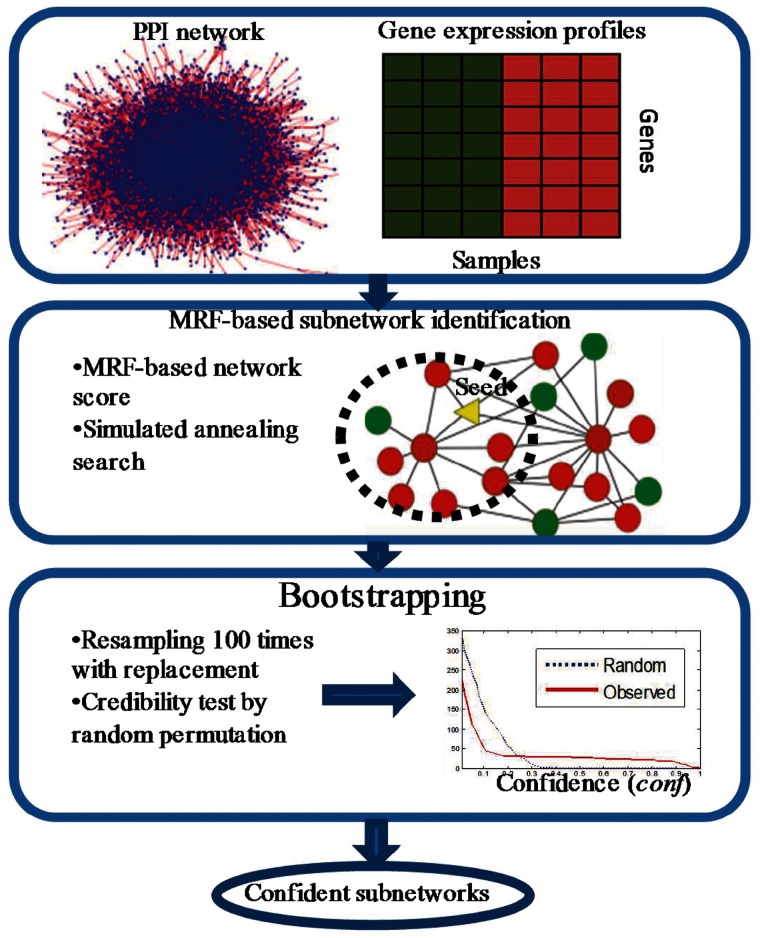
We present a new algorithm to identify subnetworks from gene expression and PPI network data based on an MRF–MAP framework. The underlying assumption in our model is that the significance score of one gene in a subnetwork depends not only on its own gene expression profile but also on the profiles of its neighbours in the PPI network. Figure 1 shows the framework of our BMRF-based subnetwork identification method, which takes a PPI network and gene expression profiles as input, searches for subnetworks with large MRF-based network scores and outputs confident subnetworks after confidence assessment.
Figure 1.
Framework of BMRF-based subnetwork identification from microarray gene expression profiles and PPI network.
Unlike the average activity score in (12), which is the mutual information between average Z-scores of gene expression and class labels, we use an MRF-based framework to derive a new network score for subnetwork identification, taking into account the dependency among the genes in a subnetwork. The goal of subnetwork identification is to find a connected subnetwork or clique that maximizes the likelihood of posterior probability of the underlying discriminative scores, given the observed discriminative scores of a subnetwork. This goal can be achieved by maximizing a network score of the subnetwork as described below. A search algorithm based on simulated annealing is then implemented to identify the subnetwork for each candidate ‘seed’ gene using PPI network and gene expression data, to reduce the local maxima problem that is almost inevitable with the greedy algorithm adopted in (12). Finally, a bagging procedure is performed to generate confident subnetworks that are evaluated using permutation test.
Network score of a subnetwork
We first define a multivariable random vector  , whose component,
  , represents the discriminative score of ith gene (protein) between two phenotypes, such as ‘early recurrence’ and ‘late recurrence’. In the context of a PPI network, S represents a gene set of m genes in a network, and Ni represents the connected neighbours of gene i (a subset within S). We define a 1-vertex clique C
1 as the set of S and a 2-vertex clique C
2 on Ni and S as follows:
  . The random variable vector f forms a Markov random field on S with respect to Ni and subject to the following conditions:
 |
(1) |
The second criterion is the Markov property of a random field, where the probability of a certain configuration at gene i is statistically independent of the configurations of all other genes ( ) given the configuration of
  .
.
Specifying the joint probability P(f) for a Markov random field is generally intractable. However, the equivalence between MRF and Gibbs distributions (24) provides an alternative means to specify P(f) using Gibbs distribution. The possible configuration f of a set of random variable vector F obeys a Gibbs distribution if the joint distribution takes the following form:
| (2) |
where W is a normalizing constant given by  , and U(f) is given by
  . Note that C is the union set of 1-vertex clique C
1 and 2-vertex clique C
2. U(f) is the prior energy that is determined by a sum of clique potentials Vc(f) over all cliques. Vc(f) represents the potential on clique c, and the value of Vc(f) depends on the local configuration on the clique c; for the mathematical definition of V
c(f), please refer to Equation (3), which will be defined later. Clique potentials allow the modelling of knowledge (a priori) about the contextual interactions between genes at neighbouring sites. For simplicity, we usually assign zero potential to all cliques of size >2. The energy U(f) corresponds to the probability of that configuration. From Equation (2), we can see that lower energies correspond to more likely configurations. The parameter T, often referred to as ‘temperature’, controls the sharpness of the distribution. Calculation of the partition function W is a formidable task, even for relatively small problems. However, it is unnecessary to calculate W in our maximum a posterior (MAP) framework because it is a normalization constant.
Denote the observed discriminative scores of genes between two phenotypes as  . Here, we define Zi as the Z-score of its corresponding P-value Pi using
  where
where  is the inverse normal cumulative density function (14). P-value can be obtained by statistical methods for hypothesis testing, and in this article, we use student’s t-test to calculate P-value for each gene between two conditions. We assume that the observed discriminative score is a result of the addition of independent zero mean Gaussian noise to the underlying discriminative score;
  . One possible estimate of the underlying discriminative score f is the MAP estimate
  that maximizes the likelihood of posterior probability
  . Considering Bayes’ rules and a Gibbs distribution, the MAP estimate
  minimizes the following posterior potential function:
  . The first term in the posterior potential function is the prior potential given by (25,26):
 |
(3) |
where di is the degree of gene i in the PPI network (defined by the number of edges connected to gene i), k is the number of interactions (or edges) and λ is a trade-off parameter. The first term in Equation (3) is the average discriminative score in a subnetwork; the second term in Equation (3) imposes the smoothness across the subnetwork while placing more weights on the genes with large degrees. Note that the posterior potential function is normalized by the numbers of genes and edges in the subnetwork. Hence, this function is independent of the subnetwork size.
The second term in the posterior potential function is the likelihood potential given by:
| (4) |
where γ is a trade-off parameter. The likelihood potential gives the average square of difference between the observed and underlying discriminative scores, given the assumption of a Gaussian distribution of the noise signal with 0 mean and 1 SD. Several properties of the MAP estimator for random variable f and two trade-off parameters λ and γ are discussed in Supplementary Material S1. In our study, we set 1 as the default value for λ and γ.
Thus, we can define the subnetwork score as the negative posterior potential function that takes into account the dependency among the genes of a subnetwork, which, in the form of estimated discriminative scores, can be defined as follows:
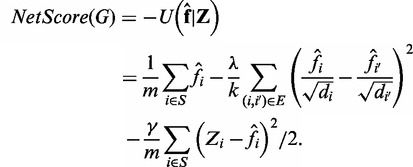 |
(5) |
Search algorithm based on simulated annealing
The network score in Equation (8) allows us to properly evaluate a given subnetwork, but finding the maximally scoring subnetwork in the full PPI network is an NP-hard problem. Rather than using an exhaustive search, we use a bottom-up approach to identify subnetworks by starting from ‘seed’ genes and growing subnetworks using a search algorithm based on simulated annealing by considering the flexibility of a search algorithm and its associated computational complexity (14). Simulated annealing is a generalization of Monte Carlo methods for combinatorial optimization (27,28). We further reduce the computational complexity of the search algorithm by: (i) reducing the search space to a local search (i.e. within two jumps); (ii) generating more heuristic candidate genes; and (iii) terminating the searching procedure when the objective cost function is sufficiently small. The search algorithm is described in Supplementary Appendix; a more detailed description of the strategies to reduce computational complexity is presented in the Supplementary Material S2.
Confidence measure of selected genes in subnetworks
Because of the heterogeneity in samples and the noise intrinsic to microarray data, reproducibility is usually low for subnetworks identified from different data sets. To obtain more reliable subnetworks, we implemented a bagging method with bootstrapping samples to select the most confident genes in the subnetworks identified (29). The underlying rationale is that we should be more confident in genes frequently included in the identified subnetworks when the data are perturbed. In the non-parametric bootstrap, we generate perturbations by re-sampling with replacement from the given data set. We define the confidence (conf) of a gene in a subnetwork as the frequency of its occurrences within B bootstraps. Furthermore, we test the credibility of our confidence assessment by randomly permuting the phenotype labels of data samples (30). Using 100 random permutations, we can obtain a baseline distribution of the confidence. We can then calculate the false discovery rate for a given confidence, conf 0, in the observed data. The final subnetwork is composed of the genes with their corresponding false discovery rates less than a predefined threshold (5%). More detailed descriptions and illustrations are provided in Supplementary Material S3.
RESULTS
Simulation studies
We used two models to simulate microarray gene expression data under two conditions considering the dependence of genes in a network. First, an MRF model was used to determine the states of genes as ‘differentially expressed’ or ‘non-differentially (equally) expressed’ given a ground truth subnetwork. A Gamma–Gamma model (31) was then used to model the gene expression levels based on the states of the genes. In the simulation model, we also used a weight parameter, w, to control the false-positive rate in any sampled differential subnetwork. The larger w is set, the lower a false-positive rate is given (see Supplementary Material S4 for more details).
We conducted simulation studies on an oestrogen receptor-α (ER) focused network that contains 365 genes and 1825 interactions, from which an ER-signalling pathway is considered as the ground truth subnetwork of 35 genes and 89 interactions (Supplementary Material S5). We first set the same parameters in the Gamma–Gamma model as those in Newton et al. (31) (α = 10, α0 = 0.9 and ν = 0.5). We then chose w to be 0, 10, 20, … , 90, and for each parameter of w, we generated 10 simulated gene expression data sets.
For each data set, we used our BMRF approach for subnetwork identification. For comparison, we also applied jActiveModules as proposed in (14), HEINZ (13) and Chuang et al.’s method (12) onto the same simulation data. jActiveModule is a subnetwork identification method that scores the subnetwork using an aggregated Z-score derived from each individual gene’s significance score (P-value). HEINZ (featuring a module scoring function) is a decomposition based method using mixture models, where integer linear programming is deployed to find the optimal or suboptimal solution for the maximally scoring subnetwork. Chuang et al.’s method scores subnetworks using the mutual information between aggregated gene Z-scores and sample labels and performs a greedy search to find local subnetworks.
We used precision-recall curve (32) and percentage of identified hub genes (with degree >5) as the metrics to evaluate performance. Precision and recall are defined as follows:
 |
 |
(6) |
where S recovered indicates the recovered subnetwork after applying BMRF-based subnetwork identification method (or any other methods in this comparison study), and S ground indicates the ground truth subnetwork. As shown in Equation (6), precision and recall can also be represented by number of recovered true genes (TP; true positive), number of recovered unexpected genes (FP; false positive) and number of unrecovered true genes (FN; false negative). To generate a precision-recall curve, we ranked genes in the identified subnetwork according to their P-values based on a t-statistic and then calculated precision and recall points by running down genes one by one on the ranked gene list. Mean average precision (MAvP) of the precision-recall curve was also calculated to provide an overall performance assessment. In the precision-recall space, a good performance is indicated by a curve close to the upper-right corner, and the ‘area under the curve’, an overall performance measure, corresponds to the MAvP. Therefore, for any method, the larger its MAvP value is, the better the performance is achieved. Note that the MAvP value varies in a range from 0 to 1. Figure 2 shows the average precision-recall curves of identified subnetworks by our BMRF-based method with different weights (w). As MAvP increases with weight w, the BMRF-based method performs better when the genes in a subnetwork are more differentially expressed than background genes.
Figure 2.
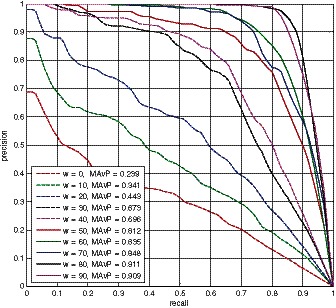
Precision-recall curves of identified subnetworks by the proposed BMRF-based method at different weights.
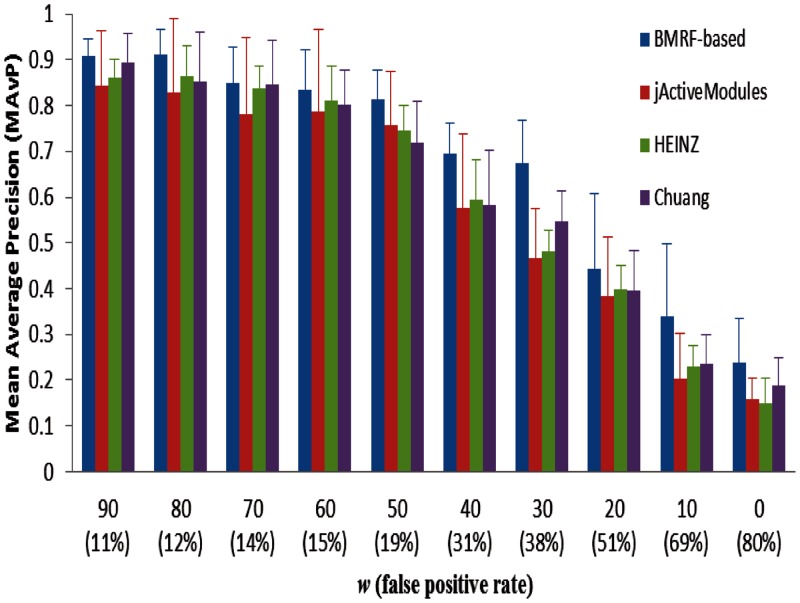
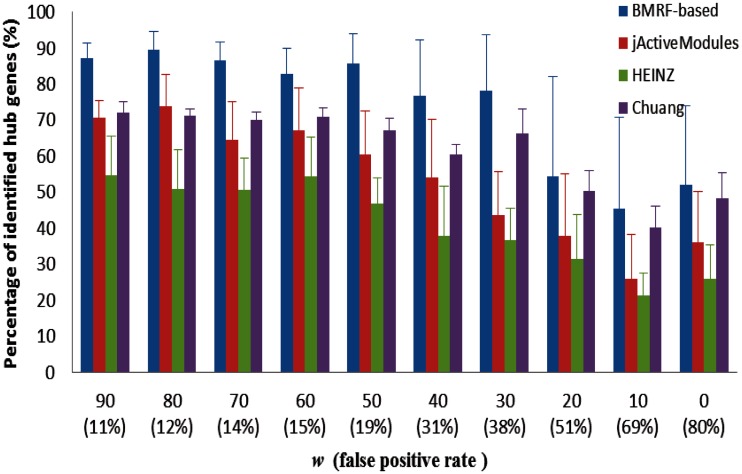
Performance comparisons for the BMRF-based method, jActiveModules, HEINZ and Chuang et al.’s method are shown in Figures 3 and 4. Figure 3 shows the mean average precision for the four methods at different weights. We also calculated the false positive rate of differentially expressed genes in the simulated gene expression data as listed in the figure. From the figure we can see that the BMRF-based method gives the best precision result, and HEINZ and Chuang et al.’s methods perform a little better than jActiveModules. Figure 4 gives the comparison of percentage of identified hub genes for the four methods at different weights. We can see that the BMRF-based method outperforms other three methods. Moreover, BMRF can identify 80% of hub genes when the false-positive rate is as high as 40%. The network scoring function and simulated annealing search boost the probability of selecting hub genes in the BMRF-based method. jActiveModules likely outperformed HEINZ because it used simulated annealing search, whereas integer linear programming in HEINZ only focused on the optimal solution for maximally scoring subnetworks, and it may have ignored many hub genes when they are not significantly differentially expressed. Chuang et al.’s method is better than jActiveModules and HEINZ because it searches a local subnetwork for each gene and then performs significance tests on the subnetwork; therefore, hub genes (that are not significantly differentially expressed) have a better chance to be included in significant local subnetworks.
Figure 3.
Comparison of mean average precision for the proposed BMRF-based method, jActiveModules, HEINZ and Chuang et al.’s method at different weights.
Figure 4.
Comparison of percentage of identified hub genes for the proposed BMRF-based method, jActiveModules, HEINZ and Chuang et al.’s method at different weights.
Note that the structure of a network has an influence on the performance measure (33). The methods that we compared may generate different network structures because of their different searching algorithms. The current performance measures in Figure 3 and 4 are only focused on nodes/genes, rather than edges/interactions. The reason of this is that it is difficult to generate simulated microarray data that can indicate which edge is of more importance than other edges. Therefore, more sophisticated simulation experiments and performance measures are needed in the future study.
Subnetworks identified from untreated breast cancer data
For subnetwork identification, we applied the proposed BMRF-based method to two gene expression data sets from breast cancer patients (specimens collected at the time of surgery but before any drug treatment), as previously reported by van de Vijver et al. (34) and Wang et al. (35). We focused on oestrogen receptor (ER) positive patients, which generally have a poorer response to chemotherapy than ER-negative tumours. Seventy-eight patients in van de Vijver et al. (34) and 80 in Wang et al. (35) are reported as having experienced a recurrence of their breast cancer within 5 years of surgery; these cases were assigned to the ‘early recurrence’ group. The remaining 217 and 129 cases from the two data sets were labelled as ‘late recurrence’. From an ER focused network, we selected 202 genes as ‘seeds’ to identify the subnetworks by integrating gene expression and network data (see Supplementary Material S5). Subnetworks were identified from PPI network data obtained from the HPRD database (36), which contains ∼9000 genes and 35 000 interactions. We converted gene expression data from probe set IDs to Entrez gene IDs. Where multiple probe set IDs are linked to one Entrez gene ID; we used the probe set ID with the largest variance across patients’ samples. Mapping the PPI network onto the two data sets found 7249 genes in 27 885 interactions to be investigated.
We determined the significant subnetworks, according to network size and network score, from 202 bootstrapping subnetworks. A network is considered to be significant if its size is >5 and its network score (normal distribution assumed) is >1.65 (corresponding to P-value of ≤ 0.05 using one-tailed hypothesis test). Twenty-seven significant subnetworks were detected on Wang et al. (35) by the BMRF-based method. Based on these subnetworks, we trained and cross-validated a classifier using network-constrained support vector machine (netSVM) (37) on the Wang et al. (35) data and independently tested it using the van de Vijver et al. (34) data. netSVM is specifically designed for network-based prediction by integrating gene expression data and network topology information. It can improve the prediction performance and reproducibility across different data sets (37), based on the assumption that hub genes usually have little expression change between two phenotypes (as observed in this study). Receiver operating characteristic studies were performed to evaluate the performance of the classifier (see Supplementary Figures S6 and S7 for detailed results). The mean (standard deviation) of the accuracy of five-fold cross-validation is 72.58% (2.01%), with 74.61% (4.85%) sensitivity and 72.09% (5.02%) specificity. For independent testing, we can achieve 69.14% accuracy, with 73.13% sensitivity and 60.26% specificity. Similarly, 14 significant subnetworks were identified from van de Vijver et al. (34) by the BMRF-based method. The mean (standard deviation) accuracy of 5-fold cross validation on van de Vijver et al. (34) is 70.20% (1.89%), with 72.22% (4.92%) sensitivity and 70.05% (4.76%) specificity. The independent testing on Wang et al. (35) gives 63.16% accuracy, with 72.50% sensitivity and 57.36% specificity (see Supplementary Figures S8 and S9 for more details). Although the cross-validation results are comparable with those originally reported by van de Vijver et al. and Wang et al., our method achieves better prediction performances on independent data. The detailed comparison results are shown in Supplementary Table S1 for cross-validation and Supplementary Table S2 for independent testing, respectively. Kaplan–Meier analysis of independent testing on two data sets (Figure 5) also shows a significant difference (P < 0.0001) in overall survival between two groups predicted as ‘early recurrence’ and ‘late recurrence’.
Figure 5.
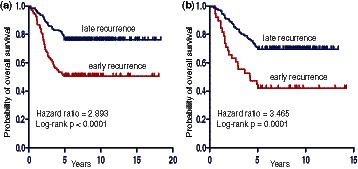
Kaplan–Meier analysis for overall survival of independent test on (a) van de Vijver et al. (34) and (b) Wang et al. (35).
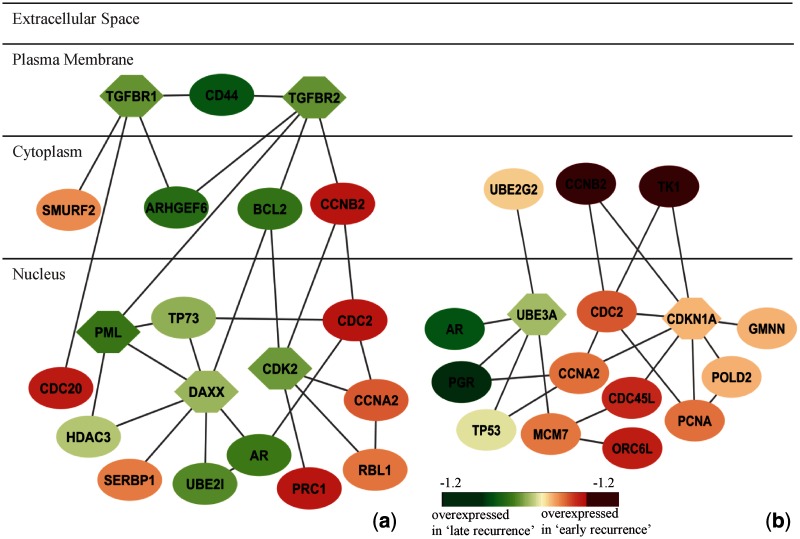
We further explored overlap among the genes in subnetworks as identified from two data sets. Among 128 genes from Wang et al. (35) and 77 genes from van de Vijver et al. (34) (Supplementary Table S4), 16 genes are present in both data sets and include many genes that are known to be related to breast cancer oestrogen signalling. For example, although the functional role of androgen receptor (AR) is still unclear, its expression is reported to be a prognostic indicator in breast cancer (38); steroid hormones and their receptors (PGR) are involved in the regulation of eukaryotic gene expression and affect cellular proliferation and differentiation in target tissues (39); BCL2 is an independent predictor of breast cancer outcome and can be useful as a prognostic marker (40). AR, BCL2, CCNA2 and CCNB2 are involved in subnetworks identified from Wang et al. (35) (Figure 6a); AR, CCNA2, CCNB2 and PGR are involved in subnetworks identified from Vijver et al. (34) (Figure 6b). Although the genes in these two subnetworks in Figure 6 are not identical, their enriched pathways and GO functions annotated by the MsigDB database (11) are similar, being largely associated with cell cycle and oestrogen signalling in breast cancer.
Figure 6.
Subnetworks identified from (a) Wang et al. (2005) and (b) van de Vijver et al. (2002). Subnetworks are merged if more than two genes are common. Node shape indicates the seed gene (hexagon) or non-seed gene (ellipse). Node color indicates the fold change between ‘early recurrence’ and ‘late recurrence’ groups. Red represents overexpressed in the ‘early recurrence’ group; green reflects overexpressed in the ‘late recurrence’ group. Enriched pathways and GO functional annotations are: (a) Cell cycle pathway: P = 2.91 e-10; breast cancer oestrogen signalling: P = 4.3 e-05; (b) Cell cycle: P = 3.18E-15; breast cancer oestrogen signalling: P = 4.02 e-07.
The experimental results also show that our method can identify hub genes that may not be significantly differentially expressed between ‘early recurrence’ and ‘late recurrence’ groups, see DAXX in Figure 6a and TP53 and CDKN1A in Figure 6b. The P-values of these genes (based on t-test) are >0.05 between two groups (thus, of low statistical significance); however, they are included in the subnetwork because their interacting genes are significantly differentially expressed.
For the other identified subnetworks, we also conducted pathway enrichment and functional annotation analysis based on the MsigDB database. Many pathways or biochemical activities are identified. Cell cycle pathway or cell cycle process is highly enriched in two data sets (Supplementary Figures S13, S15–17 in the Supplementary Material). Apoptosis (Supplementary Figure S14) and signalling transduction (Supplementary Figure S10) are shown in Wang et al. (35). Insulin receptor pathway is selected in van de Vijver et al. (34) (Supplementary Figures S15 and S16). More detailed networks and annotations can be found in the Supplementary Material.
Subnetworks identified from tamoxifen-treated breast cancer data
As a follow-up exploration, we also applied our method to two public microarray data sets (41,42) for tamoxifen resistance study of breast cancer. The study was designed to find the oestrogen-related networks or pathways to help understand the recurrence of breast cancer after drug treatment (tamoxifen). All samples have been profiled with Affymetrix GeneChip U133A Array. Among them, 105 samples in Loi et al. (41) and 107 samples in Symmans et al. (42) were labelled as ‘early recurrence’ (<6 years), and 76 samples in Loi et al. (41) and 191 samples in Symmans et al. (42) were labelled as ‘late recurrence’ (≥6 years) according to their relapse-free time. Note that for this study, we opted to use ‘6 years’ instead to divide the samples for ‘early recurrence’ and ‘late recurrence’ groups. This division by ‘6 years’ was more suitable for this study than that by ‘5 years’, as the resulting two groups better represented the distribution of samples in data sets in terms of the survival year (see Supplementary Figure S19 in the Supplementary Material), with a more balanced number of samples between two groups. We used probe logarithmic intensity error algorithm with quantile normalization to preprocess the original intensity data for gene expression measurements (43). After preprocessing, we obtained expression measurements for 22 215 probe sets in each sample. We used the same seed genes as defined in the previous session to identify the subnetworks by integrating gene expression and network data. After mapping the PPI and two gene expression data sets, there were 7809 genes with 30 621 interactions remained in this experiment.
From 202 bootstrapping subnetworks, 20 significant subnetworks were identified from Loi et al. (41) by the BMRF-based method. We trained a classifier using netSVM based on these subnetworks on Loi et al. (41) and predicted on Symmans et al. (42). The mean (standard deviation) accuracy of 5-fold cross validation is 73.45% (2.03%), with 70.93% (5.74%) sensitivity and 76.94% (5.07%) specificity. The classifier achieves 71.14% accuracy, with 71.96% sensitivity and 70.68% specificity for independent testing. Similarly, 20 significant subnetworks were identified from Symmans et al. (42) by our BMRF-based method. The mean (standard deviation) accuracy of 5-fold cross validation on Symmans et al. (42) is 71.14% (1.85%), with 70.09% (5.43%) sensitivity and 71.73% (4.80%) specificity. The independent testing on Loi et al. (41) gives 71.82% accuracy, with 70.48% sensitivity and 73.68% specificity. More detailed results are shown in Supplementary Table S3. Kaplan–Meier analysis of independent testing on two data sets (Figure 7) shows a highly significant difference (P-value of <0.0001) in terms of overall survival between the ‘early recurrence’ and ‘late recurrence’ groups.
Figure 7.
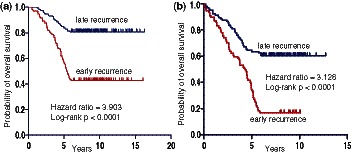
Kaplan–Meier overall survival analysis of independent testing on (a) Symmans et al. (42) and (b) Loi et al. (41).
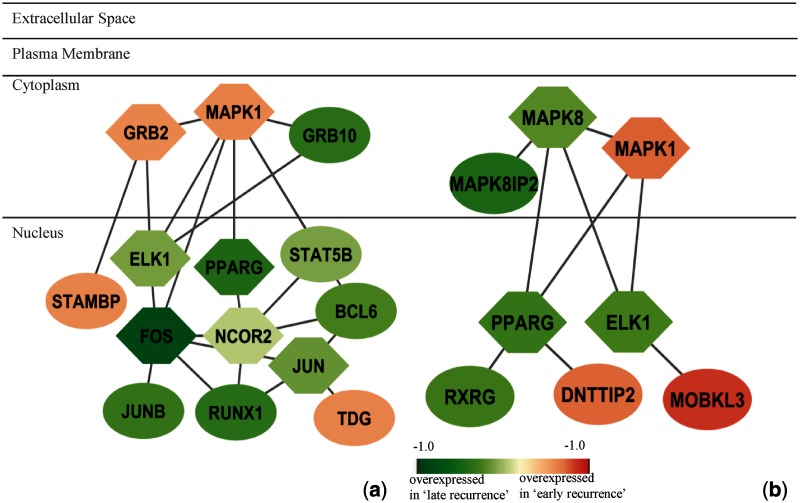
We then focused on the overlapped genes in the subnetworks identified from two data sets. There are 57 genes in the network from Loi et al. (41) and 67 genes from Symmans et al. (42) (Supplementary Table S4). Eight genes are shown in common from two data sets, which are ELK1, GRB2, HDAC2, PIK3R2, PPARG, MAPK1, ZAP70 and TRIM24. Among them, many genes are members of kinase signalling pathways. For examples, Figure 8 shows the subnetworks identified from both data sets with the overlapped genes MAPK1, PPARG and ELK1. The functional annotations of these two subnetworks are similar, which include EGF signalling pathway, MAPK signalling pathway and ErbB signalling pathway. Of note, the co-repressor NCOR2 is not significantly differentially expressed between the ‘early recurrence’ and ‘late recurrence’ groups, and its patterns of expression are different in the two data sets. Nevertheless, our method can identify this gene as a hub based on the expression pattern of its neighbouring, interacting genes.
Figure 8.
Subnetworks identified from (a) Loi et al. (2008) and (b) Symmans et al. (2010). Subnetworks are merged if more than two genes are common. Node shape indicates the seed gene (hexagon) or non-seed gene (ellipse). Node color indicates the fold change between ‘early recurrence’ and ‘late recurrence’ groups. Red represents overexpressed in ‘early recurrence’ group and green reflects overexpressed in ‘late recurrence’ group. Enriched pathways and GO functional annotations are: (a) EGF signalling pathway: P = 3.35 e-11; MAPKinase signalling pathway: P = 7.00 e-08; ErbB signalling pathway: P = 7.00 e-08. (b) MAPKinase signalling pathway: P = 7.00 e-08; ErbB signalling pathway: P = 7.00 e-08; EGF signalling pathway: P = 1.84 e-04.
We also conducted functional annotation and pathway analysis for other subnetworks using the MsigDB database. ‘Protein metabolic process’ is enriched in the networks from both data sets (Supplementary Figures S23, S26 and S31, Supplementary Material), so is ‘nucleus’ (Supplementary Figures S23 and S26). ‘Cell cycle’ and ‘apoptosis’ are shown in the network from Loi et al. (41) (Figure 8 and Supplementary Figure S24). The functional annotations and pathways of these networks are similar to those obtained from untreated breast cancer data sets (34,35), which may indicate that the subnetworks are related to the development of breast cancer. The results from these two data sets show more signalling pathways than was revealed by analysis of the untreated data sets. For example, in Figure 8, the MAPK signalling pathway is significantly enriched in both subnetworks. In this highly conserved pathway, some genes located in the cytoplasm and nucleus are identified from Loi et al. (41), including MAPK1, GRB2, ELK1, FOS and JUN (Figure 8a); some genes mainly located in the cytoplasm are identified from Symmans et al. (42), including MAPK1, MAPK8, MAPK8IP2 and ELK1 (Figure 8b). The results indicate that different data sets may reveal different active parts of one common underlying mechanism. Mitogen-activated protein kinase (MAPkinase) pathway leads to many cellular responses, including growth, differentiation, inflammation and apoptosis. Blocking HER2/MAPK signalling may overcome anti-oestrogen resistance and enhance tamoxifen action in human breast cancer (44,45).
More signalling pathways are identified, but they are more complex and diverse. We can see that transforming growth factor-β, MAPK, ErbB and EGF signalling pathways are enriched in the subnetworks from both data sets (Supplementary Figures S20–22, S26–28 and S30). Notch signalling (Supplementary Figure S25) is enriched in the network from Loi et al. (41), whereas WNT signalling (Supplementary Figure S30) and Jak-STAT signalling (Supplementary Figure S27) are enriched in the networks from Symmans et al. (42). These subnetworks show an important difference between untreated data and tamoxifen-treated data and may provide insight into tamoxifen resistance in breast cancer. More detailed descriptions on these signalling pathways can be found in Supplementary Material S6.
Enrichment analysis of subnetworks using breast cancer cell line data
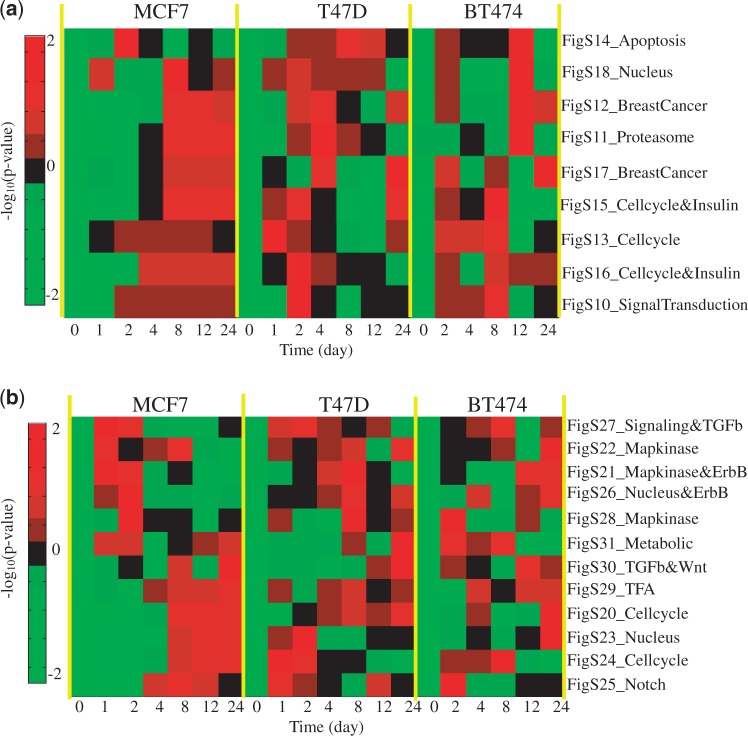
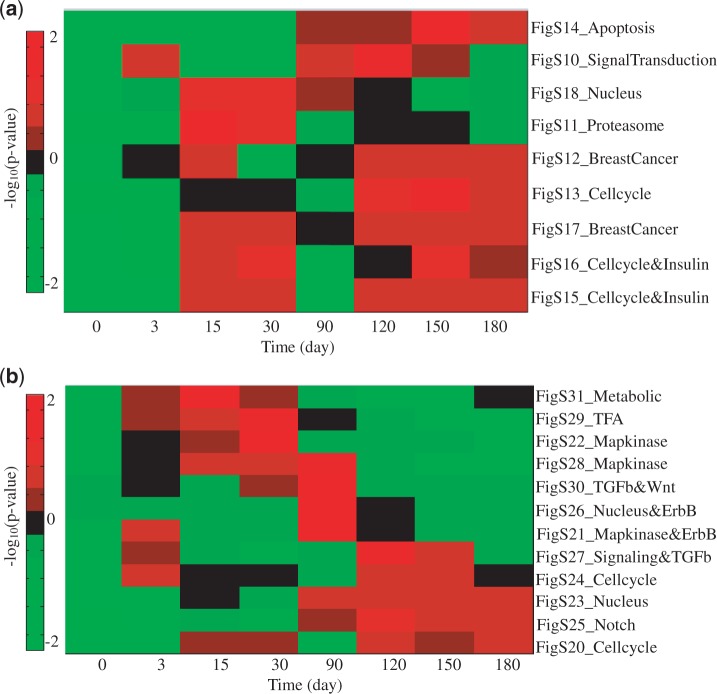
The subnetworks identified in the untreated and tamoxifen-treated clinical (tumour) data were further examined on two breast cancer cell line microarray profiles. We chose to use the subnetworks rather than the initial seed genes because subnetworks tend to have greater reproducibility between data sets (12). The first cell line study was originally designed to examine how oestrogen-induced gene expression patterns observed in vitro correlate with the expression patterns in breast tumours in vivo (46). Three oestrogen-dependent breast cancer cell lines (MCF-7, T47D, BT-474) were treated with 17β-oestradiol (E2) from 0 to 24 h and were then profiled for gene expression using Affymetrix GeneChip Arrays. The second cell line study was designed to investigate acquired resistance to aromatase inhibitors in postmenopausal women (47). The long-term oestrogen-deprived (LTED) MCF7 cell model was used for acquired resistance, where MCF7 cells were cultured in a medium depleted of E2 for 180 days. Gene expression levels at eight different time points from 0 to 180 days were profiled using Affymetrix GeneChip Arrays. We perform enrichment analysis for identified subnetworks in two time course microarray data sets. Specifically, for each time point, we obtain the fold changes of gene expression compared with the sample at time 0, and we then calculate the test statistic for each subnetwork. The test statistic of one subnetwork is defined as the summation of the fold changes of all the genes in that subnetwork. We also performed the significance test to calculate the P-value, which is defined as the probability of obtaining a test statistic at least as extreme as the one that was actually observed under the null hypothesis. To generate the null distribution, we randomly sampled the genes in the subnetwork (1000 iterations) and then calculated the test statistic. Finally, an enrichment score of one subnetwork is defined as the negative of logarithm of P-value to base 10. Figures 9 and 10 show the heatmaps of the normalized enrichment scores for each subnetwork across different time points on oestrogen-stimulated and LTED cell line data, respectively. From the figures, we can see that some subnetworks (e.g. transforming growth factor-β, MAPK and ErbB signalling networks) are activated at relatively early times, especially for those originally identified from tamoxifen-treated human breast tumour data sets [Symmans et al. (42) and Loi et al. (41)]. Subnetworks with cell cycle functions are activated at later times after the signalling subnetworks. The observation is consistent with our understanding that the signalling will be altered first and then triggers many downstream, biological functions in a cell, such as cell cycle and apoptosis. Note that LTED cells serve as a model for aromatase inhibitor resistance of breast cancer, not for tamoxifen resistance directly. Nevertheless, the result from this enrichment analysis is relevant because there is at least partial cross-resistance between aromatase inhibitors and tamoxifen; in clinical studies cross-over from one to the other gets additional responses, although not in all cases and for relatively short duration (48). These cell line studies provide us with preliminary yet important support for further biological validation of the subnetworks that we identified from this computational study.
Figure 9.
Enrichment analysis of identified subnetworks by oestrogen-stimulated cell line data: (a) subnetworks from untreated breast tumour data; (b) subnetworks from tamoxifen-treated breast tumour data. Note that the heatmap shows the normalized −log10(P-value) across different time points for each subnetwork.
Figure 10.
Enrichment analysis of identified subnetworks in oestrogen-deprived cell line data: (a) subnetworks from untreated breast tumour data; (b) subnetworks from tamoxifen-treated breast tumour data. Note that the heatmap shows the normalized −log10(P-value) across different time points for each subnetwork.
DISCUSSION
Identification of subnetworks by integrating gene expression and PPI data is important to inform our understanding of biological mechanisms. Existing methods formulate network scores based on individual genes, whereas the dependency among genes is not explicitly considered (12–14). We have developed a BMRF-based method for subnetwork identification to address these related issues. Firstly, the dependency among network member genes is represented as a second-order potential term in the MRF formulation. Through the MAP estimation, the significance scores of hub genes with a larger number of connections are enlarged, and these have a greater likelihood to be selected in the subnetworks. Secondly, the modified simulated annealing search helps find the optimal or suboptimal solutions within a reasonable computational time. Finally, confident subnetworks are obtained by a bagging scheme, which alleviates the discrepancy among different data sets because of the heterogeneity in microarray data.
There are several issues to be further investigated. First, the BMRF-based subnetwork identification method searches for subnetworks along a pre-defined PPI network, where the interactions in the PPI network are fixed. However, PPI network information is incomplete, and it includes substantial noise and false-positive interactions. For example, interactions among genes are tissue-specific or condition-specific, and this knowledge is rarely captured in PPI databases. Therefore, it is important and necessary to address the specificity of interactions in the PPI network for the subnetwork identification problem. Second, pathway information provides other insights to guide pathway analysis. Unlike a PPI network, pathway maps can be represented as directed graphs. To incorporate pathway information, our method needs to be further extended to capture directional information. Finally, more sophisticated statistical tests, such as the ones proposed in Chuang et al. (12), need to be carried out in our experiments for significant subnetwork identification, aiming to eliminate some false-positive subnetworks for further biological validation.
In conclusion, we have proposed and developed a novel subnetwork identification method by integrating microarray data and PPI data. A network score is formulated through an MRF–MAP framework. A modified simulated annealing algorithm is used to search for subnetworks with maximal network scores and a bagging scheme based on bootstrapping samples is implemented to find most reliable subnetworks. The simulation experiments have demonstrated the effectiveness of our proposed method. Furthermore, we have studied two types of breast cancer data (‘untreated’ and ‘tamoxifen-treated’); the experimental results have shown that our method can be successfully used to identify many biologically meaningful subnetworks, with which an improved prediction performance can be achieved when tested across data sets. Importantly, many of these networks are associated with oestrogen signalling in the development of breast cancer and/or tamoxifen resistance.
COMPUTER PROGRAMS
The BMRF package is made available to the research community, which can be downloaded at http://www.cbil.ece.vt.edu/software.htm.
SUPPLEMENTARY DATA
Supplementary Data are available at NAR Online: Supplementary Tables 1–4, Supplementary Figures 1–31, Supplementary Material and Supplementary Appendix.
FUNDING
Funding for open access charge: National Institutes of Health [CA149653, CA139246 to J.X., CA149147, HHSN2612200800001E to R.C. and NS29525-18A to Y.W.]; Department of Defense [BC030280 to R.C.].
Conflict of interest statement. None declared.
Supplementary Material
REFERENCES
- 1.Hanash S. Integrated global profiling of cancer. Nat. Rev. Cancer. 2004;4:638–644. doi: 10.1038/nrc1414. [DOI] [PubMed] [Google Scholar]
- 2.Richard OD, Peter EH, Stork DG. Pattern Classification. 2nd edn. New York: Wiley; 2001. [Google Scholar]
- 3.Tusher VG, Tibshirani R, Chu G. Significance analysis of microarrays applied to the ionizing radiation response. Proc. Natl Acad. Sci. USA. 2001;98:5116–5121. doi: 10.1073/pnas.091062498. [DOI] [PMC free article] [PubMed] [Google Scholar]
- 4.Kittler J. Pattern Recognition and Signal Processing, Chapter Feature Set Search Algorithms. Alphen aan den Rijn, Netherlands: Sijthoff and Noordhoff; 1978. [Google Scholar]
- 5.Ewens WJ, Grant GR. Statistical Methods in Bioinformatics. 1st edn. New York: Springer; 2001. [Google Scholar]
- 6.Likic VA, McConville MJ, Lithgow T, Bacic A. Systems biology: the next frontier for bioinformatics. Adv. Bioinformatics. 2010 doi: 10.1155/2010/268925. 268925. [DOI] [PMC free article] [PubMed] [Google Scholar]
- 7.Chen L, Xuan J, Riggins RB, Wang Y, Hoffman EP, Clarke R. Multilevel support vector regression analysis to identify condition-specific regulatory networks. Bioinformatics. 2010;26:1416–1422. doi: 10.1093/bioinformatics/btq144. [DOI] [PMC free article] [PubMed] [Google Scholar]
- 8.Bussemaker HJ, Li H, Siggia ED. Regulatory element detection using correlation with expression. Nat. Genet. 2001;27:167–171. doi: 10.1038/84792. [DOI] [PubMed] [Google Scholar]
- 9.Bo T, Jonassen I. New feature subset selection procedures for classification of expression profiles. Genome Biol. 2002;3 doi: 10.1186/gb-2002-3-4-research0017. RESEARCH0017. [DOI] [PMC free article] [PubMed] [Google Scholar]
- 10.Curtis RK, Oresic M, Vidal-Puig A. Pathways to the analysis of microarray data. Trends Biotechnol. 2005;23:429–435. doi: 10.1016/j.tibtech.2005.05.011. [DOI] [PubMed] [Google Scholar]
- 11.Subramanian A, Tamayo P, Mootha VK, Mukherjee S, Ebert BL, Gillette MA, Paulovich A, Pomeroy SL, Golub TR, Lander ES, et al. Gene set enrichment analysis: a knowledge-based approach for interpreting genome-wide expression profiles. Proc. Natl Acad. Sci. USA. 2005;102:15545–15550. doi: 10.1073/pnas.0506580102. [DOI] [PMC free article] [PubMed] [Google Scholar]
- 12.Chuang HY, Lee E, Liu YT, Lee D, Ideker T. Network-based classification of breast cancer metastasis. Mol. Syst. Biol. 2007;3:140. doi: 10.1038/msb4100180. [DOI] [PMC free article] [PubMed] [Google Scholar]
- 13.Dittrich MT, Klau GW, Rosenwald A, Dandekar T, Muller T. Identifying functional modules in protein-protein interaction networks: an integrated exact approach. Bioinformatics. 2008;24:i223–i231. doi: 10.1093/bioinformatics/btn161. [DOI] [PMC free article] [PubMed] [Google Scholar]
- 14.Ideker T, Ozier O, Schwikowski B, Siegel AF. Discovering regulatory and signalling circuits in molecular interaction networks. Bioinformatics. 2002;18(Suppl.1):S233–S240. doi: 10.1093/bioinformatics/18.suppl_1.s233. [DOI] [PubMed] [Google Scholar]
- 15.Taylor IW, Linding R, Warde-Farley D, Liu Y, Pesquita C, Faria D, Bull S, Pawson T, Morris Q, Wrana JL. Dynamic modularity in protein interaction networks predicts breast cancer outcome. Nat. Biotechnol. 2009;27:199–204. doi: 10.1038/nbt.1522. [DOI] [PubMed] [Google Scholar]
- 16.Rajagopalan D, Agarwal P. Inferring pathways from gene lists using a literature-derived network of biological relationships. Bioinformatics. 2005;21:788–793. doi: 10.1093/bioinformatics/bti069. [DOI] [PubMed] [Google Scholar]
- 17.Clarke R, Ressom HW, Wang A, Xuan J, Liu MC, Gehan EA, Wang Y. The properties of high-dimensional data spaces: implications for exploring gene and protein expression data. Nat. Rev. Cancer. 2008;8:37–49. doi: 10.1038/nrc2294. [DOI] [PMC free article] [PubMed] [Google Scholar]
- 18.Ein-Dor L, Zuk O, Domany E. Thousands of samples are needed to generate a robust gene list for predicting outcome in cancer. Proc. Natl Acad. Sci. USA. 2006;103:5923–5928. doi: 10.1073/pnas.0601231103. [DOI] [PMC free article] [PubMed] [Google Scholar]
- 19.Ein-Dor L, Kela I, Getz G, Givol D, Domany E. Outcome signature genes in breast cancer: is there a unique set? Bioinformatics. 2005;21:171–178. doi: 10.1093/bioinformatics/bth469. [DOI] [PubMed] [Google Scholar]
- 20.Wei Z, Li H. A Markov random field model for network-based analysis of genomic data. Bioinformatics. 2007;23:1537–1544. doi: 10.1093/bioinformatics/btm129. [DOI] [PubMed] [Google Scholar]
- 21.Deng M, Zhang K, Mehta S, Chen T, Sun F. Prediction of protein function using protein-protein interaction data. J. Comput. Biol. 2003;10:947–960. doi: 10.1089/106652703322756168. [DOI] [PubMed] [Google Scholar]
- 22.Breiman L. Bagging predictors. Mach. Learn. 1996;24:123–140. [Google Scholar]
- 23.de Matos Simoes R, Emmert-Streib F. Bagging statistical network inference from large-scale gene expression data. PLoS One. 2012;7:e33624. doi: 10.1371/journal.pone.0033624. [DOI] [PMC free article] [PubMed] [Google Scholar]
- 24.Hammersley J, Clifford P. Markov Fields on Finite Graphs and Lattices. 1971. Unpublished. [Google Scholar]
- 25.Chen L, Xuan J, Gu J, Wang Y, Zhang Z, Wang TL, Shih Ie M. Integrative network analysis to identify aberrant pathway networks in ovarian cancer. Pac. Symp. Biocomput. 2012:31–42. [PMC free article] [PubMed] [Google Scholar]
- 26.Li C, Li H. Network-constrained regularization and variable selection for analysis of genomic data. Bioinformatics. 2008;24:1175–1182. doi: 10.1093/bioinformatics/btn081. [DOI] [PubMed] [Google Scholar]
- 27.Kirkpatrick S, Gelatt CD, Jr, Vecchi MP. Optimization by simulated annealing. Science. 1983;220:671–680. doi: 10.1126/science.220.4598.671. [DOI] [PubMed] [Google Scholar]
- 28.Černý V. Thermodynamical approach to the traveling salesman problem: an efficient simulation algorithm. J. Optim. Theory Appl. 1985;45:41–51. [Google Scholar]
- 29.Efron B, Tibshirani RJ. An Introduction to the Bootstrap. London: Chapman and Hall; 1993. [Google Scholar]
- 30.Friedman N, Linial M, Nachman I, Pe’er D. Using Bayesian networks to analyze expression data. J. Comput. Biol. 2000;7:601–620. doi: 10.1089/106652700750050961. [DOI] [PubMed] [Google Scholar]
- 31.Newton MA, Kendziorski CM, Richmond CS, Blattner FR, Tsui KW. On differential variability of expression ratios: improving statistical inference about gene expression changes from microarray data. J. Comput. Biol. 2001;8:37–52. doi: 10.1089/106652701300099074. [DOI] [PubMed] [Google Scholar]
- 32.van Rijsbergen CV. Information Retrieval. 2nd edn. London: Butterworth; 1979. [Google Scholar]
- 33.Emmert-Streib F, Altay G. Local network-based measures to assess the inferability of different regulatory networks. IET Syst. Biol. 2010;4:277–288. doi: 10.1049/iet-syb.2010.0028. [DOI] [PubMed] [Google Scholar]
- 34.van de Vijver MJ, He YD, van’t Veer LJ, Dai H, Hart AA, Voskuil DW, Schreiber GJ, Peterse JL, Roberts C, Marton MJ, et al. A gene-expression signature as a predictor of survival in breast cancer. N. Engl. J. Med. 2002;347:1999–2009. doi: 10.1056/NEJMoa021967. [DOI] [PubMed] [Google Scholar]
- 35.Wang Y, Klijn JG, Zhang Y, Sieuwerts AM, Look MP, Yang F, Talantov D, Timmermans M, Meijer-van Gelder ME, Yu J, et al. Gene-expression profiles to predict distant metastasis of lymph-node-negative primary breast cancer. Lancet. 2005;365:671–679. doi: 10.1016/S0140-6736(05)17947-1. [DOI] [PubMed] [Google Scholar]
- 36.Mishra GR, Suresh M, Kumaran K, Kannabiran N, Suresh S, Bala P, Shivakumar K, Anuradha N, Reddy R, Raghavan TM, et al. Human protein reference database—2006 update. Nucleic Acids Res. 2006;34:D411–D414. doi: 10.1093/nar/gkj141. [DOI] [PMC free article] [PubMed] [Google Scholar]
- 37.Chen L, Xuan J, Riggins RB, Clarke R, Wang Y. Identifying cancer biomarkers by network-constrained support vector machines. BMC Syst. Biol. 2011;5:161. doi: 10.1186/1752-0509-5-161. [DOI] [PMC free article] [PubMed] [Google Scholar]
- 38.Gonzalez LO, Corte MD, Vazquez J, Junquera S, Sanchez R, Alvarez AC, Rodriguez JC, Lamelas ML, Vizoso FJ. Androgen receptor expresion in breast cancer: relationship with clinicopathological characteristics of the tumors, prognosis, and expression of metalloproteases and their inhibitors. BMC Cancer. 2008;8:149. doi: 10.1186/1471-2407-8-149. [DOI] [PMC free article] [PubMed] [Google Scholar]
- 39.Rebhan M, Chalifa-Caspi V, Prilusky J, Lancet D. GeneCards: integrating information about genes, proteins and diseases. Trends Genet. 1997;13:163. doi: 10.1016/s0168-9525(97)01103-7. [DOI] [PubMed] [Google Scholar]
- 40.Callagy GM, Pharoah PD, Pinder SE, Hsu FD, Nielsen TO, Ragaz J, Ellis IO, Huntsman D, Caldas C. Bcl-2 is a prognostic marker in breast cancer independently of the Nottingham Prognostic Index. Clin. Cancer Res. 2006;12:2468–2475. doi: 10.1158/1078-0432.CCR-05-2719. [DOI] [PubMed] [Google Scholar]
- 41.Loi S, Haibe-Kains B, Desmedt C, Wirapati P, Lallemand F, Tutt AM, Gillet C, Ellis P, Ryder K, Reid JF, et al. Predicting prognosis using molecular profiling in estrogen receptor-positive breast cancer treated with tamoxifen. BMC Genomics. 2008;9:239. doi: 10.1186/1471-2164-9-239. [DOI] [PMC free article] [PubMed] [Google Scholar]
- 42.Symmans WF, Hatzis C, Sotiriou C, Andre F, Peintinger F, Regitnig P, Daxenbichler G, Desmedt C, Domont J, Marth C, et al. Genomic index of sensitivity to endocrine therapy for breast cancer. J. Clin. Oncol. 2010;28:4111–4119. doi: 10.1200/JCO.2010.28.4273. [DOI] [PMC free article] [PubMed] [Google Scholar]
- 43.Affymetrix . Guide to Probe Logarithmic Intensity Error (PLIER) Estimation. 2005. Affymetrix, Santa Clara, CA. [Google Scholar]
- 44.Giordano C, Catalano S, Panza S, Vizza D, Barone I, Bonofiglio D, Gelsomino L, Rizza P, Fuqua SA, Ando S. Farnesoid X receptor inhibits tamoxifen-resistant MCF-7 breast cancer cell growth through downregulation of HER2 expression. Oncogene. 2011;30:4129–4140. doi: 10.1038/onc.2011.124. [DOI] [PMC free article] [PubMed] [Google Scholar]
- 45.Kurokawa H, Lenferink AE, Simpson JF, Pisacane PI, Sliwkowski MX, Forbes JT, Arteaga CL. Inhibition of HER2/neu (erbB-2) and mitogen-activated protein kinases enhances tamoxifen action against HER2-overexpressing, tamoxifen-resistant breast cancer cells. Cancer Res. 2000;60:5887–5894. [PubMed] [Google Scholar]
- 46.Creighton CJ, Cordero KE, Larios JM, Miller RS, Johnson MD, Chinnaiyan AM, Lippman ME, Rae JM. Genes regulated by estrogen in breast tumor cells in vitro are similarly regulated in vivo in tumor xenografts and human breast tumors. Genome Biol. 2006;7:R28. doi: 10.1186/gb-2006-7-4-r28. [DOI] [PMC free article] [PubMed] [Google Scholar]
- 47.Aguilar H, Sole X, Bonifaci N, Serra-Musach J, Islam A, Lopez-Bigas N, Mendez-Pertuz M, Beijersbergen RL, Lazaro C, Urruticoechea A, et al. Biological reprogramming in acquired resistance to endocrine therapy of breast cancer. Oncogene. 2010;29:6071–6083. doi: 10.1038/onc.2010.333. [DOI] [PubMed] [Google Scholar]
- 48.Barrios C, Forbes JF, Jonat W, Conte P, Gradishar W, Buzdar A, Gelmon K, Gnant M, Bonneterre J, Toi M, et al. The sequential use of endocrine treatment for advanced breast cancer: where are we? Ann. Oncol. 2012;23:1378–1386. doi: 10.1093/annonc/mdr593. [DOI] [PMC free article] [PubMed] [Google Scholar]
Associated Data
This section collects any data citations, data availability statements, or supplementary materials included in this article.


