

Abstract
The bacterial cell wall is essential to cell survival and is a major target of antibiotics. The main component of the bacterial cell wall is peptidoglycan, a cage-like macromolecule that preserves cellular integrity and maintains cell shape. The insolubility and heterogeneity of peptidoglycan pose a challenge to conventional structural analyses. Here we use solid-state NMR combined with specific isotopic labeling to probe a key structural feature of the Staphylococcus aureus peptidoglycan quantitatively and nondestructively. We observed that both the cell-wall morphology and the peptidoglycan structure are functions of growth stage in S. aureus synthetic medium (SASM). Specifically, S. aureus cells at stationary phase have thicker cell walls with non-uniformly thickened septa compared to cells in exponential phase and, remarkably, 12% (±2%) of the stems in their peptidoglycan do not have pentaglycine bridges attached. Mechanistically, we determined that these observations are triggered by the depletion of glycine in the nutrient medium, which is coincident with the start of the stationary phase, and that the production of the structurally altered peptidoglycan can be prevented by the addition of excess glycine. We also demonstrated that the structural changes primarily arise within newly synthesized peptidoglycan rather than through the modification of previously synthesized peptidoglycan. Collectively, our observations emphasize the plasticity in bacterial cell-wall assembly and the possibility to manipulate peptidoglycan structure with external stimuli.
Keywords: bacterial cell wall, peptidoglycan, solid-state NMR, CPMAS, REDOR, nutrient status, growth stage
INTRODUCTION
Staphylococcus aureus is a gram-positive pathogenic bacterium well known for its virulence and antibiotic resistance, particularly to drugs such as penicillin, methicillin, and vancomycin, which target cell-wall biosynthesis (1, 2). The major component of the bacterial cell wall is peptidoglycan, a cage-like polymer enveloping the cytoplasmic membrane to withstand the turgor pressure of the cell, maintain bacterial cell shape, and serve as a scaffold for other cell wall components (3). Its essential role in bacterial cell survival and its absence in human cells renders the peptidoglycan a major target for antibiotics.
In S. aureus, peptidoglycan synthesis begins in the cytoplasm where the precursor Lipid II is assembled. Lipid II consists of the membrane-tethered disaccharide, (β-1,4) N-acetylmuramic acid-N-acetylglucosamine (MurNAc-GlcNAc), linked to a pentapeptide that is functionalized with a pentaglycine bridge attached to the ε-amino group of L-Lys. Lipid II is transported to the membrane exoface and is polymerized through transglycosylation (to extend the glycan chains) and transpeptidation (to cross-link the pentaglycine bridge to the D-Ala in position four of a neighboring stem), accompanied by release of the undecaprenyl pyrophosphate lipid tether (4). The resulting polymer structure is shown in Figure 1. The characteristic pentaglycine cross-linking motif of S. aureus introduces flexibility and, thus, enables an extremely high cross-linking density in the peptidoglycan, which contributes substantially to the stability of the cell wall. The pentaglycine bridge also serves as an anchor for surface protein attachment (5, 6), an important determinant for pathogenicity. Shortening of the pentaglycine bridge has been shown to impair growth and reduce or even abolish methicillin resistance (7, 8).
Figure 1. Staphylococcus aureus peptidoglycan.

(a) Chemical structure of S. aureus peptidoglycan, which is cross-linked through an inter-peptide bridge consisting of five glycines to connect the ε-amino group of L-Lys in the third position of one stem (bridge-link, highlighted) to the D-Ala in the fourth position of the connected stem (cross-link) with the concomitant cleavage of the terminal D-Ala. (b) Assembly pathway of S. aureus peptidoglycan. The peptidoglycan precursor lipid II is assembled inside the cell with pentaglycine bridge attached and is “flipped” outside the cell to be incorporated into the peptidoglycan network through transglycosylation (to connect the glycan strands) and transpeptidation (to cross-link the peptides).
Studies have demonstrated that the peptidoglycan chemical structure can change in response to environmental stimuli such as NaCl concentration (9), D-amino acids (10, 11), and antibiotics (12). To date, most S. aureus peptidoglycan studies have focused on exponential phase cells. However, stationary phase cells are more relevant in the context of the persistent, and biofilm-associated infections where currently available antibiotics exhibit reduced efficacy (13–17). Thus, the physiology of bacteria in the stationary phase merits greater attention and, to this end, we address the possibility that structural variations in the S. aureus peptidoglycan may accompany changes in growth stage and nutrient status.
In the gram-negative bacterium Escherichia coli, the growth stage has been correlated with changes in the peptidoglycan fine structure (18, 19). In S. aureus, electron microscopy and AFM studies revealed that the cell walls of stationary phase cells (grown in BHI medium) are thicker and appear smoother relative to cells in exponential phase (20, 21), but the peptidoglycan chemical structure has not been examined. Characterizing the chemical/fine structure of the peptidoglycan in S. aureus is more challenging than in E. coli due to the presence of a more highly cross-linked network (22). Enzymatic digestions using muramidase, for example, and HPLC-MS analyses (23–26) can provide some valuable information about the composition of the peptidoglycan, but does not provide a complete accounting of peptidoglycan components. In particular, the highly cross-linked muropeptide species that cannot be fully resolved often appear as a “hump” in HPLC chromatograms (24). Recently, solid-state NMR has been applied on uniformly labeled peptidoglycan of E. coli, B. subtilis and S. aureus with good resolution and has allowed the identification and assignment of the peptidoglycan monomers (27, 28). On the other hand, a number of solid-state NMR studies have also been developed using specific labeling strategies to quantify and characterize peptidoglycan composition and architecture in both isolated peptidoglycan and in intact whole cells (29–31). Using this approach, we describe a previously uncharacterized structural variation in the peptidoglycan of stationary phase S. aureus cells grown in S. aureus synthetic medium (SASM), and we further show that the depletion of glycine in the stationary phase culture is responsible for the observed structural changes.
MATERIALS AND METHODS
Growth and Labeling of S. aureus Whole Cells
S. aureus (ATCC 29213) were cultured in S. aureus synthetic medium (SASM) (29) at 37°C with constant shaking at 200 rpm (Innova 4400 incubator shaker, New Brunswick Scientific). Overnight starter cultures were prepared by inoculating 2 mL SASM with a single colony grown on trypticase soy agar. 300-mL preparative-scale growths were performed in 1 L flasks using a 1:300 (v/v) inoculum of an overnight starter culture. For the preparation of isotopically labeled samples, the natural-abundance amino acids in SASM were replaced by either L-[ε-15N]lysine or L-[ε-15N]lysine with pulse label L-[ε-13C,15N]lysine (Isotec, Sigma-Aldrich). The optical density at 660 nm was monitored with a Lambda 35 UV-Vis spectrometer (Perkin Elmer, Inc). Cells were harvested at the specific OD660 values as illustrated in Figure 2 by centrifugation at 10,000g at 4 °C for 10 minutes. Cell pellets were rinsed with ice-cold 5 mM Hepes buffer (pH 7) three times with centrifugation to remove labeled amino acids and then resuspended in 8 mL of lyophilization buffer (5 mM Hepes with 8 mM Trehalose, pH 7), frozen with liquid N2, and lyophilized (FreeZone 12, Labconco). Typical yields of whole cells were about 200 mg/L per an OD value of 1.0.
Figure 2. S. aureus cell wall morphology is a function of growth stage in SASM.

(a) Growth curve of S. aureus strain 29213 in SASM broth at 37 °C with 200 rpm shaking monitored by optical density at 660 nm (color dots indicate sample points taken in this study). (b) Cell-wall thickness distribution measured from TEM ultrathin sections of S. aureus whole cells at different OD values. (c) Septum thickness distribution and (d) corresponding TEM images of ultrathin sections of S. aureus cells harvested at four different growth stages. The open columns represent the septum thickness near the edge while the solid columns represent the thickness in the center. Each black line outlines the overall septum thickness distribution (the sum of all measured center and edge thickness). Non-uniform thickening is indicated with red dashed lines in the TEM images of cells harvested at OD 3.6 and OD 4. Scale bars are 100 nm.
Isolation of Peptidoglycan
Peptidoglycan was isolated from lyophilized whole cells similarly as described before (29, 32) with some modifications to stringently remove unbroken whole cells. Typically, 200 mg lyophilized whole cells were resuspended in 30 mL ice-cold potassium phosphate butter (pH 7) with 2 mg DNase I (type II from bovine pancreas, Sigma-Aldrich) and transferred to a 50 mL bead beater (Biospec Products, Bartlesville, OK) chamber which was two-thirds filled with pre-chilled 0.1 mm zirconia/silica beads. Cells were repeatedly beat through ten cycles of 1-minute disruption and 1-minute rest. After disruption, the homogenate and beads were filtered with a course glass-scintered filter to separate the homogenate (filtrate) from the beads by vacuum filtration. The beads were washed further with 100 mL ice-cold EDTA (pH=7). The crude wall preparation was then collected by centrifuging the filtrate at 25,000g (Sorvall SS-34 rotor), at 4°C for 30 minutes. The pellet was resuspended in 20 mL ice-cold water, added drop-wise to 100 mL boiling 4% SDS, and was boiled for 30 minutes with constant stirring. The mixture was allowed to cool for 2 hours with stirring and then stood unstirred overnight at room temperature. SDS was removed by centrifugation of the mixture at 38,000g for 1 hour at room temperature followed by four washes with 0.01 M Tris buffer (pH 8.2). The resulting pellet was then resuspended in 60 mL 0.01 M Tris buffer (pH 8.2) containing 2 mg DNase I and 8 mg trypsin (type II-S from bovine pancreas, Sigma-Aldrich) and R-chymotrypsin (type II from bovine pancreas, Sigma-Aldrich) and incubated at 37 °C with shaking (150 rpm) for 16 h. This mixture was centrifuged at 38,000g for 1 hour at room temperature and washed three times with Tris buffer with centrifugation after each rinse. The pellet was resuspended in 50 mL Tris buffer and pelleted at 500g for 5 minutes, to remove any unbroken cells or large cell debris and repeated three times until no further pellet was observed. Aliquots from each step in the isolation were analyzed by protein gel electrophoresis using 12% SDS-PAGE gels (Invitrogen) and staining with Coomassie Blue to assess the overall protein content of the samples. The purified peptidoglycan was collected by centrifugation at 38,000g at RT for 1 hour, resuspended in 4 mL lyophilization buffer (5 mM Hepes with 8 mM Trehalose, pH 7.0) and lyophilized.
Additionally, for HPLC and LC-MS analysis, the isolated peptidoglycan samples were also treated with hydrofluoric acid (49%) at 4°C for 48 hours to remove teichoic acid. The peptidoglycan was recovered by centrifugation and washed with water four times.
Fluorescence Microscopy
The isolated peptidoglycan was resuspended in phosphate buffered saline (PBS) to 0.2 mg/mL and stained with 4′,6-diamidino-2-phenylindole (DAPI) (3 μM in PBS) for 10 minutes. The samples were examined by fluorescence microscopy on a thin pad of 1% agarose. Whole-cell samples were prepared (OD660 0.2) and examined the same way. All images were captured with a Nikon Ti-E microscope, 100X oil-immersion lens (NA=1.40) using phase contrast and a DU-885 cooled CCD camera (Andor) and μ-Manager software.
Solid-State NMR
All NMR experiments were performed with an 89-mm wide-bore Varian/Agilent magnet at 11.7 T (499.11 MHz for 1H, 125.49 MHz for 13C and 50.58 MHz for 15N), Varian console, and a home-built four-frequency transmission-line probe (33) with a 13.6 mm long, 6 mm inner-diameter sample coil and a Revolution NMR magic angle spinning Vespel stator. Samples were spun in thin-wall 5 mm outer-diameter zirconia rotors (Revolution NMR, LLC) at 8 kHz ± 2 Hz, using a Varian MAS control unit. The temperature was controlled by a variable temperature stack (FTS systems Inc) and maintained at 10 °C. American Microwave Technology RF power pulse amplifiers (M3445B, 2 kW, Herley Inc) were used to produce radiofrequency pulses for 15N (50 MHz) and 13C (125 MHz) while the 1H (499 MHz) radiofrequency pulses were generated by 2 kW tube amplifiers (Amplifier System Inc, Herley Inc) driven by a 50 W American Microwave Technology power amplifier (M3900C-2, Herley Inc), under active control (34). π pulse lengths were 10 μs for 13C and 15N for both echo and REDOR. Proton-carbon and proton-nitrogen matched cross-polarization transfers were at 50 kHz for 2 ms. The proton dipolar decoupling was applied at 83 kHz with a 2 s recycle delay. The chemical shift scale of the 13C NMR spectra was referenced to external adamantane and that of the 15N NMR spectra to external crystalline [1-13C, 15N]glycine. For quantification of amide and amine population in CPMAS spectra, the integral of each peak was obtained as a function of contact time and is extrapolated to zero contact time to account for the differences in rotating frame cross polarization dynamics (relaxation during cross polarization) between the amide and amine resonances.
Transmission Electron Microscopy
TEM was performed at the Stanford Cell Science Imaging Facility. Whole cell samples for ultrathin section TEM were grown in the same way as for NMR experiments and harvested at OD660 values shown in Figure 2a. For each sample, an aliquot of culture was removed and fixed overnight in 2% glutaraldehyde & 4% paraformaldehyde at 4 °C. The fixed samples were pelleted and washed in sodium cacodylate buffer three times to remove the excess fixative and resuspended in 20 μL gelatin solution at 37 °C. The suspensions were solidify on ice and then cut into ~1 mm3 blocks followed by post-fixation in 1% OsO4 at 4 °C for 1 hour. Samples were then washed with cold deionized H2O three times and stained with 1% uranyl acetate at 4 °C overnight. Dehydration of samples was carried out in a gradient series of ethanol. Samples were then embedded in Epon. Ultrathin (80 nm) sections were made with a Leica Ultracut S microtome, stained with uranyl acetate and lead citrate, and viewed on a JEM-1400 (JEOL, LLC). Images were analyzed with ImageJ. Cells with nearly equatorial cuts were selected for cell wall and septum thickness measurements to avoid systematic errors due to the section positioning.
Negative staining TEM was conducted on isolated peptidoglycan of stationary phase cells. 10 μL of 1 mg/mL peptidoglycan in PBS was applied onto the carbon coated copper grids (300 mesh) for 3 minutes and rinsed in deionized H2O. Each grid was then negatively stained with 2% uranyl acetate (dH2O) for 2 minutes and dried. The samples were examined with the same electron microscope as was used above.
HPLC and LC-MS
Digestion and analysis of peptidoglycan were carried out as described before (23, 24, 35) with some modifications. Peptidoglycan, normalized by OD600, was incubated with mutanolysin (Streptomyces globisporus, Sigma-Aldrich) in 12.5 mM phosphate buffer, pH 5.5 at 37 °C for 16 hours. Digested peptidoglycan samples were boiled for 10 minutes and centrifuged at 13,000g for 10 minutes. Soluble material was mixed with an equal volume of 0.5 M sodium borate (pH 9) and reduced via the addition of 3–5 mg of sodium borohydride at room temp for 30 minutes. The reaction was inactivated by the addition of 20% phosphoric acid and the final pH of the solution was adjusted to 2.
Reduced muropeptides were separated by HPLC on a 250×4.6 mm ODS hypersil 3 μm C18 column (Thermo Scientific) using an Agilent (Santa Clara, CA) 1100 column compartment, binary pump, autosampler and UV detector. The column was eluted at a flow rate of 0.5 ml/min with a linear gradient starting 5 minutes after injection of 5% (v/v) methanol to 30% (v/v) methanol in 100 mM NaH2PO4 (pH 2.5) in 150 minutes. The column temperature was 52°C. The eluted compounds were detected by absorption at 206 nm.
For liquid chromatography mass spectrometry (LC-MS), HPLC was performed using an Agilent (Santa Clara, CA) 1100 column compartment, binary pump, autosampler and UV detector on a Varian (Palo Alto, CA) Polaris 5u, C18-A column, 2.1×250 mm at ambient temperature. The flow rate was 0.25 mL/min with a gradient held for 4 minutes at 0% solvent B (acetonitrile with 0.1% formic acid) and 100% solvent A (0.1% formic acid in water) followed by a ramp from 0% B to 95% B in 30 minutes. Low resolution mass spectrometric analyses were carried out on a Thermo-Fisher (San Jose, CA) LTQ XL mass spectrometer equipped with an ESI source in electrospray positive mode (ESI+), and full scan (m/z 200–1800 Da) positive ion spectra were captured.
Both peptidoglycan samples treated with and without hydrofluoric acid were analyzed and compared with HPLC and LC-MS (Figure S1 and Table S2). The major features of the muropepetides discussed in this study are independent of the hydrofluoric acid treatment.
Solution NMR
All solution NMR experiments on media were acquired at the Stanford Magnetic Resonance Laboratory. 1H-13C HSQC spectra were acquired at 10 °C on a Varian Inova 600-MHz spectrometer, equipped with a 5-mm triple-resonance 1H{13C, 15N}, pulse-field gradient probe. 10 % D2O was added to samples for locking and shimming. Experiments were recorded with an 8000 Hz spectral width and 4000 data points, F1 dimension (13C) delay t1 set to zero, 3-s recycle delay and 256 scans. All HSQC data were processed in VNMRJ.
RESULTS
Cell-wall morphology is a function of growth stage in SASM
We first evaluated changes in the cell wall morphology at different growth stages of S. aureus strain 29213 grown in S. aureus synthetic medium (SASM). Ultrathin sections of S. aureus cells harvested at four different culture densities (monitored by OD660) were examined by transmission electron microscopy (TEM). Obvious differences are observed as cells transition to stationary phase (Figure 2). The average cell-wall thickness increases by 25% (Figure 2-b, Table 1) between exponential phase (OD 0.7) and stationary phase (OD 4). Furthermore, the septum thickness increases dramatically toward the stationary phase and each septum exhibits a nonuniform distribution of the thickness across the septum starting at early stationary phase—thicker towards the center and thinner towards the edges or cell surface (Figure 2c, d). Specifically, from OD 0.7 to OD 4 the average septum thickness increases by 1-fold near the edges and 2-fold around the center (Table 1).
TABLE 1.
Cell-wall properties at different growth stages
| OD (culture age) | Cell-wall thicknessa | Septum thicknessb | Non-bridge-linked stem%c |
|---|---|---|---|
| 0.7 (3.5 h) | 28 nm | 40 nm | 0% |
| 2.0 (5.3 h) | 30 nm | 46 / 50e nm | 1% |
| 3.6 (8 h) | 32 nm | 56 / 78e nm | 6% |
| 4.0 (12 h) | 35 nm | 78 / 118e nm | 12% |
Values are the averages of 8–10 measurements on each of 25 cells for each OD value, with standard deviations of 3–4 nm;
Values are the averages of 15 septa for each OD value with 2–6 measurements across the septum;
Percentage of non-bridge-linked stems with ±2% standard deviation based on three independent experiments.
Peptidoglycan bridge-link density is a function of growth stage in SASM
To determine if there were any changes in the chemical structure of the peptidoglycan at different growth stages, we used solid-state NMR to quantify the populations of bridge-links in specifically labeled peptidoglycan. We have found that rigorous and quantitative examination of the peptidoglycan chemical structure in S. aureus requires a stringent peptidoglycan isolation protocol to ensure that the preparation is pure with no whole-cell contaminants that could contribute to the spectra of isolated peptidoglycan. DAPI staining (Figure 3a) and SDS-PAGE (data not shown) confirmed that no DNA or proteins from unbroken cells were present in our peptidoglycan preparations. Negative staining TEM also confirmed that the majority of the specimens were empty sacculi which remained mostly intact with the spherical shape of the cell and septum but without the cellular contents (Figure 3c).
Figure 3. Verification of the purity of the isolated peptidoglycan.

(a) Light microscopy images of DAPI-stained whole cells (top) and isolated peptidoglycan (bottom) from stationary phase cells. The absence of DAPI fluorescence in isolated peptidoglycan indicates that there is no whole-cell contamination. (b) 13C CPMAS spectra of natural abundance whole cells and isolated peptidoglycan. Highlighted in box is the absence of purines in the isolated peptidoglycan spectrum which also confirms that no whole cells remained in the sample. (c) Negative staining TEM images of isolated peptidoglycan.
Specific labeling with L-[ε-15N]lysine is a useful way to profile peptidoglycan bridge-links, even in the context of S. aureus whole cells (30) as the bridge-linked lysine has a unique amide chemical shift and can be quantified. Incorporation of the 15N into other amino acids or molecules through scrambling (lysine catabolism), however, would affect the labeling specificity and would need to be accounted for in the analysis. The specificity of L-[ε-15N]lysine labeling was characterized in whole cells by 1D 15N CPMAS combined with 13C{15N}REDOR spectroscopy on stationary phase (OD 4, 12 h growth) cells grown in SASM with L-[ε-15N]lysine. Because the extent of possible label scrambling increases with bacterial growth time, experiments on stationary phase cells (OD 4) determine the maximum extent of scrambling in our studies. The 15N CPMAS spectrum (Figure 4a) shows only two peaks. The peak centered at 95 ppm is assigned to the bridge-links, the unique amide species formed between the Lys ε-N and glycine (typically part of a pentaglycine bridge) in the peptidoglycan and among Lipid II precursors. The second peak, centered at 10 ppm, corresponds to the amine form of the lysine ε-amino group, which, in whole cells, harbors contributions from peptidoglycan precursors without pentaglycine bridges attached (i.e. Park’s nucleotide, Lipid I and immature Lipid II), from cellular proteins, and from free lysine in the cytoplasm. The absence of other nitrogen resonances, such as those from His, Arg, Gln, or Asn residues, indicates that no significant scrambling has occurred. In addition, 13C{15N}REDOR with a 1-ms mixing time, to select for one-bond 13C-15N pairs, yields a REDOR difference spectrum (Figure 4b) with only the two major peaks expected. The carbonyl peak at 171 ppm corresponds to the Gly carbonyl that forms an amide bond with the Lys ε-N, and the second peak at 40 ppm is assigned to the Lys ε-C which is shift resolved from the α-carbons of other amino acids (31, 36). These data demonstrate that the L-[ε-15N]lysine in SASM was incorporated specifically without detectable scrambling.
Figure 4. Specificity of L-[ε-15N]Lys labeling in S. aureus whole cells.

(a) 15N CPMAS spectrum (4096 scans) and (b) 1-ms 13C{15N}REDOR spectra of lyophilized stationary phase (OD 4, 12 h growth) S. aureus whole cells grown in SASM with L-[ε-15N]lysine (51,200 scans). Spectra were acquired with a 500 MHz (1H frequency) magnet with 8 kHz spinning and 2 ms CP.
With these prerequisites satisfied, we examined the peptidoglycan bridge-link status as a function of growth stage. 15N CPMAS spectra of the peptidoglycan isolated from L-[ε-15N]lysine labeled cells harvested at four different growth stages were recorded, calibrated and compared as shown in Figure 5. In exponential phase (OD 0.7), only one peak at 95 ppm is present in the spectrum and is assigned to the amide form of Lys ε-N in a bridge-link with the pentaglycine bridge attached. However, starting from OD 2.0, where cells transition from the exponential phase to stationary phase, a second peak at 10 ppm emerges and grows larger towards OD 4 (stationary phase). As the purity of the peptidoglycan (Figure 3) and the specificity of the ε-15N Lys label (Figure 4) were demonstrated, we assigned this peak to the amine form of the Lys ε-N in the peptidoglycan corresponding to stems without an attached bridge. This population of non-bridge-linked stems increases progressively as cells enter stationary phase and reaches a maximum value of 12 % of all peptidoglycan stems at OD 4 (12 h growth, stationary phase).
Figure 5. S. aureus peptidoglycan chemical structure is a function of growth stage in SASM media.
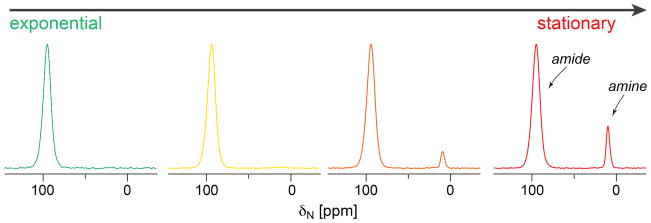
15N CPMAS spectra of [ε-15N]Lys labeled peptidoglycan isolated from S. aureus cells at OD 0.7, OD 2, OD 3.6 and OD 4 (from left to right); Spectra are normalized to the amide peak. The amine peak at 10 ppm starts to appear at OD 2.0 (not obvious) and grows towards OD 4 (stationary phase). Spectra were acquired using the same condition as in Figure 4.
HPLC and mass spectrometry confirms the presence of non-bridge-linked stems at stationary phase
To further characterize and compare the structural changes in peptidoglycan observed by solid-state NMR using the more commonly employed chromatographic and mass spectrometry methods on digested muropeptides, the peptidoglycan samples were treated with mutanolysin, which cleaves the MurNAc-(1→4)-GlcNAc linkage and releases the disaccharide muropeptides, and analyzed by reversed-phase HPLC. Additional peaks at early elution times (red dashed box in Figure 6a) were detected in the OD 4 peptidoglycan in comparison with the OD 2 peptidoglycan. These peaks have been observed in the peptidoglycan of S. aureus strain COL (24) and correspond to monomeric muropeptides without a bridge attached. Moreover, the “hump” originating from highly cross-linked muropeptides is smaller in OD 4 peptidoglycan compared to that of OD 2, suggesting that the peptidoglycan of cells harvested at OD 4 is less cross-linked. This could be attributed to the increase in the number of non-bridge-linked stems, which cannot participate in cross-linking. Additional peaks in the HPLC chromatogram of the OD 4 peptidoglycan were also observed in the region associated with monomeric muropeptides with an attached pentaglycine bridge (approximate retention time of 40 minutes). Thus, there appear to be other bridge-linked variants that are produced in addition to the typical pentaglycine-bridged stems.
Figure 6. HPLC and LC-MS confirm the presence of non-bridge-linked stems in stationary phase peptidoglycan.

(a) Muropeptide profiles of peptidoglycan isolated from S. aureus cells grown to OD 2 (where no obvious non-bridge-linked stems detected) and OD 4 (where 12% of the stems have no bridge attached), treated with mutanolysin and resolved with reversed-phase HPLC. The red dashed box highlights the additional peaks detected in OD 4 peptidoglycan that corresponds to monomers without a bridge attached. (b) A representative mass spectrum obtained from the muropeptides mixture of OD 4 peptidoglycan analyzed by LCMS, showing the major component of m/z=969.5, with the proposed structure.
In order to confirm the presence of the specific monomeric muropeptides, the muropeptide mixture was also separated and analyzed by LC-MS method (HPLC-MS condition). The detected species of interest are summarized and intensities compared in Table 2. The muropeptide with an m/z of 969.5 corresponds to the monomeric muropeptide with no bridge attached (GlcNAc-MurNAc-AQKAA) shown in Figure 6b and was detected as a major component in OD 4 peptidoglycan sample, but only as a very minor component in OD 2 peptidoglycan sample (the relative intensity of the signal based on peak area in the OD 4 peptidoglycan is approximately 20 times higher than in the OD 2 peptidoglycan for the same concentration of peptidoglycan). Another related muropeptide with m/z= 898.5 (71 units less than the above-mentioned muropeptide) was detected in the OD 4 peptidoglycan and can be attributed to the same monomeric muropeptide with a loss of a D-Ala at the stem terminus (GlcNAc-MurNAc-AQKA). Interestingly, a muropeptide with m/z=1040.5 (969.5+71) was also detected in OD 4 peptidoglycan sample, indicating an additional alanine, which is consistent with an identification as GlcNAc-MurNAc-AQK(A)AA, a muropeptide species that has been observed in S. aureus peptidoglycan previously (24), where an additional alanine is bonded through the ε-amino group of lysine.
TABLE 2.
Glycine-deficient monomeric muropeptides detected by LC-MS
| m/z | Proposed structurea | Peak area in OD 4 peptidoglycan | Peak area in OD 2 peptidoglycan | Ratiob |
|---|---|---|---|---|
| 969.5 | GlcNAc-MurNAc-AQKAA | 471947 | 23702 | 20 |
|
| ||||
| 1040.5 | GlcNAc-MurNAc-AQK(A)AA | 245256 | trace amount | |
| 898.5 | GlcNAc-MurNAc-AQKA | 74923 | trace amount | |
All the Lys (K) in the muropeptides in this study are isotopically enriched as [ε-15N]Lys;
Ratio of the peak area in the OD 4 and OD 2 peptidoglycan. Both peptidoglycan samples were adjusted to the same concentration by A600, and were prepared and injected the same way.
Glycine is depleted as cells enter the stationary phase
We hypothesized that, mechanistically, the observations associated with growth stage could be the result of glycine depletion, particularly since the peptidoglycan amino acid composition is approximately 50% glycine and the major structural alteration observed was that of peptidoglycan stems without glycine bridges. Thus, we monitored the changes of a few nutrients during growth including glucose (Figure S2) and glycine. We monitored glycine content in the nutrient medium directly by solution NMR using [2-13C]glycine-containing SASM. Briefly, cultures at designated growth stages (monitored by OD660) were sterile filtered to remove the cells and analyzed with 1H-13C HSQC to selectively detect [2-13C]glycine. The glycine region of the 13C-selected 1H NMR spectra obtained at each growth stage is shown in Figure 7a. The glycine level in SASM decreases as the culture grows and is significantly depleted starting at the early stationary phase (8h growth in SASM) where the non-bridge-linked stems were first observed. This finding supports the possibility that the depletion of glycine at stationary phase causes S. aureus cells to produce the more glycine-deficient peptidoglycan.
Figure 7. Glycine is depleted at stationary phase in SASM.

(a) Glycine level in SASM was monitored by solution NMR using [2-13C]glycine-containing SASM. Cultures from designated growth stages were sterile filtered to remove the cells, and 1H-13C HSQC spectra were acquired without arraying F1 dimension. The glycine region of the 13C-selected 1H NMR spectra obtained at different growth stages are shown and the peak integrals were used to quantify the glycine level in the media. (b) The glycine level in the medium is correlated with the culture growth stage.
The chemical structure of peptidoglycan depends on glycine availability
To further test the hypothesis that the structural changes in the S. aureus peptidoglycan are caused by glycine depletion, we manipulated the glycine concentration in SASM and sought to decouple effects due to glycine from those due to the growth stage of the culture. We first eliminated glycine entirely from SASM. Growth in SASM without glycine is delayed by about 12 hours but the culture eventually reaches the same final cell density as in the normal glycine(+) medium (Figure 8a left). The 15N CPMAS spectrum of the peptidoglycan of cells harvested at OD 2 in the glycine (−) SASM labeled with L-[ε-15N]Lys contains an amine peak, corresponding to stems without bridges. The effect of glycine starvation is not as severe as might be expected, owing to the de novo synthesis of glycine from other nutrients. Nonetheless, the removal of glycine from SASM media did accelerate the emergence of non-bridge-linked stems in peptidoglycan.
Figure 8. Glycine level in SASM modulates the chemical structure of peptidoglycan.

(a) Growth curves of S. aureus 29213 (left) and 15N CPMAS spectra of [ε-15N]Lys labeled peptidoglycan isolated from S. aureus cells at OD 2 (right) grown with (+glycine) and without glycine (−glycine). (b) Growth curves of S. aureus 29213 (left) and 15N CPMAS spectra of [ε-15N]Lys labeled peptidoglycan isolated from S. aureus cells at stationary phase (right) grown with 1X and 8X glycine.
In addition to the glycine elimination experiment, we supplemented SASM with additional glycine to examine the influence on S. aureus peptidoglycan structure at the stationary phase. Media with various initial glycine concentrations were tested and the glycine level in each was monitored during growth by solution NMR. We found that SASM with eight times the usual glycine concentration (800 mg/L vs 100 mg/L) still has glycine available in the medium at stationary phase (Figure S3). With this excess of glycine, the culture reaches a higher final cell density (Figure 8b left) and exhibits a slight postponement in reaching the stationary phase. Remarkably, the amine peak corresponding to the non-bridge-linked stems (glycine-deficient peptidoglycan) in 8X glycine L-[ε-15N]lysine-containing SASM is significantly suppressed at stationary phase, supporting the hypothesis that the availability of glycine allows for normal peptidoglycan assembly, while glycine deprivation is responsible for the synthesis of the structurally altered and glycine-deficient peptidoglycan.
The non-bridge-linked stems (glycine-deficient peptidoglycan) are newly synthesized
In principle, the observed non-bridge-attached stems (glycine-deficient peptidoglycan) at stationary phase grown in SASM could either arise from direct synthesis of such stems or from the hydrolysis or modification of previously synthesized peptidoglycan (to potentially release glycine for other use). To distinguish between these two possibilities, cells were grown in L-[ε-15N]lysine-containing SASM, pulse labeled with L-[ε-13C,15N]lysine at early stationary phase (OD 3.6, 8h growth) and harvested at later stationary phase (OD 4, 12 h growth) as indicated in Figure 9a. As shown in Figure 9a, the addition of L-[ε-13C,15N]lysine at early stationary phase does not affect the growth of S. aureus. 15N{13C} REDOR with 2 ms mixing time was employed to select the signal of the pulse label, L-[ε-13C,15N]lysine, from the L-[ε-15N]lysine in peptidoglycan isolated from the pulse-labeled cells. The S0 spectrum shows the overall ε-15N labeled lysine, including contributions from both the pulse label, [ε-13C,15N]lysine, and the background label, [ε-15N]lysine. The REDOR difference (ΔS) spectrum only reveals contributions from the pulse label, [ε-13C,15N]lysine. If the structural changes were due to modification of existing peptidoglycan, then the relative amine peak to amide peak ratio in the pulse label L-[ε-13C,15N]Lys should be smaller or at least comparable to that of the background label, L-[ε-15N]Lys, present from the start of growth. Yet, in the REDOR-selected 15N spectrum, the amine peak corresponding to non-bridge-linked stems is more than two times greater in the ΔS spectrum than in S0 spectrum, indicating that the non-bridge-linked stems are more highly enriched in the newly synthesized peptidoglycan. In addition, the pulse labeled L-[ε-13C,15N]Lys amines constitute 41% of the overall amine population (Figure 9b, ΔS/S0), which corresponds to most of the newly emerged Lys ε-N amines since the total percentage of amines doubles from OD 3.6 (after 8h growth) to OD 4 (after 12h growth) (Figure 5 and Table 1). Thus, these results suggest that the non-bridge-attached stems arise from altered synthesis rather than emerging as the result of modification or hydrolysis of existing peptidoglycan.
Figure 9. Pulse labeling reveals the preferential emergence of non-bridge-linked stems among newly synthesized, rather than existing peptidoglycan.
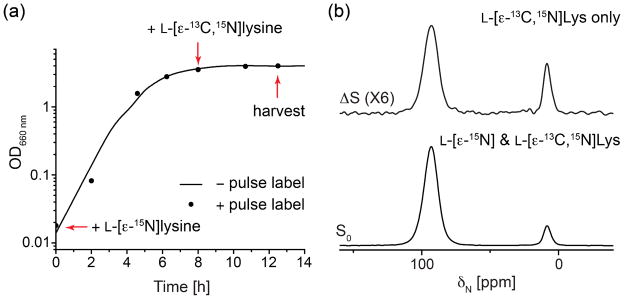
(a) Growth curves of S. aureus 29213 cells with and without pulse labeling by L-[ε-13C,15N]lysine. Arrows indicate the time at which the pulse label was addition and cells harvested. (b) 15N{13C} REDOR spectra with 2 ms mixing time of peptidoglycan isolated from stationary phase S. aureus cells labeled with L-[ε-15N]lysine and pulse labeled with L-[ε-13C,15N]lysine at early stationary phase (8h).
DISCUSSION
We have identified and characterized a structural variation in S. aureus peptidoglycan that we first observed in the stationary phase of cells grown in SASM, implementing both solid-state NMR on intact sacculi and HPLC-MS on digested muropeptides. We found that along with having thickened cell walls and non-uniformly thickened septa, the peptidoglycan of S. aureus cells harvested at stationary phase (grown in SASM) harbors non-bridge-linked stems and is thus less cross-linked. NMR permitted the quantification of these changes, which is not possible using the HPLC-MS methods due to the highly cross-linked peptidoglycan, evidenced by the high molecular weight “hump”, that cannot be resolved in the HPLC chromatogram. Furthermore, we demonstrated that the depletion of glycine that coincides with the start of the stationary phase, when grown in SASM, is responsible for the observed structural changes in SASM and that supplementing glycine could significantly suppress the emergence of non-bridge-linked stems. Thus, the structural alteration is not a direct response to growth stage, but appears to be triggered by the depletion of glycine in a medium which originally contained a sufficient glycine concentration to permit normal cell growth. This observation is consistent with the high demand for glycine in S. aureus peptidoglycan biosynthesis, particularly as cells grow to high cell densities and glycine becomes limiting.
Interestingly, high concentrations of exogenous glycine (4.5 g/L or more) added to rich media (TSB) can result in the assembly of peptidoglycan in which glycine is incorporated into the peptidoglycan in place on the terminal D-Ala (37). Since stems ending in D-Ala-Gly, rather than D-Ala-D-Ala, are poor substrates for enzymes involved in peptidoglycan assembly, this glycine modification lowers the degree of cross-linking, and 30 g/L of exogenously added glycine can even inhibit cell-wall synthesis and thus cell growth (38).
Our pulse labeling experiment indicates that the non-bridge-linked stems (resulting in glycine-deficient peptidoglycan) predominantly arise from newly synthesized peptidoglycan as opposed to the post-synthetic modification of previously synthesized peptidoglycan. In addition, no hydrolase in S. aureus, to the best of our knowledge, has been reported to cleave peptidoglycan at the Gly-(ε-N)Lys bridge-link site (35, 39), supporting the hypothesis that these peptidoglycan units are transported across the cell membrane as unbridge-linked stems, rather than emerging as the result of potential cleavage of the Gly-(ε-N)Lys bond outside the cell. It is also known that in spherical cells such as S. aureus, new peptidoglycan is inserted only at the division septum (40). Thus, our results are consistent with a model in which the non-uniformly thickened septa observed by microscopy may result from the newly synthesized glycine-deficient and less cross-linked peptidoglycan.
In summary, our data suggest that S. aureus can make and survive with “imperfect” peptidoglycan when glycine is depleted in the stationary phase. It is surprising that S. aureus is able to harbor a significant amount (12%) of non-bridge-linked stems in its peptidoglycan given the importance of the interpeptide pentaglycine bridge, where a FemX mutant (complete deletion of the bridge) is known to be lethal (8). Instead of pausing or slowing down the peptidoglycan biosynthesis during glycine starvation to coordinate with glycine synthesis to assemble canonical peptidoglycan, S. aureus produces glycine-deficient peptidoglycan and possibly compensates by increasing peptidoglycan thickness. These structural alterations were observed during growth in a commonly employed nutrient medium, and bacteria are likely to encounter similar nutrient limitation in the natural environment as well as in the host. Our findings emphasize the plasticity in S. aureus peptidoglycan assembly and inspire efforts to develop new strategies to manipulate and interfere with cell-wall synthesis.
Supplementary Material
Acknowledgments
We thank the CSIF at Stanford (John J. Perrino) for assistance with EM, Prof. KC Huang for microscope access, Prof. Elizabeth Sattely for HPLC access, Dr. Stephen R. Lynch for assistance with solution NMR and the Vincent Coates Foundation Mass Spectrometry Laboratory, Stanford University Mass Spectrometry (Dr. Ludmila Alexandrova) for mass spectrometry assistance. L.C. holds a Career Award at the Scientific Interface from the Burroughs Welcome Fund. X.Z. is the recipient of Stanford Interdisciplinary Graduate Fellowship. We gratefully acknowledge support from the NIH Director’s New Innovator Award; Stanford University; and the Stanford Terman Fellowship.
Footnotes
Isolated peptidoglycan yield and L-[ε-15N]Lys incorporation in peptidoglycan as a function of growth stage. Characterization of hydrofluoric acid treatment on peptidoglycan with HPLC and LC-MS. Glucose level in SASM as a function of growth stage and glycine level in media supplemented with various concentrations of glycine. This material is available free of charge via the Internet at http://pubs.acs.org.
REFERENCES AND NOTES
- 1.Foster TJ. Immune evasion by staphylococci. Nat Rev Microbiol. 2005;3:948–958. doi: 10.1038/nrmicro1289. [DOI] [PubMed] [Google Scholar]
- 2.de Lencastre H, Oliveira D, Tomasz A. Antibiotic resistant Staphylococcus aureus: a paradigm of adaptive power. Curr Opin Microbiol. 2007;10:428–435. doi: 10.1016/j.mib.2007.08.003. [DOI] [PMC free article] [PubMed] [Google Scholar]
- 3.Vollmer W, Blanot D, de Pedro MA. Peptidoglycan structure and architecture. FEMS Microbiol Rev. 2008;32:149–167. doi: 10.1111/j.1574-6976.2007.00094.x. [DOI] [PubMed] [Google Scholar]
- 4.Rohrer S, Berger-Bachi B. FemABX peptidyl transferases: a link between branched-chain cell wall peptide formation and beta-lactam resistance in gram-positive cocci. Antimicrob Agents Chemother. 2003;47:837–846. doi: 10.1128/AAC.47.3.837-846.2003. [DOI] [PMC free article] [PubMed] [Google Scholar]
- 5.Schneewind O, Fowler A, Faull KF. Structure of the Cell Wall Anchor of Surface Proteins in Staphylococcus aureus. Science. 1995;268:103–106. doi: 10.1126/science.7701329. [DOI] [PubMed] [Google Scholar]
- 6.Hendrickx APA, Budzik JM, Oh SY, Schneewind O. Architects at the bacterial surface — sortases and the assembly of pili with isopeptide bonds. Nat Rev Microbiol. 2011;9:166–176. doi: 10.1038/nrmicro2520. [DOI] [PubMed] [Google Scholar]
- 7.Maidhof H, Reinicke B, Blumel P, Berger-Bachi B, Labischinski H. femA, which encodes a factor essential for expression of methicillin resistance, affects glycine content of peptidoglycan in methicillin-resistant and methicillin-susceptible Staphylococcus aureus strains. J Bacteriol. 1991;173:3507–3513. doi: 10.1128/jb.173.11.3507-3513.1991. [DOI] [PMC free article] [PubMed] [Google Scholar]
- 8.Rohrer S, Ehlert K, Tschierske M, Labischinski H, Berger-Bachi B. The essential Staphylococcus aureus gene fmhB is involved in the first step of peptidoglycan pentaglycine interpeptide formation. Proc Natl Acad Sci U S A. 1999;96:9351–9356. doi: 10.1073/pnas.96.16.9351. [DOI] [PMC free article] [PubMed] [Google Scholar]
- 9.Vijaranakul U, Nadakavukaren MJ, de Jonge BL, Wilkinson BJ, Jayaswal RK. Increased cell size and shortened peptidoglycan interpeptide bridge of NaCl-stressed Staphylococcus aureus and their reversal by glycine betaine. J Bacteriol. 1995;177:5116–5121. doi: 10.1128/jb.177.17.5116-5121.1995. [DOI] [PMC free article] [PubMed] [Google Scholar]
- 10.Lam H, Oh DC, Cava F, Takacs CN, Clardy J, de Pedro MA, Waldor MK. D-Amino Acids Govern Stationary Phase Cell Wall Remodeling in Bacteria. Science. 2009;325:1552–1555. doi: 10.1126/science.1178123. [DOI] [PMC free article] [PubMed] [Google Scholar]
- 11.Caparros M, Pisabarro AG, de Pedro MA. Effect of D-amino acids on structure and synthesis of peptidoglycan in Escherichia coli. J Bacteriol. 1992;174:5549–5559. doi: 10.1128/jb.174.17.5549-5559.1992. [DOI] [PMC free article] [PubMed] [Google Scholar]
- 12.Mainardi JL, Villet Rg, Bugg TD, Mayer C, Arthur M. Evolution of peptidoglycan biosynthesis under the selective pressure of antibiotics in Gram-positive bacteria. FEMS Microbiol Rev. 2008;32:386–408. doi: 10.1111/j.1574-6976.2007.00097.x. [DOI] [PubMed] [Google Scholar]
- 13.Mayhall CG, Apollo E. Effect of storage and changes in bacterial growth phase and antibiotic concentrations on antimicrobial tolerance in Staphylococcus aureus. Antimicrob Agents Chemother. 1980;18:784–788. doi: 10.1128/aac.18.5.784. [DOI] [PMC free article] [PubMed] [Google Scholar]
- 14.Mercier RC, Stumpo C, Rybak MJ. Effect of growth phase and pH on the in vitro activity of a new glycopeptide, oritavancin (LY333328), against Staphylococcus aureus and Enterococcus faecium. J Antimicrob Chemother. 2002;50:19–24. doi: 10.1093/jac/dkf058. [DOI] [PubMed] [Google Scholar]
- 15.Anderl JN, Zahller J, Roe F, Stewart PS. Role of nutrient limitation and stationary-phase existence in Klebsiella pneumoniae biofilm resistance to ampicillin and ciprofloxacin. Antimicrob Agents Chemother. 2003;47:1251–1256. doi: 10.1128/AAC.47.4.1251-1256.2003. [DOI] [PMC free article] [PubMed] [Google Scholar]
- 16.Keren I, Kaldalu N, Spoering A, Wang Y, Lewis K. Persister cells and tolerance to antimicrobials. FEMS Microbiol Lett. 2004;230:13–18. doi: 10.1016/S0378-1097(03)00856-5. [DOI] [PubMed] [Google Scholar]
- 17.Hall-Stoodley L, Costerton JW, Stoodley P. Bacterial biofilms: from the natural environment to infectious diseases. Nat Rev Microbiol. 2004;2:95–108. doi: 10.1038/nrmicro821. [DOI] [PubMed] [Google Scholar]
- 18.Pisabarro AG, de Pedro MA, Vazquez D. Structural modifications in the peptidoglycan of Escherichia coli associated with changes in the state of growth of the culture. J Bacteriol. 1985;161:238–242. doi: 10.1128/jb.161.1.238-242.1985. [DOI] [PMC free article] [PubMed] [Google Scholar]
- 19.Glauner B, Holtje Joachim-V, Schwarz U. The Composition of the Murein of Escherichia coli. J Biol Chem. 1988;263:10088–10095. [PubMed] [Google Scholar]
- 20.Williams I, Paul F, Lloyd D, Jepras R, Critchley I, Newman M, Warrack J, Giokarini T, Hayes AJ, Randersonl PF, Venables WA. Flow cytometry and other techniques show that Staphylococcus aureus undergoes significant physiological changes in the early stages of surface-attached culture. Microbiol. 1999;145 doi: 10.1099/13500872-145-6-1325. [DOI] [PubMed] [Google Scholar]
- 21.Turner RD, Ratcliffe EC, Wheeler R, Golestanian R, Hobbs JK, Foster SJ. Peptidoglycan architecture can specify division planes in Staphylococcus aureus. Nat Commun. 2010;1:1–9. doi: 10.1038/ncomms1025. [DOI] [PubMed] [Google Scholar]
- 22.Vollmer W, Seligman SJ. E. coli peptidoglycan is 20% ~ 40% cross-linked while it is over 80% in S. aureus Architecture of peptidoglycan: more data and more models. Trends Microbiol. 2010;18:59–66. doi: 10.1016/j.tim.2009.12.004. [DOI] [PubMed] [Google Scholar]
- 23.Glauner B. Separation and Quantification of Muropeptides with High-Performance Liquid Chromatography. Anal Biochem. 1988;172:451–464. doi: 10.1016/0003-2697(88)90468-x. [DOI] [PubMed] [Google Scholar]
- 24.de Jonge BL, Chang YS, Gage D, Tomasz A. Peptidoglycan composition of a highly methicillin-resistant Staphylococcus aureus strain. The role of penicillin binding protein 2A. J Biol Chem. 1992;267:11248–11254. [PubMed] [Google Scholar]
- 25.Boneca IG, Huang Z-H, Gage DA, Tomasz A. Characterization of Staphylococcus aureus Cell Wall Glycan Strands, Evidence for a New Beta-N-Acetylglucosaminidase Activity. J Bacteriol. 2000;275:9910–9918. doi: 10.1074/jbc.275.14.9910. [DOI] [PubMed] [Google Scholar]
- 26.Patti GJ, Chen J, Gross ML. Method Revealing Bacterial Cell-Wall Architecture by Time-Dependent Isotope Labeling and Quantitative Liquid Chromatography/Mass Spectrometry. Anal Chem. 2009;81:2437–2445. doi: 10.1021/ac802587r. [DOI] [PMC free article] [PubMed] [Google Scholar]
- 27.Kern T, Hediger S, Müller PM, Giustini Cc, Joris B, Bougault C, Vollmer W, Simorre JP. Toward the Characterization of Peptidoglycan Structure and Protein-Peptidoglycan Interactions by Solid-State NMR Spectroscopy. J Am Chem Soc. 2008;130:5618–5619. doi: 10.1021/ja7108135. [DOI] [PubMed] [Google Scholar]
- 28.Kern T, Giffard M, Hediger S, Amoroso A, Giustini Cc, Bui NK, Joris B, Bougault C, Vollmer W, Simorre JP. Dynamics Characterization of Fully Hydrated Bacterial Cell Walls by Solid-State NMR: Evidence for Cooperative Binding of Metal Ions. J Am Chem Soc. 2010;132:10911–10919. doi: 10.1021/ja104533w. [DOI] [PubMed] [Google Scholar]
- 29.Tong G, Pan Y, Dong H, Pryor R, Wilson GE, Schaefer J. Structure and Dynamics of Pentaglycyl Bridges in the Cell Walls of Staphylococcus aureus by 13C-15N REDOR NMR. Biochemistry. 1997;36:9859–9866. doi: 10.1021/bi970495d. [DOI] [PubMed] [Google Scholar]
- 30.Cegelski L, Kim SJ, Hing AW, Studelska DR, O’Connor RD, Mehta AK, Schaefer J. Rotational-Echo Double Resonance Characterization of the Effects of Vancomycin on Cell Wall Synthesis in Staphylococcus aureus. Biochemistry. 2002;41:13053–13058. doi: 10.1021/bi0202326. [DOI] [PubMed] [Google Scholar]
- 31.Sharif S, Singh M, Kim SJ, Schaefer J. Staphylococcus aureus Peptidoglycan Tertiary Structure from Carbon-13 Spin Diffusion. J Am Chem Soc. 2009;131:7023–7030. doi: 10.1021/ja808971c. [DOI] [PMC free article] [PubMed] [Google Scholar]
- 32.Kim SJ, Cegelski L, Studelska DR, O’Connor RD, Mehta AK, Schaefer J. Rotational-echo double resonance characterization of vancomycin binding sites in Staphylococcus aureus. Biochemistry. 2002;41:6967–6977. doi: 10.1021/bi0121407. [DOI] [PubMed] [Google Scholar]
- 33.Schaefer J, McKay RA. Multi-Tuned Single-Coil Transmission-Line Probe for Nuclear Magnetic Resonance Spectrometer. US Patent 5. 1999;861:748. [Google Scholar]
- 34.Stueber D, Mehta AK, Chen Z, Wooley KL, Schaefer J. Local order in polycarbonate glasses by 13C{19F} rotational-echo double-resonance NMR. J Polym Sci Part B Polym Phys. 2006;44:2760–2775. [Google Scholar]
- 35.Frankel MB, Hendrickx APA, Missiakas DM, Schneewind O. LytN, a Murein Hydrolase in the Cross-wall Compartment of Staphylococcus aureus, Is Involved in Proper Bacterial Growth and Envelope Assembly. J Biol Chem. 2011;286:32593–32605. doi: 10.1074/jbc.M111.258863. [DOI] [PMC free article] [PubMed] [Google Scholar]
- 36.Meroueh SO. Three-dimensional structure of the bacterial cell wall peptidoglycan. Proc Natl Acad Sci U S A. 2006;103:4404–4409. doi: 10.1073/pnas.0510182103. [DOI] [PMC free article] [PubMed] [Google Scholar]
- 37.de Jonge BL, Chang YS, Xu N, Gage D. Effect of exogenous glycine on peptidoglycan composition and resistance in a methicillin-resistant Staphylococcus aureus strain. Antimicrob Agents Chemother. 1996;40:1498–1503. doi: 10.1128/aac.40.6.1498. [DOI] [PMC free article] [PubMed] [Google Scholar]
- 38.Hammes W, Schleifer KH, Kandler O. Mode of action of glycine on the biosynthesis of peptidoglycan. J Bacteriol. 1973;116:1029–1053. doi: 10.1128/jb.116.2.1029-1053.1973. [DOI] [PMC free article] [PubMed] [Google Scholar]
- 39.Ramadurai L, Lockwood KJ, Nadakavukaren MJ, Jayaswal RK. Characterization of a chromosomally encoded glycylglycine endopeptidase of Staphylococcus aureus. Microbiol. 1999;145:801–808. doi: 10.1099/13500872-145-4-801. [DOI] [PubMed] [Google Scholar]
- 40.Scheffers DJ, Pinho MG. Bacterial Cell Wall Synthesis: New Insights from Localization Studies. Microbiol Mol Biol Rev. 2005;69:585–607. doi: 10.1128/MMBR.69.4.585-607.2005. [DOI] [PMC free article] [PubMed] [Google Scholar]
Associated Data
This section collects any data citations, data availability statements, or supplementary materials included in this article.