

Abstract
NANOG is a stem cell transcription factor that is essential for embryonic development, reprogramming normal adult cells and malignant transformation and progression. The nearly identical retrogene NANOGP8 is expressed in multiple cancers, but generally not in normal tissues and its function is not well defined. Our postulate is that NANOGP8 directly modulates the stemness of individual human colorectal carcinoma (CRC) cells. Stemness was measured in vitro as the spherogenicity of single CRC cells in serum free medium and the size of the side population and in vivo as tumorigenicity and experimental metastatic potential in NOD/SCID mice. We found that 80% of clinical liver metastases express a NANOG with 75% of the positive metastases containing NANOGP8 transcripts. 3 to 62% of single cells within 6 CRC lines form spheroids in serum free medium in suspension. NANOGP8 is translated into protein. The relative expression of a NANOG gene increased 8–122 fold during spheroid formation, more than the increase in OCT4 or SOX2 transcripts with NANOGP8 the more prevalent family member. shRNA to NANOG not only inhibits spherogenicity but also reduces expression of OCT4 and SOX2, the size of the side population and tumor growth in vivo. Inhibition of NANOG gene expression is associated with inhibition of proliferation and decreased phosphorylation of G2-related cell cycle proteins. Overexpression of NANOGP8 rescues single cell spherogenicity when NANOG gene expression is inhibited and increases the side population in CRC. Thus, NANOGP8 can substitute for NANOG in directly promoting stemness in CRC.
Keywords: NANOG, NANOGP8, stemness, colorectal cancer, cancer stem cell
Introduction
Normal and malignant adult cells retain the capacity to be reprogrammed to induced pluripotent stem cells (iPS) cells from mouse and human adult cells (1–3), from patients (4) and from cancer cells (5). The core embryonic stem cell (ES) transcription factors (TFs) OCT4, SOX2 and NANOG are central to such reprogramming although other genes like KLF4, c-Myc, Lin28 (1–3) are also involved. NANOG is essential for stemness in adult cells (6) and during embryonic development (7,8), while OCT4 and SOX2 are dispensable for reprogramming iPS cells (9, 10). NANOG is a homeobox protein that is regulated at the allelic level to maintain the pluripotent ground state (11). NANOG has a retrogene NANOGP8 that appears to be the prevalent NANOG expressed in human breast cancer (12), prostate cancer (13, 14), medulloblastoma and glioblastoma multiforme (15, 16), colorectal carcinoma (13, 17 – 20) and leukemia (21). Inhibition of NANOG expression has led to a reduction in tumorigenicity and such in vitro characteristics of stem cells as anchorage independent growth (13, 19) whereas overexpression may increase tumorigenicity (14). The role of NANOGP8 as a potential substitute for NANOG when NANOG is absent is not entirely clear. Jeter et al., (13) demonstrated that overexpression of NANOGP8 in cells transfected with a Lentiviral vector encoding shRNA targeting NANOG’s 3′UTR ‘rescued’ proliferation but not in cells transfected with shRNA targeting the coding sequence of NANOG. Thus, the role of NANOGP8 in maintaining the stemness of malignant cells needs further definition.
Our purpose in this study was to define whether NANOGP8 could replace NANOG in CRC in mediating stem cell like characteristics. We assessed this by assessing the ability of NANOGP8 to ‘rescue’ spherogenicity in individual CRC cells whose NANOG expression had been inhibited. During this study, we confirmed and extended the observations of others (13, 17–20) that both NANOG and NANOGP8 are expressed in clinical metastases of CRC, that inhibition of NANOG reduces the expression and activity of several regulators of G2 cell cycle progression and that inhibition of NANOGP8 decreases the stem-like activities of CRC both in vitro and in vivo. Finally, we show that the capacity of individual CRC cells to form spheroids in suspension culture in serum free medium can be maintained by NANOGP8 in the absence of NANOG.
Results
The Retrogene NANOGP8 is Upregulated in Clinical Samples
NANOG and its retrogene NANOGP8 (12, 13, 16) are frequently upregulated in human cancers. To investigate if NANOG is expressed in CRC, we first did an immunofluorescent assay (IFA) on ten clinical liver metastases with a commercially available NANOG antibody, which recognizes both NANOG and NANOGP8. NANOG was mainly located in cytoplasm in CRC (Figure 1a) as described by Meng et al (18). This is in contrast to the control specimen of a human seminoma – a germ cell tumor – that has the expected intranuclear location for NANOG (Figure 1b). CD44v6 was used to mark CRC cells because its expression reflects propensity for metastasis in CRC patients (22). When the antibody to NANOG was blocked with recombinant NANOG peptides, the fluorescence due to NANOG was removed (Supplementary Figures 1a–e). The IFA staining is specific to NANOG and eight of ten liver metastases express NANOG proteins (Supplementary Table 1).
Figure 1. The Retrogene NANOGP8 is Upregulated in Clinical Samples.

(a–b) 5 μ formalin-fixed paraffin embedded specimens of liver metastases sections were analyzed for the expression of NANOG protein and CD44v6 by immunofluorescence assay (IFA) that included DAPI nuclear counter stains. Patient 9 (whose tumor expressed only NANOGP8 transcripts) (a) is shown. Positive controls included similar sections of formalin-fixed paraffin-embedded human seminoma that is known to express nuclear NANOG (b). Images were captured on a Nikon 90i microscope with a DU888 EMCCD camera and analyzed with NIS-Elements software. Object magnification, 20X. White Bars are 10 microns.
(c) The restriction endonuclease that distinguishes the two genes is AlwNI, an enzyme that identifies a palindromic hexanucleotide sequence in NANOGP8 but not NANOG at position 144 relative to the translational start site.
(d–f) Sections from liver metastases that had been resected were microdissected and total RNA prepared from tumor and adjacent normal liver. RT-PCR products were run out on agarose gels and GAPDH as an internal control and 8 metastatic tumors (T) and 4 adjacent microscopically normal liver samples (N) contained NANOG transcripts (d). When the positive cDNAs from Panel d were subjected to digestion with AlwNI, 6 tumor samples and 1 adjacent liver contained NANOGP8 (e–f). These results were confirmed by direct sequencing (data not shown). The relative NANOGP8 expression is calculated as the ratio between densitometry reading of NANOGP8 and total NANOG by using Image J software. Abbreviations: M, 100bp DNA ladder marker; bp, base pair; UD, undigested; D, digested with AlwNI; N, adjacent normal liver sample; T, tumor sample; +, positive; −, negative.
In order to further distinguish which NANOG is expressed in clinical samples, we examined the transcripts for those genes. Since NANOGP8 is an intronless retrogene located on chromosome 15 whereas the NANOG gene is located on chromosome 12 (23) and differs by 6 nucleotides with one (12) or 2 to 3 non-synonymous amino acid changes due to other nonconserved nucleotide changes (13, 16, 24), we found a single restriction endonuclease that distinguishes the two genes: AlwNI (25), an enzyme that identifies a palindromic hexanucleotide sequence in NANOGP8 but not in NANOG at position 144 relative to the translational start site (Figure 1c). NANOG transcripts were identified in 8 of 10 liver metastases and also in 4 adjacent microscopically normal liver sections (Figures 1d–f). Moreover, 6 of the 8 positive tumor specimens contained NANOGP8 transcripts with 2 each containing only NANOGP8 or NANOG transcripts. Only one of the adjacent liver specimens contained NANOGP8 while the 3 others only expressed NANOG transcripts (Figure 1d–f). Sanger sequencing confirmed the endonuclease results (data not shown). Thus, based on this small sample approximately 80% of clinical CRC metastases expressed NANOG family members with 75% of those expressing NANOGP8.
The Retrogene NANOGP8 is the Prevalent NANOG expressed in CRC
Expression of NANOGP8 in clinical tissues is important but is it translated and functional in CRC? To assess this, we investigated whether ES TFs and other CSC related markers are upregulated in 6 CRC lines during formation of spheroids in serum free medium. Relative expression of NANOG transcripts was consistently increased in spheroids 8 – 122-fold compared to monolayer cultures except in KM12c whereas the relative expression of OCT4 was ~40-fold. The SOX2 expression varied between 1 and 63-fold in spheroids compared to monolayer cultures (Figures 2a and b ). However, the expression of CD44, CD133 or CD166 was not significantly increased in spheroid cultures compared to monolayer except in KM 12c, CX-1 and LS 174T (Supplementary Figures 2a and b). When cDNA from the CRC lines was digested with AlwNI, NANOGP8 was expressed in both the monolayer (Figure 2c) and spheroid cultures (Figure 2d) of the 6 CRC lines. Over 84% of the NANOG expressed in monolayer cultures of CX-1 and Clone A was NANOGP8 and this expression increased to over 94% in spheroids (Figure 2e). The results were confirmed by direct sequencing (data not shown). Thus, expression of NANOG transcripts is increased as CRC transition to vertical growth to form spheroids, NANOGP8 is the prevalent form of NANOG expressed in CRC cell lines and was the most consistently up-regulated TF in this panel of 6 CRC lines compared to OCT4 and SOX2.
Figure 2. NANOGP8 is Prevalent Form of NANOG Expressed in CRC Lines.
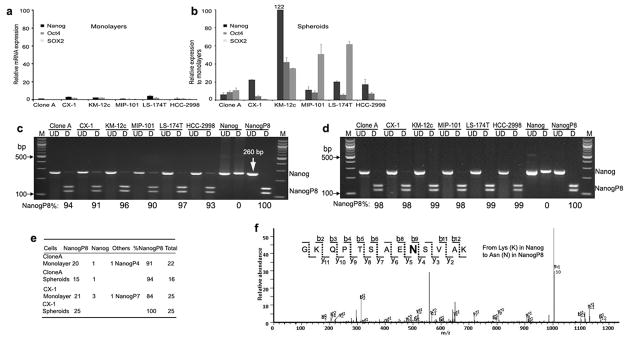
(a–b) Total RNA was extracted and qRT-PCR was performed for embryonic stem cell TFs. The results were normalized to GAPDH and HCC 2998 monolayers. Mean % ± SD.
(c–d) Restriction endonuclease digestion of 260 nt length of NANOG by RT-PCR amplifies a region where there is a SNP that identifies NANOGP8. Digestion with AlwNI reveals that even in monolayer culture NANOGP8 is frequently expressed in CRC lines (c) as well as in spheroids (d). The relative NANOGP8 expression is calculated as the ratio between densitometry reading of NANOGP8 and total NANOG by using Image J software. Direct sequencing confirmed that NANOGP8 is consistently upregulated in Clone A and CX-1 spheroids (e). Numbers in (e) stand for the numbers of NANOG or NANOGP8 in sequenced clones.
(f) MS/MS spectrum of a NANOGP8 tryptic peptide GKQPTSAENSVAK. This peptide is unique to NANOGP8, which includes the shift from Lys (K) in NANOG to Asn (N) in NANOGP8 at codon 82. Abbreviations: M, 100bp DNA ladder marker; bp, base pair; UD, undigested; D, digested with AlwNI.
To confirm that NANOGP8 is translated in CRC, we used tandem mass spectrometry (MS/MS) to identify the NANOGP8 protein in CRC lines. Extracts from Clone A overexpressing NANOGP8 were immunoprecipitated, isolated by SDS-PAGE, subjected to in gel tryptic digestion followed by MS/MS. Four NANOG-related peptides (KTWFQNQRM, KYLSLQQMQELSNILNLSYKQ, KKEDKVPVKK, and KGKQPTSAENSVAKK) were identified in extracts from Clone A overexpressing NANOGP8. Interestingly, the last peptide is unique to NANOGP8, with the shift from Lys (K) in NANOG to Asn (N) in NANOGP8 at codon 82 (Figure 2f and Supplementary Figure 3a). This amino acid change was also reported (16, 24) and confirmed by gene sequencing. NANOG/NANOGP8 proteins were not identified in extracts of CRC cell lines without overexpression by transduction presumably because CRC cell lines express low levels of endogenous proteins.
Modulation of NANOG Gene Expression Affects Spherogenicity of Individual CRC Cells
The capacity of single CRC cells to form spheres – a hallmark of malignant potential – was tested in 6 cell lines in serum-free medium in ultra-low attachment (ULLA) plates in individual wells with spheroids of 50 or more cells scored after at least 9 days of culture. All CRC lines formed spheroids at frequencies that ranged from 1 – 56% of single cells plated (Figure 3a).
Figure 3. Modulation of NANOG Gene Expression Affects Spherogenicity in CRC Lines.
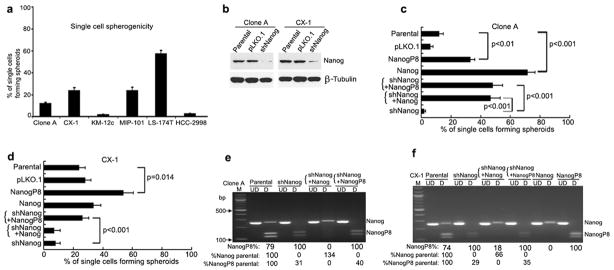
(a) Single cells were cultured in serum-free medium in ULLA microtiter plates for 9 days and then scored for the number of spheroids that each single cell produced (Mean ± SD of % of single cells that formed spheroids of 50 or more cells). All CRC lines formed spheroids at frequencies that ranged from 1 – 56% of single cells plated.
(b) Western blot of NANOG in parental cells, control vector (pLKO.1) and shNANOG transduced Clone A, CX-1.
(c–d) Single cells forming spheroids were scored in Clone A (c) and CX-1 (d) transduced with lentiviral vectors containing shRNA to NANOG, pLKO.1, full length NANOG, or full length NANOGP8. shNANOG inhibited spheroid formation in both CRC compared to the parental cells. In addition, shNanog cells were secondarily transduced with Nanog or NANOGP8 for 5 days before culture for single cell spherogenicity or evaluation of transcript expression. Recovery of NANOGP8 either in Clone A or CX-1 transduced shNANOG restored the single cell spherogenicity. Mean ± SD of single cells forming spheroids of 50 or more cells.
(e–f) Restriction endonuclease digestion of 260 nt length of NANOG by RT-PCR amplifies a region where there is a single nucleotide alteration that identifies NANOGP8. Digestion with AlwNI reveals that shNANOG inhibits NANOG and transduction with either lentiviral vector NANOG or NANOGP8 increased NANOG or NANOGP8 trancripts, respectively. The relative NANOGP8 expression is calculated as the ratio between densitometry reading of NANOGP8 and total NANOG by using Image J software. Abbreviations: M, 100bp DNA ladder marker; bp, base pair; UD, undigested; D, digested with AlwNI.
We then inhibited total NANOG mRNA expression using lentiviral-delivered shRNA to examine the functional relevance of NANOG in spherogenicity in CRC cell lines. Transduction of Clone A and CX-1 with a commercial shNanog reduced NANOG transcript levels in Clone A and CX-1 by at least 50% (Supplementary Figures 4c and d) and NANOG protein levels by 90% (Figure 3b). In addition, shNanog transduction decreased OCT4 transcripts significantly in both Clone A and CX-1 with trends in reduction of SOX2 transcript levels (Supplementary Figures 4a and b). Interestingly, overexpression of NANOG and NANOGP8 increased NANOG transcripts in shNanog transductants by at least two-fold over the untreated parental cells (Supplementary Figures 4c and d) with only the overexpressed NANOG or NANOGP8 transcripts in each line (Figures 3e and f). shNanog transduction alone significantly decreased formation of spheres in both Clone A and CX-1 by 40% – 90% compared to untreated parental cells and cells transduced with the empty vector pLKO.1 (Figures 3c and d). Moreover, shNanog transductants of Clone A and CX-1 lacked expression of NANOG but did express NANOGP8, albeit at reduced levels (Figures 3e and f, respectively). When Clone A shNanog cells were secondarily transduced with NANOG or NANOGP8, the level of NANOG transcripts were a fold higher while the NANOGP8 levels were increased by nearly 30% compared to levels in shNanog Clone A (Figure 3e). When the relative distribution of NANOG and NANOGP8 is combined with the increase in levels of transcripts in the shNanog cells overexpressing NANOG or NANOGP8 the levels of either gene were similar to those of the parental untreated Clone A or CX-1 (Figures 3c and d, Supplementary Figures 4 c and d). Overexpression of NANOGP8 significantly increased spherogenicity in both Clone A and CX-1 shNanog cells but overexpression with NANOG only increased spherogenicity in Clone A shNanog (Figures 3c and d). The inability of NANOG overexpression to ‘rescue’ spherogenicity in CX-1 may be associated with the response of the CX-1 cells to transduction with NANOG since the relative gene transcript expression is not as high as in Clone A even though the total NANOG transcript levels were higher in the overexpressing shNanog cells than in the parental untreated cells (Supplementary Figures 4c and d). In contrast, transduction with NANOGP8 did achieve similar relative increases over the transcript levels in shNanog transductants. Thus, NANOGP8 expression appears to rescue the capacity of single CRC cells to form spheroids in the absence of parental NANOG.
Inhibition of NANOG Decreases Tumorigenicity and Experimental Metastasis by CX-1
CRC were injected subcutaneously in NOD/SCID mice in cell dilutions of 103 – 105 cells per mouse. At 103 and 104 cells per mouse CX-1 cells transduced with shNanog had fewer tumors than did either the parental cell line or the pLKO.1 control (Figure 4a). We elected to test different constructs in NOD/SCID mice injected subcutaneously with 105 cells in order to assess tumorigenicity at a consistent cell concentration between experiments. The growth of shNanog transduced CX-1 was slower than the pLKO.1 control since the median number of days to palpable tumor is increased about 50% (Figure 4b). However, overexpression of either NANOG or NANOGP8 can dramatically shorten the time to palpable tumor (Figure 4b). In addition, 50% of the mice in the shNanog CX-1 groups remained tumor free during the time of the experiment (Figure 4b). Thus, inhibition of NANOG decreased the growth of CX-1 in vivo.
Figure 4. shNANOG Inhibits Tumorigenicity and Experimental Metastasis.

(a–b) Groups of 5 – 10 NOD/SCID mice were injected with dilutions of 103–105 viable CX-1 cells subcutaneously in NOD/SCID mice. Parental, pLKO.1 and shNANOG transductants were scored for the appearance of tumors over 70 days after tumor inoculation. shNANOG decreased tumorigenicity at each dilution (a). 105 CX-1 cells transducted with lentiviral vectors containing shRNA to NANOG, pLKO.1, or the intact NANOG coding sequence were injected into NOD/SCID mice. shNANOG decreases growth by prolonging the median days to appearance of tumors as well as the percentage of mice that are tumor free in mice injected with CX-1 cells (b). Overexpression of NANOG shortened the median number of days to tumor appearance compared to the pLKO.1 group (b).
(c) When 2 × 10⁶ CX-1 cells were injected into the spleens of NOD/SCID mice, no shNANOG transduced CX-1 cells formed either gross or microscopic liver experimental metastases whereas 45 – 70% of mice injected with parental or control vector did. Error bars: SD. Experimental metastasis from Parental CX-1 did not generate fibrosis or host inflammatory response (data not shown).
Another test of the effect of shRNA to NANOG on the malignant phenotype involves experimental metastasis since liver colonization after intrasplenic injection of viable CRC cells is associated with recurrence in patients operated on for cure (26). shNanog CX-1 cells failed to form grossly visible or microscopic hepatic liver colonies compared to either the parental CX-1 cells or CX-1 cells transduced pLKO.1 (Figure 4c).
Mechanism of Action of Inhibition of NANOG
Transductants of CX-1 and Clone A were analyzed for the effect of NANOG inhibition or overexpression on cell proliferation. Analysis of cell proliferation indicated that shRNA of NANOG caused both CX-1 and Clone A cells to proliferate more slowly than the parental or empty vector control (Figures 5a and b). In contrast, NANOG or NANOGP8 overexpression in Clone A or NANOG in CX-1 increased cell proliferation (Figures 5a and b). When cell cycle protein expression was analyzed, Wee1 expression (Figure 5c) was decreased significantly with down regulation of phosphorylation of Cdc2, Cdc25C and other proteins involved in the G2/M aspect of the cell cycle (Figure 5c). To further explore the potential molecular mechanisms of NANOG-promoted cell proliferation in CRC, we analyzed the interaction between NANOG and Pin 1, a mitotic kinase that is phosphorylated on multiple Ser/Thr-Pro motifs (27) to maintain pluripotency and cell proliferation (28). IFA results show both NANOG and Pin 1 are perinuclear in Clone A (Figure 5d). Reciprocal co-immunoprecipitation experiments confirmed that NANOG and Pin 1 interact in Clone A and Clone A transduced NANOGP8 (Figure 5e). Thus, NANOG proteins may have a cytoplasmic function as well as its function as a transcription factor.
Figure 5. shNANOG Induces Cell Cycle Inhibition in CRC.

Clone A and CX-1 cells transduced with LV shNANOG, RFP control (RFP), full length NANOG or NANOGP8 were analyzed for cell proliferation (a, b) and expression of cell cycle-related proteins by Western blot (c). Controls were either the untreated parental CRC cell line or the pLKO.1 empty vector control. Wee1 protein expression is decreased in Clone A and CX-1 with a reduction in phosphorylation of cdc2, chk1, and CDC25C (c). P values by contingency table analysis with Bonferroni correction. * P<0.05 vs Parental Clone A or CX-1.
(d) Detection of the NANOG and Pin 1 in Clone A cells by IFA. Object magnification: 40X.
(e) The interaction of NANOG protein and Pin 1 in Clone A and Clone A transduced with NANOGP8 shown by reciprocal co-immunoprecipitation analysis. + and − refer to IP with or without primary antibody as negative controls in immunoprecipitation. IP, immunoprecipitation; WB, Western blotting.
Inhibition of NANOGP8 Decreases Spherogenicity, Inhibits tumorigenicity and Affects Side Population
If NANOGP8 is the prevalent form of NANOG expressed in CRC, then it would be appropriate to target NANOGP8 to spare inhibition of NANOG if it is required for normal adult stem cell function. shRNAs were designed for both NANOG and NANOGP8 based on guidelines developed for inhibition of single nucleotide polymorphisms (SNPs) (29, 30). The designs are termed allele-specific shRNA to NANOG because, although not alleles at the same locus, the single nucleotide differences between NANOG and NANOGP8 are similar to targeting SNPs. shRNAs were designed to target the most 3′ single nucleotide difference at nucleotide 759 in the coding sequence (Supplementary Figure 3b). When tested for specificity of inhibition of NANOG versus NANOGP8, the shRNAs were tested on the human embryonal carcinoma PA-1 that only expresses NANOG (12) which is confirmed by AlwNI cutting and direct sequencing (Supplementary Figure 5a) and the CX-1 line that expresses predominantly NANOGP8. The potential candidate should be the shRNA that inhibits NANOGP8 in CX-1 and has less effect on NANOG in PA-1. shNp8-1 did not inhibit the expression of NANOG transcripts in PA-1 whereas the shNg-1 did (Figure 6a). In contrast, shNp8-1 inhibited the more prevalent NANOGP8 transcripts in CX-1 (Figure 6b). When tested for their ability to inhibit single cell spherogenicity in CRC, shNp8-1 significantly inhibited sphere formation in 3 cell lines (Figures 5c-e) whereas shNg-1 did not.
Figure 6. Inhibition of NANOGP8 Inhibits Spherogenicity, Tumorigenicity and the size of Side Population in CRC Cells.

(a–b) PA-1 is a human embryonal stem cell line that only expresses NANOG whereas CX-1 expresses both NANOG and NANOG P8. shNP8-1 did not decrease NANOG levels in PA-1 although shNg-1 did (a) but decreased transcript levels in CX-1 cells (b). Data normalized by GAPDH levels and levels of transcripts in the parental untreated line. P values after Bonferroni correction of contingency table analysis. * P<0.01 vs Parental PA-1 or CX-1.
(c–d) Effect of shRNA on single cell spherogenicity of Clone A (c), CX-1 (d), and LS 174T (e). shNP8-1 inhibited spherogenicity in all 3 CRC lines whereas shNg-1 did not. Mean % ± SD. P values by contingency table analysis with Bonferroni correction. P values after Bonferroni correction of contingency table analysis. ** P <0.001 vs Parental Clone A or CX-1.
(f–g) Detection of SP in CX-1 (g) and KM-12c (h) transduced with control (shNeg), shNp8-1, RFP control (RFP), the intact NANOG coding sequence (NANOG) or the NANOGP8 coding sequence (NANOGP8). Mean % ± SD. P values by contingency table analysis with Bonferroni correction. * P<0.01 vs Parental CX-1 or KM-12c.
(h–j) Groups of 10 mice were injected with 105 cells per mouse transduced with lentiviral shRNA for 7 days or untreated tumor cells and then sacrificed at day 26 (CX-1 (h–i)) or day 31 (Clone A (j)). Five tumors are shown from each CX-1 group (h) and tumor weights are shown in (i–j). The dotted line is a cut-off of 75 mg with both CX-1 and Clone A transduced tumors weighing less than 75 mg whereas the untreated CX-1 (i) or Clone A (j) were heavier. P value by contingency table analysis with Bonferroni correction.
In addition, stem cells are frequently identified as the “side population” (SP) based on ABCG2-mediated efflux of Hoechst dye (31). We could not measure the SP fraction of MIP-101, Clone A and LS 174T because the inhibitor did not block dye efflux even at high concentrations without toxicity to the cells (data not shown), so we did SP analysis in CX-1 and KM-12c lines. The expression of ES TFs was first analyzed in CX-1, SP and Non-SP by qRT-PCR. Relative expression of the TF transcripts were consistently increased in SP 2 – 3-fold compared to Non-SP and parental CX-1 cells (Supplementary Figure 5b). In order to investigate whether NANOGP8 can affect the size of the SP fraction, we transduced the CX-1 and KM- 12c CRC lines with shNp8-1 to inhibit NANOGP8 or overexpressing NANOG or NANOGP8 and measured the SP fraction. Allele-specific inhibition of NANOGP8 reduced the size of the SP by more than 50% compared to the untreated parental line, while overexpression of NANOGP8 increased the SP fraction by 2 – 4 fold in these two CRC lines (Figures 6f and g; Supplementary Figures 6 and 7).
We then tested whether inhibition of NANOGP8 by shNP8-1 inhibited tumorigenicity in mice. Clone And CX-1 were transduced in vitro for 7 days and then injected into groups of 10 NOD/SCID mice at 105 cells per mouse mice that were sacrificed 26 (CX-1, Figures 6h and i) or 31 (Clone A, Figure 6j) days later, tumors harvested and weighed. CX-1 and Clone A transduced with shNp8-1 were significantly lighter than the other groups (Figures 6i and j) with 30% of CX-1 and 40% of Clone A shNp8-1 treated mice tumor free (Figures h –j). Thus, inhibition of NANOGP8 inhibits tumorigenicity in CRC in both CX-1 and Clone A.
Discussion
Our data support the role of NANOG in modulating stemness in human CRC as measured by single cell spherogenicity, the fraction of the side population and growth in vivo in immunoincompetent mice. Inhibition of NANOG expression within CRC generally decreased these effects while over-expression of NANOG or NANOGP8 had the opposite outcome. These data indicated that NANOG expression can induce a stem-like state in CRC, which is consistent with the NANOG function reported in prostate cancer (14), OCT4 in melanoma cells (32) and SOX2 in breast cancer cells (33). It is interesting that any one of these three ES TFs is enough to induce differentiated cancer cells to a stem-like state. One possible explanation is that NANOG, OCT4 and SOX2 individually and together can initiate and support the reprogramming process by activating their embryonic transcriptional factor networks (34–37).
Expression of OCT4 and SOX2 is associated with clinical outcome in various human malignancies including lung (38), esophageal (39, 40), ovarian (41), cervical (42) and gastric (43) carcinomas. Expression of NANOG has been identified as a component of an embryonic stem cell signature in various human carcinomas (16, 44–46). NANOG interacts with the Hedgehog pathway (16) and epithelial-mesenchymal transition (18, 47, 48) where NANOG may play a role in maintaining pluripotency that is necessary for generating tumor heterogeneity. Thus, NANOG expression may be a critical co-factor for neoplastic progression.
NANOG is expressed in primary colon carcinomas but expression was not associated with stage of disease or survival in one study (17). However, Meng et al. (18) reported an association between NANOG protein expression and clinical outcome in CRC. This difference may be because NANOG is expressed at low levels since a whole transcriptome analysis library contained fewer than 500 reads for NANOG-related transcripts in human CRC lines that generated 10 – 40 million reads (data not shown). Alternatively, NANOG-related mRNAs may also have a regulatory function as suggested by Salmena et al. (49). Interestingly, Ishiguro et al. (19) confirmed that NANOG protein levels in primary colorectal carcinomas were associated with both stage of disease and overall survival.
Our data also confirm and extend those of others (12–16, 20) that the NANOG involved in malignancy is often not the prototypic embryonic gene located on chromosome 12 identified by Chambers et al. (50) but rather NANOGP8, a retrogene located on chromosome 15 identified by Booth and Holland (23). We found that NANOG and NanogP8 are often co-expressed but it is not clear how NANOGP8 expression is regulated, only that NANOGP8 expression may rescue stemness characteristics when NANOG is inhibited. Moreover, inhibition of NANOG gene expression is associated with inhibition of cell proliferation. Since Wee1 is an important regulator of the cell cycle and also inhibition of NANOG decreased Wee1, this may be an important aspect of how inhibition of NANOG may inhibit the malignant phenotype. We also found both NANOG and Pin 1 are located in the perinuclear space in the cytoplasm where they may interact to affect cell proliferation and maintain the stemness of CRC.
In summary, the present study extends previous work in that we show NANOGP8 is translated and may substitute for NANOG to maintain the stem cell characteristics of the human CRC as measured by the in vitro correlates of spherogenicity and the size of the side population. It is not clear why the response of CX-1 cells to overexpression of NANOG is not able to ‘rescue’ spherogenicity or why the relative levels of NANOG transcripts are not as prevalent as in the Clone A line. However, Jeter et al. (14) observed similar variations in response to overexpression of NANOG. Further work is necessary to elucidate the difference in response and control of expression of the NANOGs.
Materials and methods
Reagents
Unless specified, all reagents were obtained from Sigma (Sigma-Aldrich, St. Louis, MO, USA).
RT-PCR, Restriction Endonuclease Digestion and qRT-PCR
Total RNA from CRC cell lines (Clone A, CX-1, KM-12c, MIP-101, LS-174T and HCC-2998) was extracted using RNeasy Mini Kit (Qiagen, Valencia, CA, USA). Total RNA from CRC clinical samples was extracted using RecoverAll Total Nucleic Acid Isolation Kit (Ambion, Austin, TX, USA). Total RNA was treated with RNase-free DNase Set (Qiagen). The reverse transcription (RT) reaction was carried out with 2 μg total RNA in a 20 μl reaction using SuperScript III first strand synthesis system (Invitrogen, Carlsbad, CA, USA). 20 μl PCR products digested with AlwNI according to the manufacturer’s protocol (New England Biolabs, Beverly, MA, USA) were analyzed by electrophoresis on a 3% (w/v) agarose gel. PCR products were sequenced after TA cloning. Real-time quantitative PCR (qRT-PCR) analysis was performed with IQ5 (Bio-rad, Hercules, CA, USA) thermal cycler in a 96 well plate. Expression level of human GAPDH was used as internal control. Relative gene expression levels were calculated with 2 ΔΔCT method.
Cell Culture, Cell Transfection, Lentivirus Packaging and Cell Transduction
The human CRC cells were cultured in RPMI (Invitrogen) media supplemented with 10% FBS (Invitrogen) and 2mM L-glutamine (Invitrogen) at 37°C, 5% CO2 incubator. Stable transductants were created by puromycin selection for shNANOG and pLKO.1 with lentiviral particles from Sigma (shNANOG was TRCN0000004885). The other shRNA lentiviral vectors used the Clone-it enzyme-free lentivector system (System Biosciences, Mountain View, CA, USA) containing the COP-GFP reporter with DNA oligonucleotides from Integrated DNA Technologies (Coralville, IA). Zhang et. (12 2006) provided the fulllength NANOG plasmid DNA and full length NANOGP8 was amplified from Clone A and confirmed by sequencing. Lentiviral particles to express full length NANOG or NANOGP8 were ligated with the Clone-it enzyme free lentivectors with a RFP reporter (System Biosciences). The allele specific shRNAs were shNg-1 to NANOG (target sequence 5′-CUGCAUGCAGUUCCAGCCA-3′), shNp8-1 to NANOGP8 (target sequence 5′-CUGCAUGCACUUCCAGCCA-3′) with the control vector shNeg (target sequence 5′-UAGCGACUAAACACAUCAA-3′ (51). Lentiviral particles were produced by co-transfection of 293T cells with packaging and envelope plasmids using Lipofectamine 2000 (Invitrogen).
Sphere Culture
Cells were plated in ULLA plates (Corning Incorporated, Corning, NY, USA) using serum-free medium (52). For single cell spherogenicity assay, cells were cultured in 96-well ULLA plates at a rate of 0.6 cell/well in serum-free medium and wells containing single cells identified within 24 hours. Spheroids containing more than 50 cells were scored after 9 or more days.
Cell Proliferation Analysis
2×10³ (per well) CRC cells were grown in 96-well plates for 48 hours and 10 μl/well cell proliferation reagent WST1 (Roche Applied Sciences, Indianapolis, IN, USA) was added and then measure the absorbance at 450nm after 4 hours.
Side Population Analysis
Side population was analyzed according to the method of Lin and Goodell (53). Side population was performed on BDLSRII flow cytometer (Becton Dickinson, San Jose, CA, USA) using BD FACSDiva software.
Immunoprecipitation, Mass Spectrometry Analysis and Western blot
Immunoprecipitation was performed using Protein G Sepharose 4 Fast Flow (GE Healthcare, Pittsburgh, PA, USA). For mass spectrometry assay, the gel band was excised from the region on SDS-PAGE corresponding to NANOG molecular weight and to the NANOG signal on western blot. Mass spectrometry analysis was performed as described (54). For Western blot analysis, protein (50 μg) was separated in Nu-PAGE 4-12% Bis-Tris Gel (Invitrogen) and transferred onto a polyvinylidene difluoride (PVDF) in Tris-Glycine Transfer Buffer (Invitrogen). The membrane was blocked with 5% milk and then incubated with antibodies against anti- phosphor-Wee1 (4910, Cell Signaling), anti-Wee1 (4936, Cell Signaling), anti-phosphor-Cdc2 (AF888, R&D Systems, Minneapolis, MN, USA), anti-Cdc2 (9112, Cell Signaling), anti-phosphor-Chk1 (ab47318, Abcam, Cambridge, MA, USA), anti-Chk1 (ab47574, Abcam), anti-phosphor-Cdc25C (ab32051, Abcam), anti-Cdc25C (ab2359, Abcam), anti-Pin1 (3722, Cell Signaling), anti-Nanog (AF1997, R & D Systems and 4893 and 4903, Cell Signalling) and anti- β-Tubulin (T4026, Sigma-Aldrich) and subsequently washed and incubated with a specific secondary antibody (NA931V and NA934V, GE Healthcare). Protein loading was normalized against β-Tubulin.
Immunofluorescence Assay
De-identified formalin-fixed paraffin embedded specimens of liver metastases from colon carcinoma were obtained from the Pathology Service of the Center for Cancer Research under exemption #5426 from the NIH Office of Human Subjects. Sections 5 μ thick were microdissected and RNA extracted for RT-PCR and analyzed for the presence of NANOGP8 transcripts as described above. In addition, companion 5 μ sections were analyzed for the expression of NANOG (AF1997, R &D Systems) and CD44v6 (BBA13, R&D Systems) by immunofluorescence assay at 1:100 dilutions with DAPI nuclear counter stains. Positive controls included similar sections of formalin-fixed paraffin-embedded human seminoma. Staining was performed as described (55).
In Vivo Tumorigenic, Metastatic Potential Assays
Animal experiments were preformed under the protocol LEC-011 approved by the NCI Animal Care and Use Committee. Parental cells, cells with pLKO.1 and cells with shRNA to NANOG or NANOGP8 (shNANOG, shNg-1, shNp8-1) were injected subcutaneously into NOD/SCID mice. The potential of cell lines to form experimental metastases in the liver was examined in NOD/SCID mice by inoculation of tumor cells into the spleen during open laparotomy under flurane anesthesia. Autopsies were performed and the presence of liver metastases was determined by macroscopic inspection and confirmed by histological analysis.
Statistical Analysis
ANOVA or contingency table analysis with Bonferroni correction was performed for statistical analysis of multiple comparisons. Data in graphs are presented as mean ± S.D. except where indicated in the text. For the analyses, P<0.05 was considered to be statistically significant.
Supplementary Material
Acknowledgments
The authors acknowledge the valuable advice and support of Drs. Elizabeth Conner and Valentina Factor. Also the authors gratefully acknowledge the support provided by the Center for Cancer Research of the NCI for Project ZIA BC 011199 and by the Department of Defense for Grant Number W81XWH-11-1-0327. The opinions expressed in this manuscript are those of the authors and do not necessarily represent those of the National Cancer Institute, the National Institutes of Health, the Department of Health and Human Services or the Department of the Army.
Footnotes
Conflict of interest
The authors declare no conflict of interest.
Supplementary Information accompanies the paper on the Oncogene website (http://www.nature.com/onc)
References
- 1.Takahashi K, Yamanaka S. Induction of pluripotent stem cells from mouse embryonic and adult fibroblast cultures by defined factors. Cell. 2006;126:663–676. doi: 10.1016/j.cell.2006.07.024. [DOI] [PubMed] [Google Scholar]
- 2.Takahashi K, Tanabe K, Ohnuki M, Narita M, Ichisaka T, Tomoda K, et al. Induction of pluripotent stem cells from adult human fibroblasts by defined factors. Cell. 2007;131:861–872. doi: 10.1016/j.cell.2007.11.019. [DOI] [PubMed] [Google Scholar]
- 3.Yu J, Hu K, Smuga-Otto K, Tian S, Stewart R, Slukvin II, et al. Human induced pluripotent stem cells free of vector and transgene sequences. Science. 2009;324:797–801. doi: 10.1126/science.1172482. [DOI] [PMC free article] [PubMed] [Google Scholar]
- 4.Park IH, Arora N, Huo H, Maherali N, Ahfeldt T, Shimamura A, et al. Disease-specific induced pluripotent stem cells. Cell. 2008;134:877–886. doi: 10.1016/j.cell.2008.07.041. [DOI] [PMC free article] [PubMed] [Google Scholar]
- 5.Miyoshi N, Ishii H, Nagai K, Hoshino H, Mimori K, Tanaka F, et al. Defined factors induce reprogramming of gastrointestinal cancer cells. Proc Natl Acad Sci U S A. 2010;107:40–45. doi: 10.1073/pnas.0912407107. [DOI] [PMC free article] [PubMed] [Google Scholar]
- 6.Silva J, Nichols J, Theunissen TW, Guo G, van Oosten AL, Barrandon O, et al. NANOG is the gateway to the pluripotent ground state. Cell. 2009;138:722–737. doi: 10.1016/j.cell.2009.07.039. [DOI] [PMC free article] [PubMed] [Google Scholar]
- 7.Mitsui K, Tokuzawa Y, Itoh H, Segawa K, Murakami M, Takahashi K, et al. The homeoprotein NANOG is required for maintenance of pluripotency in mouse epiblast and ES cells. Cell. 2003;113:631–642. doi: 10.1016/s0092-8674(03)00393-3. [DOI] [PubMed] [Google Scholar]
- 8.Chambers I, Silva J, Colby D, Nichols J, Nijmeijer B, Robertson M, et al. NANOG safeguards pluripotency and mediates germline development. Nature. 2007;450:1230–1234. doi: 10.1038/nature06403. [DOI] [PubMed] [Google Scholar]
- 9.Lengner CJ, Camargo FD, Hochedlinger K, Welstead GG, Zaidi S, Gokhale S, et al. Oct4 expression is not required for mouse somatic stem cell self-renewal. Cell Stem Cell. 2007;1:403–415. doi: 10.1016/j.stem.2007.07.020. [DOI] [PMC free article] [PubMed] [Google Scholar]
- 10.Utikal J, Maherali N, Kulalert W, Hochedlinger K. Sox2 is dispensable for the reprogramming of melanocytes and melanoma cells into induced pluripotent stem cells. J Cell Sci. 2009;122:3502–3510. doi: 10.1242/jcs.054783. [DOI] [PMC free article] [PubMed] [Google Scholar]
- 11.Miyanari Y, Torres-Padilla ME. Control of ground-state pluripotency by allelic regulation of NANOG. Nature. 2012;483:470–473. doi: 10.1038/nature10807. [DOI] [PubMed] [Google Scholar]
- 12.Zhang J, Wang X, Li M, Han J, Chen B, Wang B, et al. NANOGP8 is a retrogene expressed in cancers. FEBS J. 2006;273:1723–1730. doi: 10.1111/j.1742-4658.2006.05186.x. [DOI] [PubMed] [Google Scholar]
- 13.Jeter CR, Badeaux M, Choy G, Chandra D, Patrawala L, Liu C, et al. Functional evidence that the self-renewal gene NANOG regulates human tumor development. Stem Cells. 2009;27:993–1005. doi: 10.1002/stem.29. [DOI] [PMC free article] [PubMed] [Google Scholar]
- 14.Jeter CR, Liu B, Liu X, Chen X, Liu C, Calhoun-Davis T, et al. NANOG promotes cancer stem cell characteristics and prostate cancer resistance to androgen deprivation. Oncogene. 2011;30:3833–3845. doi: 10.1038/onc.2011.114. [DOI] [PMC free article] [PubMed] [Google Scholar]
- 15.Po A, Ferretti E, Miele E, Smaele ED, Paganelli A, Canettieri G, et al. Hedgehog controls neural stem cells through p53-independent regulation of NANOG. EMBO J. 2010;29:2646–2658. doi: 10.1038/emboj.2010.131. [DOI] [PMC free article] [PubMed] [Google Scholar]
- 16.Zbinden M, Duquet A, Lorente-Trigos A, Ngwabyt SN, Borges I, Ruiz i Altaba A. NANOG regulates glioma stem cells and is essential in vivo acting in a cross-functional network with GLI1 and p53. EMBO J. 2010;29:2659–2674. doi: 10.1038/emboj.2010.137. [DOI] [PMC free article] [PubMed] [Google Scholar]
- 17.Saiki Y, Ishimaru S, Mimori K, Takatsuno Y, Nagahara M, Ishii H, et al. Comprehensive analysis of the clinical significance of inducing pluripotent stemness-related gene expression in colorectal cancer cells. Ann Surg Oncol. 2009;16:2638–2644. doi: 10.1245/s10434-009-0567-5. [DOI] [PubMed] [Google Scholar]
- 18.Meng HM, Zheng P, Wang XY, Liu C, Sui HM, Wu SJ, et al. Overexpression of NANOG predicts tumor progression and poor prognosis in colorectal cancer. Cancer Biol Ther. 2010;9:295–302. doi: 10.4161/cbt.9.4.10666. [DOI] [PubMed] [Google Scholar]
- 19.Ishiguro T, Sato A, Ohata H, Sakai H, Nakagama H, Okamoto K. Differential expression of NANOG1 and NANOGp8 in colon cancer cells. Biochem Biophys Res Commun. 2012;418:199–204. doi: 10.1016/j.bbrc.2011.10.123. [DOI] [PubMed] [Google Scholar]
- 20.Xu F, Dai C, Zhang R, Zhao Y, Peng S, Jia C. NANOG: A Potential Biomarker for Liver Metastasis of Colorectal Cancer. Dig Dis Sci. 2012 May 6; doi: 10.1007/s10620-012-2182-8. [Epub ahead of print] [DOI] [PubMed] [Google Scholar]
- 21.Eberle I, Pless B, Braun M, Dingermann T, Marschalek R. Transcriptional properties of human NANOG1 and NANOG2 in acute leukemic cells. Nucleic Acids Res. 2010;38:5384–5395. doi: 10.1093/nar/gkq307. [DOI] [PMC free article] [PubMed] [Google Scholar]
- 22.Mulder JW, Kruyt PM, Sewnath M, Oosting J, Seldenrijk CA, Weidema WF, et al. Colorectal cancer prognosis and expression of exon-v6-containing CD44 proteins. Lancet. 1994;344:1470–1472. doi: 10.1016/s0140-6736(94)90290-9. [DOI] [PubMed] [Google Scholar]
- 23.Booth HA, Holland PW. Eleven daughters of NANOG. Genomics. 2004;84:229–238. doi: 10.1016/j.ygeno.2004.02.014. [DOI] [PubMed] [Google Scholar]
- 24.Ambady S, Malcuit C, Kashpur O, Kole D, Holmes WF, Hedblom E, et al. Expression of NANOG and NANOGP8 in a variety of undifferentiated and differentiated human cells. Int J Dev Biol. 2010;54:1743–1754. doi: 10.1387/ijdb.103192sa. [DOI] [PMC free article] [PubMed] [Google Scholar]
- 25.Zhang J, Jessup JM, Thorgeirsson SS. NANOG family members are essential for spherogenicity and metastasis in colorectal carcinoma. Proceedings of the 102nd Annual Meeting of the American Association for Cancer Research; 2011 Apr 2–6; Orlando, Florida. Philadelphia (PA). AACR; 2011. p. Abstract 5206. [Google Scholar]
- 26.Jessup JM, Giavazzi R, Campbell D, Cleary KR, Morikawa K, Hostetter R, et al. Metastatic potential of human colorectal carcinomas implanted into nude mice: prediction of clinical outcome in patients operated upon for cure. Cancer Res. 1989;49:6906–6910. [PubMed] [Google Scholar]
- 27.Lu KP, Hanes SD, Hunter T. A human peptidyl-prolyl isomerase essential for regulation of mitosis. Nature. 1996;380:544–547. doi: 10.1038/380544a0. [DOI] [PubMed] [Google Scholar]
- 28.Nishi M, Akutsu H, Masui S, Kondo A, Nagashima Y, Kimura H, et al. A distinct role for Pin1 in the induction and maintenance of pluripotency. J Biol Chem. 2011;286:11593–11603. doi: 10.1074/jbc.M110.187989. [DOI] [PMC free article] [PubMed] [Google Scholar]
- 29.Huang H, Qiao R, Zhao D, Zhang T, Li Y, Yi F, et al. Profiling of mismatch discrimination in RNAi enabled rational design of allele-specific siRNAs. Nucleic Acids Res. 2009;37:7560–7569. doi: 10.1093/nar/gkp835. [DOI] [PMC free article] [PubMed] [Google Scholar]
- 30.Dykxhoorn DM, Schlehuber LD, London IM, Lieberman J. Determinants of specific RNA interference-mediated silencing of human beta-globin alleles differing by a single nucleotide polymorphism. Proc Natl Acad Sci U S A. 2006;103:5953–5958. doi: 10.1073/pnas.0601309103. [DOI] [PMC free article] [PubMed] [Google Scholar]
- 31.Goodell MA, Brose K, Paradis G, Conner AS, Mulligan RC. Isolation and functional properties of murine hematopoietic stem cells that are replicating in vivo. J Exp Med. 1996;183:1797–1806. doi: 10.1084/jem.183.4.1797. [DOI] [PMC free article] [PubMed] [Google Scholar]
- 32.Kumar SM, Liu S, Lu H, Zhang H, Zhang PJ, Gimotty PA, et al. Acquired cancer stem cell phenotypes through Oct4-mediated dedifferentiation. Oncogene. 2012 doi: 10.1038/onc.2011.656.. advance online publication 30 January 2012. [DOI] [PMC free article] [PubMed] [Google Scholar]
- 33.Leis O, Eguiara A, Lopez-Arribillaga E, Alberdi MJ, Hernandez-Garcia S, Elorriaga K, et al. Sox2 expression in breast tumours and activation in breast cancer stem cells. Oncogene. 2012;31:1354–1365. doi: 10.1038/onc.2011.338. [DOI] [PubMed] [Google Scholar]
- 34.Boyer LA, Lee TI, Cole MF, Johnstone SE, Levine SS, Zucker JP, et al. Core transcriptional regulatory circuitry in human embryonic stem cells. Cell. 2005;122:947–956. doi: 10.1016/j.cell.2005.08.020. [DOI] [PMC free article] [PubMed] [Google Scholar]
- 35.Chen X, Xu H, Yuan P, Fang F, Huss M, Vega VB, et al. Integration of external signaling pathways with the core transcriptional network in embryonic stem cells. Cell. 2008;133:1106–1117. doi: 10.1016/j.cell.2008.04.043. [DOI] [PubMed] [Google Scholar]
- 36.Kim J, Chu J, Shen X, Wang J, Orkin SH. An extended transcriptional network for pluripotency of embryonic stem cells. Cell. 2008;132:1049–1061. doi: 10.1016/j.cell.2008.02.039. [DOI] [PMC free article] [PubMed] [Google Scholar]
- 37.Ding J, Xu H, Faiola F, Ma’ayan A, Wang J. Oct4 links multiple epigenetic pathways to the pluripotency network. Cell Res. 2012;22:155–167. doi: 10.1038/cr.2011.179. [DOI] [PMC free article] [PubMed] [Google Scholar]
- 38.Sholl LM, Barletta JA, Yeap BY, Chirieac LR, Hornick JL. Sox2 protein expression is an independent poor prognostic indicator in stage I lung adenocarcinoma. Am J Surg Pathol. 2010;34:1193–1198. doi: 10.1097/PAS.0b013e3181e5e024. [DOI] [PMC free article] [PubMed] [Google Scholar]
- 39.Bass AJ, Watanabe H, Mermel CH, Yu S, Perner S, Verhaak RG, et al. SOX2 is an amplified lineage-survival oncogene in lung and esophageal squamous cell carcinomas. Nat Genet. 2009;41:1238–1242. doi: 10.1038/ng.465. [DOI] [PMC free article] [PubMed] [Google Scholar]
- 40.Wang Q, He W, Lu C, Wang Z, Wang J, Giercksky KE, et al. Oct3/4 and Sox2 are significantly associated with an unfavorable clinical outcome in human esophageal squamous cell carcinoma. Anticancer Res. 2009;29:1233–1241. [PubMed] [Google Scholar]
- 41.Zhang J, Li YL, Zhou CY, Hu YT, Chen HZ. Expression of octamer-4 in serous and mucinous ovarian carcinoma. J Clin Pathol. 2010;63:879–883. doi: 10.1136/jcp.2009.073593. [DOI] [PubMed] [Google Scholar]
- 42.Ji J, Zheng PS. Expression of Sox2 in human cervical carcinogenesis. Hum Pathol. 2010;41:1438–1447. doi: 10.1016/j.humpath.2009.11.021. [DOI] [PubMed] [Google Scholar]
- 43.Zhang X, Yu H, Yang Y, Zhu R, Bai J, Peng Z, et al. SOX2 in gastric carcinoma, but not Hath1, is related to patients’ clinicopathological features and prognosis. J Gastrointest Surg. 2010;14:1220–1226. doi: 10.1007/s11605-010-1246-3. [DOI] [PubMed] [Google Scholar]
- 44.You JS, Kang JK, Seo DW, Park JH, Park JW, Lee JC, et al. Depletion of embryonic stem cell signature by histone deacetylase inhibitor in NCCIT cells: involvement of NANOG suppression. Cancer Res. 2009;69:5716–5725. doi: 10.1158/0008-5472.CAN-08-4953. [DOI] [PubMed] [Google Scholar]
- 45.Ben-Porath I, Thomson MW, Carey VJ, Ge R, Bell GW, Regev A, et al. An embryonic stem cell-like gene expression signature in poorly differentiated aggressive human tumors. Nat Genet. 2008;40:499–507. doi: 10.1038/ng.127. [DOI] [PMC free article] [PubMed] [Google Scholar]
- 46.Santagata S, Ligon KL, Hornick JL. Embryonic stem cell transcription factor signatures in the diagnosis of primary and metastatic germ cell tumors. Am J Surg Pathol. 2007;31:836–845. doi: 10.1097/PAS.0b013e31802e708a. [DOI] [PubMed] [Google Scholar]
- 47.Katoh M. Network of WNT and other regulatory signaling cascades in pluripotent stem cells and cancer stem cells. Curr Pharm Biotechnol. 2011;12:160–170. doi: 10.2174/138920111794295710. [DOI] [PubMed] [Google Scholar]
- 48.Kong D, Banerjee S, Ahmad A, Li Y, Wang Z, Sethi S, et al. Epithelial to mesenchymal transition is mechanistically linked with stem cell signatures in prostate cancer cells. PLoS One. 2010;5:e12445. doi: 10.1371/journal.pone.0012445. [DOI] [PMC free article] [PubMed] [Google Scholar]
- 49.Salmena L, Poliseno L, Tay Y, Kats L, Pandolfi PP. A ceRNA hypothesis: the Rosetta Stone of a hidden RNA language? Cell. 2011;146:353–358. doi: 10.1016/j.cell.2011.07.014. [DOI] [PMC free article] [PubMed] [Google Scholar]
- 50.Chambers I, Colby D, Robertson M, Nichols J, Lee S, Tweedie S, et al. Functional expression cloning of NANOG, a pluripotency sustaining factor in embryonic stem cells. Cell. 2003;113:643–655. doi: 10.1016/s0092-8674(03)00392-1. [DOI] [PubMed] [Google Scholar]
- 51.Huang H, Regan KM, Lou Z, Chen J, Tindall DJ. CDK2-dependent phosphorylation of FOXO1 as an apoptotic response to DNA damage. Science. 2006;13;314:294–7. doi: 10.1126/science.1130512. [DOI] [PubMed] [Google Scholar]
- 52.Zappone MV, Galli R, Catena R, Meani N, De Biasi S, Mattei E, et al. Sox2 regulatory sequences direct expression of a (beta)-geo transgene to telencephalic neural stem cells and precursors of the mouse embryo, revealing regionalization of gene expression in CNS stem cells. Development. 2000;127:2367–2382. doi: 10.1242/dev.127.11.2367. [DOI] [PubMed] [Google Scholar]
- 53.Lin KK, Goodell MA. Purification of hematopoietic stem cells using the side population. Methods Enzymol. 2006;420:255–264. doi: 10.1016/S0076-6879(06)20011-9. [DOI] [PubMed] [Google Scholar]
- 54.Simkus C, Bhattacharyya A, Zhou M, Veenstra TD, Jones JM. Correlation between recombinase activating gene 1 ubiquitin ligase activity and V(D)J recombination. Immunology. 2009;128:206–217. doi: 10.1111/j.1365-2567.2009.03101.x. [DOI] [PMC free article] [PubMed] [Google Scholar]
- 55.Kinders RJ, Hollingshead M, Lawrence S, Ji J, Tabb B, Bonner WM, et al. Development of a validated immunofluorescence assay for γH2AX as a pharmacodynamic marker of topoisomerase I inhibitor activity. Clin Cancer Res. 2010;16:5447–5457. doi: 10.1158/1078-0432.CCR-09-3076. [DOI] [PMC free article] [PubMed] [Google Scholar]
Associated Data
This section collects any data citations, data availability statements, or supplementary materials included in this article.