

Abstract
Background
Genomic regions controlling abdominal fatness (AF) were studied in the Northeast Agricultural University broiler line divergently selected for AF. In this study, the chicken 60KSNP chip and extended haplotype homozygosity (EHH) test were used to detect genome-wide signatures of AF.
Results
A total of 5357 and 5593 core regions were detected in the lean and fat lines, and 51 and 57 reached a significant level (P<0.01), respectively. A number of genes in the significant core regions, including RB1, BBS7, MAOA, MAOB, EHBP1, LRP2BP, LRP1B, MYO7A, MYO9A and PRPSAP1, were detected. These genes may be important for AF deposition in chickens.
Conclusions
We provide a genome-wide map of selection signatures in the chicken genome, and make a contribution to the better understanding the mechanisms of selection for AF content in chickens. The selection for low AF in commercial breeding using this information will accelerate the breeding progress.
Keywords: Abdominal fat, Selection signature, Extended haplotype homozygosity (EHH)
Background
The linkage disequilibrium (LD) is important in livestock genetics for its key role in genomic selection [1] and detecting the causal mutations of economically important traits [2-6]. Based on the LD information, there are two main methods to detect genes underlying phenotypic variation, including one from phenotype to genome and another one from genome to phenotype. The first method is performed by targeting particular candidate genes or by quantitative trait loci (QTL) mapping and positional cloning of QTL. In the second method, patterns of LD in populations that are incompatible with the hypothesis of genetic neutrality are identified, and these patterns are selection signatures [7]. The aim of the second method is to identify artificial selections by statistically evaluating the genomic data [7].
Allele frequencies underlying selection are expected to change. A neutral mutation will take many generations until the mutated allele reaches a high or low population frequency. In this case, the LD between the mutation and its neighboring loci will be degraded because of the recombination in every generation [8]. The frequency of a novel mutation will increase or decrease more rapidly than the neutral mutation because it is underlying artificial selection, so that the surrounding conserved haplotype was long [9,10]. This is the background of the extended haplotype homozygosity (EHH) statistic method used to detect selection signatures [11]. There are also many other methods to detect selective sweeps from DNA sequence data, including the Tajima’s D[12] and Fay and Wu’s H-test [13] for selected mutations, measuring large allele-frequency differences among populations by FST[14], and the integrated Haplotype Score (iHS) [15], which is an extension of the EHH statistic [11]. Among these methods, the EHH test is particularly useful [7,11]. The EHH test is used to detect artificial selections according to the characteristics of haplotypes within a single population, and do not require the genotype of the ancestor [7]. Furthermore, the EHH test is less sensitive to ascertainment bias than other approaches, so it was designed to work with SNP rather than sequencing data [7,16].
The broilers used in this study were selected for eleven generations and genomic regions controlling AF deposition are expected to exhibit signatures of selective sweep. The aim of this study was to identify the selection signatures underlying the artificial selection for AF in chicken and to investigate the genes important for AF deposition.
Methods
Ethics statement
All animal work was conducted according to the guidelines for the care and use of experimental animals established by the Ministry of Science and Technology of the People’s Republic of China (Approval number: 2006–398) and approved by the Laboratory Animal Management Committee of Northeast Agricultural University.
DNA samples and data preparation
Broilers used in this study were from two Northeast Agricultural University broiler lines divergently selected for AF content (NEAUHLF). The two lines have been selected since 1996 using AF percentage (%AFW or AFP) and plasma very low-density lipoprotein (VLDL) concentration as selection criteria [17]. The two lines were selected for 11 generations and the AFP changes over the 11 generations are shown in Figure 1. A total of 475 individuals from generation 11 of NEAUHLF were used in this study.
Figure 1.
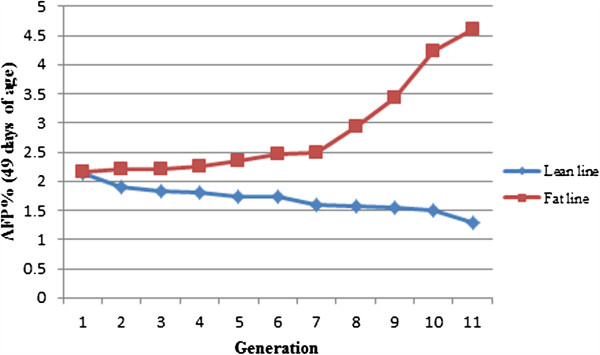
The separation of AFP over 11 generations between lean and fat lines.
Genotyping was carried out using the Illumina chicken 60K SNP chip containing a total of 57636 SNPs. Markers were filtered to exclude loci with unknown positions, monomorphic loci and loci with a minor allele frequency <0.05.
The haplotype and LD analysis
The fastPHASE [18] (http://depts.washington.edu/fphase/download/) was used to reconstruct the haplotypes for every chromosome using the default parameters. The reconstructed haplotypes were inserted into HAPLOVIEW v4.1 [19] to estimate LD statistics based on pairwise r2 and to construct the blocking pattern in the candidate regions of interest to enable selection signature analysis.
The EHH test
The “core region” was defined as the region in the genome characterized by the strong LD among SNPs involving a set of “core haplotypes” [7]. The Sweep v.1.1 (http://www.soft82.com/get/download/windows/sweep/) was used to identify the core regions [11]. The algorithm defined a pair of SNPs to be in strong LD if the upper 95% confidence bound of D’ is between 0.70 and 0.98 [20]. The program was set to select core regions with at least two SNPs. EHH was defined as the probability that two randomly chosen haplotypes carrying the candidate core haplotype were homozygous for the entire interval spanning the core region to a given locus [11]. The EHH test [11] was based on one of the core haplotype vs. other haplotypes in the same position. The “Relative Extended Haplotype Homozygosity” (REHH) statistic corrects EHH for the variability in recombination rates [7]. It was computed by EHHt / ; with defined as the decay of EHH on all other core haplotypes combined. The REHH value was used in the current study to determine the selection signatures. To determine the significance of REHH values, the haplotypes were ordered into 20 bins according to their frequencies [7]. The REHH values of each haplotype in a candidate region were compared with all equally frequent haplotypes and the P-values were obtained [11]. The significant selection signatures were defined as P<0.01.
Results
Markers and core haplotypes
A total of 43034 SNPs on 28 autosomes in chickens were included in the selection signature analysis (Table 1). These markers covered 950.68 Mb of the genome, with an average of 22.09 kb between adjacent markers.
Table 1.
Summary of genome-wide marker and core region (CR) distribution in the lean and fat lines
| Chr | SNP (n)1 | Chr length (Mbp) | Mean distance (kb) |
No. CR (n) |
Mean CR length (kb) |
Coverage CR length2 (kb) |
Max CR length (kb) |
CR length/Chr length3 |
CR SNPs4 (n) |
Max CR SNPs (n) |
CR SNPs/SNP5 |
||||||||
|---|---|---|---|---|---|---|---|---|---|---|---|---|---|---|---|---|---|---|---|
| Lean line | Fat line | Lean line | Fat line | Lean line | Fat line | Lean line | Fat line | Lean line | Fat line | Lean line | Fat line | Lean line | Fat line | Lean line | Fat line | ||||
| 1 |
7135 |
200.95 |
28.16 |
881 |
920 |
125.59 |
114.92 |
110644.43 |
105728.03 |
2288.64 |
2191.34 |
0.55 |
0.53 |
3906 |
3716 |
19 |
19 |
0.55 |
0.52 |
| 2 |
5290 |
154.46 |
29.20 |
639 |
695 |
149.62 |
108.91 |
95606.56 |
75690.16 |
2048.43 |
2042.96 |
0.62 |
0.49 |
3260 |
2628 |
19 |
19 |
0.62 |
0.50 |
| 3 |
4081 |
113.65 |
27.85 |
517 |
533 |
121.58 |
108.97 |
62855.68 |
58081.43 |
863.98 |
735.27 |
0.55 |
0.51 |
2301 |
2107 |
19 |
19 |
0.56 |
0.52 |
| 4 |
3313 |
94.16 |
28.42 |
411 |
428 |
137.96 |
108.07 |
56701.29 |
46255.07 |
2087.33 |
611.37 |
0.60 |
0.49 |
1992 |
1676 |
19 |
19 |
0.60 |
0.51 |
| 5 |
2170 |
62.23 |
28.68 |
260 |
266 |
138.85 |
105.39 |
36101.29 |
28034.75 |
823.62 |
816.35 |
0.58 |
0.45 |
1282 |
1032 |
19 |
19 |
0.59 |
0.48 |
| 6 |
1714 |
35.84 |
20.91 |
217 |
225 |
94.92 |
72.79 |
20598.01 |
16377.61 |
535.90 |
523.04 |
0.57 |
0.46 |
983 |
826 |
19 |
19 |
0.57 |
0.48 |
| 7 |
1769 |
38.17 |
21.58 |
197 |
232 |
111.15 |
86.03 |
21897.27 |
19958.16 |
621.29 |
2163.72 |
0.57 |
0.52 |
1048 |
899 |
19 |
19 |
0.59 |
0.51 |
| 8 |
1394 |
30.62 |
21.97 |
159 |
175 |
111.56 |
96.82 |
17738.07 |
16944.10 |
1914.74 |
1949.21 |
0.58 |
0.55 |
791 |
763 |
19 |
19 |
0.57 |
0.55 |
| 9 |
1168 |
24.02 |
20.57 |
159 |
153 |
78.35 |
75.92 |
12457.00 |
11615.65 |
413.33 |
403.29 |
0.52 |
0.48 |
613 |
557 |
19 |
17 |
0.52 |
0.48 |
| 10 |
1297 |
22.42 |
17.29 |
172 |
176 |
70.99 |
63.35 |
12210.13 |
11148.99 |
387.48 |
347.35 |
0.54 |
0.50 |
735 |
699 |
19 |
19 |
0.57 |
0.54 |
| 11 |
1196 |
21.87 |
18.29 |
128 |
156 |
124.72 |
83.15 |
15964.06 |
12971.74 |
886.96 |
1093.97 |
0.73 |
0.59 |
871 |
706 |
19 |
19 |
0.73 |
0.59 |
| 12 |
1324 |
20.45 |
15.44 |
169 |
184 |
71.34 |
51.16 |
12057.10 |
9412.86 |
352.96 |
369.92 |
0.59 |
0.46 |
809 |
633 |
19 |
19 |
0.61 |
0.48 |
| 13 |
1128 |
18.32 |
16.24 |
144 |
141 |
75.86 |
75.09 |
10924.53 |
10584.67 |
373.56 |
373.56 |
0.60 |
0.58 |
695 |
656 |
19 |
19 |
0.62 |
0.58 |
| 14 |
984 |
15.76 |
16.02 |
127 |
123 |
75.17 |
68.77 |
9546.48 |
8459.25 |
402.70 |
402.70 |
0.61 |
0.54 |
598 |
544 |
19 |
19 |
0.61 |
0.55 |
| 15 |
1010 |
12.93 |
12.80 |
123 |
133 |
58.20 |
50.28 |
7158.60 |
6687.12 |
407.05 |
407.05 |
0.55 |
0.52 |
567 |
541 |
19 |
19 |
0.56 |
0.54 |
| 16 |
12 |
0.17 |
13.87 |
3 |
1 |
41.85 |
67.25 |
125.54 |
67.25 |
64.36 |
67.25 |
0.74 |
0.40 |
9 |
3 |
4 |
3 |
0.75 |
0.25 |
| 17 |
844 |
10.61 |
12.57 |
112 |
108 |
59.07 |
43.89 |
6616.05 |
4740.59 |
242.32 |
236.98 |
0.62 |
0.45 |
523 |
394 |
19 |
19 |
0.62 |
0.47 |
| 18 |
845 |
10.89 |
12.88 |
112 |
121 |
48.74 |
45.96 |
5459.42 |
5561.31 |
317.30 |
317.30 |
0.50 |
0.51 |
431 |
431 |
12 |
19 |
0.51 |
0.51 |
| 19 |
804 |
9.89 |
12.31 |
117 |
110 |
36.01 |
48.41 |
4212.67 |
5325.00 |
406.27 |
371.08 |
0.43 |
0.54 |
353 |
421 |
14 |
19 |
0.44 |
0.52 |
| 20 |
1460 |
13.92 |
9.53 |
184 |
181 |
45.89 |
46.33 |
8442.96 |
8386.18 |
273.60 |
270.67 |
0.61 |
0.60 |
904 |
888 |
19 |
19 |
0.62 |
0.61 |
| 21 |
726 |
6.88 |
9.47 |
81 |
90 |
47.74 |
35.17 |
3867.13 |
3165.72 |
211.67 |
196.05 |
0.56 |
0.46 |
432 |
354 |
19 |
18 |
0.60 |
0.49 |
| 22 |
295 |
3.89 |
13.19 |
36 |
30 |
71.16 |
79.29 |
2561.59 |
2378.83 |
267.88 |
289.01 |
0.66 |
0.61 |
193 |
182 |
19 |
19 |
0.65 |
0.62 |
| 23 |
577 |
6.02 |
10.44 |
81 |
80 |
37.13 |
31.74 |
3007.73 |
2539.51 |
239.20 |
239.20 |
0.50 |
0.42 |
307 |
272 |
19 |
19 |
0.53 |
0.47 |
| 24 |
676 |
6.23 |
9.22 |
87 |
91 |
40.77 |
32.96 |
3546.91 |
2999.26 |
133.00 |
212.48 |
0.57 |
0.48 |
387 |
339 |
13 |
19 |
0.57 |
0.50 |
| 25 |
170 |
2.02 |
11.86 |
23 |
18 |
34.97 |
32.38 |
804.26 |
582.82 |
82.74 |
72.39 |
0.40 |
0.29 |
99 |
68 |
12 |
10 |
0.58 |
0.40 |
| 26 |
617 |
5.03 |
8.16 |
81 |
85 |
34.55 |
59.60 |
2798.60 |
2515.94 |
246.20 |
278.91 |
0.56 |
0.50 |
345 |
312 |
19 |
19 |
0.56 |
0.51 |
| 27 |
472 |
4.84 |
10.25 |
60 |
59 |
46.66 |
40.46 |
2799.62 |
2387.38 |
384.65 |
482.24 |
0.58 |
0.49 |
299 |
215 |
19 |
19 |
0.63 |
0.46 |
| 28 |
563 |
4.46 |
7.92 |
77 |
79 |
36.64 |
27.66 |
2820.93 |
2185.41 |
520.13 |
172.85 |
0.63 |
0.49 |
336 |
318 |
19 |
19 |
0.60 |
0.56 |
| Total | 43034 | 950.68 | 22.09 | 5357 | 5593 | 102.58 | 85.96 | 549523.91 | 480784.79 | 2288.64 | 2191.34 | 0.58 | 0.51 | 25069 | 22180 | 19 | 19 | 0.58 | 0.52 |
1The number of SNPs.
2Total length covered by core regions.
3The proportion of total core region lengths on chromosome length.
4Number of SNPs in core regions.
5The proportion of total number of SNPs in core regions on number of SNPs used.
For the SNPs analyzed in this study, the average minor allele frequency was 0.29 ± 0.13. A summary of genome-wide markers and core haplotype distribution in the data set is shown in Table 1. A total of 5357 and 5593 core regions spanning 549523.91 kb and 480784.79 kb of the genome, respectively, in the lean and fat lines were detected (Table 1). Mean core region length was estimated as 102.58±37.24 kb and 85.96±26.65 kb, with a maximum of 2288.64 kb and 2191.34 kb in the lean and fat lines, respectively (Table 1). Chromosome 1 was the largest chromosome in chickens, and it had the largest haplotypic structures in the genome, which covered 110644.43 kb and 105728.03 kb in the lean and fat lines, respectively. For each chromosome, the proportion of length covered by core regions vs. total length, as well as the number of SNPs forming core regions vs. the total number of SNPs, are shown in Table 1. The distribution of the size of core regions is shown in Figure 2. Overall, 25069 and 22180 SNPs in the lean and fat lines, respectively, participated in forming core regions, with a range of 2 to 19 SNPs per core.
Figure 2.
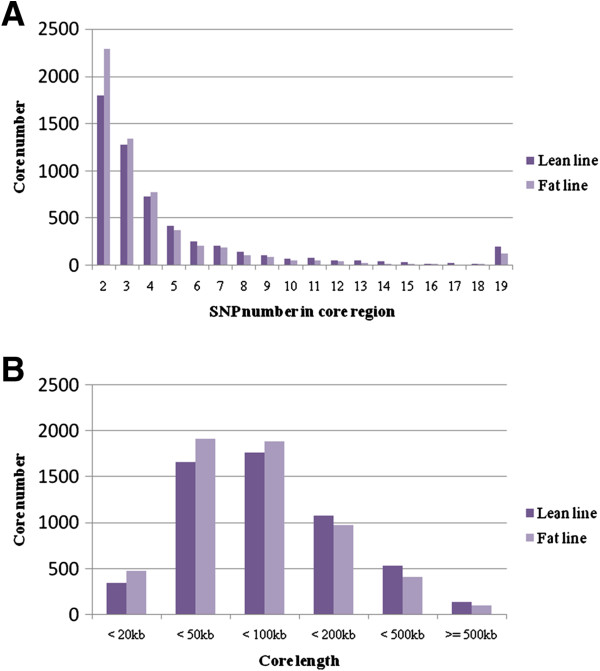
Distribution of SNP numbers in the core regions (A) and the length of core regions (B) in lean and fat lines.
Whole genome selection signatures
For all 5357 and 5593 core regions in the lean and fat lines, respectively, a total of 44822 and 46775 EHH tests, with an average of 8.37 and 8.36 tests per core region, were calculated. To find outlying core haplotypes, we calculated REHH at 1 Mb distances both on the upstream and downstream sides. Figure 3 shows the distribution of REHH values vs. haplotype frequencies in the lean and fat lines, respectively. Corresponding P-values are indicated by different colored symbols. The –log10 of the P-values associated with REHH against the chromosomal position was plotted to visualize the chromosomal distribution of outlying core haplotypes with frequency <25% (Figure 4). The results indicated that these selection signals were not uniformly distributed across all chromosomes, with a substantial overrepresentation on chromosomes 1, 2, 3 and 4.
Figure 3.
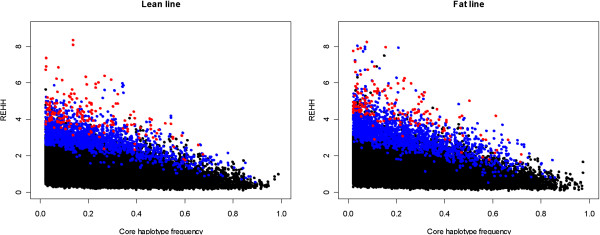
Distribution of REHH vs. core haplotype frequencies in the lean and fat lines. Core haplotypes with P-values lower than 0.05 and 0.01 are presented in blue and red, respectively.
Figure 4.

Genome-wide map of P-values for core haplotypes with frequency >0.25 in lean and fat lines, respectively. Dashed lines display the threshold level of 0.01.
The genome-wide statistics of the selection signature test, including the number of tests and outlying core haplotypes for each chromosome, are presented in Table 2. Of 16677 and 18346 tests on core haplotypes with frequency ≥0.25, there were 51 and 57 tests with P<0.01 in the lean and fat lines, respectively. There were 153 and 251 tests with P<0.05 in the lean and fat lines, respectively.
Table 2.
The number of tests on core haplotypes (CH) (both sides) with frequency≥0.25 and P-values of REHH test
| Chr |
Lean line |
Fat line |
||||
|---|---|---|---|---|---|---|
| Test on CH | P-value <0.05 | P-value <0.01 | Test on CH | P-value <0.05 | P-value <0.01 | |
| 1 |
2806 |
113 |
4 |
3063 |
138 |
12 |
| 2 |
2009 |
105 |
8 |
2271 |
104 |
3 |
| 3 |
1654 |
79 |
10 |
1705 |
74 |
8 |
| 4 |
1273 |
58 |
6 |
1371 |
66 |
5 |
| 5 |
844 |
34 |
3 |
883 |
36 |
4 |
| 6 |
699 |
25 |
2 |
757 |
31 |
2 |
| 7 |
638 |
29 |
2 |
770 |
31 |
5 |
| 8 |
464 |
16 |
1 |
574 |
33 |
2 |
| 9 |
516 |
20 |
1 |
564 |
19 |
1 |
| 10 |
540 |
23 |
2 |
582 |
27 |
1 |
| 11 |
397 |
15 |
1 |
534 |
20 |
2 |
| 12 |
503 |
14 |
0 |
619 |
20 |
1 |
| 13 |
447 |
19 |
3 |
474 |
22 |
1 |
| 14 |
379 |
14 |
0 |
418 |
16 |
1 |
| 15 |
329 |
12 |
1 |
420 |
18 |
2 |
| 17 |
350 |
16 |
0 |
348 |
14 |
2 |
| 18 |
354 |
12 |
2 |
432 |
13 |
2 |
| 19 |
334 |
12 |
1 |
338 |
13 |
0 |
| 20 |
561 |
28 |
3 |
566 |
19 |
0 |
| 21 |
255 |
6 |
0 |
304 |
11 |
0 |
| 22 |
105 |
5 |
1 |
85 |
2 |
0 |
| 23 |
258 |
11 |
0 |
245 |
12 |
1 |
| 24 |
287 |
9 |
0 |
308 |
12 |
2 |
| 25 |
46 |
1 |
0 |
36 |
1 |
0 |
| 26 |
231 |
11 |
0 |
253 |
4 |
0 |
| 27 |
181 |
8 |
0 |
184 |
7 |
0 |
| 28 |
217 |
5 |
0 |
242 |
14 |
0 |
| Total | 16,677 | 700 | 51 | 18,346 | 777 | 57 |
The conformity of the distribution of Tukey’s outliers was examined, with outlying core haplotypes defined at the threshold level of 0.01. Figure 5 displays box plots of the distribution of –log10 (P-values) within each bin of core haplotype frequency. The results indicated that the extreme outliers appear in the small haplotype frequencies bins.
Figure 5.
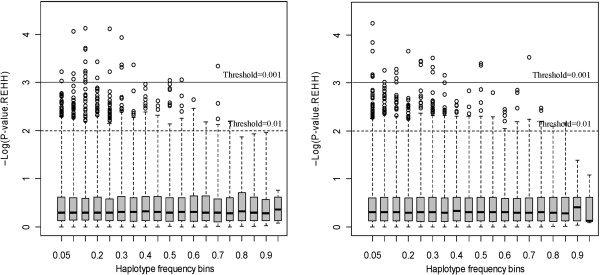
Box plot of the distribution of P-values in core haplotype frequency bins in the lean (left) and fat (right) lines. The dashed and continuous lines indicated the threshold P-values of 0.01 and 0.001, respectively.
Mapping selection signatures to genes
A summary of statistics for 51 and 57 positively selected core regions with P<0.01 of the REHH tests in the lean and fat lines, respectively, is presented in Table 3. Corresponding genes were identified by aligning the core positions with the chicken genome sequence (Table 3). The full genes names were from Ensembl online (http://www.ensembl.org/index.html). A total of 66 and 46 genes in the core regions were detected in the lean and fat lines, respectively, including RB1 (retinoblastoma 1), BBS7 (Bardet-Biedl syndrome 7), MAOA (monoamine oxidase A), MAOB (monoamine oxidase B), EHBP1 (EH domain binding protein 1), LRP2BP (LRP2 binding protein), LRP1B (low-density lipoprotein receptor-related protein 1B), MYO7A (myosin VIIA), MYO9A (myosin IXA) and PRPSAP1 (phosphoribosyl pyrophosphate synthetase-associated protein 1). The haplotype analysis of these genes revealed that the haplotype frequencies were significantly different (P<0.01) between the two lines (Table 4).
Table 3.
Statistics summary for core haplotypes with P<0.01 after the relative extended haplotype homozygosity (REHH) test
|
Lean line | ||||||
|---|---|---|---|---|---|---|
| Chr | Core position | Hap Freq | EHH | REHH1 | REHH P-value1 | Genes |
| 1 |
39360501-39455853 |
0.46 |
0.98 |
3.99 |
0.0027 |
/ |
| 1 |
49926970-49964278 |
0.30 |
0.97 |
4.18 |
0.0021 |
C12orf69, WBP11, H2A4, H2B1, H4, H32, H2B8 |
| 1 |
173098805-173190831 |
0.37 |
0.99 |
4.25 |
0.0027 |
RB1, LPAR6, O57531, RCBTB2 |
| 1 |
198071099-198113519 |
0.55 |
0.80 |
3.03 |
0.0031 |
GDPD4, MYO7A |
| 2 |
3631683-3739002 |
0.32 |
0.70 |
4.88 |
0.0004 |
Q5ZK34 |
| 2 |
19934135-20028093 |
0.30 |
0.97 |
3.88 |
0.0035 |
RSU1 |
| 2 |
26912546-26974875 |
0.28 |
1.00 |
3.65 |
0.0050 |
/ |
| 2 |
99818321-100051643 |
0.41 |
1.00 |
3.00 |
0.0047 |
GNAL, NRGN |
| 2 |
131104507-131150076 |
0.48 |
0.98 |
3.24 |
0.0029 |
Q6V0P0, INTS8, F1P3N8 |
| 2 |
143016981-143059231 |
0.36 |
0.97 |
3.46 |
0.0034 |
/ |
| 2 |
145836411-145908271 |
0.30 |
1.00 |
3.72 |
0.0045 |
/ |
| 2 |
150489129-150540434 |
0.34 |
1.00 |
3.51 |
0.0044 |
/ |
| 3 |
3794973-3861882 |
0.30 |
0.79 |
4.72 |
0.0005 |
C20orf26, CRNKL1 |
| 3 |
3794973-3861882 |
0.30 |
0.82 |
3.85 |
0.0020 |
C20orf26, CRNKL1 |
| 3 |
10257926-10454969 |
0.55 |
0.49 |
2.49 |
0.0019 |
F1NRN6 |
| 3 |
14895290-14957057 |
0.44 |
0.72 |
3.16 |
0.0048 |
PLCB4 |
| 3 |
26957549-26996618 |
0.46 |
0.80 |
3.69 |
0.0009 |
/ |
| 3 |
26957549-26996618 |
0.46 |
0.83 |
3.47 |
0.0013 |
/ |
| 3 |
27303800-27335510 |
0.52 |
0.92 |
3.78 |
0.0009 |
SRBD1 |
| 3 |
27382993-27430067 |
0.54 |
0.84 |
3.77 |
0.0009 |
SRBD1 |
| 3 |
35555718-35610466 |
0.47 |
0.66 |
3.02 |
0.0031 |
E1C4G2 |
| 3 |
68936320-69076223 |
0.27 |
0.98 |
3.79 |
0.0041 |
RPF2, GTF3C6, Q5F484, CDK19 |
| 4 |
3522359-3551494 |
0.59 |
0.54 |
3.10 |
0.0023 |
MBNL3 |
| 4 |
9568761-9604871 |
0.55 |
1.00 |
2.95 |
0.0040 |
/ |
| 4 |
17765695-17819334 |
0.41 |
1.00 |
3.56 |
0.0037 |
F1NEF4, HMGB3 |
| 4 |
46149116-46190279 |
0.36 |
0.99 |
3.35 |
0.0044 |
EREG, Q645M5 |
| 4 |
55424480-55472209 |
0.66 |
0.9 |
2.60 |
0.0005 |
TRPC3, BBS7 |
| 4 |
83051637-83117974 |
0.39 |
0.87 |
3.72 |
0.0022 |
/ |
| 5 |
9740941-9828144 |
0.49 |
1.00 |
3.42 |
0.0014 |
IF4G2, CTR9, MRVI1 |
| 5 |
23825115-23872187 |
0.41 |
0.78 |
3.19 |
0.0030 |
O93582 |
| 5 |
42592517-42679460 |
0.30 |
1.00 |
3.70 |
0.0044 |
/ |
| 6 |
6546601-6626145 |
0.39 |
1.00 |
4.42 |
0.0011 |
/ |
| 6 |
35354459-35390346 |
0.38 |
0.99 |
3.72 |
0.0030 |
PTPRE |
| 7 |
28869664-28906344 |
0.31 |
1.00 |
4.88 |
0.0015 |
MYLK |
| 7 |
35674098-35715122 |
0.67 |
0.48 |
2.09 |
0.0027 |
|
| 8 |
6107407-6172105 |
0.36 |
0.63 |
3.72 |
0.0020 |
IER5, KIAA1614, XPR1 |
| 9 |
16264832-16366749 |
0.45 |
0.97 |
4.04 |
0.0024 |
PSMD1, ARMC9, B3GNT7 |
| 10 |
5831963-5856349 |
0.59 |
0.97 |
1.83 |
0.0034 |
/ |
| 10 |
19717086-19745274 |
0.48 |
1.00 |
2.90 |
0.0011 |
CHSY1 |
| 11 |
17094961-17160195 |
0.30 |
0.63 |
3.35 |
0.0001 |
BCDO1, GAN |
| 13 |
2628777-2664596 |
0.35 |
1.00 |
3.94 |
0.0048 |
Q5ZHQ9 |
| 13 |
2726706-2746894 |
0.39 |
0.79 |
4.06 |
0.0041 |
/ |
| 13 |
16758621-16783127 |
0.26 |
0.69 |
3.26 |
0.0050 |
FSTL4 |
| 15 |
7345639-7377799 |
0.26 |
0.54 |
2.38 |
0.0004 |
SEZ6L, ASPHD2, HPS4 |
| 18 |
9949736-10015444 |
0.39 |
1.00 |
2.34 |
0.0031 |
SPAG9 |
| 18 |
10117401-10135964 |
0.39 |
1.00 |
2.64 |
0.0013 |
F1NM51 |
| 19 |
8727596-8786448 |
0.60 |
0.55 |
1.77 |
0.0038 |
MSI1 |
| 20 |
9090808-9113453 |
0.29 |
0.95 |
6.18 |
0.0036 |
MYT1 |
| 20 |
9246245-9278998 |
0.32 |
0.80 |
5.39 |
0.0040 |
E1C8M0 |
| 20 |
9879361-9899719 |
0.27 |
0.96 |
6.40 |
0.0030 |
CSK21 |
| 22 |
2952274-3002268 |
0.29 |
0.29 |
3.93 |
0.0039 |
/ |
| Fat line | ||||||
| 1 |
51248496-51279543 |
0.33 |
0.81 |
4.45 |
0.0018 |
TCF20 |
| 1 |
58120009-58215364 |
0.55 |
0.99 |
3.15 |
0.0016 |
Q8UVD4 |
| 1 |
60171076-60254771 |
0.46 |
1.00 |
4.12 |
0.0049 |
/ |
| 1 |
67763862-67830818 |
0.26 |
0.96 |
4.06 |
0.0026 |
/ |
| 1 |
68213617-68257241 |
0.61 |
0.94 |
4.21 |
0.0016 |
SOX5 |
| 1 |
69634186-69686357 |
0.66 |
0.99 |
2.89 |
0.0003 |
/ |
| 1 |
101535615-101635667 |
0.29 |
1.00 |
5.24 |
0.0005 |
SAMSN1 |
| 1 |
114789487-114875623 |
0.29 |
0.99 |
3.66 |
0.0048 |
MAOB, MAOA |
| 1 |
125909995-126011984 |
0.35 |
1.00 |
3.77 |
0.0036 |
E1BTB5 |
| 1 |
154665510-154752965 |
0.72 |
0.89 |
2.09 |
0.0034 |
/ |
| 1 |
181800227-181883545 |
0.33 |
0.99 |
4.00 |
0.0033 |
A1XGV6 |
| 1 |
181800227-181883545 |
0.33 |
1.00 |
3.81 |
0.0043 |
A1XGV6 |
| 2 |
76768841-76854523 |
0.31 |
1.00 |
4.30 |
0.0041 |
/ |
| 2 |
151203953-151251059 |
0.62 |
0.82 |
2.32 |
0.0033 |
TRAPPC9 |
| 2 |
153117092-153143883 |
0.71 |
0.77 |
1.68 |
0.0038 |
/ |
| 3 |
9177907-9222825 |
0.38 |
0.95 |
4.00 |
0.0024 |
EHBP1 |
| 3 |
9177907-9222825 |
0.38 |
0.90 |
3.66 |
0.0039 |
EHBP1 |
| 3 |
16143474-16194865 |
0.30 |
0.98 |
4.98 |
0.0016 |
/ |
| 3 |
24945839-24986772 |
0.61 |
0.70 |
2.15 |
0.0014 |
/ |
| 3 |
44265116-44311493 |
0.40 |
0.99 |
3.50 |
0.0050 |
UNC93A |
| 3 |
69863850-69906698 |
0.34 |
1.00 |
4.29 |
0.0038 |
/ |
| 3 |
85874137-85931473 |
0.41 |
1.00 |
3.97 |
0.0031 |
LMBRD1 |
| 3 |
97227680-97337906 |
0.28 |
0.99 |
3.81 |
0.0042 |
/ |
| 4 |
11582141-11642538 |
0.27 |
0.96 |
4.53 |
0.0029 |
/ |
| 4 |
40653593-40713404 |
0.32 |
0.93 |
4.40 |
0.0010 |
C4orf20, LRP2BP, SNX25 |
| 4 |
55950677-55991394 |
0.28 |
0.99 |
4.55 |
0.0028 |
/ |
| 4 |
55950677-55991394 |
0.28 |
1.00 |
4.36 |
0.0036 |
/ |
| 4 |
86719441-86754976 |
0.57 |
0.75 |
2.88 |
0.0048 |
/ |
| 5 |
556571-628531 |
0.25 |
0.67 |
4.37 |
0.0026 |
F1NYX6, PLCB2, BUB1B, PAK6 |
| 5 |
40239840-40261525 |
0.29 |
0.97 |
4.48 |
0.0038 |
VSX2, F1N9P5 |
| 5 |
47240577-47282933 |
0.40 |
0.95 |
2.91 |
0.0029 |
RIN3, LGMN |
| 5 |
59811459-59880511 |
0.39 |
0.66 |
3.36 |
0.0041 |
/ |
| 6 |
26756202-26793956 |
0.34 |
0.98 |
3.94 |
0.0049 |
/ |
| 6 |
29341938-29401207 |
0.32 |
0.97 |
5.50 |
0.0007 |
ABLIM1 |
| 7 |
30090927-30155133 |
0.30 |
0.88 |
3.77 |
0.0033 |
F1NF72 |
| 7 |
31374271-31418061 |
0.42 |
1.00 |
2.88 |
0.0049 |
LYPD1, NCKAP5 |
| 7 |
33795201-33904515 |
0.47 |
1.00 |
2.20 |
0.0025 |
LRP1B |
| 7 |
36818722-36875768 |
0.26 |
0.99 |
3.95 |
0.0024 |
Q9DEH4 |
| 7 |
37031922-37124566 |
0.56 |
1.00 |
2.92 |
0.0047 |
STAM2, FMNL2 |
| 8 |
5597-492518 |
0.56 |
0.99 |
1.94 |
0.0036 |
F1NF53 |
| 8 |
2178258-2252969 |
0.47 |
0.92 |
4.20 |
0.0004 |
NEK7 |
| 9 |
2952291-3007034 |
0.41 |
0.71 |
3.85 |
0.0044 |
/ |
| 10 |
763998-831991 |
0.50 |
0.78 |
5.04 |
0.0004 |
MYO9A, F1P0M4 |
| 11 |
9804894-9826761 |
0.47 |
0.52 |
3.11 |
0.0014 |
/ |
| 11 |
16253047-16303345 |
0.58 |
0.35 |
1.80 |
0.0040 |
/ |
| 12 |
1157199-1170169 |
0.37 |
0.63 |
4.57 |
0.0030 |
/ |
| 13 |
1533552-1640154 |
0.40 |
1.00 |
3.41 |
0.0049 |
SRA1, APBB3, F1NH59 |
| 14 |
8048059-8173629 |
0.42 |
0.86 |
3.09 |
0.0015 |
/ |
| 15 |
8495796-8543001 |
0.29 |
1.00 |
4.86 |
0.0003 |
TBX6, CRKL, KLHL22 |
| 15 |
8495796-8543001 |
0.29 |
0.99 |
4.43 |
0.0006 |
TBX6, CRKL, KLHL22 |
| 17 |
3250605-3271593 |
0.27 |
0.97 |
3.91 |
0.0033 |
/ |
| 17 |
4062173-4087131 |
0.26 |
0.94 |
3.77 |
0.0040 |
C4PCF3 |
| 18 |
4433126-4445816 |
0.26 |
0.79 |
5.99 |
0.0037 |
PRPSAP1 |
| 18 |
8365846-8400245 |
0.47 |
0.80 |
3.53 |
0.0038 |
/ |
| 23 |
935267-970086 |
0.31 |
0.91 |
5.40 |
0.0040 |
EDN2 |
| 24 |
5613517-5633477 |
0.28 |
0.86 |
4.38 |
0.0024 |
ZW10, F1NC10 |
| 24 | 6145308-6158962 | 0.31 | 0.80 | 5.30 | 0.0047 | / |
1REHH and P-values are presented for upstream and downstream sides from each core haplotype, respectively.
Table 4.
Haplotype frequencies in the lean and fat lines of the core regions including 10 important genes
| Gene and core regions | Haplotype Number | Haploptypes |
Haplotype frequency |
P-value1 | |
|---|---|---|---|---|---|
| Lean line | Fat line | ||||
|
MAOB, MAOA |
1 |
CAAGG |
0.645 |
0.615 |
<0.001 |
| Chr1: 114789487-114875623 |
2 |
AAAGA |
0.197 |
0 |
|
| 3 |
CGGAG |
0.158 |
0.269 |
||
| 4 |
CGAGA |
0 |
0.077 |
||
| 5 |
AAAGG |
0 |
0.038 |
||
|
RB1 |
1 |
GGAA |
0.421 |
0.410 |
<0.001 |
| Chr1: 173098805-173190831 |
2 |
GAGG |
0.368 |
0.103 |
|
| 3 |
GAAA |
0.211 |
0.192 |
||
| 4 |
AAGG |
0 |
0.244 |
||
| 5 |
AGGA |
0 |
0.038 |
||
| 6 |
GAGA |
0 |
0.013 |
||
|
MYO7A |
1 |
AGG |
0.618 |
0.090 |
<0.001 |
| Chr1: 198071099-198113519 |
2 |
GAA |
0.316 |
0.207 |
|
| 3 |
GGA |
0.066 |
0.652 |
||
| 4 |
GAG |
0 |
0.037 |
||
| 5 |
GGG |
0 |
0.014 |
||
|
EHBP1 |
1 |
GGG |
0.855 |
0.090 |
<0.001 |
| Chr3: 9177907-9222825 |
2 |
GAG |
0.132 |
0.359 |
|
| 3 |
AGG |
0.013 |
0.128 |
||
| 4 |
GGA |
0 |
0.423 |
||
|
LRP2BP |
1 |
GGGG |
0.443 |
0.487 |
<0.001 |
| Chr4: 40653593-40713404 |
2 |
AAAA |
0.338 |
0.211 |
|
| 3 |
GGAA |
0.176 |
0 |
||
| 4 |
AAGG |
0.044 |
0.303 |
||
|
BBS7 |
1 |
AGGC |
0.605 |
0.282 |
<0.001 |
| Chr4: 55424480-55472209 |
2 |
GAAA |
0.368 |
0.301 |
|
| 3 |
AAAA |
0.026 |
0 |
||
| 4 |
AGAC |
0 |
0.198 |
||
| 5 |
AGAA |
0 |
0.161 |
||
| 6 |
GAAC |
0 |
0.058 |
||
|
LRP1B |
1 |
AGAGAC |
0.361 |
0.013 |
<0.001 |
| Chr7: 33795201-33904515 |
2 |
GGAGGA |
0.197 |
|
|
| 3 |
AGAAGA |
0.105 |
0.154 |
||
| 4 |
GGGGGA |
0.066 |
0.449 |
||
| 5 |
AGAAGC |
0.057 |
0.346 |
||
| 6 |
GAGGGA |
0.055 |
0.038 |
||
| 7 |
GAGAGA |
0.050 |
0 |
||
| 8 |
GGAAGA |
0.049 |
0 |
||
| 9 |
GAGGAA |
0.026 |
0 |
||
| 10 |
GGAGAA |
0.018 |
0 |
||
| 11 |
AGAAAC |
0.016 |
0 |
||
|
MYO9A |
1 |
GGGAA |
0.355 |
0.051 |
<0.001 |
| Chr10: 763998-831991 |
2 |
AAGAA |
0.276 |
0.358 |
|
| 3 |
AAGAG |
0.237 |
0 |
||
| 4 |
GGGGA |
0.118 |
0.013 |
||
| 5 |
AGGAA |
0.013 |
0.065 |
||
| 6 |
AGAAA |
0 |
0.500 |
||
| 7 |
AAAAA |
0 |
0.013 |
||
|
PRPSAP1 |
1 |
AGA |
0.816 |
0.615 |
<0.001 |
| Chr18: 4433126-4445816 | |||||
| 2 |
GGG |
0.118 |
0.026 |
||
| 3 |
AAG |
0.066 |
0.090 |
||
| 4 | AGG | 0 | 0.269 | ||
1P-values of Fisher’s Exact Test for difference analysis of haplotype frequencies between lean and fat lines.
Mapping selection signatures to QTLs
The chicken QTL database available online (http://www.animalgenome.org/cgi-bin/QTLdb/GG/index) was explored to identify any overlapping of the core regions with significant REHH P-values (P<0.01) and published QTLs in chickens. The approximate positions of the overlapping QTLs for each core region are listed in Table 5. There were many overlaps between the core regions with significant REHH P-values (P<0.01) and published QTLs for AF content in chickens.
Table 5.
Reported QTL near the core regions with P <0.01 in the lean and fat lines
| Lean line | ||||||
|---|---|---|---|---|---|---|
| Chr |
Core region (bp) |
Trait |
QTL position (bp) |
F-ratio |
P-value |
Reference |
| 1 |
39360501-39455853 |
AFP |
1937738-52700434 |
1.474 |
Suggestive |
[21] |
| 1 |
49926970-49964278 |
AFP |
25998723-65961966 |
1.732 |
Suggestive |
[21] |
| AFW |
25998723-65961966 |
1.882 |
Suggestive |
[21] |
||
| AFW |
48175152- 51977642 |
8.14 |
Significant |
[22] |
||
| 1 |
173098805-173190831 |
AFW |
158352237- 182910620 |
3.18 |
Significant |
[23] |
| AFP |
171224834- 174526878 |
20.34 |
Significant |
[23] |
||
| 2 |
3631683-3739002 |
AFW |
3097660- 4097660 |
3.38 |
Suggestive |
[24] |
| 3 |
3794973-3861882 |
AFP |
800029-110574691 |
1.364 |
Suggestive |
[21] |
| 3 |
10257926-10454969 |
AFP |
800029-110574691 |
1.364 |
Suggestive |
[21] |
| AFW |
6841859-13986734 |
8.16 |
Significant |
[22] |
||
| AFP |
6841859- 57396057 |
7.9 |
Significant |
[25] |
||
| AFW |
6841859- 44850897 |
7.4 |
Significant |
[25] |
||
| 3 |
14895290-14957057 |
AFP |
800029-110574691 |
1.364 |
Suggestive |
[21] |
| AFW |
6841859-13986734 |
8.16 |
Significant |
[22] |
||
| AFP |
6841859- 57396057 |
7.9 |
Significant |
[25] |
||
| AFW |
6841859- 44850897 |
7.4 |
Significant |
[25] |
||
| AFW |
13986734-25508863 |
\ |
Suggestive |
[26] |
||
| 3 |
26957549-26996618 |
AFP |
800029-110574691 |
1.364 |
Suggestive |
[21] |
| AFP |
6841859- 57396057 |
7.9 |
Significant |
[25] |
||
| AFW |
6841859- 44850897 |
7.4 |
Significant |
[25] |
||
| AFW |
24160710-51592221 |
\ |
Suggestive |
[27] |
||
| AFW |
25508863- 35512024 |
\ |
Suggestive |
[26] |
||
| 3 |
27303800-27335510 |
AFP |
800029-110574691 |
1.364 |
Suggestive |
[21] |
| AFP |
6841859- 57396057 |
7.9 |
Significant |
[25] |
||
| AFW |
6841859- 44850897 |
7.4 |
Significant |
[25] |
||
| AFW |
24160710-51592221 |
\ |
Suggestive |
[27] |
||
| AFW |
25508863- 35512024 |
\ |
Suggestive |
[26] |
||
| 3 |
27382993-27430067 |
AFP |
800029-110574691 |
1.364 |
Suggestive |
[21] |
| AFP |
6841859- 57396057 |
7.9 |
Significant |
[25] |
||
| AFW |
6841859- 44850897 |
7.4 |
Significant |
[25] |
||
| AFW |
24160710-51592221 |
\ |
Suggestive |
[27] |
||
| AFW |
25508863- 35512024 |
\ |
Suggestive |
[26] |
||
| 3 |
35555718-35610466 |
AFP |
800029-110574691 |
1.364 |
Suggestive |
[21] |
| AFW |
35512024-40755790 |
18.5 |
Significant |
[28] |
||
| AFP |
35512024-40755790 |
13.1 |
Significant |
[28] |
||
| 4 |
17765695-17819334 |
AFW |
17425871-18425871 |
\ |
Significant |
[29] |
| 4 |
46149116-46190279 |
AFW |
42005559- 51609571 |
2.26 |
Suggestive |
[30] |
| 4 |
55424480-55472209 |
AFP |
51266614- 88408499 |
16.0 |
Significant |
[25] |
| 4 |
83051637-83117974 |
AFP |
51266614- 88408499 |
16.0 |
Significant |
[25] |
| AFW |
80258156-88408499 |
6.9 |
Significant |
[25] |
||
| AFW |
81539616- 84618310 |
2.04 |
Suggestive |
[30] |
||
| 5 |
23825115-23872187 |
AFW |
18412554-42717839 |
21.8 |
Significant |
[25] |
| AFP |
18723157- 43339045 |
19.4 |
Significant |
[25] |
||
| AFW |
19782191- 30162990 |
\ |
Suggestive |
[26] |
||
| AFW |
19782191- 30162990 |
7.04 |
Significant |
[31] |
||
| 5 |
42592517-42679460 |
AFW |
18412554-42717839 |
21.8 |
Significant |
[25] |
| AFP |
18723157- 43339045 |
19.4 |
Significant |
[25] |
||
| AFW |
37226264-53779276 |
6.74 |
Significant |
[31] |
||
| 6 |
35354459-35390346 |
AFP |
29647151- 37399694 |
6.9 |
Significant |
[25] |
| 7 |
28869664-28906344 |
AFW |
25306930- 38010856 |
\ |
Suggestive |
[27] |
| AFW |
28166221- 29166221 |
9.78 |
Significant |
[32] |
||
| AFW |
28166221- 29166221 |
\ |
Significant |
[33] |
||
| 7 |
35674098-35715122 |
AFW |
25306930- 38010856 |
\ |
Suggestive |
[27] |
| 9 |
16264832-16366749 |
AFW |
13658592-23770679 |
5.03 |
Suggestive |
[22] |
| AFW |
15457880-16457880 |
7.0 |
Suggestive |
[34] |
||
| 10 |
19717086-19745274 |
AFP |
16519830- 20778533 |
9.9 |
Significant |
[28] |
| 13 |
16758621-16783127 |
AFW |
16327806- 18173123 |
2.10 |
Suggestive |
[30] |
| 15 |
7345639-7377799 |
AFW |
1917251- 10769106 |
10.2 |
Significant |
[25] |
| AFP |
2388961-10769106 |
12.8 |
Significant |
[25] |
||
| AFW |
2798507-10769106 |
8.13 |
Significant |
[22] |
||
| AFW |
2798507-10769106 |
5.67 |
Suggestive |
[22] |
||
| AFW |
3717446-7928397 |
2.21 |
Suggestive |
[30] |
||
| AFP |
3717446-7928397 |
2.22 |
Suggestive |
[30] |
||
| Fat line | ||||||
| 1 |
51248496-51279543 |
AFP |
1937738-52700434 |
1.474 |
Suggestive |
[21] |
| AFW |
48175152- 51977642 |
8.14 |
Significant |
[22] |
||
| AFP |
25998723- 65961966 |
1.732 |
Suggestive |
[21] |
||
| AFW |
25998723- 65961966 |
1.882 |
Suggestive |
[21] |
||
| 1 |
58120009-58215364 |
AFP |
25998723- 65961966 |
1.732 |
Suggestive |
[21] |
| AFW |
25998723- 65961966 |
1.882 |
Suggestive |
[21] |
||
| AFW |
55261695-67128747 |
12.18 |
Significant |
[35] |
||
| 1 |
60171076-60254771 |
AFP |
25998723- 65961966 |
1.732 |
Suggestive |
[21] |
| AFW |
25998723- 65961966 |
1.882 |
Suggestive |
[21] |
||
| AFW |
55261695-67128747 |
12.18 |
Significant |
[35] |
||
| 1 |
67763862-67830818 |
AFW |
67327367-68327367 |
\ |
Significant |
[33] |
| 1 |
68213617-68257241 |
AFW |
67327367-68327367 |
\ |
Significant |
[33] |
| 1 |
101535615-101635667 |
AFW |
89938943-167462479 |
9.4 |
Significant |
[36] |
| AFW |
94157976- 102460326 |
6.11 |
Suggestive |
[35] |
||
| 1 |
114789487-114875623 |
AFW |
113344161- 132660888 |
7.90 |
Suggestive |
[35] |
| AFW |
114143603- 115143603 |
7.1 |
Significant |
[36] |
||
| 1 |
125909995-126011984 |
AFW |
113344161- 132660888 |
7.90 |
Suggestive |
[35] |
| 1 |
181800227-181883545 |
AFW |
158352237-182910620 |
3.18 |
Significant |
[23] |
| 3 |
9177907-9222825 |
AFP |
800029- 110574691 |
1.364 |
Suggestive |
[21] |
| AFW |
6841859- 13986734 |
8.16 |
Significant |
[22] |
||
| AFW |
6841859- 13986734 |
5.8 |
Suggestive |
[22] |
||
| AFP |
6841859-57396057 |
7.9 |
Significant |
[25] |
||
| AFW |
6841859-44850897 |
7.4 |
Significant |
[25] |
||
| 3 |
16143474-16194865 |
AFP |
800029- 110574691 |
1.364 |
Suggestive |
[21] |
| AFP |
6841859-57396057 |
7.9 |
Significant |
[25] |
||
| AFW |
6841859-44850897 |
7.4 |
Significant |
[25] |
||
| AFW |
13986734-25508863 |
\ |
Suggestive |
[26] |
||
| 3 |
24945839-24986772 |
AFP |
800029- 110574691 |
1.364 |
Suggestive |
[21] |
| AFP |
6841859-57396057 |
7.9 |
Significant |
[25] |
||
| AFW |
6841859-44850897 |
7.4 |
Significant |
[25] |
||
| AFW |
13986734-25508863 |
\ |
Suggestive |
[26] |
||
| AFW |
24160710-51592221 |
\ |
Suggestive |
[27] |
||
| 3 |
44265116-44311493 |
AFP |
800029- 110574691 |
1.364 |
Suggestive |
[21] |
| AFP |
6841859-57396057 |
7.9 |
Significant |
[25] |
||
| AFW |
6841859-44850897 |
7.4 |
Significant |
[25] |
||
| AFW |
24160710-51592221 |
\ |
Suggestive |
[27] |
||
| AFW |
40755790-45203763 |
7.5 |
Significant |
[28] |
||
| AFP |
40755790-45203763 |
10.8 |
Significant |
[28] |
||
| 3 |
69863850-69906698 |
AFP |
800029- 110574691 |
1.364 |
Suggestive |
[21] |
| 3 |
85874137-85931473 |
AFP |
800029- 110574691 |
1.364 |
Suggestive |
[21] |
| 3 |
97227680-97337906 |
AFP |
800029- 110574691 |
1.364 |
Suggestive |
[21] |
| 4 |
40653593-40713404 |
AFP |
40473174-41473174 |
\ |
Significant |
[32] |
| 4 |
55950677-55991394 |
AFP |
51266614- 88408499 |
16.0 |
Significant |
[25] |
| 4 |
86719441-86754976 |
AFP |
51266614- 88408499 |
16.0 |
Significant |
[25] |
| AFW |
80258156-88408499 |
6.9 |
Significant |
[25] |
||
| 5 |
40239840-40261525 |
AFW |
18412554- 42717839 |
21.8 |
Significant |
[25] |
| AFP |
18723157- 43339045 |
19.4 |
Significant |
[25] |
||
| AFW |
37226264- 53779276 |
6.74 |
Significant |
[31] |
||
| AFW |
40158255- 41158255 |
\ |
Significant |
[37] |
||
| AFW |
40158255- 41158255 |
\ |
Significant |
[38] |
||
| AFP |
40158255- 41158255 |
\ |
Significant |
[38] |
||
| 5 |
47240577-47282933 |
AFW |
37226264- 53779276 |
6.74 |
Significant |
[31] |
| 5 |
59811459-59880511 |
AFW |
51748760-60234891 |
\ |
Significant |
[26] |
| AFW |
53867807-62098509 |
11.87 |
Significant |
[31] |
||
| AFW |
53867807-62098509 |
6.82 |
Significant |
[31] |
||
| 7 |
30090927-30155133 |
AFW |
25306930- 38010856 |
\ |
Suggestive |
[27] |
| 7 |
31374271-31418061 |
AFW |
25306930- 38010856 |
\ |
Suggestive |
[27] |
| 7 |
33795201-33904515 |
AFW |
25306930- 38010856 |
\ |
Suggestive |
[27] |
| AFW |
32440861-34526547 |
2.08 |
Suggestive |
[30] |
||
| 7 |
36818722-36875768 |
AFW |
25306930- 38010856 |
\ |
Suggestive |
[27] |
| 7 |
37031922-37124566 |
AFW |
25306930- 38010856 |
\ |
Suggestive |
[27] |
| 9 |
2952291-3007034 |
AFW |
2798942-3798942 |
\ |
Significant |
[32] |
| AFP |
2972071-3972071 |
\ |
Significant |
[32] |
||
| 11 |
9804894-9826761 |
AFW |
6272742- 12810705 |
2.15 |
Suggestive |
[30] |
| 12 |
1157199-1170169 |
AFP |
734209- 12275026 |
5.22 |
Significant |
[28] |
| AFP |
734209- 12275026 |
4.51 |
Significant |
[28] |
||
| AFP |
813709-1813709 |
\ |
Significant |
[32] |
||
| 15 |
8495796-8543001 |
AFW |
1917251- 10769106 |
10.2 |
Significant |
[25] |
| AFP |
2388961- 10769106 |
12.8 |
Significant |
[25] |
||
| AFW |
2798507- 10769106 |
8.13 |
Significant |
[22] |
||
| AFW |
2798507- 10769106 |
5.67 |
Suggestive |
[22] |
||
| 23 | 935267-970086 | AFW | 74802-1074802 | \ | Significant | [39] |
Discussion
Selective sweep is used to detect genomic regions with reduced variation in allele frequency in any population experiencing divergent selection for specific traits. Here, we determined the feasibility of the selective sweep approach for finding genes important for AF deposition in chickens. The long-range haplotype test was employed, which detects selection signature by measuring the characteristics of haplotypes within the lean and fat lines divergently selected for AF content. There were 5357 and 5593 core regions in the lean and fat lines, respectively. When comparing the average marker spacing with mean core length and number of SNPs forming cores, we revealed that core regions are more likely to appear in regions with higher marker density.
The selection signatures on the whole genome were calculated, and a subset of putative core regions with significant REHH P-values (P<0.01) was identified. The genes in these core regions were detected and 10 genes, including RB1, BBS7, MAOA, MAOB, EHBP1, LRP2BP, LRP1B, MYO7A, MYO9A and PRPSAP1, were important for fatness. Among these 10 important genes, seven genes, including RB1, BBS7, MAOA, MAOB, EHBP1, LRP2BP and LRP1B, were all in the QTL regions reported previously for AF in chickens (Table 5). Although the other three genes, including MYO7A, MYO9A and PRPSAP1, were not in the QTL regions, these genes were also important for the AF deposition.
The known functions of these 10 genes were analyzed and the results indicated that they were likely to be linked with fatness. The RB1 gene regulates the C/EBP-DNA-binding activity during 3T3-L1 adipogenesis and plays a key role in adipocyte differentiation [40,41].
The BBS7 gene is a member of the Bardet-Biedl syndrome (BBS) family. BBS is a pleiotropic genetic disorder characterized by obesity, photoreceptor degeneration, polydactyly, hypogenitalism, renal abnormalities, and developmental delay [42]. BBS is recognized to be a genetically heterogeneous autosomal recessive disorder mapped to eight loci [42]. Positional cloning and candidate genes identified six BBS genes, including BBS1, BBS2, BBS4, BBS6, BBS7, and BBS8[42]. These BBS genes may be important for obesity.
The MAOA and MAOB are two enzymes important for dopamine production. The dopamine levels influence the risk of obesity and MAOA and MOAB may be implicated in human obesity [43].
The EHBP1 gene is required for insulin-stimulated GLUT4 movements [44]. Insulin stimulates glucose transport in adipose tissues by recruiting intracellular membrane vesicles containing the glucose transporter GLUT4 to the plasma membrane [44]. The mechanisms involved in the biogenesis of these vesicles and their translocation to the cell surface were studied and the results indicated that EHD1 and EHBP1 are required for perinuclear localization of GLUT4, and the loss of EHBP1 disrupts insulin-regulated GLUT4 recycling in cultured adipocytes [44]. This indicates that the EHBP1 gene may be important in adipocyte differentiation.
The LRP2BP and LRP1B genes are two members of the low-density lipoprotein receptor family that participates in a wide range of physiological processes, including the regulation of lipid metabolism, protection against atherosclerosis, neurodevelopment, and transport of nutrients and vitamins [45].
The MYO7A and MYO9A are two myosin genes. A spontaneous mutant mouse line, Myo7ash1-6J, was used to study the function of the MYO7A gene, and the result indicated that the mutant male homozygous mice displayed decreased body weight and body fat [46]. The MYO9A gene was in the BBS4 region of chromosome 15q22-q23 [47], which might be important for obesity.
The PRPSAP1 gene is named as phosphoribosyl pyrophosphate synthetase-associated protein 1. The results of differentially expressed genes associated with insulin resistance indicate that PRPSAP1 gene is associated with percentage of body fat [48].
The associations of these 10 genes with obesity or lipid metabolism were mainly in humans and mice. Because of the high conservation of these genes between humans, mice and chickens, the 10 genes might also be important for AF deposition in chickens.
Conclusions
Our results provide a genome-wide map of selection signatures in two chicken lines divergently selected for AF content. There were 51 and 57 core regions showing significant P-values (P<0.01) of selection signatures in the lean and fat lines, respectively. In these core regions there were a number of important genes, including RB1, BBS7, MAOA, MAOB, EHBP1, LRP2BP, LRP1B, MYO7A, MYO9A and PRPSAP1. These genes are important for AF deposition in chickens.
Abbreviations
AF: Abdominal fat; AFP: Abdominal fat percentage; AFW: Abdominal fat weight; BBS: Bardet-Biedl syndrome; CH: Core haplotypes; CR: Core region; EHH: Extended haplotype homozygosity; IHS: Integrated Haplotype Score; LD: Linkage disequilibrium; NEAU: Northeast Agricultural University; NEAUHLF: Northeast Agricultural University broiler lines divergently selected for abdominal fat content; NRC: National Research Council; QTL: Quantitative trait loci; REHH: Relative Extended Haplotype Homozygosity; SNP: Single nucleotide polymorphism; VLDL: Very low-density lipoprotein.
Competing interests
There are no potential competing interests related to this manuscript.
Authors’ contributions
HZ contributed to, conceived and designed the experiments, participated in the interpretation of the data, and drafted and wrote the manuscript. SZW participated in the design of the study and interpretation of the data, and contributed to writing the manuscript. ZPW participated in the design of the study and contributed to writing the manuscript. YD carried out analysis and interpretation of the data. NW participated in the design of the study and contributed to the analysis of the data. XXH participated in the analysis and interpretation of the data. YDZ participated in the design of the study and contributed to the analysis of the data. YXW participated in the design of the study. LL contributed reagents/materials/analysis tools. ZQT contributed reagents/materials/analysis tools. HL co-led the conception and design of the study, participated in the interpretation of the data, and contributed to writing the manuscript. All authors submitted comments on drafts, and read and approved the final manuscript.
Contributor Information
Hui Zhang, Email: 8294zhanghui@gmail.com.
Shou-Zhi Wang, Email: shouzhiwang@126.com.
Zhi-Peng Wang, Email: zpengwang@gmail.com.
Yang Da, Email: yda@umn.edu.
Ning Wang, Email: wayane123@yahoo.com.cn.
Xiao-Xiang Hu, Email: xiaoxiang.hu@gmail.com.
Yuan-Dan Zhang, Email: yzhang4@une.edu.au.
Yu-Xiang Wang, Email: wyx2000@neau.edu.cn.
Li Leng, Email: lengli1981@163.com.
Zhi-Quan Tang, Email: tzq530715@126.com.
Hui Li, Email: lihui@neau.edu.cn.
Acknowledgements
The authors would like to acknowledge the members of the Poultry Breeding Group of the College of Animal Science and Technology in Northeast Agricultural University for managing the birds and collecting data. This research was supported by the China Agriculture Research System (No. CARS-42), National 863 Project of China (No. 2011AA100301), National 973 Project of China (No. 2009CB941604) and Program for Innovation Research Team in University of Heilongjiang Province (No. 2010td02).
References
- Meuwissen TH, Hayes BJ, Goddard ME. Prediction of total genetic value using genome-wide dense marker maps. Genetics. 2001;157(4):1819–1829. doi: 10.1093/genetics/157.4.1819. [DOI] [PMC free article] [PubMed] [Google Scholar]
- Pollinger JP, Bustamante CD, Fledel-Alon A, Schmutz S, Gray MM, Wayne RK. Selective sweep mapping of genes with large phenotypic effects. Genome Res. 2005;15(12):1809–1819. doi: 10.1101/gr.4374505. [DOI] [PMC free article] [PubMed] [Google Scholar]
- Daetwyler HD, Schenkel FS, Sargolzaei M, Robinson JA. A genome scan to detect quantitative trait loci for economically important traits in Holstein cattle using two methods and a dense single nucleotide polymorphism map. J Dairy Sci. 2008;91(8):3225–3236. doi: 10.3168/jds.2007-0333. [DOI] [PubMed] [Google Scholar]
- Hayes BJ, Lien S, Nilsen H, Olsen HG, Berg P, Maceachern S, Potter S, Meuwissen TH. The origin of selection signatures on bovine chromosome 6. Anim Genet. 2008;39(2):105–111. doi: 10.1111/j.1365-2052.2007.01683.x. [DOI] [PubMed] [Google Scholar]
- Hayes BJ, Chamberlain AJ, Maceachern S, Savin K, McPartlan H, MacLeod I, Sethuraman L, Goddard ME. A genome map of divergent artificial selection between Bos taurus dairy cattle and Bos taurus beef cattle. Anim Genet. 2009;40(2):176–184. doi: 10.1111/j.1365-2052.2008.01815.x. [DOI] [PubMed] [Google Scholar]
- Prasad A, Schnabel RD, McKay SD, Murdoch B, Stothard P, Kolbehdari D, Wang Z, Taylor JF, Moore SS. Linkage disequilibrium and signatures of selection on chromosomes 19 and 29 in beef and dairy cattle. Anim Genet. 2008;39(6):597–605. doi: 10.1111/j.1365-2052.2008.01772.x. [DOI] [PMC free article] [PubMed] [Google Scholar]
- Qanbari S, Pimentel EC, Tetens J, Thaller G, Lichtner P, Sharifi AR, Simianer H. A genome-wide scan for signatures of recent selection in Holstein cattle. Anim Genet. 2010;41(4):377–389. doi: 10.1111/j.1365-2052.2009.02016.x. [DOI] [PubMed] [Google Scholar]
- Kimura M. The Neutral Theory of Molecular Evolution. Cambridge, MA: Cambridge University Press; 1983. [Google Scholar]
- Smith JM, Haigh J. The hitch-hiking effect of a favourable gene. Genet Res. 1974;23(1):23–35. [PubMed] [Google Scholar]
- Nielsen R. Molecular signatures of natural selection. Annu Rev Genet. 2005;39:197–218. doi: 10.1146/annurev.genet.39.073003.112420. [DOI] [PubMed] [Google Scholar]
- Sabeti PC, Reich DE, Higgins JM, Levine HZ, Richter DJ, Schaffner SF, Gabriel SB, Platko JV, Patterson NJ, McDonald GJ, Ackerman HC, Campbell SJ, Altshuler D, Cooper R, Kwiatkowski D, Ward R, Lander ES. Detecting recent positive selection in the human genome from haplotype structure. Nature. 2002;419(6909):832–837. doi: 10.1038/nature01140. [DOI] [PubMed] [Google Scholar]
- Tajima F. Statistical method for testing the neutral mutation hypothesis by DNA polymorphism. Genetics. 1989;123(3):585–595. doi: 10.1093/genetics/123.3.585. [DOI] [PMC free article] [PubMed] [Google Scholar]
- Fay JC, Wu CI. Hitchhiking under positive Darwinian selection. Genetics. 2000;155(3):1405–1413. doi: 10.1093/genetics/155.3.1405. [DOI] [PMC free article] [PubMed] [Google Scholar]
- Akey JM, Zhang G, Zhang K, Jin L, Shriver MD. Interrogating a high-density SNP map for signatures of natural selection. Genome Res. 2002;12(12):1805–1814. doi: 10.1101/gr.631202. [DOI] [PMC free article] [PubMed] [Google Scholar]
- Voight BF, Kudaravalli S, Wen X, Pritchard JK. A map of recent positive selection in the human genome. PLoS Biol. 2006;4(3):e72. doi: 10.1371/journal.pbio.0040072. [DOI] [PMC free article] [PubMed] [Google Scholar]
- Tang K, Thornton KR, Stoneking M. A new approach for using genome scans to detect recent positive selection in the human genome. PLoS Biol. 2007;5(7):e171. doi: 10.1371/journal.pbio.0050171. [DOI] [PMC free article] [PubMed] [Google Scholar]
- Guo L, Sun B, Shang Z, Leng L, Wang Y, Wang N, Li H. Comparison of adipose tissue cellularity in chicken lines divergently selected for fatness. Poult Sci. 2011;90(9):2024–2034. doi: 10.3382/ps.2010-00863. [DOI] [PubMed] [Google Scholar]
- Scheet P, Stephens M. A fast and flexible statistical model for large-scale population genotype data: applications to inferring missing genotypes and haplotypic phase. Am J Hum Genet. 2006;78(4):629–644. doi: 10.1086/502802. [DOI] [PMC free article] [PubMed] [Google Scholar]
- Barrett JC, Fry B, Maller J, Daly MJ. Haploview: analysis and visualization of LD and haplotype maps. Bioinformatics. 2005;21(2):263–265. doi: 10.1093/bioinformatics/bth457. [DOI] [PubMed] [Google Scholar]
- Gabriel SB, Schaffner SF, Nguyen H, Moore JM, Roy J, Blumenstiel B, Higgins J, DeFelice M, Lochner A, Faggart M, Liu-Cordero SN, Rotimi C, Adeyemo A, Cooper R, Ward R, Lander ES, Daly MJ, Altshuler D. The structure of haplotype blocks in the human genome. Science. 2002;296(5576):2225–2229. doi: 10.1126/science.1069424. [DOI] [PubMed] [Google Scholar]
- Jennen DG, Vereijken AL, Bovenhuis H, Crooijmans RM, van der Poel JJ, Groenen MA. Confirmation of quantitative trait loci affecting fatness in chickens. Genet Sel Evol. 2005;37(2):215–228. doi: 10.1186/1297-9686-37-3-215. [DOI] [PMC free article] [PubMed] [Google Scholar]
- Ikeobi CO, Woolliams JA, Morrice DR, Law A, Windsor D, Burt DW, Hocking PM. Quantitative trait loci affecting fatness in the chicken. Anim Genet. 2002;33(6):428–435. doi: 10.1046/j.1365-2052.2002.00911.x. [DOI] [PubMed] [Google Scholar]
- Liu X, Zhang H, Li H, Li N, Zhang Y, Zhang Q, Wang S, Wang Q, Wang H. Fine-mapping quantitative trait loci for body weight and abdominal fat traits: effects of marker density and sample size. Poult Sci. 2008;87(7):1314–1319. doi: 10.3382/ps.2007-00512. [DOI] [PubMed] [Google Scholar]
- McElroy JP, Kim JJ, Harry DE, Brown SR, Dekkers JC, Lamont SJ. Identification of trait loci affecting white meat percentage and other growth and carcass traits in commercial broiler chickens. Poult Sci. 2006;85(4):593–605. doi: 10.1093/ps/85.4.593. [DOI] [PubMed] [Google Scholar]
- Nadaf J, Pitel F, Gilbert H, Duclos MJ, Vignoles F, Beaumont C, Vignal A, Porter TE, Cogburn LA, Aggrey SE, Simon J, Le Bihan-Duval E. QTL for several metabolic traits map to loci controlling growth and body composition in an F2 intercross between high- and low-growth chicken lines. Physiol Genomics. 2009;38(3):241–249. doi: 10.1152/physiolgenomics.90384.2008. [DOI] [PubMed] [Google Scholar]
- Lagarrigue S, Pitel F, Carré W, Abasht B, Le Roy P, Neau A, Amigues Y, Sourdioux M, Simon J, Cogburn L, Aggrey S, Leclercq B, Vignal A, Douaire M. Mapping quantitative trait loci affecting fatness and breast muscle weight in meat-type chicken lines divergently selected on abdominal fatness. Genet Sel Evol. 2006;38(1):85–97. doi: 10.1186/1297-9686-38-1-85. [DOI] [PMC free article] [PubMed] [Google Scholar]
- Park HB, Jacobsson L, Wahlberg P, Siegel PB, Andersson L. QTL analysis of body composition and metabolic traits in an intercross between chicken lines divergently selected for growth. Physiol Genomics. 2006;25(2):216–223. doi: 10.1152/physiolgenomics.00113.2005. [DOI] [PubMed] [Google Scholar]
- Campos RL, Nones K, Ledur MC, Moura AS, Pinto LF, Ambo M, Boschiero C, Ruy DC, Baron EE, Ninov K, Altenhofen CA, Silva RA, Rosário MF, Burt DW, Coutinho LL. Quantitative trait loci associated with fatness in a broiler-layer cross. Anim Genet. 2009;40(5):729–736. doi: 10.1111/j.1365-2052.2009.01910.x. [DOI] [PubMed] [Google Scholar]
- Atzmon G, Blum S, Feldman M, Lavi U, Hillel J. Detection of agriculturally important QTLs in chickens and analysis of the factors affecting genotyping strategy. Cytogenet Genome Res. 2007;117(1–4):327–337. doi: 10.1159/000103195. [DOI] [PubMed] [Google Scholar]
- Jennen DG, Vereijken AL, Bovenhuis H, Crooijmans RP, Veenendaal A, van der Poel JJ, Groenen MA. Detection and localization of quantitative trait loci affecting fatness in broilers. Poult Sci. 2004;83(3):295–301. doi: 10.1093/ps/83.3.295. [DOI] [PubMed] [Google Scholar]
- Abasht B, Pitel F, Lagarrigue S, Le Bihan-Duval E, Le Roy P, Demeure O, Vignoles F, Simon J, Cogburn L, Aggrey S, Vignal A, Douaire M. Fatness QTL on chicken chromosome 5 and interaction with sex. Genet Sel Evol. 2006;38(3):297–311. doi: 10.1186/1297-9686-38-3-297. [DOI] [PMC free article] [PubMed] [Google Scholar]
- Ankra-Badu GA, Shriner D, Le Bihan-Duval E, Mignon-Grasteau S, Pitel F, Beaumont C, Duclos MJ, Simon J, Porter TE, Vignal A, Cogburn LA, Allison DB, Yi N, Aggrey SE. Mapping main, epistatic and sex-specific QTL for body composition in a chicken population divergently selected for low or high growth rate. BMC Genomics. 2010;11:107. doi: 10.1186/1471-2164-11-107. [DOI] [PMC free article] [PubMed] [Google Scholar]
- Atzmon G, Blum S, Feldman M, Cahaner A, Lavi U, Hillel J. QTLs detected in a multigenerational resource chicken population. J Hered. 2008;99(5):528–538. doi: 10.1093/jhered/esn030. [DOI] [PubMed] [Google Scholar]
- Zhou H, Deeb N, Evock-Clover CM, Ashwell CM, Lamont SJ. Genome-wide linkage analysis to identify chromosomal regions affecting phenotypic traits in the chicken. II. Body composition. Poult Sci. 2006;85(10):1712–1721. doi: 10.1093/ps/85.10.1712. [DOI] [PubMed] [Google Scholar]
- Nones K, Ledur MC, Ruy DC, Baron EE, Melo CM, Moura AS, Zanella EL, Burt DW, Coutinho LL. Mapping QTLs on chicken chromosome 1 for performance and carcass traits in a broiler x layer cross. Anim Genet. 2006;37(2):95–100. doi: 10.1111/j.1365-2052.2005.01387.x. [DOI] [PubMed] [Google Scholar]
- Uemoto Y, Sato S, Odawara S, Nokata H, Oyamada Y, Taguchi Y, Yanai S, Sasaki O, Takahashi H, Nirasawa K, Kobayashi E. Genetic mapping of quantitative trait loci affecting growth and carcass traits in F2 intercross chickens. Poult Sci. 2009;88(3):477–482. doi: 10.3382/ps.2008-00296. [DOI] [PubMed] [Google Scholar]
- Le Mignon G, Pitel F, Gilbert H, Le Bihan-Duval E, Vignoles F, Demeure O, Lagarrigue S, Simon J, Cogburn LA, Aggrey SE, Douaire M, Le Roy P. A comprehensive analysis of QTL for abdominal fat and breast muscle weights on chicken chromosome 5 using a multivariate approach. Anim Genet. 2009;40(2):157–164. doi: 10.1111/j.1365-2052.2008.01817.x. [DOI] [PubMed] [Google Scholar]
- Li H, Deeb N, Zhou H, Mitchell AD, Ashwell CM, Lamont SJ. Chicken quantitative trait loci for growth and body composition associated with transforming growth factor-beta genes. Poult Sci. 2003;82(3):347–356. doi: 10.1093/ps/82.3.347. [DOI] [PubMed] [Google Scholar]
- Hu G, Wang SZ, Wang ZP, Li YM, Li H. Genetic epistasis analysis of 10 peroxisome proliferator-activated receptor γ-correlated genes in broiler lines divergently selected for abdominal fat content. Poult Sci. 2010;89(11):2341–2350. doi: 10.3382/ps.2010-00857. [DOI] [PubMed] [Google Scholar]
- Fajas L, Egler V, Reiter R, Hansen J, Kristiansen K, Debril MB, Miard S, Auwerx J. The retinoblastoma-histone deacetylase 3 complex inhibits PPARgamma and adipocyte differentiation. Dev Cell. 2002;3(6):903–910. doi: 10.1016/s1534-5807(02)00360-x. [DOI] [PubMed] [Google Scholar]
- Cole KA, Harmon AW, Harp JB, Patel YM. Rb regulates C/EBPbeta-DNA-binding activity during 3T3-L1 adipogenesis. Am J Physiol Cell Physiol. 2004;286(2):C349–C354. doi: 10.1152/ajpcell.00255.2003. [DOI] [PubMed] [Google Scholar]
- Sheffield VC. Use of isolated populations in the study of a human obesity syndrome, the Bardet-Biedl syndrome. Pediatr Res. 2004;55(6):908–911. doi: 10.1203/01.pdr.0000127013.14444.9c. [DOI] [PubMed] [Google Scholar]
- Need AC, Ahmadi KR, Spector TD, Goldstein DB. Obesity is associated with genetic variants that alter dopamine availability. Ann Hum Genet. 2006;70(Pt 3):293–303. doi: 10.1111/j.1529-8817.2005.00228.x. [DOI] [PubMed] [Google Scholar]
- Guilherme A, Soriano NA, Furcinitti PS, Czech MP. Role of EHD1 and EHBP1 in perinuclear sorting and insulin-regulated GLUT4 recycling in 3T3-L1 adipocytes. J Biol Chem. 2004;279(38):40062–40075. doi: 10.1074/jbc.M401918200. [DOI] [PubMed] [Google Scholar]
- May P, Woldt E, Matz RL, Boucher P. The LDL receptor-related protein (LRP) family: an old family of proteins with new physiological functions. Ann Med. 2007;39(3):219–228. doi: 10.1080/07853890701214881. [DOI] [PubMed] [Google Scholar]
- Gibson F, Walsh J, Mburu P, Varela A, Brown KA, Antonio M, Beisel KW, Steel KP, Brown SD. A type VII myosin encoded by the mouse deafness gene shaker-1. Nature. 1995;374(6517):62–64. doi: 10.1038/374062a0. [DOI] [PubMed] [Google Scholar]
- Gorman SW, Haider NB, Grieshammer U, Swiderski RE, Kim E, Welch JW, Searby C, Leng S, Carmi R, Sheffield VC, Duhl DM. The cloning and developmental expression of unconventional myosin IXA (MYO9A) a gene in the Bardet-Biedl syndrome (BBS4) region at chromosome 15q22-q23. Genomics. 1999;59(2):150–160. doi: 10.1006/geno.1999.5867. [DOI] [PubMed] [Google Scholar]
- Lee YH, Tokraks S, Pratley RE, Bogardus C, Permana PA. Identification of differentially expressed genes in skeletal muscle of non-diabetic insulin-resistant and insulin-sensitive Pima Indians by differential display PCR. Diabetologia. 2003;46(11):1567–1575. doi: 10.1007/s00125-003-1226-1. [DOI] [PubMed] [Google Scholar]