

Abstract
The structure of the 30-nm chromatin fiber has provided, over the years, an important reference in chromatin studies. Originally derived from electron microscopic studies of soluble chromatin fibers released by restriction digestion, the gross structural features of such fragments have been supported by biophysical methods such as low angle X-ray and neutron scattering, sedimentation, light scattering and electric dichroism. Electron microscopy and sedimentation velocity measurements demonstrated that reconstituted chromatin fibers, prepared from repeating arrays of high affinity nucleosome positioning sequences, retain the same overall features as observed for native chromatin fibers. It had been suggested that the 30 nm fiber might be the form assumed in vivo by transcriptionally silent chromatin, but individual gene or genome-wide studies of chromatin released from nuclei do not reveal any such simple correlation. Furthermore, even though the 30 nm fiber has been thought to represent an intermediate in the hierarchical folding of DNA into chromosomes, most analyses of chromatin folding within the nucleus do not detect any regular extended compact structures. However there are important exceptions in chicken erythroid cell nuclei as well as in transcribed regions that form extended loops. Localized domains within the nucleus, either at the surface of chromosome domains or constrained as a specialized kind of constitutive heterochromatin by specific DNA binding proteins, may adopt 30 nm fiber-like structures.
Introduction
Since the discovery of the nucleosome as the fundamental structural subunit of eukaryotic chromatin, the question has remained of how those subunits are organized to provide the compaction required to fit within the nucleus. The earliest studies depended strongly on the kinds of polymer physical chemistry techniques that had been used to measure the solution properties of DNA, including its persistence length 1. At the same time structural methods, such as electron microscopy (EM), and neutron and low angle X-ray scattering measurements, revealed that in isolated chromatin the 10 nm polynucleosome string formed a solenoidal structure, the 30 nm chromatin fiber, which was proposed to represent the next level of organization and compaction. Although it had been assumed that this structure, well documented in vitro, also existed in vivo, recent studies have cast doubt on that assumption 2,3. Here we review the physicochemical and structural studies of isolated chromatin, some carried out on bulk material released from the nucleus, others on defined genomic regions. We compare these results with data obtained from EM and light microscopy studies of intact cells or nuclei, which give on the whole a quite different view of nucleosome packing.
In vitro biophysical studies
The detailed structure of the chromatin 30 nm fiber has been the subject of intense study since its original description by Klug and coworkers 4,5. Based on EM observations of soluble chromatin fragments, they proposed that the 30 nm fiber observed at high ionic strengths consists of a left-handed one-start helix with six nucleosomes per turn and a pitch of 11 nm (Figure 1). They further demonstrated that at low ionic strengths the chromatin adopts a less compact beads-on-a-string conformation referred to as the 10 nm fiber. This reversible, ionic strength dependent transition between the 10 and 30 nm fibers was studied by sedimentation velocity, providing the basis for the subsequent characterization of soluble chromatin fragments from various sources. Hydrodynamic studies on fractionated chromatin samples obtained from rat liver 6 or chicken erythrocyte nuclei 7 reported the weight-average sedimentation coefficient as a function of the chromatin size and confirmed the reversible, ionic strength dependent compaction of the 10 nm to the 30 nm fiber. We highlight, in particular, two seminal contributions from Eisenberg and coworkers, in which hydrodynamics, light scattering and low angle X-ray scattering were combined to demonstrate that the 30 nm chromatin fiber has physical properties similar to those predicted for the one-start solenoid 7,8. It became clear from sedimentation studies that the unit of the higher order structure contains a minimum of six nucleosomes 6 and that the overall hydrodynamic properties did not depend on the nucleosomal repeat length 9,10. These observations, supporting a common folding mechanism that does not depend on the linker length, were corroborated by electric dichroism which supports a structure containing six nucleosomes per turn with a pitch of 11 nm independent of the linker length 11. Much like the one-start helical model, these studies further demonstrate that the nucleosomes are radially arranged and inclined at an angle of 20° – 33° to the solenoid axis 11,12. Small angle neutron scattering on chicken erythrocyte chromatin confirmed the presence of six nucleosomes per turn 13,14 organized in manner such that the linker histone H1 is located within the interior of the fiber 15 as originally proposed by Klug and coworkers 5. Based primarily on EM observations of the 10 nm and partially unraveled 30-nm chromatin fibers, two alternate models for the 30 nm fiber have been proposed involving a two-start helical array of nucleosomes having different linker orientations. The twisted ribbon model, based on a zig-zag orientation of the chromatosomes (composed of two full superhelical turns of DNA around the histone octamer core, and a histone H1 variant bound at the exit) at low ionic strength, has the linker DNA oriented at various angles along the fiber axis (Figure 1) 16,17. In the alternate cross-linked model the linker DNA is oriented perpendicular to the fiber axis and crosses the center of the fiber 18,19.
Figure 1. The 30-nm chromatin fiber.
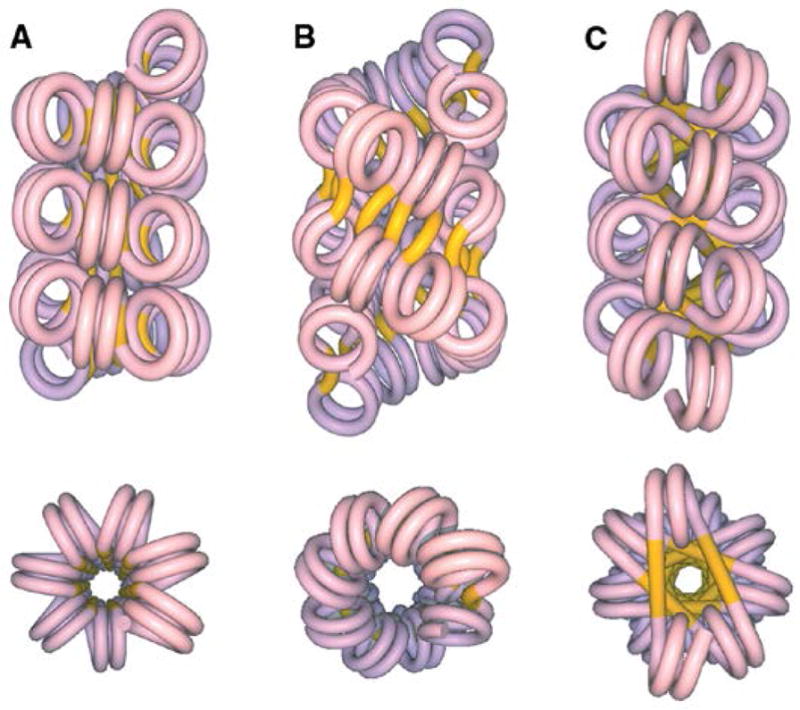
(A) The one-start helical model proposed by Klug and coworkers; the linker DNA shown in yellow is bent in a continuously supercoiled fashion between nucleosomes 4,5,11. (B) The two-start twisted ribbon model with a linker DNA approximately parallel to the fiber axis 16,17 (C) The two-start cross-linked model in which the linker DNA is perpendicular to the fiber axis and occupies the center of the fiber originally proposed by Williams et al.18 and Smith et al19.. Figure reproduced from Dorigo et al.31 with permission (need to get) of the American Association for the Advancement of Science.
To circumvent the variations in DNA sequence, linker DNA length and chromatin polydispersity, Hansen and coworkers prepared oligonucleosomes of defined size 20. Using the naturally occurring nucleosome positioning sequence derived from the Lytechinus variegatus 5S rRNA gene 21,22, they reconstituted a dodecameric linear array of 208 bp repeats using purified histone octamers from chicken erythrocytes and showed that it undergoes the same reversible ionic strength dependent compaction as observed for native chromatin stripped of H1 4,23. They further established that the histone tails, particularly those of histones H3 and H4, are important for chromatin fiber compaction 24,25. The design of a higher affinity 601 nucleosome positioning sequence 26 and the availability of recombinant histones 27, now allowing for the incorporation of specific histone tail modifications or point mutations, subsequently led to the in vitro preparation of maximally saturated nucleosome arrays devoid of any post-translational modifications 28. Dorigo et al. 28 thus showed that residues 14–19 of the N-terminal histone H4 tail are required for the formation of fully compacted chromatin fibers. Using a combination of sedimentation velocity and EM, Robinson and coworkers 29 further demonstrated that acetylation of lysine 16 on the N-terminal tail of histone H4 inhibits chromatin compaction to a greater extent than simple removal of the tail, irrespective of whether linker histone H5 is incorporated into the array 30. By incorporating H4/H2A cross-links through the H4-V21C and H2A-64C point mutations, Dorigo and coworkers 31 also demonstrated that reconstituted arrays having various linker lengths adopt a two-start helical structure. The recent crystal structure of a tetranucleosome having a repeat of 167 bp and no linker histone substantiates a two-start cross-linked structure as it reveals two stacks of nucleosomes connected by a straight linker 32. Interestingly, single molecule force spectroscopy on long arrays having a repeat of 167 bp also agree with a two-start helical fold, though similar studies on 197 bp repeat arrays favor a one-start helix 33. Much like the studies carried out on native chromatin fragments, the use of reconstituted arrays has not quite resolved the issue of the structure of the 30 nm chromatin fiber. The observed structure adopted in vitro may reflect among other, the history of the preparation and heterogeneity of linker length and nucleosome occupancy. Furthermore, as noted by Grigoryev and coworkers 34 it is possible that long arrays are able to incorporate structural features of both the one-start and two-start models within a single fiber.
Physical Chemistry of Defined Genomic Regions
With the advent of hybridization, and later the polymerase chain reaction (PCR), methods for detecting genomic sequences it became possible to study the hydrodynamic properties of specific domains liberated from nuclei by nuclease digestion. Chicken erythrocyte nuclei were an early favorite source of chromatin because they contain only low levels of proteases and nucleases. The earliest investigations analyzed the sedimentation properties in sucrose gradients of restriction fragments containing chicken adult β-globin chromatin, expressed in these cells 35. These fragments sedimented more slowly than bulk chromatin of the same size, whereas chromatin containing silent genes such as ovalbumin sedimented with bulk chromatin. This was interpreted in terms of the 30 nm solenoidal model as reflecting a selective unfolding of active genes. As with bulk chromatin, the differential folding was ionic strength dependent 36. A more detailed sedimentation study 35 of the same locus made use of complementary CsCl buoyant density measurements which showed that the protein content of the β-globin chromatin was not significantly different from that of bulk; the difference in sedimentation properties could therefore be ascribed to differences in shape. An important experiment in this paper showed that digestion that removed two nuclease hypersensitive sites within the β-globin fragment eliminated its unique sedimentation properties. Hydrodynamic calculations in the Appendix to that paper 37 showed that these properties could be accounted for by models in which the solenoidal structure was interrupted by an interior flexible joint. This suggested that whether a gene was active or inactive and packaged in ‘facultative heterochromatin’, it still maintained the 30 nm solenoidal structure over most of its locus.
This approach was extended in a variety of ways to examine the relationship between structure and transcriptional activity. Gilbert and Allan 38 used sedimentation and buoyant density measurements to show that chromatin derived from centromeres of mouse cell lines was more compact than bulk chromatin. Our laboratory 39,40 focused on the 15.5 kb long repeat DNA sequence at the 5′ end of the chicken β-globin locus (in 6C2 cells, an avian erythroid cell line), marked by histone modifications and high levels of DNA methylation that are characteristic of ‘constitutive’ heterochromatin 41,42,43. Multiple HpaII sites within the region were resistant to digestion by that enzyme because they were methylated, but those immediately outside were not methylated and could be cut, releasing an intact 16 kb fragment for which both the sedimentation coefficient and buoyant density could be measured precisely. The frictional coefficient derived from these data was consistent with predictions from hydrodynamic theory for a cylindrical 30 nm solenoid like that proposed by Finch and Klug 4.
These methods were expanded to the whole genome. Gilbert et al. 44 extended earlier results to determine the gene profiles of ‘open’ as compared to ‘compact’ chromatin. As before, chromatin was sedimented on a sucrose gradient, but now DNA from individual fractions was further fractionated according to size on an electrophoretic gel. Within a given gradient fraction, the larger the DNA size, the less compact (with a larger frictional coefficient) its chromatin structure must have been. The individual DNA fractions were characterized: open chromatin fibers were derived from regions rich in genes, though this was not correlated with their transcriptional activity. The presumed 30 nm structure was thus not an indicator of transcriptional status.
A refinement of this approach provided even more persuasive evidence for a lack of connection between the 30 nm fiber and levels of gene expression. Naughton et al. 45 used sedimentation analysis and haplotype-specific probes to map the distribution of ‘open’ and ‘compact’ chromatin on the active and inactive human X chromosomes, Xa and Xi. They found that the bulk distribution of compact 30 nm fiber was similar, despite the large difference between the two in the number of transcriptionally active genes. Given the evident overall difference in appearance between Xa and Xi by light microscopy, it seemed that compaction at some higher level of organization must be associated with the inactive X. RNA/DNA FISH experiments using probes to sites 2 Mb apart showed a 1.5-fold difference in separation between sites on Xa when compared to Xi.
Other experiments in this paper further addressed the question of the genomic contents (derived from all chromosomes) of the ‘open’ chromatin fraction. It was found that this fraction was enriched for regions with high gene density, and was particularly associated with transcription start sites. Applying the same modeling approach used earlier 37 led to the conclusion that ‘bulk chromatin has one disruption every 11 nucleosomes’, while the presence of a promoter introduced a defect of increasing size related to the level of promoter activity. Perhaps the most important conclusion of these studies is that the chromatin structural changes that are relevant for gene expression occur at a level of organization above the 30 nm fiber.
Further insight into this problem comes from more recent studies of the 15.5 kb condensed chromatin fragment from the chicken β-globin locus, described above. We compared the hydrodynamic properties of this compact constitutive heterochromatin fiber with those of a fragment of nearly the same size (16.17 kb) containing the adjacent β-globin gene cluster 39. The two fragments had quite similar hydrodynamic properties, leading to the conclusion that they had very similar degrees of compaction. This is consistent with the results from other laboratories described above, which suggest that whatever the distinction between released fragments of inactive and active chromatin, it is not associated with an unfolding of the 30 nm fiber.
Chromatin structure within the nucleus
All of the results described in the preceding section involved measurements of chromatin fragments released from nuclei by nuclease digestion. There is now reasonable agreement about the structures observed under those conditions, and their relationship to transcriptional activity. An entirely different set of conclusions comes from more recent studies of chromatin organization in vivo that take advantage of new imaging methods in electron and light microscopy. These all support an organization in which 30 nm fibers are not detected; rather, the 10 nm ‘string of beads’ is compacted in a highly disordered, irregularly folded structure.
Several lines of evidence support this conclusion, much of it based on measurements by cryo-electron microscopy (cryo-EM), which is thought to be the least disruptive method of sample preparation. The earliest of these studies 46 applied the then novel method to examine mitotic chromosomes in HeLa and Chinese hamster ovary cells, and found evidence only for the presence of 11 nm filaments. Recent cryo-EM investigations 47 used image processing methods to analyze at higher resolution images of human mitotic chromosomes. Quantitative analysis revealed no spacing corresponding to the presence of a 30 nm fiber, nor could such fibers be detected when isolated mitotic chromosomes were placed in a medium in which they swelled. Recently the same system has been addressed by a combination of cryo-EM and synchrotron X-ray scattering measurements 48. The new analysis strongly supports the earlier conclusions, and additionally explains the origin of the ~30 nm peak in the scattering pattern from nuclei, which had been tentatively ascribed to the packing of 30 nm fibers present in the nucleus 49, and is now shown to arise from aggregates of regularly spaced ribosomes. The signal disappears when ribosomes are removed.
Other evidence consistent with this result comes from studies of induced pluripotent stem cells that used a different technique, correlative electron spectroscopic imaging, which allows the determination of phosphorus density within the image in fixed cells 50. In ES and full IPS cells heterochromatin identified by enrichment in the trimethyl mark on lysine 9 of histone H3 (H3K9me3) is composed solely of 10 nm fibers. Such fibers were also observed in the densely packed chromocenters in partial IPS cells and mouse embryo fibroblasts, though it was not possible to exclude the presence of some 30 nm structures.
High resolution light microscopy has also been brought to bear on this problem 51. Photoactivated localization microscopy (PALM) was applied to the study of Drosophila metaphase chromosomes labeled with a fluorophore-labeled histone variant, H2AvD, homologous to H2A.Z. Image analysis revealed filaments with a diameter of ~70nm. Although the authors think that these might contain 30 nm filaments, they do not believe that present resolution of the technique can address this question. It should be pointed out also that in these experiments, as well as those using correlative electron spectroscopic imaging 50, fixed samples were used.
These results provide strong evidence that if the 30 nm fiber is present in nuclei or mitotic chromosomes, it is not the predominant structure. However there are experiments suggesting that the 30 nm fiber is not merely the form assumed by chromatin that has been released from the nucleus, at least not in all cell types. In early cryo-EM studies, Woodcock 52 was able to detect fibers with diameters in the ~30 nm range in starfish sperm and chicken erythrocyte nuclei, although he pointed out that these seemed to be the exception. Strong confirmation of the erythrocyte results is contained in a recent cryo-EM study of chicken erythrocyte nuclei 53, in which 30 nm fibers are clearly visible. Resolution is sufficient to allow determination of the helical parameters of the predominant structure, found to have a pitch of 11 nm containing 6.5 nucleosomes per turn and to be organized as a two-start left-handed helix, quite consistent both with the structural and hydrodynamic studies described above, and with the more recent results from crystallographic studies of oligonucleosome structures 32.
Another early result 54 is of particular importance in trying to understand the possible relevance of 30 nm fibers to biological function. The Balbiani ring genes in the salivary glands of Chironomus tentans are easily visualized and, when transcribed, form a thin, 5 nm diameter chromosome fiber. In these experiments it was found that when transcription was inhibited and RNA polymerase was not bound to the loop it condensed into a fiber 25 nm in diameter. This suggests that 30 nm fibers may form in situations where nucleosomes are not tightly packed. More recent cryo-EM studies similarly show that in mouse rod photoreceptor cells, the peripheral heterochromatin consists of packed 30 nm fibers 55.
Chromatin packing and biological function
Although the evidence for the presence within the nucleus of a canonical 30 nm fiber may be limited to particular cell types or local conditions, it is clear that important differences in chromatin structure distinguish domains near expressed genes, typically marked by characteristic covalent modifications of the associated histones. We have recently explored further the 16 kb condensed chromatin fragment upstream of the chicken β-globin locus 56. As described above, the intact fragment can be released from the nuclei of avian 6C2 cells by treatment with the restriction enzyme HpaII. We further asked whether treatment with the enzyme MspI would release much smaller fragments, given that it cuts at the same CCGG sequence but is not inhibited by methylation of the DNA. We found that the region was remarkably resistant to MspI digestion 40,56. About a third of the released fragments were uncut, and much of the rest were of fairly large size (Figure 2A). This reflects the presence of a compact structure that blocks access of MspI to most of its potential sites. The 16 kb region is marked by low levels of histone acetylation, as expected for a repeat sequence domain packaged as constitutive heterochromatin. However, treatment with trichostatin A (TSA), an inhibitor of histone deacetylases, resulted in increase in histone acetylation over the region (Figure 2B), and this was accompanied by a significant increase in susceptibility of the region to MspI digestion (Figure 2A). This suggests that the increase in histone acetylation was accompanied by opening of the compact structure.
Figure 2. Effects of histone modifications on compactness of a constitutive heterochromatin structure.
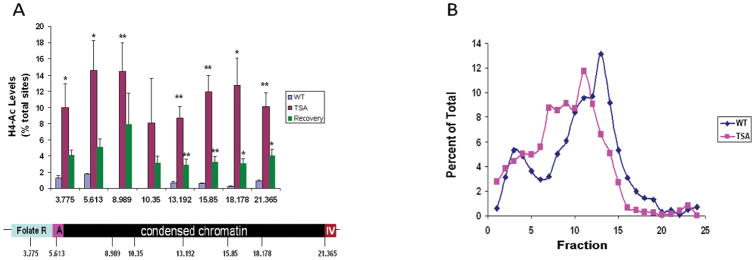
(A) ChIP assay depicting the percentage of nucleosomes containing the H4Ac modification in both untreated cells (blue), cells treated with TSA (1 μM for 4 h; red) and cells that were given 5 days to recovery after removal of the TSA (green). Data show the mean ± s.e.m of three (untreated and recovery) or six (TSA) independent ChIP experiments. *P < 0.05, **P < 0.01. (B) Nuclei from 6C2 cells either untreated or treated with TSA (for 16 h) were digested with MspI, floated out of the nuclei, sedimented on a sucrose gradient and analysed by quantative PCR (copied from Giles et al.56).
We suggest that this might be most simply interpreted as a reflection of the partial disruption of a compact 30 nm fiber. Although the 6C2 cells are arrested at an earlier developmental stage than mature erythrocytes, they are likely to share characteristics of the circulating red blood cells. In particular avian erythrocyte chromatin contains the linker histone H5, a special variant of histone H1. This may explain the cryo-EM results described above, in which it was found that chicken erythrocyte nuclei are filled with 30 nm fibers. Furthermore, the 16 kb domain can be unambiguously categorized as constitutive heterochromatin. It is likely never activated under non-replicative conditions, and may form an ‘atypical’ structure.
Could such a structure also exist in constitutive heterochromatic domains in other kinds of cells? If so, it would have to be present in small enough amounts to escape detection by the methods described above. A second possibility is that, analogously to Balbiani ring genes, 30 nm fibers form in circumstances where transcribed regions and their surrounding chromatin are located on the surface of chromosome territories, and no longer subject to the packing constraints that appear to stabilize the condensed 10 nm fibril structure 57. Methods to detect such structures without perturbing nuclear organization must be developed. It has been pointed out, however, that every method used so far has the potential of perturbing nuclear structure 2.
Higher levels of chromatin organization
The EM studies of intact nuclei or mitotic chromosomes all lead to models in which (with the exceptions mentioned above) there is no obvious long range order and no regular structure larger than the 11 nm fibril. The earliest of these studies 46 concluded that ‘No superstructure or periodic order is discernible. These observations suggest that the chromosome is formed by the compact association of 11 nm filaments, or portions thereof, interacting in a manner akin to the molecules of a liquid.’ This polymer melt model is now supported by all the subsequent studies. Such randomly folded condensed structures have long been observed and analyzed for other simpler polymers. They form because in the simplest cases under crowded conditions a polymer element has the same interactions with nearby elements on its own chain as it does with elements on another chain or a distant part of the same chain. Self and non-self become indistinguishable. Biopolymers could be somewhat different if there are local structures, interactions and constraints that make it energetically more favorable for example to form a superhelical turn of fundamental repeat units than to open and interact with units on a different chain. Of course the element that forms the polymer melt could then be somewhat larger than the fundamental repeat unit.
The studies of the released 30 nm fiber described above all indicate that at least after release there is no dramatic unraveling of the fiber structure associated with transcriptional activation. However the hydrodynamic data are consistent with the presence of ‘defects’, probably due to nucleosome-free DNase hypersensitive sites, that would lead to a less extended structure and reduced persistence length. Whatever the details of nucleosome packing in vivo and in vitro, it is clear that organization at higher levels does reflect transcriptional status (see, for example 2,58,59,60). In any case there is abundant evidence for a detailed, large scale chromatin architecture within the nucleus. This comes from the various chromosome conformation capture methods that detect long-range interactions 61. These and other studies reveal the presence of specific and reproducible contacts between DNA sequence elements often located many megabases from each other. They may be stabilized through sharing of a common transcription factory 62 or by interactions between proteins bound at the individual sites 63. Whatever the details of the locally compacted chromatin structure at the level of the polynucleosome string, the packing cannot be random at the scale at which biological control is exerted. It seems likely that the most significant levels of organization remain to be explored, raising questions not only about the details of that organization, but also about the mechanisms required to achieve it.
Acknowledgments
This paper is dedicated to Heini Eisenberg, who was a friend, collaborator and colleague for 22 years to one of us (R.G.) and for over 50 years to the other (G.F.). We shared many happy moments in the lab and outside it. This work was supported by the Intramural Research Program of the National Institute of Diabetes and Digestive and Kidney Diseases, NIH.
References
- 1.Godfrey JE, Eisenberg H. Biophysical chemistry. 1976;5:301–318. doi: 10.1016/0301-4622(76)80042-7. [DOI] [PubMed] [Google Scholar]
- 2.Bian Q, Belmont AS. Current opinion in cell biology. 2012;24:359–366. doi: 10.1016/j.ceb.2012.03.003. [DOI] [PMC free article] [PubMed] [Google Scholar]
- 3.Grigoryev SA, Woodcock CL. Experimental cell research. 2012;318:1448–1455. doi: 10.1016/j.yexcr.2012.02.014. [DOI] [PubMed] [Google Scholar]
- 4.Finch JT, Klug A. Proceedings of the National Academy of Sciences of the United States of America. 1976;73:1897–1901. doi: 10.1073/pnas.73.6.1897. [DOI] [PMC free article] [PubMed] [Google Scholar]
- 5.Thoma F, Koller T, Klug A. The Journal of cell biology. 1979;83:403–427. doi: 10.1083/jcb.83.2.403. [DOI] [PMC free article] [PubMed] [Google Scholar]
- 6.Thomas JO, Butler PJ. Journal of molecular biology. 1980;144:89–93. doi: 10.1016/0022-2836(80)90215-6. [DOI] [PubMed] [Google Scholar]
- 7.Ausio J, Borochov N, Seger D, Eisenberg H. Journal of molecular biology. 1984;177:373–398. doi: 10.1016/0022-2836(84)90291-2. [DOI] [PubMed] [Google Scholar]
- 8.Greulich KO, Wachtel E, Ausio J, Seger D, Eisenberg H. Journal of molecular biology. 1987;193:709–721. doi: 10.1016/0022-2836(87)90353-6. [DOI] [PubMed] [Google Scholar]
- 9.Pearson EC, Butler PJ, Thomas JO. The EMBO journal. 1983;2:1367–1372. doi: 10.1002/j.1460-2075.1983.tb01593.x. [DOI] [PMC free article] [PubMed] [Google Scholar]
- 10.Thomas JO, Rees C, Butler PJ. European journal of biochemistry / FEBS. 1986;154:343–348. doi: 10.1111/j.1432-1033.1986.tb09403.x. [DOI] [PubMed] [Google Scholar]
- 11.McGhee JD, Nickol JM, Felsenfeld G, Rau DC. Cell. 1983;33:831–841. doi: 10.1016/0092-8674(83)90025-9. [DOI] [PubMed] [Google Scholar]
- 12.McGhee JD, Rau DC, Charney E, Felsenfeld G. Cell. 1980;22:87–96. doi: 10.1016/0092-8674(80)90157-9. [DOI] [PubMed] [Google Scholar]
- 13.Gerchman SE, Ramakrishnan V. Proceedings of the National Academy of Sciences of the United States of America. 1987;84:7802–7806. doi: 10.1073/pnas.84.22.7802. [DOI] [PMC free article] [PubMed] [Google Scholar]
- 14.Graziano V, Gerchman SE, Ramakrishnan V. Journal of molecular biology. 1988;203:997–1007. doi: 10.1016/0022-2836(88)90124-6. [DOI] [PubMed] [Google Scholar]
- 15.Graziano V, Gerchman SE, Schneider DK, Ramakrishnan V. Nature. 1994;368:351–354. doi: 10.1038/368351a0. [DOI] [PubMed] [Google Scholar]
- 16.Worcel A, Strogatz S, Riley D. Proceedings of the National Academy of Sciences of the United States of America. 1981;78:1461–1465. doi: 10.1073/pnas.78.3.1461. [DOI] [PMC free article] [PubMed] [Google Scholar]
- 17.Woodcock CL, Frado LL, Rattner JB. The Journal of cell biology. 1984;99:42–52. doi: 10.1083/jcb.99.1.42. [DOI] [PMC free article] [PubMed] [Google Scholar]
- 18.Williams SP, Athey BD, Muglia LJ, Schappe RS, Gough AH, Langmore JP. Biophysical journal. 1986;49:233–248. doi: 10.1016/S0006-3495(86)83637-2. [DOI] [PMC free article] [PubMed] [Google Scholar]
- 19.Smith MF, Athey BD, Williams SP, Langmore JP. The Journal of cell biology. 1990;110:245–254. doi: 10.1083/jcb.110.2.245. [DOI] [PMC free article] [PubMed] [Google Scholar]
- 20.Hansen JC, Ausio J, Stanik VH, van Holde KE. Biochemistry. 1989;28:9129–9136. doi: 10.1021/bi00449a026. [DOI] [PubMed] [Google Scholar]
- 21.Simpson RT, Stafford DW. Proceedings of the National Academy of Sciences of the United States of America. 1983;80:51–55. doi: 10.1073/pnas.80.1.51. [DOI] [PMC free article] [PubMed] [Google Scholar]
- 22.Simpson RT, Thoma F, Brubaker JM. Cell. 1985;42:799–808. doi: 10.1016/0092-8674(85)90276-4. [DOI] [PubMed] [Google Scholar]
- 23.Butler PJ, Thomas JO. Journal of molecular biology. 1980;140:505–529. doi: 10.1016/0022-2836(80)90268-5. [DOI] [PubMed] [Google Scholar]
- 24.Fletcher TM, Hansen JC. The Journal of biological chemistry. 1995;270:25359–25362. doi: 10.1074/jbc.270.43.25359. [DOI] [PubMed] [Google Scholar]
- 25.Tse C, Hansen JC. Biochemistry. 1997;36:11381–11388. doi: 10.1021/bi970801n. [DOI] [PubMed] [Google Scholar]
- 26.Thastrom A, Lowary PT, Widlund HR, Cao H, Kubista M, Widom J. Journal of molecular biology. 1999;288:213–229. doi: 10.1006/jmbi.1999.2686. [DOI] [PubMed] [Google Scholar]
- 27.Luger K, Mader AW, Richmond RK, Sargent DF, Richmond TJ. Nature. 1997;389:251–260. doi: 10.1038/38444. [DOI] [PubMed] [Google Scholar]
- 28.Dorigo B, Schalch T, Bystricky K, Richmond TJ. Journal of molecular biology. 2003;327:85–96. doi: 10.1016/s0022-2836(03)00025-1. [DOI] [PubMed] [Google Scholar]
- 29.Robinson PJ, An W, Routh A, Martino F, Chapman L, Roeder RG, Rhodes D. Journal of molecular biology. 2008;381:816–825. doi: 10.1016/j.jmb.2008.04.050. [DOI] [PMC free article] [PubMed] [Google Scholar]
- 30.Huynh VA, Robinson PJ, Rhodes D. Journal of molecular biology. 2005;345:957–968. doi: 10.1016/j.jmb.2004.10.075. [DOI] [PubMed] [Google Scholar]
- 31.Dorigo B, Schalch T, Kulangara A, Duda S, Schroeder RR, Richmond TJ. Science. 2004;306:1571–1573. doi: 10.1126/science.1103124. [DOI] [PubMed] [Google Scholar]
- 32.Schalch T, Duda S, Sargent DF, Richmond TJ. Nature. 2005;436:138–141. doi: 10.1038/nature03686. [DOI] [PubMed] [Google Scholar]
- 33.Kruithof M, Chien FT, Routh A, Logie C, Rhodes D, van Noort J. Nature structural & molecular biology. 2009;16:534–540. doi: 10.1038/nsmb.1590. [DOI] [PubMed] [Google Scholar]
- 34.Grigoryev SA, Arya G, Correll S, Woodcock CL, Schlick T. Proceedings of the National Academy of Sciences of the United States of America. 2009;106:13317–13322. doi: 10.1073/pnas.0903280106. [DOI] [PMC free article] [PubMed] [Google Scholar]
- 35.Caplan A, Kimura T, Gould H, Allan J. Journal of molecular biology. 1987;193:57–70. doi: 10.1016/0022-2836(87)90626-7. [DOI] [PubMed] [Google Scholar]
- 36.Fisher EA, Felsenfeld G. Biochemistry. 1986;25:8010–8016. doi: 10.1021/bi00372a033. [DOI] [PubMed] [Google Scholar]
- 37.Wachtel EJ. Journal of molecular biology. 1987;193:69–70. doi: 10.1016/0022-2836(87)90627-9. [DOI] [PubMed] [Google Scholar]
- 38.Gilbert N, Allan J. Proceedings of the National Academy of Sciences of the United States of America. 2001;98:11949–11954. doi: 10.1073/pnas.211322798. [DOI] [PMC free article] [PubMed] [Google Scholar]
- 39.Ghirlando R, Felsenfeld G. Journal of molecular biology. 2008;376:1417–1425. doi: 10.1016/j.jmb.2007.12.051. [DOI] [PMC free article] [PubMed] [Google Scholar]
- 40.Ghirlando R, Litt MD, Prioleau MN, Recillas-Targa F, Felsenfeld G. Journal of molecular biology. 2004;336:597–605. doi: 10.1016/j.jmb.2003.12.049. [DOI] [PubMed] [Google Scholar]
- 41.Litt MD, Simpson M, Gaszner M, Allis CD, Felsenfeld G. Science. 2001;293:2453–2455. doi: 10.1126/science.1064413. [DOI] [PubMed] [Google Scholar]
- 42.Litt MD, Simpson M, Recillas-Targa F, Prioleau MN, Felsenfeld G. The EMBO journal. 2001;20:2224–2235. doi: 10.1093/emboj/20.9.2224. [DOI] [PMC free article] [PubMed] [Google Scholar]
- 43.Prioleau MN, Nony P, Simpson M, Felsenfeld G. The EMBO journal. 1999;18:4035–4048. doi: 10.1093/emboj/18.14.4035. [DOI] [PMC free article] [PubMed] [Google Scholar]
- 44.Gilbert N, Boyle S, Fiegler H, Woodfine K, Carter NP, Bickmore WA. Cell. 2004;118:555–566. doi: 10.1016/j.cell.2004.08.011. [DOI] [PubMed] [Google Scholar]
- 45.Naughton C, Sproul D, Hamilton C, Gilbert N. Molecular cell. 2010;40:397–409. doi: 10.1016/j.molcel.2010.10.013. [DOI] [PMC free article] [PubMed] [Google Scholar]
- 46.McDowall AW, Smith JM, Dubochet J. The EMBO journal. 1986;5:1395–1402. doi: 10.1002/j.1460-2075.1986.tb04373.x. [DOI] [PMC free article] [PubMed] [Google Scholar]
- 47.Eltsov M, Maclellan KM, Maeshima K, Frangakis AS, Dubochet J. Proceedings of the National Academy of Sciences of the United States of America. 2008;105:19732–19737. doi: 10.1073/pnas.0810057105. [DOI] [PMC free article] [PubMed] [Google Scholar]
- 48.Nishino Y, Eltsov M, Joti Y, Ito K, Takata H, Takahashi Y, Hihara S, Frangakis AS, Imamoto N, Ishikawa T, Maeshima K. The EMBO journal. 2012;31:1644–1653. doi: 10.1038/emboj.2012.35. [DOI] [PMC free article] [PubMed] [Google Scholar]
- 49.Langmore JP, Paulson JR. The Journal of cell biology. 1983;96:1120–1131. doi: 10.1083/jcb.96.4.1120. [DOI] [PMC free article] [PubMed] [Google Scholar]
- 50.Fussner E, Djuric U, Strauss M, Hotta A, Perez-Iratxeta C, Lanner F, Dilworth FJ, Ellis J, Bazett-Jones DP. The EMBO journal. 2011;30:1778–1789. doi: 10.1038/emboj.2011.96. [DOI] [PMC free article] [PubMed] [Google Scholar]
- 51.Matsuda A, Shao L, Boulanger J, Kervrann C, Carlton PM, Kner P, Agard D, Sedat JW. PloS one. 2010;5:e12768. doi: 10.1371/journal.pone.0012768. [DOI] [PMC free article] [PubMed] [Google Scholar]
- 52.Woodcock CL. The Journal of cell biology. 1994;125:11–19. doi: 10.1083/jcb.125.1.11. [DOI] [PMC free article] [PubMed] [Google Scholar]
- 53.Scheffer MP, Eltsov M, Frangakis AS. Proceedings of the National Academy of Sciences of the United States of America. 2011;108:16992–16997. doi: 10.1073/pnas.1108268108. [DOI] [PMC free article] [PubMed] [Google Scholar]
- 54.Andersson K, Mahr R, Bjorkroth B, Daneholt B. Chromosoma. 1982;87:33–48. doi: 10.1007/BF00333508. [DOI] [PubMed] [Google Scholar]
- 55.Kizilyaprak C, Spehner D, Devys D, Schultz P. PloS one. 2010;5:e11039. doi: 10.1371/journal.pone.0011039. [DOI] [PMC free article] [PubMed] [Google Scholar]
- 56.Giles KE, Ghirlando R, Felsenfeld G. Nature cell biology. 2010;12:94–99. doi: 10.1038/ncb2010. sup pp 91–96. [DOI] [PMC free article] [PubMed] [Google Scholar]
- 57.Chambeyron S, Bickmore WA. Genes & development. 2004;18:1119–1130. doi: 10.1101/gad.292104. [DOI] [PMC free article] [PubMed] [Google Scholar]
- 58.Shopland LS, Lynch CR, Peterson KA, Thornton K, Kepper N, Hase J, Stein S, Vincent S, Molloy KR, Kreth G, Cremer C, Bult CJ, O’Brien TP. The Journal of cell biology. 2006;174:27–38. doi: 10.1083/jcb.200603083. [DOI] [PMC free article] [PubMed] [Google Scholar]
- 59.Belmont AS, Hu Y, Sinclair PB, Wu W, Bian Q, Kireev I. Cold Spring Harbor symposia on quantitative biology. 2010;75:453–460. doi: 10.1101/sqb.2010.75.050. [DOI] [PMC free article] [PubMed] [Google Scholar]
- 60.Lieberman-Aiden E, van Berkum NL, Williams L, Imakaev M, Ragoczy T, Telling A, Amit I, Lajoie BR, Sabo PJ, Dorschner MO, Sandstrom R, Bernstein B, Bender MA, Groudine M, Gnirke A, Stamatoyannopoulos J, Mirny LA, Lander ES, Dekker J. Science. 2009;326:289–293. doi: 10.1126/science.1181369. [DOI] [PMC free article] [PubMed] [Google Scholar]
- 61.Dekker J, Rippe K, Dekker M, Kleckner N. Science. 2002;295:1306–1311. doi: 10.1126/science.1067799. [DOI] [PubMed] [Google Scholar]
- 62.Eskiw CH, Cope NF, Clay I, Schoenfelder S, Nagano T, Fraser P. Cold Spring Harbor symposia on quantitative biology. 2010;75:501–506. doi: 10.1101/sqb.2010.75.046. [DOI] [PubMed] [Google Scholar]
- 63.Giles KE, Gowher H, Ghirlando R, Jin C, Felsenfeld G. Cold Spring Harbor symposia on quantitative biology. 2010;75:79–85. doi: 10.1101/sqb.2010.75.006. [DOI] [PMC free article] [PubMed] [Google Scholar]