

Abstract
The specification of the seven retinal cell types from a common pool of retina progenitor cells (RPCs) involves complex interactions between the intrinsic program and the environment. The proneural basic helix-loop-helix (bHLH) transcriptional regulators are key components for the intrinsic programming of RPCs and are essential for the formation of the diverse retinal cell types. However, the extent to which an RPC can re-adjust its inherent program and the mechanisms through which the expression of a particular bHLH factor influences RPC fate is unclear. Previously, we have shown that Neurod1 inserted into the Atoh7 locus activates the retinal ganglion cell (RGC) program in Atoh7-expressing RPCs but not in Neurod1-expressing RPCs, suggesting that Atoh7-expressing RPCs are not able to adopt the cell fate determined by Neurod1, but rather are pre-programmed to produce RGCs. Here, we show that Neurod1-expressing RPCs, which are destined to produce amacrine and photoreceptor cells, can be re-programmed into RGCs when Atoh7 is inserted into the Neurod1 locus. These results suggest that Atoh7 acts dominantly to convert a RPC subpopulation not destined for an RGC fate to adopt that fate. Thus, Atoh7-expressing and Neurod1-expressing RPCs are intrinsically different in their behavior. Additionally, ChIP-Seq analysis identified an Atoh7-dependent enhancer within the intronic region of Nrxn3. The enhancer recognized and used Atoh7 in the developing retina to regulate expression of Nrxn3, but could be forced to use Neurod1 when placed in a different regulatory context. The results indicate that Atoh7 and Neurod1 activate distinct sets of genes in vivo, despite their common DNA-binding element.
Keywords: Retinal ganglion cells, Retinal progenitor cells, bHLH genes, Atoh7/Math5, Neurod1, Mouse
INTRODUCTION
Over the course of development, vertebrate retina progenitor cells (RPCs) acquire distinct competency states for cell fate specification by continuously adjusting their intrinsic properties in response to a dynamically changing local environment (Livesey and Cepko, 2001; Agathocleous and Harris, 2009; Wallace, 2011). Through this intricate but vaguely understood process, the seven retinal cell types are produced in an overlapping spatiotemporal sequence between embryonic day 11 (E11) and postnatal day 21 (P21) (Rodieck, 1998; Wallace, 2011).
The proneural basic helix-loop-helix (bHLH) family of transcriptional factors has special significance in establishing the intrinsic properties of RPCs. Acting singly or in combination, proneural bHLH factors direct the commitment and formation of the diverse retinal cell types (Perron and Harris, 2000; Ohsawa and Kageyama, 2008). For example, Atoh7, the mouse ortholog of Drosophila Atonal, is first expressed around E11 in a subset of RPCs and is essential for establishing the competency state for retinal ganglion cell (RGC) fate (Brown et al., 1998; Yang et al., 2003; Brzezinski et al., 2012). RGC differentiation soon begins in a subpopulation of Atoh7-expressing RPCs. Genetic ablation of Atoh7 results in ~95% loss of RGC formation (Fig. 1A) (Brown et al., 2001; Wang et al., 2001). At the same time, other proneural bHLH factors, most notably Neurod1, Math3, Mash1 and Ptf1a, are detected in distinct subpopulations of RPCs and are required for establishing non-RGC cell fates (Vetter and Brown, 2001; Akagi et al., 2004; Hatakeyama and Kageyama, 2004; Le et al., 2006; Ohsawa and Kageyama, 2008; Trimarchi et al., 2008). Deletion of Neuord1 leads to the loss of the M-cone cell type (Fig. 1B) (Liu et al., 2008), and deletion of Ptf1a in a subpopulation of RPCs results in a loss of horizontal and amacrine cells (Fujitani et al., 2006). In addition, more complex cross-regulatory interactions between bHLH genes are often required for establishing the retinal cell types. Deletion of Neurod1 and Math3 together leads to an absence of amacrine cells (Inoue et al., 2002), and deletion of Math3 and Mash1 regulates the genesis of bipolar cells (Hatakeyama and Kageyama, 2004). Proneural bHLH genes are also involved in the specification of specific subtypes of retinal cells. Bhlhb5, a member of the oligo subfamily of bHLH factors, is required for the formation of type 2 off-cone bipolar cells and selective GABAergic amacrine cells (Feng et al., 2006). In postnatal retinas, Neurod2 is expressed in subsets of RPCs, Dab+ AII amacrine cells (AII ACs), RGCs and cone bipolar cells. Loss of Neurod2 leads to decreased formation of AII ACs (Cherry et al., 2011), yet misexpression of Neurod2 induces the production of amacrine cells and RGCs. Neurod6 is detected in nGnG amacrine cells, a newly discovered subclass of amacrine cell subtypes, and is sufficient to promote the formation of this amacrine cell subclass (Kay et al., 2011; Cherry et al., 2011).
Fig. 1.
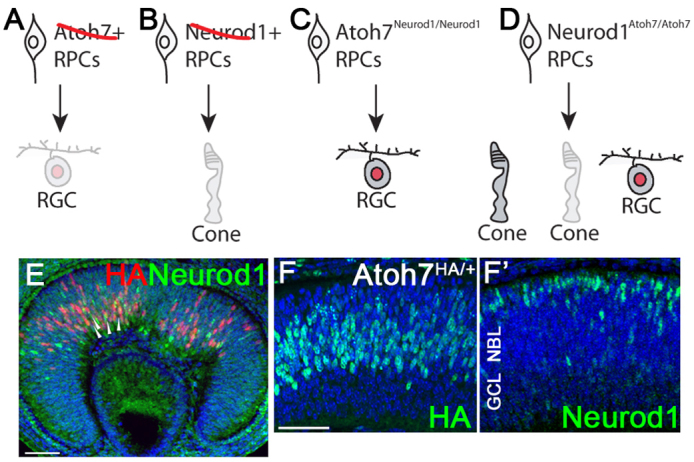
Phenotypic consequences of loss and gain of Atoh7 and Neurod1 function and their mosaic expression patterns in interspersed RPCs during retinogenesis. (A) Loss of Atoh7 leads to ~95% loss of RGCs owing to failed RGC specification during embryonic stages. (B) Loss of Neurod1 leads to loss of M-cones during retinogenesis. (C) Replacing Atoh7 with Neurod1 leads to ~40% recovery of RGC formation during developmental stages. (D) Possible outcomes when Neurod1 is replaced with Atoh7: (left) Atoh7 compensates for the function of Neurod1 in forming M-cones; (middle) no function; and (right) Atoh7 specifies RGCs in Neurod1-expressing RPCs. (E-F′) Atoh7HA/+ retinas stained with anti-HA and anti-Neurod1 antibodies at E12.5 (E) and E14.5 (F,F′). Scale bars: 50 μm.
The mosaic spatiotemporal pattern of the proneural bHLH factors in developing retinas, which seemingly mirrors the competency state in the RPCs, raises the issue of how these bHLH factors function independently and synergistically with each other and with non-bHLH factors to regulate the competency state of RPCs. The predominant view of cell fate determination in the developing retina is that the interspersed spatiotemporal expression patterns of Atoh7, Neurod1 and other factors arise stochastically. This implies that all RPCs have equivalent developmental potential. The onset of bHLH gene expression relies on the downregulation of Notch signaling in a subset of RPCs (Wallace, 2011). Once established, each subset of RPCs is biased to give rise to distinct types of neurons depending on the bHLH factors they express (Agathocleous and Harris, 2009; Wallace, 2011).
Previously, we tested whether replacing one bHLH gene with another could redirect RPCs from one cell fate into another (Mao et al., 2008b). We inserted Neurod1 into the Atoh7 locus and showed that Neurod1 replaced the function of Atoh7 in specifying RGC fate. The results suggested that Atoh7-expressing RPCs are largely programmed by intrinsic mechanisms that are not solely dependent on a specific proneural bHLH gene (Fig. 1C). In the same study, we also showed that Math3 did not compensate for the loss of Atoh7. We thus concluded that Neurod1 and Atoh7 share similar gene targets in the developing retina, whereas Math3 does not. Despite the fact the Neurod1 normally functions in RPCs destined for amacrine cell and M-cone cell fate, it adjusts and integrates into the foreign environment of RPCs destined for a RGC fate. Notably, Neurod1-null retinas produce the full complement of RGCs, indicating that Neurod1-expressing RPCs play little if any role in RGC differentiation (Liu et al., 2000; Pennesi et al., 2003; Liu et al., 2008). Hence, Neurod1-expressing RPCs, unlike Atoh7-expressing RPCs, are not intrinsically programmed for RGC formation. These results argue against the view that RPCs are equally potent in their potential to generate multiple cell types at the same developmental time. If this view is correct, then replacing Atoh7 with Neurod1 would be expected to reprogram Atoh7-expressing RPCs into amacrine cells or M-cone cells, which they do not do.
In the present study, we performed the converse experiment by inserting Atoh7 into the Neurod1 locus. Our aim was to determine which model most correctly describes the behavior of Neurod1-expressing RPCs: (1) Atoh7 compensates for the loss of Neurod1 to restore M-cone cells; (2) Atoh7 is not tolerated in Neurod1-expressing RPCs and cannot compensate for the absence of Neurod1; or (3) Atoh7 functions dominantly as a master regulator for RGC competency (Fig. 1D).
The experiments described below show that Atoh7 alone is sufficient to redirect an RPC destined to form an amacrine/M-cone cell fate to an RGC fate, and that early arising Neurod1-expressing RPCs are inherently programmed to produce RGCs, although they require Atoh7 to do so. Together with our previous results (Mao et al., 2008b), we propose that, in early retinogenesis, most RPCs have the developmental potential to differentiate into RGCs. Although the extrinsic environment plays a role in this process, subtle intrinsic differences must exist among different RPC subpopulations that can be overcome by the expression of Atoh7. In addition, we identify a bona fide Atoh7-binding enhancer in the intron 3 region of neurexin III (Nrxn3). We demonstrate that this enhancer is bound and used by Atoh7 but not by Neurod1 in the developing retina. By placing the Nrxn3 enhancer next to a basal promoter, we show that the enhancer is recognized by both Atoh7 and Neurod1. These results suggest that the Nrxn3 enhancer element is selectively used by similar factors in a context-dependent manner, thus providing a mechanism for determining the specialized functions that exist among multiple proneural bHLH factors.
MATERIALS AND METHODS
Gene targeting, transgenic animals and animal breeding
The targeting vector (Fig. 2A) was constructed by standard molecular biology techniques using PCR-amplified genomic DNA fragments from the Neurod1 locus as homologous arms. The Atoh7-coding sequence was fused to sequences encoding three copies of the hemagglutinin epitope YPYDVPDYA (HA-tag), and inserted after the PGK-Neo cassette, which was flanked by two loxC2 sites. Gene targeting was conducted as described previously (Mao et al., 2008b). Two targeted ES cell lines were used to generate Neurod1FNeoAtoh7HA3/+ mice. The Neurod1FNeoAtoh7HA3/+ line was subsequently bred to a germline CMV-Cre line to generate the Neurod1Atoh7HA3/+ line, which appeared normal. The knock-in allele was distinguished using PCR with primers B2 (5′-GTGTGCATTTCTGTAGGATTAGGG-3′), B3 (5′-GCTCTCGCTGTATGATTTGGTCATG-3′) and M51 (5′-GACACAGACGGAGCGACTCACGTG-3′) (Fig. 2B). To generate Nrxn3A7E-HSP68LacZ transgenic mouse lines, we fused a 489 bp sequence (chr12: 90280064-90280552) expanded from the 326 bp Atoh7-bound sequence-tag in Nrxn3, named Nrxn3A7E, to a HSP68pro-lacZ reporter (Kothary et al., 1989). This construct was used for pronuclear injection to generate transgenic mice. Atoh7G/G mice were as described by Wang et al. (Wang et al., 2001); Atoh7HA/HA mice were as described by Fu et al. (Fu et al., 2009). All animal procedures followed the US Public Health Service Policy on Humane Care and Use of Laboratory Animals, and were approved by the Institutional Animal Care and Use Committee at The University of Texas MD Anderson Cancer Center.
Fig. 2.

Replacing endogenous Neurod1 with Atoh7HA3. (A) Genome structure for Neurod1, the targeting construct and the predicted Atoh7HA3 knock-in allele. The coding region of Neurod1 is depicted as a black box. The blue bars underneath indicate the two arms for the targeting construct. Red boxes depict loxC2 sites. Atoh7HA3 is indicated as gray box. (B) Representative PCR analysis using B2, B3 and M51 to distinguish wild-type and NeurodAtoh7HA (Nd1A7) alleles from tail DNA. (C-F) Mis-expression of Atoh7HA3 from the Neurod1 locus. Sections of cortex (C,D) and retina (E,F) from E14.5 wild-type (C,E) and Nd1A7/+ (D,F) embryos were immunostained with anti-Neurod1 (C,E) or anti-HA (D,F) antibodies. (G-I) Adult retinal sections of wild-type (G), Neurod1Atoh7HA/+ (H) and Neurod1Atoh7HA/Atoh7HA (I) were stained with anti-HA antibody. (J) Western analysis of Atoh7HA3 protein expression from E14.5 retinas of Atoh7HA/HA and Neurod1Atoh7HA/+ mice. The non-specific bands were used as loading controls. Scale bars: 100 μm.
Immunohistochemistry and in situ hybridization
Mouse embryos and eyes dissected from embryos or adults were fixed, embedded in paraffin or OCT, and sectioned into 12 μm or 20 μm slices for immunohistochemistry. The sections were placed in a microwave oven at 600 W in 10 mM sodium citrate for 15 minutes to expose the antigen epitopes. For indirect immunofluorescence, a tyromide signal amplification kit (PerkinElmer) was used for Neurod1 and Pou4f2 to optimize signal intensity. The primary antibodies were anti-β-galactosidase (MP Biomedicals, 1:2000), anti-BrdU (Upstate, 1:10), anti-Isl1 (DSHB, 1:250), anti-HA (Cell Signaling, 1:500), anti-NF-L (Invitrogen, 1:500), anti-Opsin(R/G) (Chemicon, 1:500), anti-Pou4f1/Brn3a (Chemicon, 1:150), anti-Pou4f2/Brn3b (Santa Cruz, 1:100), anti-SMI32 (Covance, 1:400) and anti-Ngn2 (R&D Systems, 1:50). Alexa-conjugated and HRP-conjugated secondary antibodies were from Invitrogen and Jackson ImmunoResearch. To detect RGC axons and to estimate RGC number, anti-NF-L and anti-Pou4f2/Brn3b antibodies were used to stain flat-mounted retinas (Mao et al., 2008a). Images were captured and analyzed using an Olympus Fluoview 1000 confocal microscope. In situ hybridization was performed as described by Mao et al. (Mao et al., 2008b).
RGC axon tracing
Cholera toxin subunit (CTB; 2 μl) conjugated with either Alexa-488 or -594 (1 mg/ml, Invitrogen) was injected into the vitreous using a 36-gauge NanoFil system (World Precision Instruments). Two days later, animals were anesthetized and sacrificed with perfusion using 4% PFA. Whole brains were dissected and post-fixed with 4% PFA.
Western analysis
Whole cell lysate (20 μg) from E14.5 retinas were resolved on 10% SDS-PAGE gels (Bio-Rad) and transferred onto PVDF a membrane. Primary antibody against HA epitope tag (Abcam) and HRP-conjugated secondary antibody were applied to the membrane. Proteins were detected using ECL substrate (Amersham Biosciences). Protein expression was quantified using ImageJ (http://rsb.info.nih.gov/ij/docs/menus/analyze.html#gels). The intensity ratio between Neurod1Atoh7(HA)/+ and Atoh7HA/HA bands was adjusted by the ratio of the total number of Neurod1-expressing and Atoh7-expressing RPCs counted at E14.5 to quantify the relative level of Atoh7HA on the per cell basis between the Neurod1Atoh7 and Atoh7HA alleles.
Transmission electron microscopy
Enucleated eyes with the optic nerve were fixed with 3% glutaraldehyde and 2% paraformaldehyde in 0.1 M sodium cacodylate (pH 7.5) for 1 hour at room temperature. Samples were washed and treated with 0.1% cacodylate-buffered tannic acid, post-fixed with 1% osmium tetroxide, strained en bloc with 1% uranyl acetate and dehydrated with an ethanol gradient series. The samples were embedded in epon and sectioned with an LKB ultracut microtome. Sections were examined using a JEM 1010 TEM (JEOL).
Scotopic electroretinograms (ERG) recordings and data analysis
Mice were dark-adapted overnight and all preparations for recording were performed under dim red illumination (λ>650 nm) (Saszik et al., 2002). Animals were anesthetized with ketamine (70 mg/kg) and xylazine (7 mg/kg), and anesthesia was maintained with subcutaneous injections of ketamine (20 mg/kg) and xylazine (1 mg/kg) every 20-30 minutes. The head of each animal was fixed in a metal head holder that also served as the electrical ground. Pupils were fully dilated to 3 mm in diameter with topical atropine (0.5%) and phenylephrine (2.5%). Body temperature was monitored and maintained at 37°C with a thermostatically controlled electrically heated blanket (CWE). Full-field flash ERGs were recorded using DTL fiber electrodes placed across the center of the cornea of the tested eye and the fellow eye, which served as the reference. The cornea of the tested eye was covered with a contact lens heat-formed from clear film (ACLAR film). The non-tested eye was covered with a black plastic (PVC) contact lens and a black aluminum foil cap that covered both the eye and the skull to block any scattered light. Stimuli were provided from LEDs (λmax=462 nm) at a range of time-integrated flash luminances (stimulus strengths) from −6.2 to 3.0 log scotopic troland seconds (sc td-s). The inter-flash interval was adjusted to allow the ERG response to return to baseline between stimuli. For data analysis, A-wave amplitudes were measured on the leading edge of the wave, at a fixed time (6 ms) after the brief flash. After oscillatory potentials (>50 Hz) were removed, b-wave amplitudes were measured between the a-wave trough and b-wave peak, and also at the peak of pSTR and b-wave, 110 ms after the brief flash. nSTR amplitude was measured at 200 ms after the flash. B-waves were also measured from the trough of the a-wave to the peak of the b-wave. Repeated-measures ANOVA (SPSS) was performed to compare amplitudes of the stimulus response functions across all groups, and between pairs of groups.
Chromatin immunoprecipitation
Twenty E14 Atoh7HA/HA retinas were used for ChIP reactions following the procedure described by Tsai et al. (Tsai et al., 2010) to produce fragmented chromatin lysate. The fragmented, precleared chromatin lysate was incubated overnight with anti-HA (Cell Signaling), Neurod1 (Santa Cruz) or normal goat IgG (Santa Cruz). To analyze specific Atoh7HA-bound DNA, qPCR was conducted in a 7500 FAST ABI instrument. Sequences for PCR primers used were Tbr1f (5′-CAGCCCCAGTCGCTACATGG-3′), Tbr1r (5′-GCCCTGCGGCGAAGAGTTG-3′), Nrxn3f (5′-CAGGGAGAGTCATAAGGAGAAAA-3′) and Nrxn3r (5′-CAGCACATGTCATCCTAACACTT-3′). Total RNA was collected from E14.5 retinas using Trizol reagent (Invitrogen). RNAs were reversed transcribed using the SuperScript First-Strand Synthesis System (Invitrogen) following the manufacturer's instructions. For quantitative reverse transcriptase-PCR analysis, cDNAs were amplified using SYBR green PCR master mix (Applied Biosystems). The relative expression levels were normalized to that of GAPDH and calculated using the comparative Ct method (7500 Fast Real-time PCR systems SDS software, Applied Biosystems). DNA sequences of PCR primers were GAPDH-f (5′-AGGTCGGTGTGAACGGATTTG-3′), GAPDH-r (5′-TGTAGACCATGTAGTTGAGGTCA-3′) Nrxn3-f (5′-TTGGCACCATTGATGACCTG-3′) and Nrxn3-r (5′-CTTCAATAGCGGAGATGGCA-3′).
RESULTS
Expression of Atoh7 and Neurod1 in early embryonic retinas mirrors the competency state of distinct subsets of RPCs
To compare the spatial and temporal expression patterns of Atoh7 and Neurod1 in early embryonic retinas, we used anti-HA and anti-Neurod1 antibodies to label retinas of E12.5 Atoh7HA/+ embryos. Atoh7HA is a knock-in allele in which the Atoh7-coding sequence is fused in-frame with three copies of haemagglutinin (HA) (Fu et al., 2009). Atoh7-HA labeling was detected in the central part of retina where retinogenesis begins (Fig. 1E). By contrast, Neurod1 labeling was detected weakly in a slightly wider area where naïve RPCs reside (Fig. 1E). Only a few Neurod1-positive RPCs also expressed Atoh7-HA (Fig. 1E, arrowheads). At E14.5, Atoh7-HA expression was detected in RPCs throughout neural blast layer (NBL) (Fig. 1F), whereas Neurod1 was weakly expressed in the NBL, and its expression tended to cluster closer to the area where the presumptive photoreceptor cells reside (Fig. 1F′). The total number of RPCs expressing Atoh7-HA was about one and a half fold higher than Neurod1-expressing RPCs at E12 and twofold higher at E14.5 (cells/field: 155.7±5.9 versus 78.3±10.1; n=3, P<0.01).
Neurod1Atoh7 mimics endogenous Neurod1 expression patterns and cannot rescue phenotypic defects seen in Neurod1−/− mice
Atoh7-expressing and Neurod1-expressing RPCs are interspersed at similar developmental times yet they are required for the formation of different retinal neurons. To determine how these distinct subpopulations of RPCs responded to the activity of Atoh7, we have generated a Neurod1Atoh7HA/+ allele by gene targeting (Fig. 2A,B) (referred to as Nd1A7 in the figures). We first determine whether the Neurod1Atoh7HA/+ allele was expressed in a pattern that was similar to that of endogenous Neurod1. At E14.5, Neurod1Atoh7HA/+ was weakly expressed throughout the retina and in the cortex, similar to endogenous Neurod1 expression (Fig. 2C-F). In the mature retina, Neurod1 was also weakly expressed in both outer nuclear layer (ONL) and inner nuclear layer (INL). In the adult Neurod1Atoh7HA/+ retina, Atoh7-HA was also detectable in ONL and INL in a dose-dependent manner (Fig. 2G-I). We observed that Atoh7-HA expression in the Neurod1Atoh7HA/+ allele was much weaker on a per cell basis compared with that in the Atoh7HA/+ allele. We compared expression levels by western analysis, and found a 10-fold difference in Atoh7-HA expression between Atoh7HA/+ and Neurod1Atoh7HA/+ alleles (Fig. 2J).
Neurod1 is expressed in many regions in the central and peripheral nervous systems during development. A number of behavioral abnormalities associated with Neurod1-deficient mice have been reported, including head tilting and circling (Liu et al., 2000; Pennesi et al., 2003) that are due to defects in the cerebellum and inner ear. We found that all Neurod1Atoh7HA/Atoh7HA mice displayed this balancing defect. Examination of the cerebellum of Neurod1Atoh7HA/Atoh7HA mice showed that Neurod1Atoh7HA/Atoh7HA cerebellum has similar defects as found in Neurod1−/− mice (data not shown), suggesting that Atoh7-HA, although expressed in identical regions to Neurod1, could not rescue the function of Neurod1 in cerebellum and inner ear development. In addition, in developing retinas, Neurod1 activates the expression of thyroid hormone receptor β2 (Trb2; Thrb – Mouse Genome Informatics) to regulate the formation of M-opsin in a dorsal-ventral gradient manner (Liu et al., 2008). In Neurod1−/− retinas, all cone photoreceptors express short-wavelength (S) opsin. We thus examined the S-opsin expression in Neurod1Atoh7HA/Atoh7HA retinas and found that most of the cone cells in the dorsal retina expressed S-opsin (supplementary material Fig S1A-D), suggesting that Atoh7-HA cannot rescue the ability of Neurod1 to regulate the formation of M-cone cells.
Increased RGCs production in Neurod1Atoh7HA/Atoh7HA retinas
Atoh7 is required for the formation of RGCs in mice and humans (Wang et al., 2001, Brown et al., 2001, Ghiasvand et al., 2011). Hence, we determined whether Neurod1Atoh7HA/Atoh7HA retinas produced more RGCs than wild-type retinas. In P30 mice, immunostaining flat-mounted retinas with an anti-neurofilament light chain (NF-L) antibody showed that all Neurod1Atoh7HA/Atoh7HA retinas analyzed had a significantly higher density of RGC axon bundles compared with those of wild-type retinas (Fig. 3A,B). To determine how many more RGCs were generated in Neurod1Atoh7HA/Atoh7HA retinas, we immunostained P30 retinal sections with anti-Pou4f1/Brn3a antibody, and observed ~20% more Pou4f1-positive RGCs in Neurod1Atoh7HA/Atoh7HA retinas than in wild-type controls (Fig. 3C,D, arrowheads). Interestingly, we detected displaced retinal ganglion cells (dRGCs) expressing Pou4f1 in the innermost region of the INL in Neurod1Atoh7HA/Atoh7HA retinas (Fig. 3E). These Pou4f1-expressing dRGCs often expressed SMI32, an RGC subtype marker that also labeled RGC axons (Fig. 3E, arrowheads), whereas we rarely detect expression of these genes in INL of wild-type retinas. The Pou4f1-positive dRGCs found in the INL of Neurod1Atoh7HA/Atoh7HA retinas could arise during development by a failure to migrate to the ganglion cell layer (GCL) as a consequence of improper spatiotemporal specification. Alternatively, some Neurod1-expressing amacrine cells could be converting to RGCs as Atoh7 is expressed under the control of Neurod1.
Fig. 3.
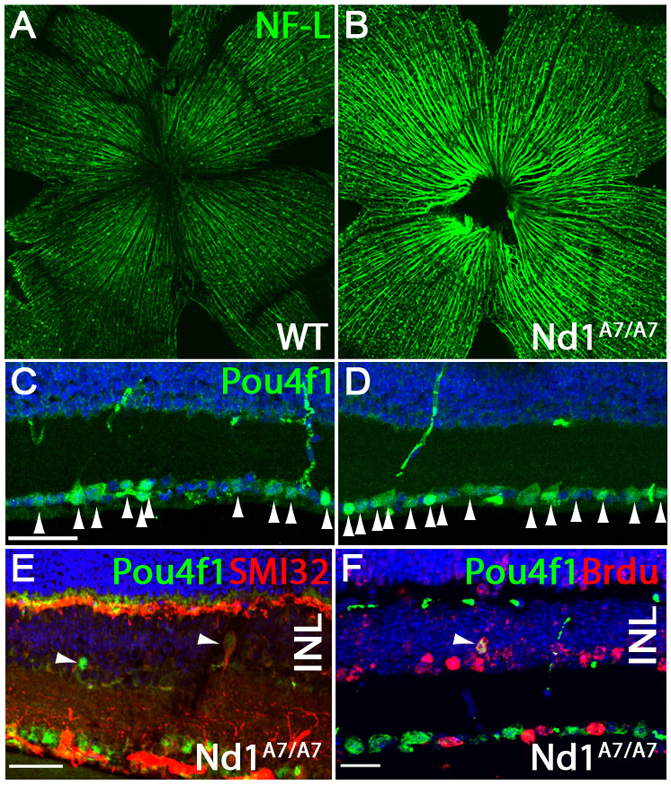
Neurod1Atoh7HA/Atoh7HA mice produce more RGCs and displaced RGCs (dRGCs) in the INL. (A,B) Retinal flat-mount immunostaining using anti-NF-L antibody on wild-type (A) and Neurod1Atoh7HA/Atoh7HA (B) retinas. (C,D) Immunostaining using anti-Pou4f1 antibody on P30 (C) wild-type and (D) Neurod1Atoh7HA/Atoh7HA retinal sections. (E) Immunostaining using anti-Pou4f1 and anti-SMI32 antibodies on P30 Neurod1Atoh7HA/Atoh7HA retinas. (F) Birth-dating analysis of Pou4f1-positive dRGCs in Neurod1Atoh7HA/Atoh7HA retinas when BrdU was injected at E17.5 and retinas dissected at P20. Retinal section was co-labeled with anti-Pou4f1 and anti-BrdU antibodies. INL, inner nuclear layer. Scale bars: 40 μm in C,E,F.
We conducted birthdating analysis to track when these cells were born and found that Pou4f1-expressing dRGCs were BrdU positive when BrdU was injected at E17.5 (Fig. 3F, arrowhead), suggesting that these dRGCs were born during late embryonic development. Whether they were born as RGCs and failed to migrate to the GCL, or born as non-RGC types and converted to RGCs was unclear.
Partial restoration of optic nerves and RGC axons in Atoh7G/G:Neurod1Atoh7HA/Atoh7HA mice
In the presence of endogenous Atoh7, the Neurod1Atoh7HA allele resulted in 20% more RGCs and RGC axons. We expected that in the absence of Atoh7, the Neurod1Atoh7HA would lead to a restoration of RGCs and possibly optic nerves, the major tissues affected in Atoh7G/G mice (Wang et al., 2001). To determine whether Neurod1Atoh7HA/Atoh7HA-induced RGCs could rescue the optical nerve defect, we crossed Neurod1Atoh7HA/Atoh7HA mice with Atoh7G/G mice and isolated eyes from adult Atoh7G/G:Neurod1Atoh7HA/Atoh7HA mice. Notably, we found the dissected eyes attached to partially developed optic nerves. Low magnification transmission electron microscopy (TEM) revealed that their diameters were 30% to 40% of those in wild-type mice (Fig. 4A,B). We examined optic nerve ultrastructure using higher magnification TEM, and observed that RGC axons were ensheathed with a well-organized and compact myelinated layer (Fig. 4C,D). The presence of optic nerves in Atoh7G/G :Neurod1Atoh7HA/Atoh7HA mice suggested that RGC axons were forming, fasciculating and extending into the optic disk. We performed retinal flat-mount immunostaining from P30 mice with anti-NF-L antibody and observed that Atoh7G/G:Neurod1Atoh7HA/Atoh7HA retinas had significant numbers of well-bundled RGC axons projecting towards the optic disk (Fig. 4E,F). To measure the number of RGCs that were generated in Atoh7G/G:Neurod1Atoh7HA/Atoh7HA retinas, we performed flat-mount immunostaining on P30 retinas with anti-Pou4f2/Brn3b antibody and found that Atoh7G/G:Neurod1Atoh7HA/Atoh7HA retinas had about 25% of the number of RGCs of wild-type retinas (cells/field: 155.25±9.11 versus 39.75±5.90; n=4, P<0.01). Furthermore, RGCs were generated evenly across the dorsal-ventral and the nasal-temporal axes within Atoh7G/G:Neurod1Atoh7HA/Atoh7HA retinas.
Fig. 4.
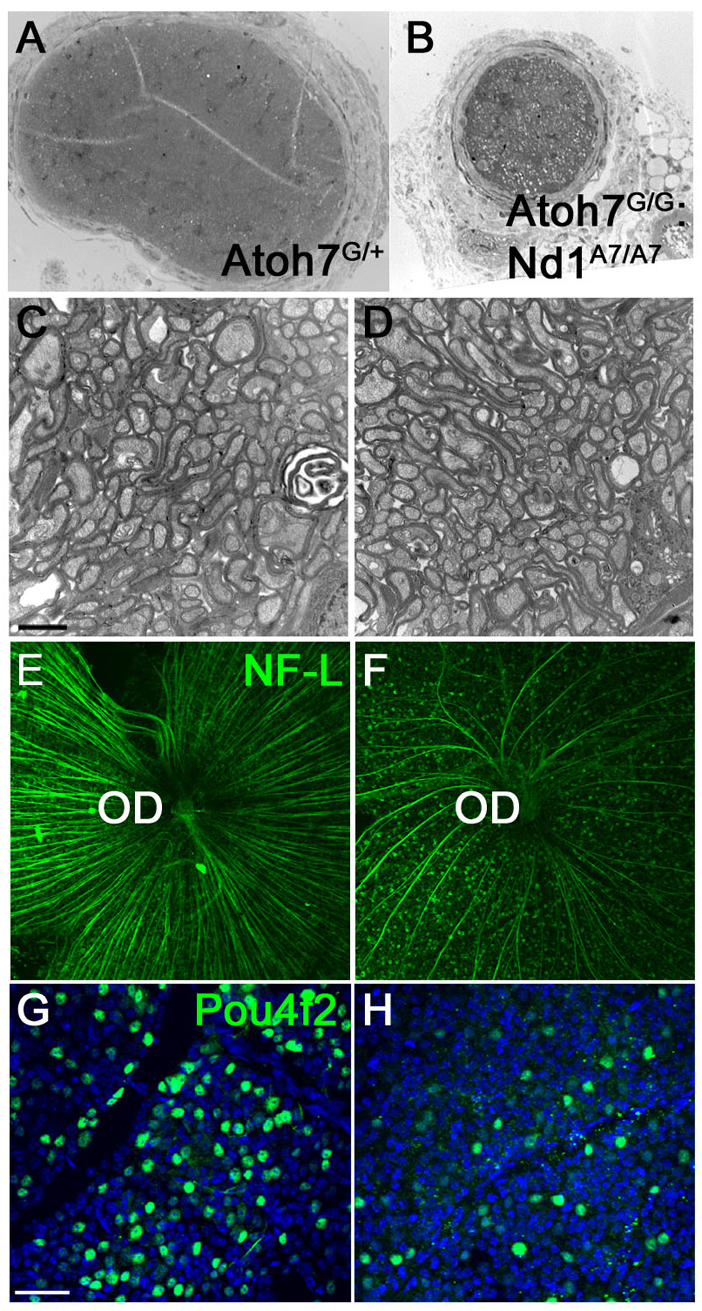
Partial restoration of RGCs and optic nerves in Atoh7G/G:Neurod1Atoh7HA/Atoh7HA retinas. (A-D) Transmission electron microscopy analysis of optic nerve cross-sections. C and D are at higher magnification. (E-H) Retinal flat-mount immunostaining using anti-NF-L (E,F) and anti-Pou4f2 (G,H). (A,C,E,F) Wild-type and (B,D,F,H) Atoh7G/G:Neurod1Atoh7HA/Atoh7HA retinas. OD, optic disk. Scale bars: 2 μm in C; 50 μm in G.
Expression of RGC genes in embryonic retinas of Atoh7G/G:Neurod1Atoh7HA mice
RGC differentiation begins at E12.5 when Isl1 and Pou4f2/Brn3b are first expressed in naïve RGCs (Gan et al., 1999; Elshatory et al., 2007; Mu et al., 2008). To determine when Atoh7G/G:Neurod1Atoh7HA/Atoh7HA retinas first generate RGCs, we used an anti-Isl1 antibody to determine its expression pattern in E13 retinas. We found that Atoh7G/G:Neurod1Atoh7HA/Ahot7HA retinas restored 28% of Isl1-positive RGCs compared with wild-type retinas (Fig. 5A,D), whereas Neurod1Atoh7HA/Atoh7HA retinas had 30% more Isl1-positive RGCs compared with wild-type retinas (Fig. 5A,B). Similarly, immunostaining using anti-Pou4f2 antibody also showed that Atoh7G/G:Neurod1Atoh7HA/Atoh7HA retinas produce more RGCs compared with Atoh7G/G retina (Fig. 5F,G), and restored 26% of RGCs compared with wild-type retinas (Fig. 5E,G). These results suggested that Neurod1-expressing RPCs, although destine to produce amacrine cells and cone cells during development, were inherently capable of being reprogrammed to produce RGCs when Atoh7 was ectopically expressed.
Fig. 5.
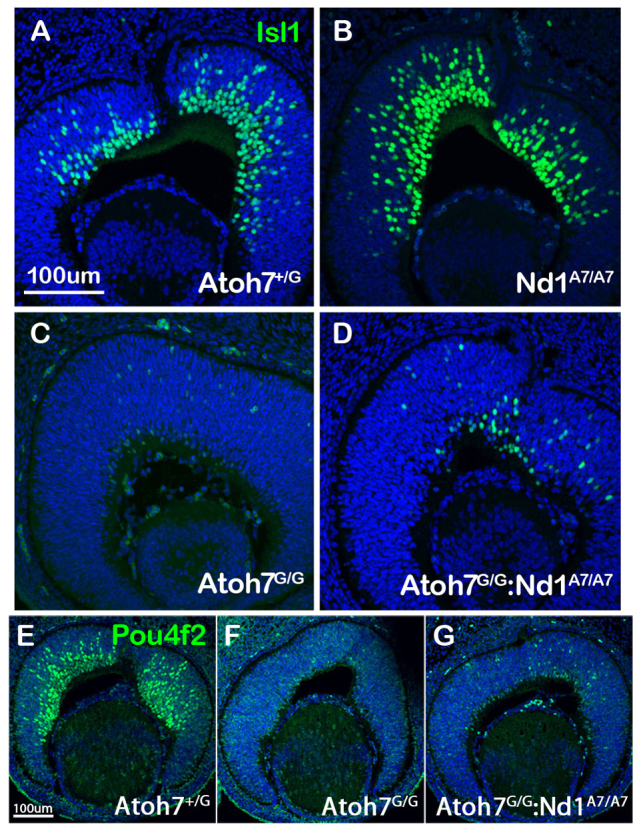
Activation of early expressed RGC genes in Atoh7G/G:Neurod1Atoh7HA/Atoh7HA retinas. (A-G) Immunostaining of retinas from E13 embryos with anti-Isl1 antibody (A-D) on (A) Atoh7G/+, (B) Neurod1Atoh7HA/Atoh7HA, (C) Atoh7G/G and (D) Atoh7G/G:Neurod1Atoh7HA/Atoh7HA retinal sections, and with anti-Pou4f2/Brn3b antibody (E-G) on (E) Atoh7G/+, (F) Atoh7G/G and (G) Atoh7G/G:Neurod1Atoh7HA/Atoh7HA retinal sections. Scale bars: 100 μm.
Atoh7G/G:Neurod1Atoh7/Atoh7-induced RGCs project to lateral geniculate nucleus and superior colliculus
The lateral geniculate nucleus (LGN) and superior colliculus (SC) are two of the major targets of the RGC axons in the brain. The LGN of the thalamus is the gateway that relays visual pathways to the primary visual cortex, and the SC is a midbrain structure involved in the generation of visual guided saccadic movement. To determine whether Neurod1Atoh7-induced RGCs projected to the LGN, we traced RGC axons by injecting CTB-594 into the eyes of both wild-type and Atoh7G/G:Neurod1Atoh7HA/Atoh7HA mice. Coronal sections showed that RGC axons in both wild-type and Atoh7G/G:Neurod1Atoh7HA/Atoh7HA mice projected normally across the optical chiasm (Fig. 6A,B) to dorsal and ventral LGN (Fig. 6C,D). The retinocollicular projection establishes a topographic map between RGCs and the SC. RGCs along the dorsal-ventral (D-V) axis topographically project to the medial-lateral (M-L) axis of the SC, whereas RGCs along nasal-temporal (N-L) axis topographically project to the posterior-anterior (P-A) axis of the SC. Tracing Neurod1Atoh7-induced RGC axon projections with CTB-488 showed that while wild-type and Neurod1Atoh7HA3/Atoh7HA3 RGC axons occupied the entire SC, as viewed by the filled fluorescent dye in the SC (Fig. 6E), RGC axons of Atoh7G/G:Neurod1Atoh7HA3/Atoh7HA3 mice projected to slightly more anterior areas in the SC.
Fig. 6.
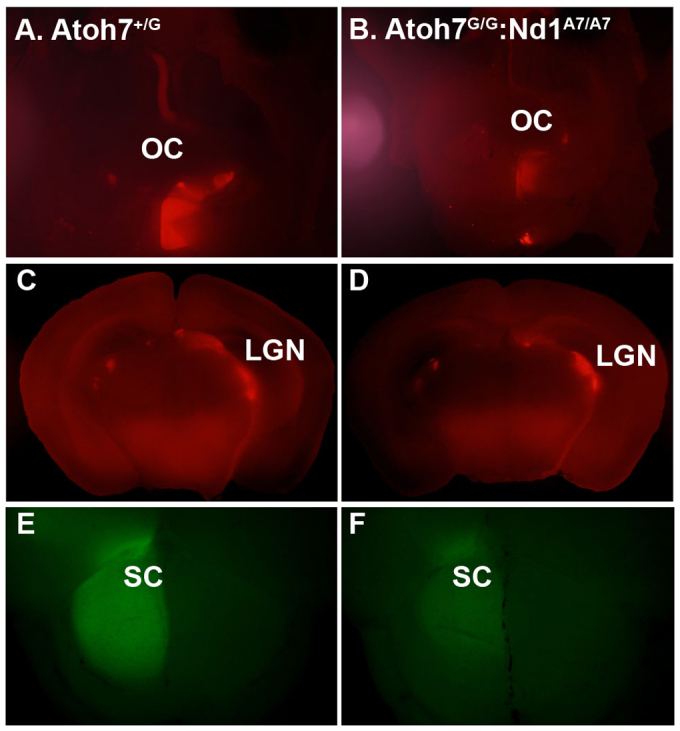
RGC axon targeting in the brain. (A,B) Dorsal view RGC axon tracing in the brain of mice whose left eyes were injected with CTB-594. The RGC axons travel through the optic chiasm (OC) to the right side of the brain in Atoh7+/G mice (A) and Atoh7G/G:Neurod1Atoh7/Atoh7 mice (B). (C,D) Coronal sections of the brain as indicated in A and B. RGC axons targeted to the lateral geniculate nucleus normally in both genotypes. (E,F) CTB-488 was injected into the right eyes to visualize RGC axon targeting in the superior colliculus (SC) in Atoh7+/G (E) and Atoh7G/G:Neurod1Atoh7/Atoh7 (F) brains. CTB-488 is evenly distributed in the SC of the Atoh7+/G brain (E), but slightly towards the anterior SC of the Atoh7G/G:Neurod1Atoh7/Atoh7 brain (F).
Atoh7G/G:Neurod1Atoh7/Atoh7 RGCs partially rescue defective electroretinogram (ERG) signals in Atoh7G/G retinas
Because the Atoh7G/G:Neurod1Atoh7/Atoh7 mice partially restore the optic nerves through which RGC axons project to the major regions in the brain, we also expected some restoration of electroretinogram (ERG) responses in Atoh7G/G:Neurod1Atoh7Atoh7 mice. Representative dark-adapted ERG responses to flashes of increasing stimulus strengths for four genotypes tested are shown in Fig. 7A. In control Atoh7+/G mice (Fig. 7A), the dark-adapted ERG in response to a weak stimulus, e.g. −4.7 log sc td-s, is dominated by two signals from inner retina: positive (p) and negative (n) scotopic response (Saszik et al., 2002). Generation of the positive STR requires that RGCs are functional, the negative STR also relies on RGC function, but the extent varies (Moshiri et al., 2008; Alarcón-Martínez et al., 2010). Atoh7G/G mice (Fig. 7A) hardly showed either of the waves originating from inner retina that were present in the ERG of the Atoh7+/G mice. The small positive wave that was present for the −4.7 log sc td-s stimulus was either residual pSTR, or the most sensitive part of the b-wave, which is generated by responses of ON (rod-driven) bipolar cells in the scotopic ERG (Robson and Frishman, 1995, Robson et al., 2004). Similar results have been reported previously, although in one study, a nSTR was still present in the Atoh7−/− mice (Moshiri et al., 2008, Brzezinski et al., 2005).
Fig. 7.

ERG analysis. (A) Scotopic full-field ERG responses to brief flashes recorded from one mouse from each of the four genotypes. Stimulus strength increases from bottom to top. Arrows in the right column indicated missing STRs in this animal. (B-D) Stimulus versus ERG amplitude plots measured at fixed time after the brief stimulus flash for the four genotypes: Atoh7+/G (n=4), Atoh7G/G:Neurod1Atoh7/+ (n=3), Atoh7+/G:Neurod1Atoh7/Atoh7 and Atoh7G/G (n=3). (B) pSTR and b-wave amplitudes at 110 ms, (C) nSTR amplitudes at 200 ms and (D) a-wave amplitudes at 6 ms after the flash. The error bars are standard errors.
The ERG responses to the weakest stimuli in Atoh7G/G:Neurod1Atoh7/Atoh7 mice were similar in waveform, but smaller than the responses of Atoh7+/G mice (Fig. 7A), indicating the presence of more RGC function than in the Atoh7G/G mice. Recordings from one Atoh7G/G:Neurod1Atoh7/+ (not illustrated) were very similar to those for the Atoh7G/G:Neurod1Atoh7/Atoh7 group. Finally, Atoh7+/G:Neurod1Atoh7/Atoh7 (Fig. 7A) also showed more evidence of inner retinal activity than did Atoh7G/G mice, particularly for the nSTR. In all four groups, the ERGs to stronger stimuli included common features of the flash ERG; b-waves that increased in amplitude with stimulus strength, and for the strongest stimuli, e.g. 2.1 log sc td s, a negative-going a-wave, which reflects photoreceptor currents (Robson et al., 2004; Hood and Birch, 1990; Jamison et al., 2001), was present at the beginning of the response. However, further analysis showed that b-waves were consistently smaller than control Atoh7+/G b-waves, in certain groups.
In order to quantify comparisons of the ERGs of mice in the four different groups, stimulus versus ERG amplitude plots were constructed based on measurements at peak times of the ERG waves. Plots are shown for pSTR and b-wave measured at 110 ms after the flash (Fig. 7B) and for nSTR measured at 200 ms at the trough of the response (Fig. 7C). Fig. 7D shows the amplitude measured at 6 ms after the flash on the leading edge of the a-wave. As predicted by the ERG traces (Fig. 7A), and documented in supplementary material Table S1, pSTR amplitudes were significantly lower in the Atoh7-null mice than in the Atoh7+/G controls and in the Atoh7G/G:Neurod1Atoh7/+ group. For the pSTR, ERG amplitudes for the different groups were compared only in the region of the box in the pSTR/b-wave plot. The nSTR in Atoh7-null mice was significantly lower than in Atoh7+/G control as expected, but also the Atoh7G/G:Neurod1Atoh7/Atoh7 group. STRs of Atoh7G/G:Neurod1Atoh7/+ and Atoh7+/G:Neurod1Atoh7/Atoh7 were not significantly different from one another. A-wave amplitudes were not significantly different across groups, but b-wave amplitudes measured at 110 ms were significantly lower in Atoh7G/G than in either Atoh7+/G and Atoh7G/G:Neurod1Atoh7/+ groups. B-wave amplitudes were also measured from a-wave trough to b-wave peak, which is a more traditional measure that is independent of timing of waves. The two b-wave measures yielded very similar results, as shown in supplementary material Table S1. Plots of trough-to-peak amplitudes were not included in Fig. 7. Although b-wave amplitudes of Atoh7G/G:Neurod1Atoh7/+ were not significantly larger in amplitude than Atoh7G/G, they were significantly lower than in the Atoh7+/G control mice (supplementary material Table S1). In summary, the Atoh7G/G:Neurod1Atoh7/+ group showed restoration of pSTR, which relies ganglion cell integrity, and b-wave, which relies on bipolar cell function. Consistent with morphological findings, the improvement in positive going potentials did not occur at a significant level for the Atoh7+/G:Neurod1Atoh7/Atoh7 mice. By contrast, for the nSTR, amplitude was significant larger in the Atoh7+/G:Neurod1Atoh7/Atoh7 mice than in the than in Atoh7G/G mice, but this did not occur for the Atoh7G/G:Neurod1Atoh7/+ group, in which the nSTR amplitude was improved, but not significantly. The nSTR relies on amacrine as well as ganglion cell function in mice, and is mediated via glial cell currents. Interestingly, Fig. 7D shows that nSTR in the Atoh7+/G:Neurod1Atoh7/Atoh7 mice, as in the Atoh7G/G mice, was not present at the lowest stimulus strengths, and only emerged for a stimulus almost a log unit stronger where the Atoh7+/G control response was nearly maximal.
Differential in vivo use of an Atoh7-mediated enhancer by Atonal-like factors
Atoh7 and Neurod1 both belong to Atonal-like transcription factor family. They form heterodimer with E12/E47 factors that selectively bind to specific E-box sequences, including CAGGTG, CAGCTG, CAGATG, CATATG and CATGTG, to activate a distinct set of downstream genes (De Masi et al., 2011). Based on current knowledge, we cannot predict whether any specific domain within Atoh7 or Neurod1 sequences can discriminate one from the other to determine their in vivo target specificity. The results presented by Mao et al. (Mao et al., 2008b) demonstrated that Neurod1 functions in Atoh7-expressing RPCs to activate RGC genes. This raises the issue of why Neurod1 cannot activate RGC genes in Neurod1-expressing RPCs. Conversely, as we showed above, Atoh7 converts Neurod1-expressing RPCs to RGC-competent RPCs.
To begin to understand the in vivo target specificity of Atoh7 and Neurod1, we performed chromatin immunoprecipitation coupled with parallel sequencing (ChIP-Seq) to uncover genome-wide DNA-binding sites for Atoh7. We used E14.5 Atoh7HA/HA retinas to prepare fragmented chromatin, performed ChIP-Seq on the DNA fragments with an anti-HA antibody using wild-type retinas as control, and identified ~1500 in vivo targets of Atoh7 (C.-A.M., Yue Lu, W.H.K. and Shoudan Liang, unpublished). One of the strongest peaks in the data analysis was within the Neurexin III (Nrxn3) locus. Nrxn3 encodes a neuron-specific cell-surface molecule and is widely expressed in developing central nervous system, including the retina (Püschel and Betz, 1995). The Nrxn3 Atoh7-binding peak encompassed a 326 bp evolutionarily conserved sequence mapping to chr12:90280146-90280471, which lies within intron 3 of Nrxn3 (Fig. 8A,B).
Fig. 8.
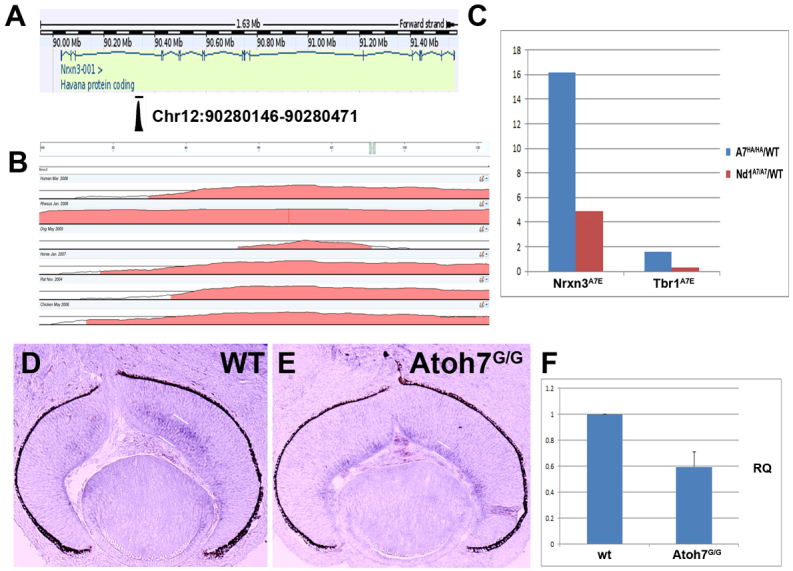
Atoh7 binds to intron 3 of Nrxn3 and regulates Nrxn3 expression. (A) The sequence peak for in vivo Atoh7 occupancy in E14.5 retinal DNA was uncovered in intron 3 of Nrxn3 by ChiP-Seq. (B) Whole-genome comparative analysis using Vista Point (http://pipeline.lbl.gov/cgi-bin/gateway2?selector=vistapoint) reveals that the Nrxn3A7E peak sequence (chr12:90280146-90280471) is evolutionarily conserved among multiple vertebrate species. (C) Quantitative PCR analysis of Nrxn3A7E and Tbr1A7E peaks in Atoh7HA/HA and Neurod1Atoh7HA/Atoh7HA retinas using wild-type retinas as a baseline. (D,E) Expression of Nrxn3 (signal between white lines) in E14.5 wild-type (D) and Atoh7G/G (E) retinas. (F) Quantitative RT-PCR analysis of Nrxn3 expression in E14 wild-type and Atoh7G/G retinas. RQ indicates relative quantification of Nrxn3 expression in E14.5 wild-type (wt) and Atoh7G/G retinas using GAPDH expression as an internal control.
Five E-boxes were found in this region (supplementary material Fig. S2), all belonging to the predicted Atoh7-binding E-box sequences. Most notably, two consecutive E-box elements were clustered in the middle of this peak (supplementary material Fig. S2). To confirm whether Atoh7 binds to this element in vivo, we performed qPCR on the immunoprecipitated DNA fragment from E14.5 Atoh7HA/HA retinas. A 16-fold enrichment of occupancy in this region was observed compared with non-specific occupancy by anti-HA antibody on E14.5 wild-type retina (Fig. 8C). Weaker but detectable occupancy of Atoh7 in this region was also found in Neurod1Atoh7/Atoh7 retinas (Fig. 8C). In addition, we detected a weak, but reproducible, occupancy of Atoh7 in a region near Tbr1, which is expressed in a small subset of RGCs (Mao et al., 2008a). By contrast, we did not detect any in vivo occupancy of Neurod1 in this region in the retina, although a weak occupancy of Neurod1 in the same region in E14.5 brain tissue was detected (data not shown).
Nrxn3 was expressed largely in the developing ganglion cell layer of E14.5 retinas (Fig. 8D). However, in the absence of Atoh7, Nrxn3 expression was downregulated by ~41% (Fig. 8E,F), indicating that its expression was dependent on Atoh7 but not on Neurod1 in the developing retina. These results suggested that the Nrxn3 element is a direct target of Atoh7, and the expression of Nrxn3 depends on Atoh7. The results additionally support the notion that there is a differential use of the Nrxn3 element by Atoh7 and Neurod1 in different regions of the developing central nervous system.
DNA-binding elements identified by ChIP-Seq analysis often function as enhancers, which can be tested as such in the appropriate experimental context (Visel et al., 2009). To test whether this region in Nrxn3 confers Atoh7-mediated enhancer activity, we generated two transgenic mouse lines carrying the Nrxn3A7E-HSP68lacZ construct (Fig. 9A), and bred them to Atoh7HA/HA mice to produce Atoh7HA/HA; Nrxn3A7E-HSP68LacZ retinas. We compared the expression profile of Atoh7-HA and lacZ in E14.5 retinas by co-immunostaining and found that ~70% of Atoh7HA-expressing cells also expressed lacZ, suggesting this sequence functions as a bona fide Atoh7 enhancer (Fig. 9B-D). Surprisingly, many lacZ-positive RPCs were found clustered in area where presumptive photoreceptors reside. We then compared the co-expression of lacZ and Neurod1 and found that many lacZ-positive RPCs expressed Neurod1 (Fig. 9E-G). This result was unexpected, as endogenous Nrxn3 is not expressed in the region for photoreceptor progenitors and the Nrxn3A7E element was not bound in vivo by Neurod1. Additionally, another Atonal-related bHLH factor Ngn2 (Hufnagel et al., 2010) was also expressed in lacZ-positive RPCs (Fig. 9H-J). Taken together, our results suggested that Nrxn3A7E was bound and used in vivo by Atoh7, and likely functioned as an enhancer for Nrxn3 expression in vivo. It also suggested that, when this enhancer element was placed in a different context, it could be recognized and used by other related bHLH factors that were otherwise selectively prohibited.
Fig. 9.

Nrxn3A7E peak sequence functions as an in vivo enhancer for Atonal-class bHLH factors. (A) Nrxn3A7E peak sequence was linked to a HSP68-LacZ-pA construct to generate transgenic lines for enhancer analysis. (B-D) Co-expression of Atoh7HA and lacZ in E14.5 Atoh7HA/HA:Nrxn3A7EHSP68LacZ-pA retinal sections. (E-G) Co-expression of Neurod1 and lacZ. (H-J) Co-expression of Ngn2 and lacZ. Scale bar: 40 μm.
DISCUSSION
In a previous study, we replaced Atoh7 with Neurod1 and found that, in Atoh7Neurod1/Neurod1 retinas, Atoh7-expressing RPCs are pre-programmed to produce RGCs provided that the bHLH proneural gene Atoh7 or Neurod1 is present (Mao et al., 2008b). In the present study, we addressed how Neurod1-expressing RPCs would respond to the replacement of Neurod1 with Atoh7. Our results demonstrate that Atoh7 acts dominantly in Neurod1-expressing RPCs to activate the RGC genetic program. In the absence of endogenous Atoh7, Neurod1Atoh7 directed RPCs to specify an RGC fate, differentiate into RGCs, form an optic nerve, make proper axon projections to brain and produce an ERG response. These data support the idea that Atoh7 acts as a ‘master regulator’ for establishing an RGC competency state in non-Atoh7-expressing RPCs. By contrast, Neurod1 does not possess this activity in the same population of RPCs. In Atoh7-expressing RPCs, Neurod1 adapts to the new environment and acts like Atoh7 to establish RGC competence state. Two major conclusions can be drawn from these consecutive studies. The first is that the intrinsic program in Atoh7-expressing RPCs redirects the function of Neurod1 to act as Atoh7 in RGC formation, whereas Neurod1-expressing RPCs have sufficient plasticity to be reprogrammed by Atoh7. Second, Atoh7 functions as a dominant factor to convert other RPCs into RGC competence state, whereas Neurod1 does not. The most challenging question arising from our studies is why Atoh7-expressing RPCs are distinct from Neurod1-expressing RPCs, especially as RPCs are thought to be flexible in selecting their final cell fate (Gomes et al., 2011). Neurod1 cannot activate the RGC genetic program in its endogenous environment, yet it can do so in Atoh7-expressing RPCs. What distinguishes Atoh7-expressing RPCs from Neurod1-expressing RPCs and Atoh7 from Neurod1?
One possible explanation is that the expression levels of Atoh7 and Neurod1 in the two RPC subpopulations govern whether RGC genes are activated. Our results indicate that on a per cell basis, Atoh7 expression in Neurod1Atoh7/Atoh7 retinas is 10% of the levels in wild-type embryos. This suggests that a threshold level of Atoh7 is involved in specifying RPCs towards an RGC fate. Perhaps Neurod1 expression in Atoh7Neurod1/Neurod1 retinas achieves this threshold in Atoh7-expressing RPCs, although not fully. However, Neurod1 may fail to reach the necessary threshold level to activate RGC genes in Neurod1-expressing RPCs. It is possible that overexpressing Neurod1 in Neurod1-expressing RPCs may enhance RGC differentiation, but the appropriate animal study is presently not feasible. Similar to the notion of dose effect, the expression level of Atoh7 has also been implicated to regulate the initial RGC number in RGC specification process (Prasov et al., 2012).
Another possibility is that Atoh7 and Neurod1 selectively activate distinct sets of downstream genes. For Atoh7, Neurod1 and other bHLH factors to function precisely in their respective RPCs, each needs to coordinate with chromatin remodeling factors to generate suitable local chromatin structures and histone marks to trigger the activation of the gene. In our pilot ChiP-Seq assay for Atoh7 in vivo targets, we identified Nrxn3 as an Atoh7 target gene and found that whereas Atoh7 binds to the presumptive enhancer in intron 3, Neurod1 does not occupy this region in retina. Notably, in the developing brain, where Neurod1 and Nrxn3 expression patterns partially overlap, we readily detected Neurod1 occupancy in the same genomic region of Nrnx3. Furthermore, a transgene reporter driven by the intron 3 enhancer faithfully reports Atoh7 activity in retina. Additionally, other bHLH factors such as Neurod1 and Ngn2, appeared to activate the intron 3 enhancer in the retina, whereas in normal development, Nrxn3 expression does not rely on these factors. These results suggest that related bHLH factors have the inherent capability of activating gene expression at enhancers that are normally inaccessible to them.
Post-translational modification of bHLH factors may also be involved in establishing target gene specificity among related bHLH factors. For example, a GSKβ-insensitive form of Xneurod1 was shown to convey RGC fate in frog retinas, implying an interaction between Neurod1 and the Wnt/β-catenin pathway (Moore et al., 2002). Post-translational modification of key transcriptional regulators, such as Nrl and Vax2, has recently been realized as another layer of regulation of cell fate determination during retinogenesis (Roger et al., 2010; Kim and Lemke, 2006; Onishi et al., 2010). Future studies with purified Atoh7- and Neurod1-expressing RPCs may aid in distinguishing the different molecular contents in each RPC subpopulation.
The establishment of RGC competency requires coordinated integration of the Atoh7-dependent intrinsic program with the dynamic local environmental signals. It was recently discovered that linage-specific regulators can direct the Bmp and Wnt signaling effectors Smad and TCF7 to lineage-specific target genes to control the genetic program defining cellular identity (Mullen et al., 2011, Trompouki et al., 2011). It is possible that this type of dominant mechanism is also being used by Atoh7 in a similar way to convey RGC competency. In the ChiP-Seq dataset for Atoh7, we found that the majority of Atoh7 target genes fall into two functional categories, those involved in transcriptional regulation, and those involved in axonal guidance (C.A.-M. and W.H.K., unpublished). The Atoh7 gene targets that encode transcriptional regulators most probably play a role in regulating the downstream cascade of events for RGC differentiation. What was perhaps less expected was the identification of many Atoh7 gene targets involved in axonal guidance. When RGCs are first generated in embryonic retinas they are located close to the optic nerve head (Oster et al., 2004). One of the first events of nascent RGCs is to detach their ventricular processes to form an unipolar RGC, and their vitreal processes transformed into an axon growth cone (Hinds and Hinds, 1974; Oster et al., 2004). The earliest born RGCs are considered pioneer neurons, which serve as platform for later-born RGC axons (Raper and Mason, 2010). Consistent with our ChIP-Seq results, a recent study has implied that Atoh7 plays a role in activating pioneer neurons (Brzezinski et al., 2012). Atoh7-expressing RPCs were known to give rise to RGC and photoreceptor lineages (Yang et al., 2003). Loss of Atoh7 led to increased production of cone photoreceptors (Brown et al., 2001). These data together suggest that some RGCs and cones share the same Atoh7-expressing RPCs during retinogenesis, and the absence of Atoh7 provides a permissive environment to allow fate shifting to cones. However, the likely permissive effect of the absence of M-cones in Neurod1Atoh7/Atoh7 RPCs on the induction of RGC fates and the molecular mechanisms underlying the differential in vivo target selection between similar bHLH factors are presently unresolved.
Supplementary Material
Acknowledgements
We thank the internal Genetically Engineered Mouse Facility for generating mouse lines, the DNA Analysis Facility for DNA sequencing and ChiP-Seq, and the High Resolution Electron Microscopy Facility for TEM. We thank Drs Yue Lu and Shoudan Liang in the Department of Bioinformatics and Computational Biology for analyzing the initial ChiP-Seq dataset and revealing Nrxn3A7E element.
Footnotes
Funding
These core facilities are supported in part by a NCI Cancer Center Core Grant [CA016672]. The work was supported by grants from the National Eye Institute to W.H.K. [EY011930 and EY010608-139005] and to L.J.F. [EY06671], and by the Robert A. Welch Foundation [G-0010 to W.H.K.]. Deposited in PMC for release after 12 months.
Competing interests statement
The authors declare no competing financial interests.
Supplementary material
Supplementary material available online at http://dev.biologists.org/lookup/suppl/doi:10.1242/dev.085886/-/DC1
References
- Agathocleous M., Harris W. A. (2009). From progenitors to differentiated cells in the vertebrate retina. Annu. Rev. Cell Dev. Biol. 25, 45-69 [DOI] [PubMed] [Google Scholar]
- Akagi T., Inoue T., Miyoshi G., Bessho Y., Takahashi M., Lee J. E., Guillemot F., Kageyama R. (2004). Requirement of multiple basic helix-loop-helix genes for retinal neuronal subtype specification. J. Biol. Chem. 279, 28492-28498 [DOI] [PubMed] [Google Scholar]
- Alarcón-Martínez L., Avilés-Trigueros M., Galindo-Romero C., Valiente-Soriano J., Agudo-Barriuso M., Villa P. L., Villegas-Pérez M. P., Vidal-Sanz M. (2010). ERG changes in albino and pigmented mice after optic nerve transection. Vision Res. 50, 2176-2187 [DOI] [PubMed] [Google Scholar]
- Brown N. L., Kanekar S., Vetter M. L., Tucker P. K., Gemza D. L., Glaser T. (1998). Math5 encodes a murine basic helix-loop-helix transcription factor expressed during early stages of retinal neurogenesis. Development 125, 4821-4833 [DOI] [PubMed] [Google Scholar]
- Brown N. L., Patel S., Brzezinski J., Glaser T. (2001). Math5 is required for retinal ganglion cell and optic nerve formation. Development 128, 2497-2508 [DOI] [PMC free article] [PubMed] [Google Scholar]
- Brzezinski J. A., 4th, Brown N. L., Tanikawa A., Bush R. A., Sieving P. A., Vitaterna M. H., Takahashi J. S., Glaser T. (2005). Loss of circadian photoentrainment and abnormal retinal electrophysiology in Math5 mutant mice. Invest. Ophthalmol. Vis. Sci. 46, 2540-2551 [DOI] [PMC free article] [PubMed] [Google Scholar]
- Brzezinski J. A., 4th, Prasov L., Glaser T. (2012). Math5 defines the ganglion cell competence state in a subpopulation of retinal progenitor cells exiting the cell cycle. Dev. Biol. 365, 395-413 [DOI] [PMC free article] [PubMed] [Google Scholar]
- Cherry T. J., Wang S., Bormuth I., Schwab M., Olson J., Cepko C. L. (2011). NeuroD factors regulate cell fate and neurite stratification in the developing retina. J. Neurosci. 31, 7365-7379 [DOI] [PMC free article] [PubMed] [Google Scholar]
- De Masi F., Grove C. A., Vedenko A., Alibés A., Gisselbrecht S. S., Serrano L., Bulyk M. L., Walhout A. J. (2011). Using a structural and logics systems approach to infer bHLH-DNA binding specificity determinants. Nucleic Acids Res. 39, 4553-4563 [DOI] [PMC free article] [PubMed] [Google Scholar]
- Elshatory Y., Deng M., Xie X., Gan L. (2007). Expression of the LIM-homeodomain protein Isl1 in the developing and mature mouse retina. J. Comp. Neurol. 503, 182-197 [DOI] [PMC free article] [PubMed] [Google Scholar]
- Feng L., Xie X., Joshi P. S., Yang Z., Shibasaki K., Chow R. L., Gan L. (2006). Requirement for Bhlhb5 in the specification of amacrine and cone bipolar subtypes in mouse retina. Development 133, 4815-4825 [DOI] [PMC free article] [PubMed] [Google Scholar]
- Fu X., Kiyama T., Li R., Russell M., Klein W. H., Mu X. (2009). Epitope-tagging Math5 and Pou4f2: new tools to study retinal ganglion cell development in the mouse. Dev. Dyn. 238, 2309-2317 [DOI] [PMC free article] [PubMed] [Google Scholar]
- Fujitani Y., Fujitani S., Luo H., Qiu F., Burlison J., Long Q., Kawaguchi Y., Edlund H., MacDonald R. J., Furukawa T., et al. (2006). Ptf1a determines horizontal and amacrine cell fates during mouse retinal development. Development 133, 4439-4450 [DOI] [PubMed] [Google Scholar]
- Gan L., Wang S. W., Huang Z., Klein W. H. (1999). POU domain factor Brn-3b is essential for retinal ganglion cell differentiation and survival but not for initial cell fate specification. Dev. Biol. 210, 469-480 [DOI] [PubMed] [Google Scholar]
- Ghiasvand N. M., Rudolph D. D., Mashayekhi M., Brzezinski J. A., 4th, Goldman D., Glaser T. (2011). Deletion of a remote enhancer near ATOH7 disrupts retinal neurogenesis, causing NCRNA disease. Nat. Neurosci. 14, 578-586 [DOI] [PMC free article] [PubMed] [Google Scholar]
- Gomes F. L., Zhang G., Carbonell F., Correa J. A., Harris W. A., Simons B. D., Cayouette M. (2011). Reconstruction of rat retinal progenitor cell lineages in vitro reveals a surprising degree of stochasticity in cell fate decisions. Development 138, 227-235 [DOI] [PMC free article] [PubMed] [Google Scholar]
- Hatakeyama J., Kageyama R. (2004). Retinal cell fate determination and bHLH factors. Semin. Cell Dev. Biol. 15, 83-89 [DOI] [PubMed] [Google Scholar]
- Hinds J. W., Hinds P. L. (1974). Early ganglion cell differentiation in the mouse retina: an electron microscopic analysis utilizing serial sections. Dev. Biol. 37, 381-416 [DOI] [PubMed] [Google Scholar]
- Hood D. C., Birch D. G. (1990). A quantitative measure of the electrical activity of human rod photoreceptors using electroretinography. Vis. Neurosci. 5, 379-387 [DOI] [PubMed] [Google Scholar]
- Hufnagel R. B., Le T. T., Riesenberg A. L., Brown N. L. (2010). Neurog2 controls the leading edge of neurogenesis in the mammalian retina. Dev. Biol. 340, 490-503 [DOI] [PMC free article] [PubMed] [Google Scholar]
- Inoue T., Hojo M., Bessho Y., Tano Y., Lee J. E., Kageyama R. (2002). Math3 and NeuroD regulate amacrine cell fate specification in the retina. Development 129, 831-842 [DOI] [PubMed] [Google Scholar]
- Jamison J. A., Bush R. A., Lei B., Sieving P. A. (2001). Characterization of the rod photoresponse isolated from the dark-adapted primate ERG. Vis. Neurosci. 18, 445-455 [DOI] [PubMed] [Google Scholar]
- Kay J. N., Voinescu P. E., Chu M. W., Sanes J. R. (2011). Neurod6 expression defines new retinal amacrine cell subtypes and regulates their fate. Nat. Neurosci. 14, 965-972 [DOI] [PMC free article] [PubMed] [Google Scholar]
- Kim J. W., Lemke G. (2006). Hedgehog-regulated localization of Vax2 controls eye development. Genes Dev. 20, 2833-2847 [DOI] [PMC free article] [PubMed] [Google Scholar]
- Kothary R., Clapoff S., Darling S., Perry M. D., Moran L. A., Rossant J. (1989). Inducible expression of an hsp68-lacZ hybrid gene in transgenic mice. Development 105, 707-714 [DOI] [PubMed] [Google Scholar]
- Le T. T., Wroblewski E., Patel S., Riesenberg A. N., Brown N. L. (2006). Math5 is required for both early retinal neuron differentiation and cell cycle progression. Dev. Biol. 295, 764-778 [DOI] [PubMed] [Google Scholar]
- Liu M., Pereira F. A., Price S. D., Chu M.-J., Shope C., Himes D., Eatock R. A., Brownell W. E., Lysakowski A., Tsai M. J. (2000). Essential role of BETA2/NeuroD1 in development of the vestibular and auditory systems. Genes Dev. 14, 2839-2854 [DOI] [PMC free article] [PubMed] [Google Scholar]
- Liu H., Etter P., Hayes S., Jones I., Nelson B., Hartman B., Forrest D., Reh T. A. (2008). NeuroD1 regulates expression of thyroid hormone receptor 2 and cone opsins in the developing mouse retina. J. Neurosci. 28, 749-756 [DOI] [PMC free article] [PubMed] [Google Scholar]
- Livesey F. J., Cepko C. L. (2001). Vertebrate neural cell-fate determination: lessons from the retina. Nat. Rev. Neurosci. 2, 109-118 [DOI] [PubMed] [Google Scholar]
- Mao C. A., Kiyama T., Pan P., Furuta Y., Hadjantonakis A. K., Klein W. H. (2008a). Eomesodermin, a target gene of Pou4f2, is required for retinal ganglion cell and optic nerve development in the mouse. Development 135, 271-280 [DOI] [PMC free article] [PubMed] [Google Scholar]
- Mao C. A., Wang S. W., Pan P., Klein W. H. (2008b). Rewiring the retinal ganglion cell gene regulatory network: Neurod1 promotes retinal ganglion cell fate in the absence of Math5. Development 135, 3379-3388 [DOI] [PubMed] [Google Scholar]
- Moore K. B., Schneider M. L., Vetter M. L. (2002). Posttranslational mechanisms control the timing of bHLH function and regulate retinal cell fate. Neuron 34, 183-195 [DOI] [PubMed] [Google Scholar]
- Moshiri A., Gonzalez E., Tagawa K., Maeda H., Wang M., Frishman L. J., Wang S. W. (2008). Near complete loss of retinal ganglion cells in the math5/brn3b double knockout elicits severe reductions of other cell types during retinal development. Dev. Biol. 316, 214-227 [DOI] [PMC free article] [PubMed] [Google Scholar]
- Mu X., Fu X., Beremand P. D., Thomas T. L., Klein W. H. (2008). Gene regulation logic in retinal ganglion cell development: Isl1 defines a critical branch distinct from but overlapping with Pou4f2. Proc. Natl. Acad. Sci. USA 105, 6942-6947 [DOI] [PMC free article] [PubMed] [Google Scholar]
- Mullen A. C., Orlando D. A., Newman J. J., Lovén J., Kumar R. M., Bilodeau S., Reddy J., Guenther M. G., DeKoter R. P., Young R. A. (2011). Master transcription factors determine cell-type-specific responses to TGF-β signaling. Cell 147, 565-576 [DOI] [PMC free article] [PubMed] [Google Scholar]
- Ohsawa R., Kageyama R. (2008). Regulation of retinal cell fate specification by multiple transcription factors. Brain Res. 1192, 90-98 [DOI] [PubMed] [Google Scholar]
- Onishi A., Peng G. H., Chen S., Blackshaw S. (2010). Pias3-dependent SUMOylation controls mammalian cone photoreceptor differentiation. Nat. Neurosci. 13, 1059-1065 [DOI] [PMC free article] [PubMed] [Google Scholar]
- Oster S. F., Deiner M., Birgbauer E., Sretavan D. W. (2004). Ganglion cell axon pathfinding in the retina and optic nerve. Semin. Cell Dev. Biol. 15, 125-136 [DOI] [PubMed] [Google Scholar]
- Pennesi M. E., Cho J. H., Yang Z., Wu S. H., Zhang J., Wu S. M., Tsai M. J. (2003). BETA2/NeuroD1 null mice: a new model for transcription factor-dependent photoreceptor degeneration. J. Neurosci. 23, 453-461 [DOI] [PMC free article] [PubMed] [Google Scholar]
- Perron M., Harris W. A. (2000). Determination of vertebrate retinal progenitor cell fate by the Notch pathway and basic helix-loop-helix transcription factors. Cell. Mol. Life Sci. 57, 215-223 [DOI] [PMC free article] [PubMed] [Google Scholar]
- Prasov L., Nagy M., Rudolph D. D., Glaser T. (2012). Math5 (Atoh7) gene dosage limits retinal ganglion cell genesis. Neuroreport 23, 631-634 [DOI] [PMC free article] [PubMed] [Google Scholar]
- Püschel A. W., Betz H. (1995). Neurexins are differentially expressed in the embryonic nervous system of mice. J. Neurosci. 15, 2849-2856 [DOI] [PMC free article] [PubMed] [Google Scholar]
- Raper J., Mason C. (2010). Cellular strategies of axonal pathfinding. Cold Spring Harb. Perspect. Biol. 2, a001933 [DOI] [PMC free article] [PubMed] [Google Scholar]
- Robson J. G., Frishman L. J. (1995). Response linearity and kinetics of the cat retina: the bipolar cell component of the dark-adapted electroretinogram. Vis. Neurosci. 12, 837-850 [DOI] [PubMed] [Google Scholar]
- Robson J. G., Maeda H., Saszik S. M., Frishman L. J. (2004). In vivo studies of signaling in rod pathways of the mouse using the electroretinogram. Vision Res. 44, 3253-3268 [DOI] [PubMed] [Google Scholar]
- Rodieck R. W. (1998). The First Steps in Seeing. Sunderland, MA: Sinauer Associates; [Google Scholar]
- Roger J. E., Nellissery J., Kim D. S., Swaroop A. (2010). Sumoylation of bZIP transcription factor NRL modulates target gene expression during photoreceptor differentiation. J. Biol. Chem. 285, 25637-25644 [DOI] [PMC free article] [PubMed] [Google Scholar]
- Saszik S. M., Robson J. G., Frishman L. J. (2002). The scotopic threshold response of the dark-adapted electroretinogram of the mouse. J. Physiol. 543, 899-916 [DOI] [PMC free article] [PubMed] [Google Scholar]
- Trimarchi J. M., Stadler M. B., Cepko C. L. (2008). Individual retinal progenitor cells display extensive heterogeneity of gene expression. PLoS ONE 3, e1588 [DOI] [PMC free article] [PubMed] [Google Scholar]
- Trompouki E., Bowman T. V., Lawton L. N., Fan Z. P., Wu D. C., DiBiase A., Martin C. S., Cech J. N., Sessa A. K., Leblanc J. L., et al. (2011). Lineage regulators direct BMP and Wnt pathways to cell-specific programs during differentiation and regeneration. Cell 147, 577-589 [DOI] [PMC free article] [PubMed] [Google Scholar]
- Tsai W. W., Wang Z., Yiu T. T., Akdemir K. C., Xia W., Winter S., Tsai C. Y., Shi X., Schwarzer D., Plunkett W., et al. (2010). TRIM24 links a non-canonical histone signature to breast cancer. Nature 468, 927-932 [DOI] [PMC free article] [PubMed] [Google Scholar]
- Vetter M. L., Brown N. L. (2001). The role of basic helix-loop-helix genes in vertebrate retinogenesis. Semin. Cell Dev. Biol. 12, 491-498 [DOI] [PubMed] [Google Scholar]
- Visel A., Blow M. J., Li Z., Zhang T., Akiyama J. A., Holt A., Plajzer-Frick I., Shoukry M., Wright C., Chen F., et al. (2009). ChIP-seq accurately predicts tissue-specific activity of enhancers. Nature 457, 854-858 [DOI] [PMC free article] [PubMed] [Google Scholar]
- Wallace V. A. (2011). Making a retina – from the building blocks to clinical application. Stem Cells 29, 412-417 [DOI] [PubMed] [Google Scholar]
- Wang S. W., Kim B. S., Ding K., Wang H., Sun D., Johnson R. L., Klein W. H., Gan L. (2001). Requirement for math5 in the development of retinal ganglion cells. Genes Dev. 15, 24-29 [DOI] [PMC free article] [PubMed] [Google Scholar]
- Yang Z., Ding K., Pan L., Deng M., Gan L. (2003). Math5 determines the competence state of retinal ganglion cell progenitors. Dev. Biol. 264, 240-254 [DOI] [PubMed] [Google Scholar]
Associated Data
This section collects any data citations, data availability statements, or supplementary materials included in this article.